A Graphic is Worth a Thousand...
21
A Graphic is Worth a Thousand Words… Develop a Graphic Syllabus for Your Course
Transcript of A Graphic is Worth a Thousand...

���
A Graphic is Worth a Thousand Words… Develop a Graphic Syllabus for Your Course
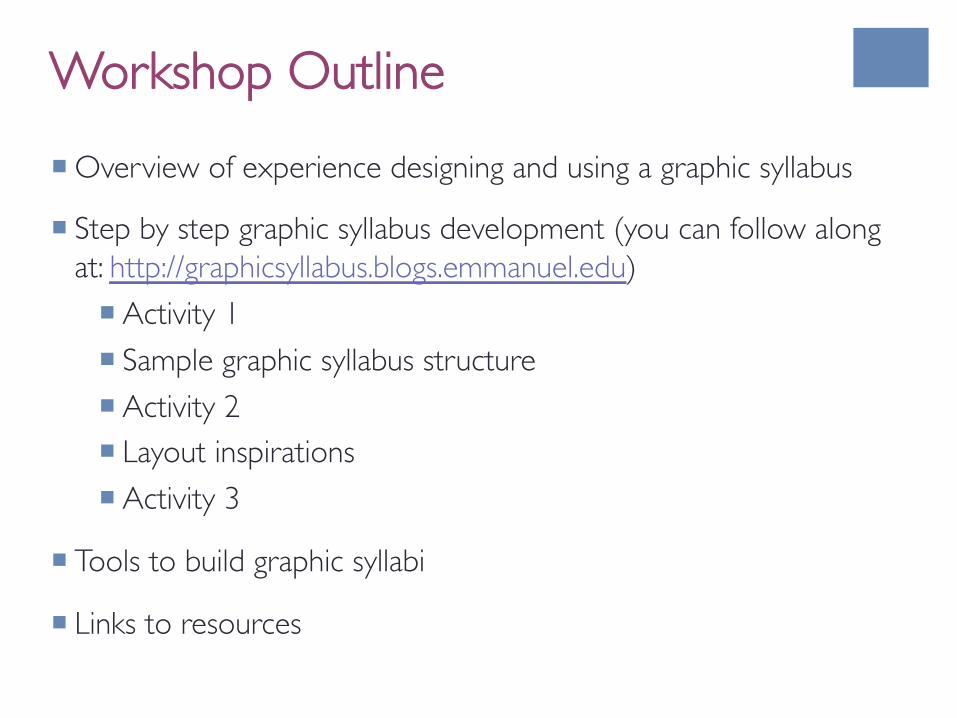
¡ Overview of experience designing and using a graphic syllabus
¡ Step by step graphic syllabus development (you can follow along at: http://graphicsyllabus.blogs.emmanuel.edu)
¡ Activity 1
¡ Sample graphic syllabus structure
¡ Activity 2 ¡ Layout inspirations
¡ Activity 3
¡ Tools to build graphic syllabi
¡ Links to resources
Workshop Outline

My Experience Designing a Graphic Syllabus & Course Map
It’s the journey AND the destination
It’s on the syllabus
It’s on the syllabus
It’s on the syllabus
It’s on the syllabus
It’s on the syllabus

An Introduction to the Graphic Syllabus ���
Presented by: Katherine Sauer
A graphic syllabus is a document that incorporates visual elements …into the communication of material found in a traditional syllabus. Special attention is placed on illustrating how the course content fits together…and on how the course learning activities directly link to the course learning objectives.
7th Annual Economics Teaching Conference in New Orleans, Gulf Coast Economic Association, 2011
Inspiration!

Like Katherine, I was left asking:
Is my syllabus the reason my students
don’t refer to my syllabus?

Process: ���What do I want students of Microeconomics to take away?
¡ Inspirations / Ideas
¡ Mankiw’s Ten Principles of Economics
¡ Eight Guideposts to Economic Thinking ¡ Gwartney et al. (1995)

¡ Boiled down to my five takeaways for Microeconomics
¡ How do I connect those to the syllabus? ¡ What are my overall intentions ¡ To achieve by those takeaways?
¡ To achieve those intentions through the course structure?
¡ How do I connect those visually?
Process: ���What do I want students of Microeconomics to take away?

¡ How do I connect those takeaways to the syllabus? ¡ How do the course requirements support those takeaways?
¡ Understanding vs. Application was in the old syllabus:
¡ Understanding of concepts: 70% of course grade
¡ Application of concepts: 30% of total grade
¡ How do I show that graphically ¡ Thinking about Bloom’s Taxonomy
¡ Connecting to development of learning ���across the semester
Process: Concepts Map���
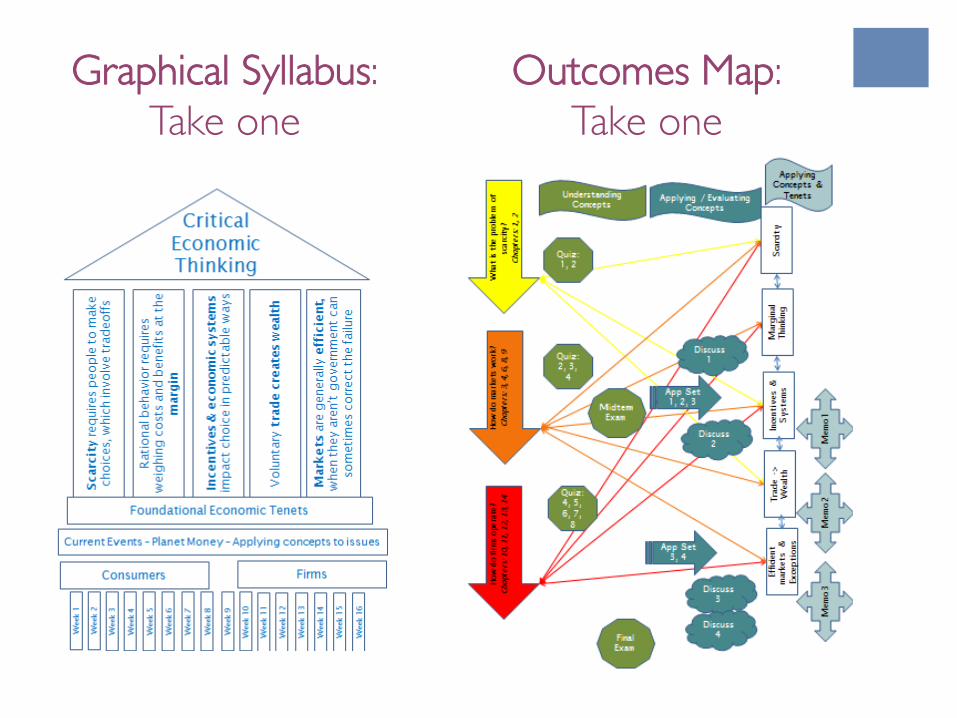
Graphical Syllabus: Take one
Outcomes Map: Take one

Review, Revise, Refine….

Process: Get Help
Bounce ideas: Do you see what I see?
“I’m tempted to write
explanations…”(naturally)
“What are those things with all the arrows supposed
to be?

Final Products:���Graphic Syllabus

Final Products:���Outcomes Map

¡ Great opportunity to reflect on the course ¡ particularly on core concepts,
¡ and how those thread across the semester.
¡ Assessment Shows: Student Understand Course ¡ Better
- 33% improvement ¡ the course objectives
¡ that the course is designed to facilitate their ���meeting those objectives
¡ Faster
- 40% improvement
.
Summary of the experience (so far…)
I think that the clarity of my teaching in this
course will be improved by the process required to develop these tools
for the students

Backward Design Begin with the end…
1. Identify Desired Results
2. Determine Acceptable Evidence
3. Plan Learning Experiences

Worth being familiar with
Important to know and do
Enduring understanding
covering
uncovering

Goals and Objectives
Goals
¡ Scope is broad
¡ General
¡ Abstract
¡ Longer time frame
Objectives
¡ Scope is narrow
¡ Precise
¡ Concrete
¡ Set for a short term
Example: By the end of the semester, students will be able to explain the concept of marginal thinking.
Example: Have fundamental knowledge of concepts and analytical tools within management, business, and economics.
Questions for Consideration
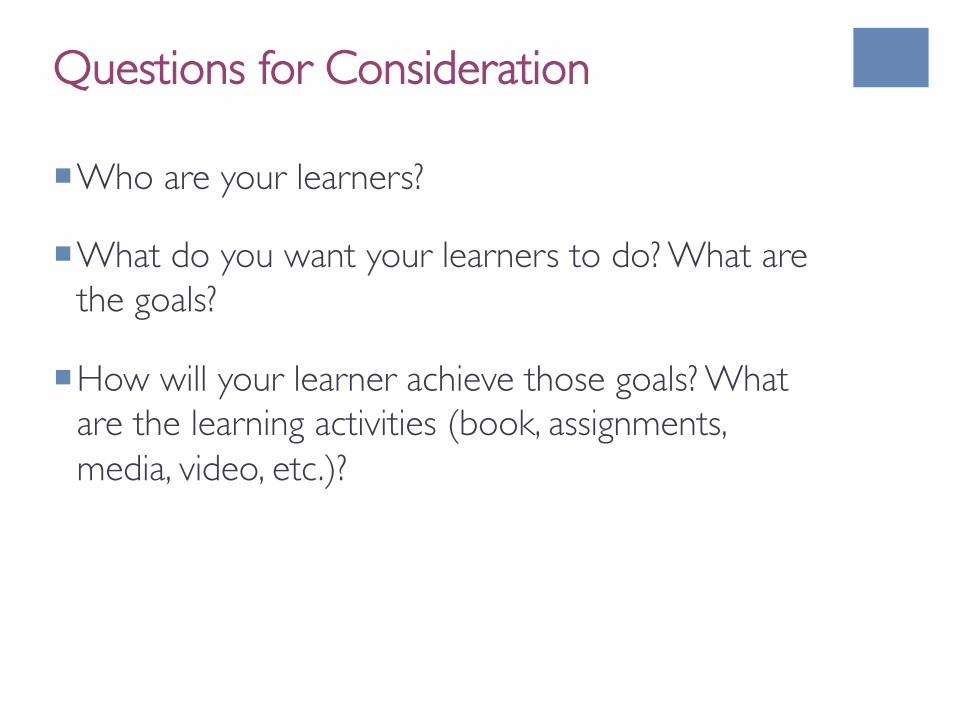
¡ Who are your learners?
¡ What do you want your learners to do? What are the goals?
¡ How will your learner achieve those goals? What are the learning activities (book, assignments, media, video, etc.)?

References
Nilson, Linda B. (2007). The Graphic Syllabus and the Outcomes Map: Communicating Your Course. San Francisco, CA: Jossey-Bass.
Wiggins, G. & McTighe, J.(2005). Understanding by Design, 2nd Ed. New Jersey: Pearson Education.

Questions & Comments

Sara Foy, EdM Senior Instructional Strategies Specialist Academic Technology & Innovation Group
Rebecca Moryl, PhD Assistant Professor of Economics Chair of Department of Management and Economics
Contact Information
http://graphicsyllabus.blogs.emmanuel.edu
atig.emmanuel.edu