a global EDGAR inventory of particulate elemental...
31
Report EUR 25789 EN Towards a global EDGAR‐inventory of particulate matter with focus on elemental carbon Andras Miklos Hajdu, Marilena Muntean, Greet Janssens-Maenhout 2013
Transcript of a global EDGAR inventory of particulate elemental...

Report EUR 25789 EN
Towards a global EDGAR‐inventory of particulate matter with focus on elemental carbon
Andras Miklos Hajdu, Marilena Muntean, Greet Janssens-Maenhout
2 0 1 3

European Commission Joint Research Centre Institute for Environment and Sustainability Contact information Greet Janssens-Maenhout Address: Joint Research Centre, Via Enrico Fermi 2749, TP 290, 21027 Ispra (VA), Italy E-mail: [email protected] Tel.: +39 0332 78 5831 Fax: +39 0332 78 5704 http://edgar.jrc.ec.europa.eu/index.php http://www.jrc.ec.europa.eu/ This publication is a Reference Report by the Joint Research Centre of the European Commission. Legal Notice Neither the European Commission nor any person acting on behalf of the Commission is responsible for the use which might be made of this publication. Europe Direct is a service to help you find answers to your questions about the European Union Freephone number (*): 00 800 6 7 8 9 10 11 (*) Certain mobile telephone operators do not allow access to 00 800 numbers or these calls may be billed.
A great deal of additional information on the European Union is available on the Internet. It can be accessed through the Europa server http://europa.eu/. JRC 78786 EUR 25789 EN ISBN 978-92-79-28290-4 (pdf) ISBN 978-92-79-28289-8 (CD-Rom) ISSN 1831-9424 (online) doi: 10.2788/81940 (online) Luxembourg: Publications Office of the European Union, 2013 © European Union, 2013 Reproduction is authorised provided the source is acknowledged.

Towards a global EDGAR-inventory of particulate matter with focus on elemental carbon
Andras Miklos Hjadu, Marilena Muntean, Greet Janssens-Maenhout
May 2012
Table of contents
Abstract
1. Definition of the particulate matter compounds
2. Available emission factor datasets
2.1 EMEP/EEA Dataset for PM
2.2 EU-27 Dataset of GAINS
2.3 USA Dataset (AP42) of Bond
2.4 China Dataset of Streets and Hao
3. Comparison of emissions resulting from each emission factor dataset
3.1 Description of the simulations
3.1.1 for PM
3.1.2 for BC/OC
3.2 Discussion of the differences in PM inventories
3.3 Discussion of the differences in BC inventories
4. Summary with global EDGAR-inventory
4.1 Concluding recommendations from the inter-comparison exercise for EDGAR
4.2 Description of the setup of the EDGAR-inventory
4.3 Results of the EDGAR-inventory
References
Annexes
Annex 1: coupling matrix AP42-EDGAR-GAINS
Annex 2: Emission factor overview table with AP42 and GAINS

Abstract
The Emissions Database for Global Atmospheric Research (EDGAR) provides technology based global anthropogenic emissions data of greenhouse gases and air pollutants by country and sector on a 0.1° x 0.1° spatial grid, on a timeline that ranges from 1970 to present days. As part of the constantly ongoing amendment and improvement of the database, a review of the available literature and emission inventory data has been conducted focusing on particulate emissions, with the aim of acquiring a comprehensive array of primary particle matter and carbonaceous particle emission factors (EF).
It was found, that emission factor data from different studies show large variation for a given fuel and technology. Furthermore it is plausible that a certain literature or measurement describes emission factors better in the region where it is originating from. With this in mind, a comparison has been made between the available emission factor datasets in a number of different regions, focusing on the power generation sector. The aim of this experiment is to select the most appropriate EF dataset for a given region.

1. Introduction
EDGAR provides a bottom up inventory of emissions that draws upon a number of input data sources, to calculate country, fuel and technology specific emissions. Data sources include international and national statistics (International Energy Agency for fuel share and activity data) other databases (Platts and Clean Coal for technology share) and scientific literature (for substance specific emission factors). Each data source contains and adds up to the uncertainty of the final calculated emission results, but there can be a particularly big variation between the emission factors implied by different literature.
In the process of acquiring new, additional particle matter and carbonaceous particle data for EDGAR, we sampled a number of literature tabulating emission factors for said compounds. From these sources EDGAR compatible datasets of PM10, black carbon and organic carbon emission factors were created. We then performed a comparison of these datasets, by calculating their respective emissions within the energy industry sector utilizing the same activity, technology and end-of-pipe data for each dataset, in order to verify the bottom-up emission calculation, to uncover the major differences & potential errors between EF datasets and to assist us in selecting the most appropriate EF dataset for a given region
2. Definition of discussed particulate matter compounds
Solid or liquid combustion products and airborne particles from anthropogenic activities or other sources form atmospheric particle matter (PM) that can be derived into multiple categories based on size, chemical composition or physical properties. The following section is to lay down a consistent terminology and define the particle matter compounds concerned within the scope of this paper.
Total Suspended Particles (TSP) comprises all airborne particles or aerosols.
PM10 is the fraction of PM/TSP with a mean particle diameter of 10microns or smaller.
PM2.5 is the fraction of PM/TSP with a mean particle diameter of 2.5microns or smaller. A significant fraction of PM consists of carbonaceous particles, that largely contain different types of carbon compounds. They can be found in high concentrations especially in the submicron size range. [Kupiainen and Klimont 2004, Bond et al. 2004] Carbonaceous particles are mostly produced during incomplete combustion, and transported in the atmosphere. Throughout their atmospheric lifetime such particles are subjected to a number of different processes (condensation, coagulation, surface reactions) evolving their physical and chemical properties. [Vignati et. al. 2010]. Following the common terminology of the literature used for this work, carbonaceous particles that absorb solar radiation, and thus have a positive climate forcing effect are referred to as black carbon (BC) within this document. It should be noted however, that in measurement and quantification terminology “black carbon” may refer to the fraction of the above mentioned light absorbing carbonaceous particles that can be measured using optical methods while elemental carbon (EC) refers to the fraction observed with thermo-optical (refractory) methods. [Vignati et. al. 2010, Bond et. al 2004]
Organic carbon is the carbonaceous aerosol fraction with high organic compound content that is not black carbon, and has negative climate forcing effect
.
3. Methodology
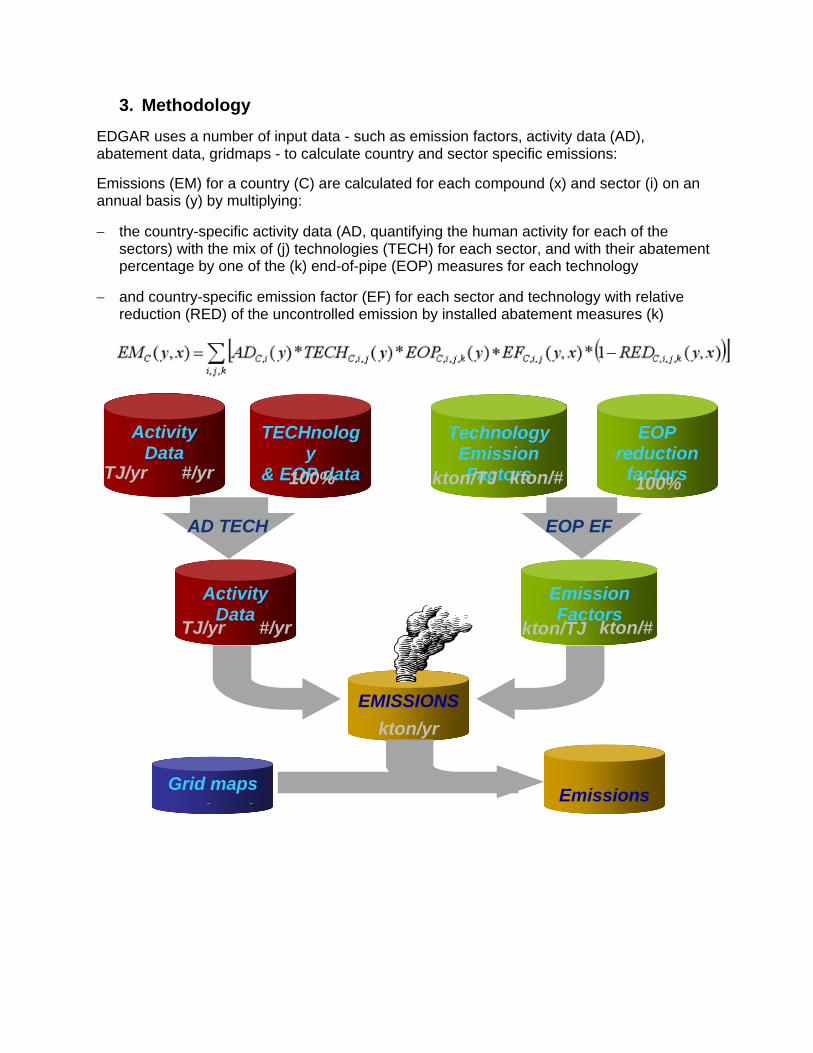
EDGAR uses a number of input data - such as emission factors, activity data (AD), abatement data, gridmaps - to calculate country and sector specific emissions:
Emissions (EM) for a country (C) are calculated for each compound (x) and sector (i) on an annual basis (y) by multiplying:
− the country-specific activity data (AD, quantifying the human activity for each of the sectors) with the mix of (j) technologies (TECH) for each sector, and with their abatement percentage by one of the (k) end-of-pipe (EOP) measures for each technology
− and country-specific emission factor (EF) for each sector and technology with relative reduction (RED) of the uncontrolled emission by installed abatement measures (k)
Activity Data
TECHnology
& EOP data
Activity Data
EMISSIONS
Emissions Grid maps
0 1° 0 1°
AD TECH
Technology Emission Factors
EOP reduction
factors
Emission Factors
EOP EF
kton/yr
100% 100% kton/TJ kton/#
TJ/yr #/yr kton/TJ kton/#
TJ/yr #/yr

4. Literature sources for emission factors
Multiple sources of particulate EF data are available from a number of scientific literature, studies, emission inventories and guide books. From these sources multiple EF datasets have been derived that can be used for emission calculation input. The following is a short summary of the datasets examined within this document.
EMEP/EEA Guidebook, 2009 The United Nations Economic Commission for Europe (UNECE) Convention on Long-range Transboundary Air Pollution and the EU National Emission Ceilings Directive set up the Guidelines for Reporting Emission Data. Following these guidelines, the joint EMEP/EEA air pollutant emission inventory guidebook has been issued to provide guidance to compiling emission inventories.
The Guidebook provides estimation methods and emission factors at various levels of sophistication, known as Tiers. Whenever applicable, technology-specific Tier2 EFs were used in the dataset. Where technology specific data was not applicable or was not necessary, general (only fuel-specific) Tier1 EF-s were taken into account. Each EF value associated with the IPCC Code (or UNFCCC’s Common Reporting Format) was matched with the appropriate EDGAR process codes to create the EF dataset. Values of PM10 and PM2.5 are available from this dataset.
GAINS
GHG-Air pollution INteractions and Synergies model was developed by Applied Systems Analysis (IIASA) as a tool for designing national and regional strategies that respond to global and long-term climate objectives. This EF dataset was assembled from the values provided by the GAINS-Europe model. It provides fuel-technology-country specific EFs as well as fuel-country specific ones.
Values of PM10, PM2.5, have been directly taken from the models database (Primes 2009 scenario for Germany), while, BC and OC EFs were calculated from TSP based on the fractions and method described in [Kupiainen and Klimont 2004]. Country specific EFs were used for European countries, while the rest of the world was assigned with the EFs of Spain, representing a generally higher rate of emissions.
Bond et al. 2004
The 2004 paper “A technology-based global inventory of black and organic carbon emissions from combustion” by T. Bond et. al. provides a comprehensive review of anthropogenic BC and OC emissions based on 1996 fuel consumption data.
With the methodology given in the paper, carbonaceous emission factors were calculated from the tabulated PM10 EFs using the given submicron and carbonaceous fractions data. PM10 emission factors of power and industry sectors were largely drawn from US EPA’s report number AP-42. EFs were converted from g/kg units to kg/TJ units, by using fuel calorific values from 2006 IPCC Guidelines for National Greenhouse Gas Inventories. The resulting emission factors are then associated with the appropriate EDGAR process codes depending on fuel and technology.

Lei et al. 2011
The study “Primary anthropogenic aerosol trends for China, 1990-2005” provides technology based emission data that largely draws on Chinese literature, which makes it a valuable source for acquiring country specific EFs. A set of fuel and technology specific PM emission factors is available from the paper, that is combined –in the case of the power sector- with the carbonaceous fractions used in [Bond et al 2004]. The actual EF dataset was created by taking the dataset based on Bond et al. 2004 and updating it with the available data from Lei et al. 2011.
EDGAR-HTAP
EDGAR-HTAP is not an emission factor dataset, but a compilation of different (official) emission inventories from EMEP, UNFCCC, EPA (USA), GAINS (China) and REAS, gap-filled with global emission data of EDGARv4.1 making it a harmonized global air pollution emission dataset for 2000 to 2005, providing PM10, PM2.5, BC and OC emission data. [Janssens-Maenhout et al. 2011]
Summary of data sources and dataset names Source Short name EDGAR dataset name (user) EDGAR-HTAP EDGAR-HTAP HTAP_V1(edgar_HTAP) Bond et al., 2004 BOND BOND_EM_ENE_17-04-2012(andras GAINS model, 2010 GAINS GAINS_EM_ENE_17-04-2012(andras) EMEP/EEA Guidebook, 2009 EMEP/EEA CORINAIR_PM10_EM_ENE_14-05-2012(andras) EMEP/EEA Guidebook, 2009 without including EDGAR EoP data in the calculation EMEP/EEA no EoP
CORINAIR_PM10_EM_NoEOP_14-05-2012(andras)

5. Comparison of emissions resulting from each emission factor dataset
3.1 Description of the comparison process
It is clear, that the EF datasets differ in their origin of data and the studies they rely on. This can have an effect on their regional applicability. E.g. a dataset acquired from European sources and factors, may not fit well with technological circumstances in China. For this reason a comparison has been made between the datasets to reveal these differences, and at the same time to point to any possible errors.
The same EDGAR technology activity dataset (v4.2_T_AD_emitting_final300911) and emission reductions dataset (v4.2_EOP) was applied to all the previously discussed EF datasets, and the resulting emission datasets (named after the EF dataset used for their calculation) were examined for Europe, USA, and China, concentrating on the power generation sector. The only exception is the EDGAR-HTAP emissions dataset that is not calculated by EDGAR, it is compiled from preexisting emission reports.
We chose the power generation as the subject of this experiment, because we have a good number of available EF datasets for this field, and have a more comprehensive and concise understanding of the technologies, abatements and trends of this sector, which makes the comparison of emission data more robust and representative.
3.1.1 PM10
Energy sector PM10 emissions (kton/year)
0
5000
10000
15000
20000
25000
30000
35000
1990
2000
2005
1990
2000
2005
1990
2000
2005
1990
2000
2005
1990
2000
2005
Rest of theworldChina
USA
EU-27
EDGAR-HTAP
Bond GAINSEDGAR
v4.2EMEP/EEA
no EoP
GAINS values are consequently higher then the rest of the datasets, probably due to the fact that EDGAR uses a less strong set of end of pipe reduction factor dataset, then GAINS

online. Using the same EF data of GAINS, our calculations are many factors higher then the online data of GAINS.
ENE PM10 emissions inEU-27 (kton/year)
0200400600800
100012001400
2000
2005
GAINS + EDGAR
GAINS online
PM10 - EU (kton/year)
0
2000
4000
6000
8000
10000
12000
1990
1991
1992
1993
1994
1995
1996
1997
1998
1999
2000
2001
2002
2003
2004
2005
EDGAR-HTAP
BOND
GAINS
EMEP/EEA
EMEP/EEA -NO-EoP
PM10 v4.2
GAINS online
Europe
In the case of EU-27 countries the EDGAR-HTAP dataset contains PM10 emission data that have been officially reported within the frame of the EMEP program by the nations that are parties to the LRTAP Convention. For this reason, these emissions may serve as a good point of reference in the comparison of different datasets.

One of the first issues to notice is that the emissions of the power sector calculated with the EMEP/EEA EF dataset are multiple factors lower compared to other scenarios, which leads to the assumption that the EFs provided by EMEP/EEA guidebook are already abated values. No written reference was found in the EMEP/EEA guidebook to verify this, but through personal communication with Visschedijk we could confirm it. Thus in the process of emission calculation, applying EDGAR’s own end of pipe data to these abated EMEP/EEA EF values results in abnormally low emission figures.
For this reason a separate emission factor dataset was created using the same EMEP/EEA EFs, but leaving out the step of applying EDGAR’s end of pipe data (or more precisely: using an EoP dataset that assumes 0 reduction for all abatement technologies). The thus calculated emissions show good agreement with EDGAR-HTAP, but the trend lacks the influence of the abatement technology implementation taking place over time. For this reason, it is advisable to only use the EMEP/EEA-NO-EoP dataset for assessing post 2000 emissions
The BOND dataset produces 40% lower emissions compared to EDGAR-HTAP, while GAINS goes more than 50% over the country report based HTAP emissions data. As a result of abatement technology penetration in the power sector, both cases show a steadily declining trend, that stabilizes around the year 2000.
USA
PM10 - USA (kton/year)
0
500
1000
1500
2000
2500
3000
3500
1990 1991 1992 1993 1994 1995 1996 1997 1998 1999 2000 2001 2002 2003 2004 2005
EDGAR-HTAP
BOND
GAINS (Esp)
EMEP/EEA
EMEP/EEA-NO-EoP
PM10 v4.2
US EPA
For USA, the EDGAR-HTAP dataset uses US EPA PM10 emission data. Additionally, PM10 data available from the EPA website (http://www.epa.gov/ttn/chief/trends/index.html) have also been tabulated (US EPA trend line). The sudden increase in emissions from 1999 is due to a change in methodology, namely the inclusion of condensable particulate matter in the inventory.

The EMEP/EEA dataset continues to provide low emissions, which the corrected EMEP/EEA-NO-EoP dataset counterweights, but again does not represent the trends of abatement measure penetration
The GAINS EF dataset associated the higher Spanish figures with this region, and this results in higher emission, that reaches the upper uncertainty range of the US EPA data only at the end of the time scale (assuming an uncertainty factor of 2).
The EDGAR-HTAP and BOND datasets show excellent agreement, most probably due to the fact that Bond relied mainly on the EPA’s PM10 emission factors.
China
PM10 - China (kton/year)
0
1000
2000
3000
4000
5000
6000
7000
1990
1991
1992
1993
1994
1995
1996
1997
1998
1999
2000
2001
2002
2003
2004
2005
EDGAR-HTAP
BOND
GAINS (Esp)
EMEP/EEA
EMEP/EEA-NO-EoP
Lei 2011-tabulated
Lei 2011-calculated
PM10 v4.2
GAINS online
The 2011 work of Lei et al. provides a good point of reference, since it tabulates PM10 emission factors that are specific for the power sector of China. Namely the factors of pulverized and grate fired coal combustion were derived from Zhang et al., and these

emission factors are 2-3 times higher than the values provided by the BOND or EMEP/EEA datasets. (Fuel oil and natural gas EF values in Lei et al. 2011. were taken from US EPA.) Using these factors we calculated the Lei 2011-calculated EM dataset, and at the same time included in the comparison the power sector emission values that Lei et al. 2011. provides (Lei 2011-tabulated) for 1990, 1995, 2000 and 2005 (i.e. these figures have been calculated by Lei et al. with their own activity and EoP data).
It’s notable that Lei 2011-tabulated shows good agreement with the EDGAR-HTAP values, which in turn have been derived from GAINS China emission data [Janssens-Maenhout et al. 2011]. The significant difference between the Lei calculated and tabulated datasets derive from the significantly differing activity, technology and abatement data used.
The GAINS dataset – utilizing Spanish emission factors also in the case of China – continues to give high emissions, while BOND values also remain consequently moderate compared to EDGAR-HTAP and Lei 2011-tabulated values.
It should also be noted, that this time EMAP/EEA-no-EoP emissions don’t surpass the BOND values as they consequently did in the case of Europe and USA.
World
PM10 - World (kton/year)
0
5000
10000
15000
20000
25000
30000
35000
1990
1991
1992
1993
1994
1995
1996
1997
1998
1999
2000
2001
2002
2003
2004
2005
EDGAR-HTAPBONDGAINSEMEP/EEAEMEP/EEA-NO-EoPPM10 v4.2

3.1.2 BC
BC (kton/year)
0
10
20
30
40
50
60
1990
2000
2005
1990
2000
2005
1990
2000
2005
Rest of theworldChina
USA
EU-27

BC - EU (kton/year)
0
0.5
1
1.5
2
2.5
3
3.5
4
1990
1991
1992
1993
1994
1995
1996
1997
1998
1999
2000
2001
2002
2003
2004
2005
EDGAR-HTAP
BOND
GAINS
EDGAR-HTAP carbonaceous emissions for Europe and USA were gapfilled from EDGAR v4.1, thus they should be considered preliminary data. For China, GAINS data was used in the HTAP dataset.
GAINS, BOND datasets however show good agreement for the EU-27, but show bigger differences in the USA.

BC - USA (kton/year)
0
0.5
1
1.5
2
2.5
3
3.5
4
4.5
1990
1991
1992
1993
1994
1995
1996
1997
1998
1999
2000
2001
2002
2003
2004
2005
EDGAR-HTAP
BOND
GAINS (Esp)
In China the tabulated Lei et al. 2011. values are too coarse to be used as reference (rounded up to a single value), instead, EDGAR-HTAP values supply regional data from the GAIN China model.
BC - China (kton/year)
0
2
4
6
8
10
12
14
16
18
20
1990 1991 1992 1993 1994 1995 1996 1997 1998 1999 2000 2001 2002 2003 2004 2005
EDGAR-HTAP
BOND
GAINS (Esp)
Lei 2011-tabulated
Lei 2011-calculated
Ohara
Cao et al.
The Lei 2011-calculated BC emissions consequently scale above the trend lines of the EMEP/EEA and BOND datasets. Controversially EMEP/EEA-no-EoP emissions turn out lower then the ones calculated with emission reduction data.
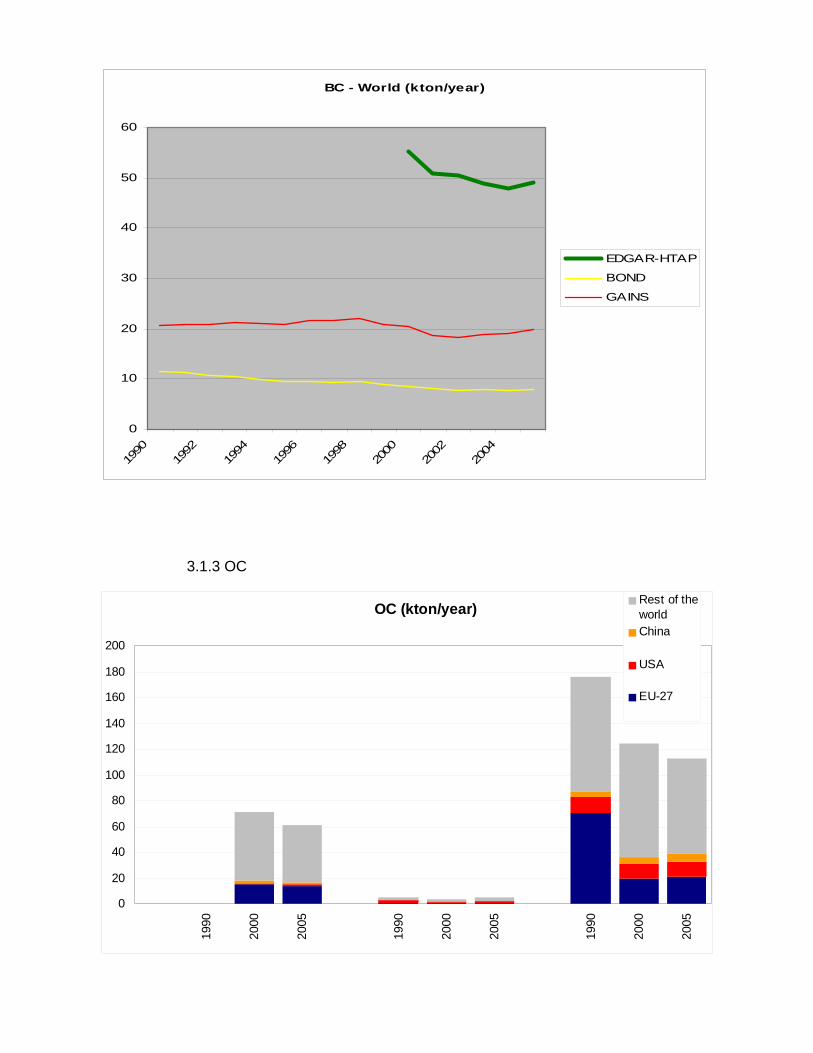
BC - World (kton/year)
0
10
20
30
40
50
60
1990
1992
1994
1996
1998
2000
2002
2004
EDGAR-HTAP
BOND
GAINS
3.1.3 OC
OC (kton/year)
0
20
40
60
80
100
120
140
160
180
200
1990
2000
2005
1990
2000
2005
1990
2000
2005
Rest of theworldChina
USA
EU-27

OC emissions from BOND virtually exclude themselves from the comparison, since much of the coal combustion related OC emission factors (namely pulverized coal) are considered to be 0 according to Bond et al. 2004, and this leads to miniscule emission rates.
OC - EU (kton/year)
0
10
20
30
40
50
60
70
80
1990 1991 1992 1993 1994 1995 1996 1997 1998 1999 2000 2001 2002 2003 2004 2005
EDGAR-HTAP
BOND
GAINS
OC - USA (kton/year)
0
2
4
6
8
10
12
14
1990
1991
1992
1993
1994
1995
1996
1997
1998
1999
2000
2001
2002
2003
2004
2005
EDGAR-HTAP
BOND
GAINS (Esp)

OC - China (kton/year)
0
2
4
6
8
10
12
1990
1991
1992
1993
1994
1995
1996
1997
1998
1999
2000
2001
2002
2003
2004
2005
EDGAR-HTAP
BOND
GAINS (Esp)
Lei 2011-tabulated
Lei 2011-calculated
Ohara
Cao et al.
OC - World (kton/year)
0
20
40
60
80
100
120
140
160
180
200
EDGAR-HTAP
BOND
GAINS
3.2 Discussion of the differences in PM inventories

Carbonaceous ratios over PM10 - averages
0.00%
0.50%
1.00%
1.50%
2.00%
2.50%
HTAPBOND
GAINS
HTAPBOND
GAINS
HTAPBOND
GAINS
HTAPBOND
GAINS
OC/PM
BC/PM
EU-27 USA China World
BOND: Because PM10 emission factors of the power sector were largely drawn from US EPA’s AP-42 report, this dataset shows good agreement with EDGAR-HTAP in the US and lies also closest to the inventory values of the US EPA. Thus this dataset is a good choice for describing USA power sector emissions for PM10.

References Andreae, M. O. and Merlet., P.: Emission of trace gases and aerosols from biomass burning, Global Biogeochem. Cy., 15,955–966, 2001.
Andreae, M. O. and Gelencs´er, A.: Black carbon or brown carbon?The nature of light-absorbing carbonaceous aerosols, Atmos.Chem. Phys., 6, 3131–3148, 2006,http://www.atmos-chem-phys.net/6/3131/2006/.
Bond, T. C., Streets, D. G., Yarber, K. F., Nelson, S. M., Woo, J.H., and Klimont, Z.: A technology-based global inventory ofblack and organic carbon emissions from combustion, J. Geophys.Res.-Atmos., 109, D14203, doi:10.1029/2003JD003697,2004.
Bond, T. C. and Bergstrom, R. W.: Light absorption by carbonaceous particles: An investigative review, Aerosol Sci. Tech., 40,1-41, 2006.
Chung, S. H. and Seinfeld, J. H.: Global distribution and climate forcing of carbonaceous aerosols, J. Geophys. Res., 107(D19), 4407, doi:10.1029/2001JD001397, 2002.
Cofala, J., Amann, M., Klimont, Z., Kupiainen, K., and H¨oglund-Isaksson, L.: Scenarios of global anthropogenic emissions of air pollutants and methane until 2030, Atmos. Environ., 41, 8486–8499, 2007
Dentener, F., Kinne, S., Bond, T., Boucher, O., Cofala, J., Generoso,S., Ginoux, P., Gong, S., Hoelzemann, J. J., Ito, A., Marelli, L.,Penner, J. E., Putaud, J.-P., Textor, C., Schulz, M., van der Werf,G. R., and Wilson, J.: Emissions of primary aerosol and precursor gases in the years 2000 and 1750 prescribed data-sets for AeroCom, Atmos. Chem. Phys., 6, 4321–4344, 2006,http://www.atmos-chem-phys.net/6/4321/2006/.
Echalar, F., Artaxo, P., Martins, J. V., Yamasoe, M., Gerab, F.,Maenhaut, W., and Holben, B.: Long-term monitoring of atmospheric aerosols in the amazon basin: Source identification and apportionment, J. Geophys. Res.-Atmos., 103, 31849–31864, 1998.
Guillaume, B., Liousse, C., Rosset, R., Cachier, H., Van Velthoven,P., Bessagnet, B., and Poisson, N.: ORISAM-TM4: A new global sectional multi-component aerosol model including SOA formation - Focus on carbonaceous BC and OC aerosols, Tellus B, 59, 283–302, 2007.
IPCC: The Physical Science Basis, in: Contribution of Working Group I ot the Fourth Assessment Report of the Intergovernmental Panel on Climate Change, ISBN 978 0521 88009-1 Hardback; 978 0521 70596-7 Paperback, 2007.
Jacobson, M. Z.: Global direct radiative forcing due to multicomponent anthropogenic and natural aerosols, J. Geophys. Res.-Atmos., 106, 1551–1568, 2001.
Jacobson, M. Z.: Control of fossil-fuel particulate black carbon and organic matter, possibly the most effective method of slowing global warming, J. Geophys. Res.-Atmos., 107(D19), 4410,doi:10.1029/2001JD001376, 2002.
Junker, C. and Liousse, C.: A global emission inventory of carbonaceous aerosol from historic records of fossil fuel and biofuel consumption for the period 1860-1997, Atmos. Chem. Phys., 8, 1195–1207, 2008, http://www.atmos-chem-phys.net/8/1195/2008/.
Koch, D., Bond, T. C., Streets, D., Unger, N., and van der Werf, G. R.: Global impacts of aerosols from particular source regions and sectors, J. Geophys. Res.-Atmos., 112, D02205, doi:10.1029/2005JD007024, 2007.

Matsumoto, K., Uematsu, M., Hayano, T., Yoshioka, K., Tanimoto, H., and Iida, T.: Simultaneous measurements of particulate elemental carbon on the ground observation network over the western North Pacific during the ACE-Asia campaign, J. Geophys. Res.-Atmos., 108(D23), 8635, doi:10.1029/2002JD002744, 2003.
Penner, J. E., Eddleman, H., and Novakov, T.: Towards the development of a global inventory for black carbon emissions, Atmos.Environ. A-Gen, 27, 1277–1295, 1993.
Schaap, M., Denier Van Der Gon, H. A. C., Dentener, F. J., Visschedijk,A. J. H., Van Loon, M., ten Brink, H. M., Putaud, J. P.,Guillaume, B., Liousse, C., and Builtjes, P. J. H.: Anthropogenic black carbon and fine aerosol distribution over Europe, J. Geophys. Res.-Atmos., 109, D18207, doi:10.1029/2003JD004330, 2004.

Annex 1. Details for the Bond 2004 EF dataset
1. Power sector relevant technologies:
Technology definitions Reference/ chapter
Associated EDGAR
technology
stoker
Stokers, coal beds - coal is burned on grates, with various feeding and airflow mechanisms, not used for modern powerplants, but still employed in smaller applications, and developing coutries 5.2.2 GF0
traditional
Large stoker boilers for building heat, common in Europe 5.6.2 Bark and wood boilers for process heat and power industry 5.6.2 PD0 Large industrial traditional ovens in developing countries for example drying and processing food 5.62
cyclone Cyclone furnaces, fuel particles are suspended in the oxidizer 5.2.1
pulverized Pulverized coal furnace , fuel particles are suspended in the oxidizer 5.2.1 PD0
all (heavy fuel oil)
Residual fuel oil, termed ‘heavy fuel oil,’’ is burned in external combustion devices such as furnaces and boilers. 5.5 BO0, GT0, IC0
industry/power
Middle distillates are burned in external combustion devices such as furnaces and boilers. 5.5 GT0, IC0
generator
Middle distillates can also be used for small-scale heat or electricity production in stationary internal combustion generators - fine fraction and speciation data are taken from diesel automobiles 5.5
external combustion
Middle distillates are burned in external combustion devices such as furnaces and boilers. 5.5 BO0
all (solid waste)
No size-resolved data; used fraction of total filterable PM from stokers, which is the most similar combustion.
5.7, table 5. footnote PD0,GF0
all (natural gas) 5.5 BO0, GT0, IC0
• For GT0 and IC0 the Bond emission factors of “industry/power-middle distillates” were used instead of the “generator-middle distillates”, because generator emission values did not resemble the power industry related values of CORINAIR or GAINS (Bond values are probably for small scale/commercial/industrial/residential).
• Updated EF PM and fraction values were used for “stoker-hard coal” from Bond 2007.

•
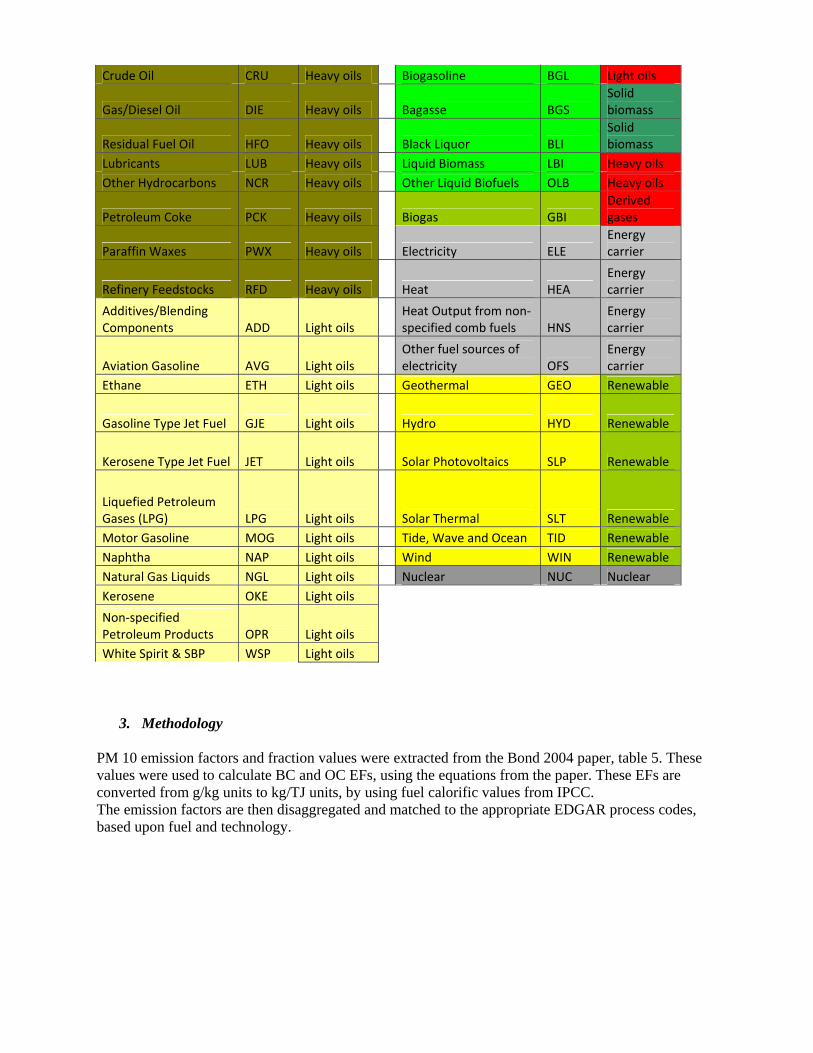
2. Fuels: In comparison with the original EDGAR fuel classification, for compatibility reasons the following modifications were applied:
• Peat is considered as “Bond - brown coal” • Bagasse and Black Liquor are considered to be solid biomass • Biodiesel and biogasoline are considered as “Bond - light oils” • Liquid biomass and Other liquid biofuels are classified as “Bond - heavy fuel oils” • All gaseous fuels are classified as “Bond natural gas”.
Name Code group Name Code group
Anthracite ANT Hard coal Natural Gas NGS Natural Gas
Other Bituminous Coal BTC Hard coal Blast Furnace Gas BFG Natural Gas
Coking Coal CKC Hard coal Gas Works Gas GGS Natural Gas
Coal Tar CLT Hard coal
Elec/Heat Output from Non‐spec. Manuf. Gases MNG Natural Gas
Gas Coke GCK Hard coal Coke Oven Gas OGS Natural Gas
Hard Coal (if no detail) HDC Hard coal Refinery Gas RGS Natural Gas
Coke Oven Coke OCK Hard coal Oxygen Steel Furnace Gas SGS Natural Gas
Patent Fuel PAT Hard coal Charcoal CHA Solid biomass
Sub‐Bituminous Coal SBC Hard coal Dung DNG Solid biomass
BKB/Peat Briquettes BKB BKB Industrial Waste IWS Solid biomass
Brown Coal (if no detail) BRC Brown coal
Municipal Waste (Renew) MWR
Solid biomass
Lignite/Brown Coal LGN Brown coal
Non‐specified Combust. Renewables + Wastes NSF
Solid biomass
Peat PEA Brown coal Primary Solid Biomass (non‐specified) SBI
Solid biomass
Municipal Waste (Non‐Renew) MWN Solid waste Vegetal waste VWS
Solid biomass
Bitumen BIT Heavy oils Wood WOD Solid biomass
Crude/NGL/Feedstocks (if no detail) CNF Heavy oils Biodiesel BDS Light oils
Crude Oil CRU Heavy oils Biogasoline BGL Light oils
Gas/Diesel Oil DIE Heavy oils Bagasse BGS Solid biomass
Residual Fuel Oil HFO Heavy oils Black Liquor BLI Solid biomass
Lubricants LUB Heavy oils Liquid Biomass LBI Heavy oils Other Hydrocarbons NCR Heavy oils Other Liquid Biofuels OLB Heavy oils
Petroleum Coke PCK Heavy oils Biogas GBI Derived gases
Paraffin Waxes PWX Heavy oils Electricity ELE Energy carrier
Refinery Feedstocks RFD Heavy oils Heat HEA Energy carrier
Additives/Blending Components ADD Light oils
Heat Output from non‐specified comb fuels HNS
Energy carrier
Aviation Gasoline AVG Light oils Other fuel sources of electricity OFS
Energy carrier
Ethane ETH Light oils Geothermal GEO Renewable
Gasoline Type Jet Fuel GJE Light oils Hydro HYD Renewable
Kerosene Type Jet Fuel JET Light oils Solar Photovoltaics SLP Renewable
Liquefied Petroleum Gases (LPG) LPG Light oils Solar Thermal SLT Renewable Motor Gasoline MOG Light oils Tide, Wave and Ocean TID Renewable Naphtha NAP Light oils Wind WIN Renewable Natural Gas Liquids NGL Light oils Nuclear NUC Nuclear Kerosene OKE Light oils Non‐specified Petroleum Products OPR Light oils White Spirit & SBP WSP Light oils
3. Methodology PM 10 emission factors and fraction values were extracted from the Bond 2004 paper, table 5. These values were used to calculate BC and OC EFs, using the equations from the paper. These EFs are converted from g/kg units to kg/TJ units, by using fuel calorific values from IPCC. The emission factors are then disaggregated and matched to the appropriate EDGAR process codes, based upon fuel and technology.

GAINS dataset summary
GAINS ‐ calculated EU 27 GAINS ‐ Report
Fuel Tech TSP PM1 BC OC [kg/Tj] PM1 BC OC BC/OC
GAS AVERAGE 0.100 0.100 0.007 0.075 0.100 0.007 0.075 0.093333
LF AVERAGE 2.022 0.202 0.101 0.016 MLT higher values 0.22‐0.36 0.11‐0.18 0.018‐0.029 6.25
HF AVERAGE 20.700 8.280 0.890 0.393 MLT and GRC higher values 6.9‐7.8 0.74‐0.84 0.33‐0.37 2.263158
BKB AVERAGE 228.599 11.430 0.076 1.257 I used the % in TSP from brown coal 0.060606
brown coal AVERAGE FB0 16854.456 842.723 0.000 105.340 data from PD0 0
brown coal AVERAGE GF0 7490.869 374.543 7.491 29.963 40‐400 4.5 18.0 0.25
brown coal AVERAGE PD0 15993.988 799.699 0.000 99.962 150‐1250 0.0 100.0 0
hard coal AVERAGE FB0 7017.512 56.140 3.656 0.702 20‐100 4.0 1.0 5.21
hard coal AVERAGE GF0 3124.381 156.219 9.373 4.687 40‐200 6.0 3.0 2
hard coal AVERAGE PD0 6428.749 128.575 2.025 2.764 large dif. among countries 50‐200 2.0 3.0 0.732558
solid biomass1 ‐ OS1 AVERAGE FB0 238.444 11.922 1.192 1.192 12.0 1.2 1.2 1
solid biomass1 ‐ OS1 AVERAGE GF0 238.444 119.222 9.538 14.307 120.0 9.6 14.4 0.666667
solid biomass1 ‐ OS1 AVERAGE PD0 238.250 11.913 1.191 1.191 data from FB0 1
solid biomass2 ‐ OS2 AVERAGE FB0 142 7.1 0.71 0.71 1
solid biomass2 ‐ OS2 AVERAGE GF0 142 71 5.68 8.52 0.666667
solid biomass2 ‐ OS2 AVERAGE PD0 142 7.1 0.71 0.71 data from FB0 1
OS1 CHA OS2 DNG HF LBI
SBI IWS OLB
WOD MWR
NSF
VWS
BGS
BLI
OS2, FIN, EF was corrected (from 2620 to 142 as all the countries)

Bond dataset summary Technology Average values kg/Tj data sourceFuel Bond EDGAR PM10 BC OC PM10 BC, OC GAS all 0.04 0.00 0.02 LF external comb. 5.64 1.47 0.66 ind/power GT0/IC0 11.06 0.59 0.18 HF all 26.00 0.94 0.35 BKB grate firing GF0 120.77 0.30 0.60
pulverized PD0 120.77 1.18 0.00
GF0 EF for all BKB the technologies
bond brown coal pd0
FB0 120.77 1.18 0.00
GF0 EF for all BKB the technologies
bond brown coal pd0
brown coal FB0 2436.97 1.18 0.00 PM10:bond pd0
BC, OC: Bond PD0 brown
brown coal grate firing GF0 1428.57 7.86 103.70 brown coal pulverized PD0 2436.97 1.18 0.00
hard coal FB0 449.44 0.22 0.00 PM10: bond pd0 BC, OC: bond pd0
hard coal grate firing GF0 176.03 7.04 1.76
Updated rfom (Bond 2007)
Updated rfom (Bond 2007)
hard coal pulverized PD0 449.44 0.22 0.00
solid biomass1 - OS1 FB0 189.66
2.8211.54
PM10: bond gf0
BC, OC: Bond table 9-10 power sector wood
solid biomass1 - OS1 grate firing GF0 189.66 8.16 32.62
solid biomass1 - OS1 pulverized PD0 189.66
2.8211.54
PM10: bond gf0
BC, OC: Bond table 9-10 power sector wood
waste FB0 1086.21 0.19 0.01 waste grate firing GF0 1086.21 0.19 0.01 waste pulverized PD0 1086.21 0.19 0.01 removed: VGS BLI CHA DNG VWS WOD


European Commission EUR 25789 – Joint Research Centre – Institute for Environment and Sustainability Title: Towards a global EDGAR‐inventory of particulate matter with focus on elemental carbon Author(s): Andras Miklos Hajdu, Marilena Muntean, Greet Janssens-Maenhout Luxembourg: Publications Office of the European Union 2013 – 30 pp. – 21.0 x 29.7 cm EUR – Scientific and Technical Research series – ISSN 1831-9424 (online) ISBN 978-92-79-28290-4 (pdf) ISBN 978-92-79-28289-8 (CD-Rom) doi: 10.2788/81940 (online) Abstract The Emissions Database for Global Atmospheric Research (EDGAR) provides technology based global anthropogenic emissions data of greenhouse gases and air pollutants by country and sector on a 0.1° x 0.1° spatial grid, on a timelinethat ranges from 1970 to present days. As part of the constantly ongoing amendment and improvement of thedatabase, a review of the available literature and emission inventory data has been conducted focusing on particulateemissions, with the aim of acquiring a comprehensive array of primary particle matter and carbonaceous particleemission factors (EF). It was found, that emission factor data from different studies show large variation for a given fuel and technology.Furthermore it is plausible that a certain literature or measurement describes emission factors better in the region whereit is originating from. With this in mind, a comparison has been made between the available emission factor datasets ina number of different regions, focusing on the power generation sector. The aim of this experiment is to select the mostappropriate EF dataset for a given region.

z
As the Commission’s in-house science service, the Joint Research Centre’s mission is to provideEU policies with independent, evidence-based scientific and technical support throughout the whole policy cycle. Working in close cooperation with policy Directorates-General, the JRC addresses key societal challenges while stimulating innovation through developing new standards, methods and tools,and sharing and transferring its know-how to the Member States and international community. Key policy areas include: environment and climate change; energy and transport; agricultureand food security; health and consumer protection; information society and digital agenda;safety and security including nuclear; all supported through a cross-cutting and multi-disciplinary approach.�
LB-NA-25789-EN
-N