A GIS BASED STUDY OF WIRELESS BROADBAND INTERNET MARKET POTENTIAL FOR … · 2005-09-15 · uhf...
17
UHF BROADBAND STUDY - 1 - DANIEL COSSETTE A GIS BASED STUDY OF WIRELESS BROADBAND INTERNET MARKET POTENTIAL FOR THE CANADIAN POPULATION WiMax (802.16) Presented to by DANIEL COSSETTE 20 APRIL 2004
Transcript of A GIS BASED STUDY OF WIRELESS BROADBAND INTERNET MARKET POTENTIAL FOR … · 2005-09-15 · uhf...

UHF BROADBAND STUDY
- 1 -
DANIEL COSSETTE
A GIS BASED STUDY OF WIRELESS BROADBAND INTERNET MARKET POTENTIAL
FOR THE CANADIAN POPULATION
WiMax (802.16)
Presented to
by DANIEL COSSETTE
20 APRIL 2004

UHF BROADBAND STUDY
- 2 -
DANIEL COSSETTE
TABLE OF CONTENTS
PREFACE....................................................................................................................................... 3
BACKGROUND ............................................................................................................................ 4
POTENTIAL SOLUTION.............................................................................................................. 5
OBJECTIVE ................................................................................................................................... 6
DEFINITIONS / ABBREVIATIONS ............................................................................................ 6
MINIMUM SUSTAINABLE SIZE................................................................................................ 7
DATA UTILIZED / DATA PREPERATION................................................................................ 7
ANALYSIS................................................................................................................................... 12
RESULTS ..................................................................................................................................... 15
DISCUSSION............................................................................................................................... 17
CONCLUSION............................................................................................................................. 17
FIGURES
FIGURE 1. IEEE WIRELESS INTEROPERABILITY STANDARDS FOR BROADBAND
ACCESS ................................................................................................................................. 5 FIGURE 2. ENUMERATION AREAS .......................................................................................... 8 FIGURE 3. METHODOLOGY FOR DATA PREPERATION .................................................... 10 FIGURE 4. POPULATION DENSITY OF CANADA................................................................. 11 FIGURE 5. FOCAL POPULATION COUNT FOR 15 KILOMETERS ANALYSIS.................. 14 FIGURE 6. FINAL MAP FOR THE 15 KILOMETER ANALYSIS............................................ 14 FIGURE 7. PROVINCIAL BREAKDOWN OF RESULTS FOR VARIOUS RADIUSES......... 15 FIGURE 8. RESULTANT MAP DISPLAYING COVERAGE AREA........................................ 16
TABLES
TABLE 1. GENERAL CALCULATIONS OF THE PAYBACK PERIOD FOR CONSTRUCTION OF A UHF WIRELESS TOWER............................................................ 7
TABLE 2. DATA USED FOR THE STUDY. ................................................................................ 8 TABLE 3. PROVINCIAL RESULTS OF THE NUMBER OF PERSONS THAT COULD BE
SERVED BY VARIOUS WIRELESS TOWERS. ............................................................... 15

UHF BROADBAND STUDY
- 3 -
DANIEL COSSETTE
PREFACE
This project was completed as part of my graduate research into broadband wireless communications in Canada. Initial work on the approach and questions herein was completed in cooperation with Industry Canada, the Communications Research Center, IceBridge Consulting Inc, and the University of Ottawa (Prof. M. Sawada) in 2002.
The question of market potential for new and emerging wireless technologies can only be addressed utilizing a spatial approach. A spatial approach is necessary because the economic viability of any wireless business endeavour depends on the ability of a given technology to reach a critical number of paying subscribers in space (e.g., those living in proximity to a communications tower). In Canada, where almost 20% of the population lives in rural and remote regions, spatially, people can be rather widely spread-out on the landscape. As such, certain broadband wireless technologies, like one that can only service a radius of only 5 km, would not reach enough people to make an economically viable business case for a potential service provider. In other words, in such a case, the costs of construction and maintenance of a tower would not be repaid over the life of the infrastructure. However, at the same time, if there are enough potential customers within 45 km, then a technology that could service these people (given the same costs of construction and maintenance) would be profitable to a business and would not have to be subsidised either by taxation relief or direct transfers from local/regional/national governments.
Ultimately it is the spatial configuration of this population (and associated socio-economic characteristics) within these regions that determine the profitability of a given broadband solution. By studying the market potential for different broadband wireless technologies though a spatial approach we can contribute to understanding of:
1. Which of the existing broadband wireless technologies existing today could be profitably operated in rural and remote regions.
2. Which potential technologies would provide profitable business cases in Canada. Therein, this contributes to targeted technological innovation.
3. The development of frequency licensing and regulatory policies regarding potential technologies that could be profitably operated to serve in rural and remote regions.
4. Determination of regions where no business case can be justified for terrestrial wireless services and that would require the exploration of other solutions (e.g., satellite).
Regions where justified government subsidization might be required to offer citizens suitable broadband access in this information age.

UHF BROADBAND STUDY
- 4 -
DANIEL COSSETTE
BACKGROUND
On the 16th of October 2000, on behalf of the Prime Minister, the Minister of Industry announced that the Government of Canada was committed to achieving the goal of having high-speed broadband internet access to every community.1 The reason for the governments’ commitment is to help bridge the digital divide and the enable all Canadians to have internet access. As many know, the internet would allow people to conduct business activities and transaction easier, enable remote health care, learning, research, communications, entertainment and numerous other benefits.
Nevertheless, the problem with Canada is that it has very low population density because of its large area and low population. From the 2001 Census, Canada had a density of 3.3 person / km2, (reference Figure 1.) Even though many Canadians live in urban areas, from Industry Canada’s Broadband website, broadband is “currently available to approx 80% of the population, [is] only available to 20% of Canadian communities.”2
Figure 1. Map of Canada's Population Density.3
The underlying reason for wanting to specifically look at this topic is that the upper part
of the UHF radio frequency is of interest to Industry Canada and the Canadian Radio-television and Telecommunications Commission because of the various services that are currently available within these frequencies. Yet, some of the spectrum has still to be allocated and the service that
1 Canada, Gov’t of (2001). The new national dream : networking the nation for broadband access : report of the National Broadband Task Force. Ottawa, Government of Canada. http://broadband.ic.gc.ca/pub/program/NBTF/chapter3.html 2 Industry Canada, Broadband. Frequently Asked Questions. http://broadband.gc.ca/pub/faqs/faqscomplete.html 3 Canada, Gov’t of (2002) Population Density, 2001 by Dissemination Area. Produced by the Geography Division of Statistics Canada.

UHF BROADBAND STUDY
- 5 -
DANIEL COSSETTE
best benefits Canadians at an affordable cost, will likely receive the unallocated spectrum. The other main service that is competing for the allocation is satellite service. POTENTIAL SOLUTION
On April 2002, major vendors of wireless equipment laid the framework with the Institute of Electrical and Electronics Engineers (IEEE) for WiMAX. WiMAX is a communications standard for equipment and is also known as 802.16 or HiperMAN. “WiMAX can transfer around 70 M bytes / second over a distance of 48 kilometres to thousands of users from a single base station”4 The high coverage that WiMAX has to offer would allow providers to offer broadband internet to subscribers without having to worry about laying down a physical connection to the subscriber. In turn this rapidly speeds up installation, allows the network to be flexibility and scalability.
Figure 2. The IEEE 802.16 standard is one of a number of complementary wireless standards to ensure interoperability.5
Interest lies specifically with the 801.16a standard because it covers broadband communication at the 2 – 11 GHz frequency.6 This frequency is very important to Canada because in order to establish communications the antennas do not have to have direct line of site with the base station.
This frequency range is likely the best because even though lower frequencies could support non-line-of-site communications, based upon the physics of radio waves, they could not support the high-speed data communications. Lower frequencies would have speeds comparable to dialup.
Inversely, increasing the frequency would allow for higher transmissions rates, however the higher the frequency the more it becomes an issue of line-of-site. Initial the 802.16 standard
4 Lemon, Summer. “WiMAX promises breakthrough in broadband access.” Network World Fusion http://www.nwfusion.com/news/2003/1015wimaxpromi.html (Accessed April 19, 2004.) 5 Intel, White Paper. “IEEE 802.16* and WiMAX – Broadband Wireless Access for Everyone” http://www.intel.com/ebusiness/pdf/wireless/intel/80216_wimax.pdf (Accessed April 19, 2004) 6 Liebetreu, John. 802.16a preps wireless for prime time. EETimes. http://www.eetimes.com/article/showArticle.jhtml?articleId=16501110

UHF BROADBAND STUDY
- 6 -
DANIEL COSSETTE
was to cover frequency 11 – 60 GHz however this would limit users to having site of the base station.
Each base station could be connected to the internet backbone through the use of microwave towers to served areas or direct satellite links. A direct satellite link would certainly be less expensive than having a large number of individuals directly linked through satellite. The new wireless technologies open up the opportunity for service providers because they could offer wireless broadband as ubiquitous as cell phone connectivity and could even extend to persons in moving objects. OBJECTIVE The objective is to study the total number of people that could be served and sustain the construction of a WiMAX (IEEE 802.16) wireless tower. This is conducted using raster methods while the radial searches are conducted at distances of 5, 15, 25, 35 and 45 kilometres. DEFINITIONS / ABBREVIATIONS BROADBAND - High-capacity, two-way link between end user and the
backbone. Capable of supporting full-motion interactive video applications. A minimum speed of 1.5 megabits per second per individual user would be ideal.
IEEE - Institute of Electrical & Electronics Engineers. http://www.ieee.org LAN - Local Area Network. A data communications network which is
geographically limited (typically to a 1 km radius) allowing easy interconnection of terminals, micro-processors and computers within adjacent buildings.7
LOS - Line of Site. Ability to see the Base Station or Communications Tower is required for communication.
MAN - Metropolitan Area Network. A data network that is used to cover the area of a large city.7
NLOS - Non Line of Site. Ability to see the Base Station or Communication Tower is not required for communications.
UHF - Ultrahigh Frequency. 300MHz – 3GHz. WAN - Wide Area Network.7 WiMAX - Interoperability standards for broadband wireless access
(IEEE 802.16) http://www.wimaxforum.org
7 Howe, Denis. The Free On-line Dictionary of Computing, © 1993-2003. Definitions for WAN, MAN, LAN. http://dictionary.reference.com (Accessed 20 April 2004)

UHF BROADBAND STUDY
- 7 -
DANIEL COSSETTE
MINIMUM SUSTAINABLE SIZE
The key input into this study is minimum population size that can financially sustain the construction of a communications tower through paid subscription to wireless broadband services. Therefore a number of assumptions need to be made. This study assumed that 500 people represented 200 households (national average of 2.6 persons per household8). Assuming that after 4 years, there would be a total take rate of 25%, the tower could be paid for after six years using the following rough figures. The reason for such a high cost is because in rural areas the construction will likely to due to the: Costs Base Station Equipment9 $30,000 Tower Construction / Property $30,000 (est) Connection Rates / Maintenance $12,000 (est) Revenue Household $200 for initial cost
$50 / month connection fee. Table 1. General Calculations of the Payback Period for Construction of a UHF Wireless Tower.
Year Cost Take Number of Subscribers
Initial Revenue
Totalled Monthly Revenue Balance
1 $72,000 10% 20 $4,000 $12,000 -$56,000 2 $12,000 15% 30 $2,000 $18,000 -$48,000 3 $12,000 20% 40 $2,000 $24,000 -$34,000 4 $12,000 25% 50 $2,000 $30,000 -$14,000 5 $12,000 30% 60 $2,000 $36,000 $12,000 6 $12,000 30% 60 $0 $36,000 $36,000
DATA UTILIZED / DATA PREPERATION
The data that was utilized was all provided by DMTI Spatial while the software that was used for the preparation was ESRI ArcGIS 8.3 and ESRI ArcView 3.2. The reason for using a combination of both programs is that some steps are very computationally complex and run smoother using ArcView 3.2.
Initially the data was provided in NAD83 and because areas are calculated, all files were projected into Albers Equal Area Conic using the ESRI ArcToolbox . Ultimately, population counts were represented within discrete non-overlapping 5 x 5 km grid cells (see step 5 below). This 5 km resolution produced 1.1 million polygons and was at the limits of processing power for the computer used in this study (2.8 GHZ P4, 1GB RAM) given the large
8 Statistics Canada. Canada Average Household Size for 2001 Census. http://www.statcan.ca/english/Pgdb/famil53a.htm (Accessed 05 April 2004) 9 Brewin, Bob. Wireless vendors plan low-cost, high-speed metropolitan networks. 08 April 2003. Computerworld. http://www.computerworld.com/mobiletopics/mobile/story/0,10801,80157,00.html (Accessed 10 April 2004)

UHF BROADBAND STUDY
- 8 -
DANIEL COSSETTE
number dissolving and intersecting operations required to transfer population represented at the EA level to the grid-cells. Ideally a 1 km cell size would be more appropriate; however 27.5 million polygons would be produced in that case and this would have been computationally burdensome. Table 2. Data used for the study and the information that they contain.
File Name Source Format Information Contained
EA.shp DMTI Spatial Shapefile
Boundaries for the Enumeration Area and the population of each. 49,361 polygons.
CANwat.shp DMTI Spatial Shapefile Boundaries of the water bodies including Oceans, lakes and rivers. 4,221 polygons.
CANprv.shp DMTI Spatial Shapefile Provincial and Territorial boundaries. 13 polygons.
Figure 3. Enumeration Areas. DMTI Spatial, 1996 Boundaries.

UHF BROADBAND STUDY
- 9 -
DANIEL COSSETTE
Method for Data Preparation for Raster Use 1. Union EA with CANwat to have the location of the water. This is done in order to only
have the land parcels because the EA extend over water. Output file entitled union. 2. Selection of non-water polygons and generation of a new file. Output file entitled
nonH2Oselect. 3. Dissolve nonH2Oselect by the attribute EA. This is done because some EA’s were cut
into separate pieces. Output file entitled EAdissolved. 4. Calculate the Area of each EA for EAdissolved and label the column “OLDarea”. In
ArcMap the following VBA script is utilized in the Field Calculator.10
Pre-Logic VBA Script Code Dim x As Double Dim m_conv As Double m_conv = 1/(1000^2) Dim theIArea as IArea Set theIArea = [shape] x = theIArea.Area x = x * m_conv Name x
5. Generate a grid (fishnet) across Canada where each cell is 5 km x 5 km.11 Output file is entitled Fishnet.
6. Intersection of the Fishnet and EAdissolved. Output file is entitled interEA. 7. Calculate the Area of each polygon for interEA and label the column “NEWarea”. In
ArcMap a VBA script is utilized in the Field Calculator, reference step 4 . 8. Calculate the population of each polygon for interEA and label the column “polyPOP”.
The following VBA script is utilized in the Field Calculator. Name ([NEWarea] / [OLDarea]) * [POP96]
9. Dissolve the features of interEA based upon the generated cell id and summing the population of the cell to provide the total population of the grid. Output file is entitled gridPOP.
10. The gridPOP is joined back to the Fishnet based upon the cell id’s and only matching record are used to generate a new file. Output file is entitled wholeCellPOP. If this step was skipped some of cells that only had partial areas may not be included when the population data is converted to raster.
11. wholeCellPOP is converted to raster. Output file is entitled [population] 12. CANpro is converted to raster. Output file is entitled [province]
10 Sawada, M. GIS Database Design. http://www.uottawa.ca/academic/arts/geographie/lpcweb/web2320/lectnotes.htm (Accessed 23 Apr 04) 11 Nicholas, Robert. Grid Polygon Shapefile (Fishnet). Last Modified Apr 19, 2003. http://arcscripts.esri.com/details.asp?dbid=12807

UHF BROADBAND STUDY
- 10 -
DANIEL COSSETTE
Figure 4. Methodology Utilized to Prepare Data for Analysis. The numbers correspond the step in the method.

UHF BROADBAND STUDY
- 11 -
DANIEL COSSETTE
Figure 5. Population Density of Canada. 5km cell size.

UHF BROADBAND STUDY
- 12 -
DANIEL COSSETTE
ANALYSIS
The software that was used for the analysis was ESRI ArcGIS 8.3 and the Spatial Analysis extension. The raster calculator and various menu functions of Spatial Analysis were used. The following steps outline the procedure undertaken using the software. Indented text is the raster calculator commands and the larger text above is explanation of the commands function. For a more detailed explain of a commands function, reference the ESRI help file entitled “Spatial Analyst Functional Reference”. Map Algebra for 5 km Analysis
a) 5kpop = (Select([population], 'value > 500')) b) input15k = (Select([population], 'value <= 500 AND value > 0'))
Map Algebra for 15 km Analysis
c) focsum15k2 = FocalSum([input15k], rectangle, 3, 3, DATA) d) gt500p15k = SELECT([focsum15k2], 'VALUE > 500') e) dist15k = Straight Line Distance Max Distance At 15 km f) final15k = (con([dist15k] < 15000, 1, 0) * [input15] g) Reclass15out = Reclassify final15k using the following values
Old Values New Values 0 – 500 NoData NoData 1
h) input25 = [reclass15out] * [input15k]
Map Algebra for 25 km Analysis
i) focsum25k = FocalSum([input25], rectangle, 5, 5, DATA) j) gt500p25k = SELECT([focsum25k], 'VALUE > 500') k) dist25k = Straight Line Distance Max Distance At 25 km l) final25k = (con([dist25k] < 25000, 1, 0) * [input25] m) reclass25out = Reclassify final25k using the following values
Old Values New Values 0 – 500 NoData NoData 1
n) Input35 = [reclass25out] * [input25]
Map Algebra for 35 km Analysis
o) focsum35k = FocalSum([input35], rectangle, 7, 7, DATA) p) gt500p35k = SELECT([focsum35k], 'VALUE > 500') q) dist35k = Straight Line Distance Max Distance At 35 km r) final35k = (con([dist35k] < 35000, 1, 0) * [input35] s) reclass35out = Reclassify final35k using the following values
Old Values New Values 0 – 500 NoData NoData 1
t) Input45 = [reclass35out] * [input35]
UHF BROADBAND STUDY
- 13 -
DANIEL COSSETTE
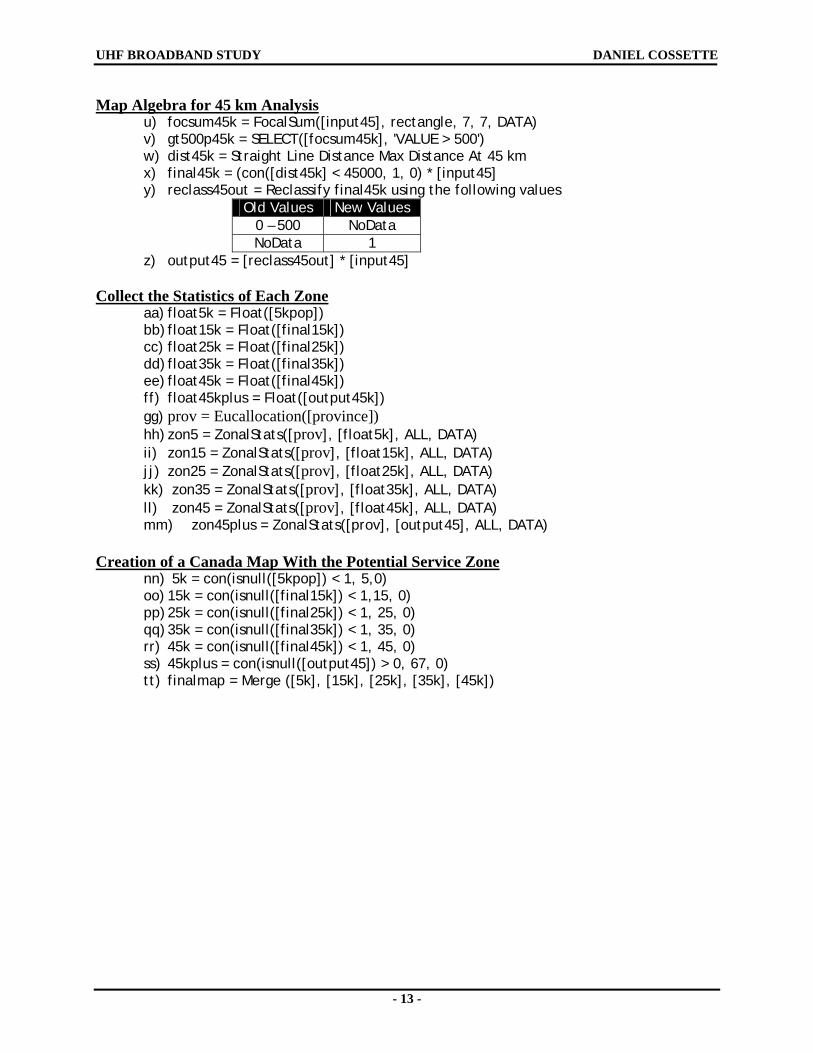
Map Algebra for 45 km Analysis u) focsum45k = FocalSum([input45], rectangle, 7, 7, DATA) v) gt500p45k = SELECT([focsum45k], 'VALUE > 500') w) dist45k = Straight Line Distance Max Distance At 45 km x) final45k = (con([dist45k] < 45000, 1, 0) * [input45] y) reclass45out = Reclassify final45k using the following values
Old Values New Values 0 – 500 NoData NoData 1
z) output45 = [reclass45out] * [input45] Collect the Statistics of Each Zone
aa) float5k = Float([5kpop]) bb) float15k = Float([final15k]) cc) float25k = Float([final25k]) dd) float35k = Float([final35k]) ee) float45k = Float([final45k]) ff) float45kplus = Float([output45k]) gg) prov = Eucallocation([province]) hh) zon5 = ZonalStats([prov], [float5k], ALL, DATA) ii) zon15 = ZonalStats([prov], [float15k], ALL, DATA) jj) zon25 = ZonalStats([prov], [float25k], ALL, DATA) kk) zon35 = ZonalStats([prov], [float35k], ALL, DATA) ll) zon45 = ZonalStats([prov], [float45k], ALL, DATA) mm) zon45plus = ZonalStats([prov], [output45], ALL, DATA)
Creation of a Canada Map With the Potential Service Zone
nn) 5k = con(isnull([5kpop]) < 1, 5,0) oo) 15k = con(isnull([final15k]) < 1,15, 0) pp) 25k = con(isnull([final25k]) < 1, 25, 0) qq) 35k = con(isnull([final35k]) < 1, 35, 0) rr) 45k = con(isnull([final45k]) < 1, 45, 0) ss) 45kplus = con(isnull([output45]) > 0, 67, 0) tt) finalmap = Merge ([5k], [15k], [25k], [35k], [45k])

UHF BROADBAND STUDY
- 14 -
DANIEL COSSETTE
Figure 6. Focal Population Count for 15 kilometers analysis, reference command (c).
Figure 7. Final map for the 15 kilometer analysis, reference command (g). Selected cells that would be served by a WiMAX tower.

UHF BROADBAND STUDY
- 15 -
DANIEL COSSETTE
RESULTS Table 3. Provincial results of the number of persons that could be served by various wireless towers.
Province Total
Population 5 km 15 km 25 km 35 km 45 km Unreachable
Nunavut Territories 24,730 5,704 14,288 631 0 991 3,152 Northwest Territories 39,672 25,879 9,227 0 536 0 3,643
Yukon Territory 30,766 18,718 5,593 2,061 0 0 4,383 British Columbia 3,724,500 3,436,610 213,662 26,970 12,634 1,520 32,980
Quebec 7,138,795 6,437,150 694,797 7,422 1,793 0 14,033 Newfoundland 551,850 395,188 145,855 2,086 2,240 0 6,689
Alberta 2,696,826 2,238,340 384,270 42,422 13,554 0 18,604 Saskatchewan 990,237 675,229 200,704 93,920 6,086 0 14,699
Manitoba 1,113,898 873,016 208,525 18,518 2,472 502 10,686 Ontario 10,753,573 9,904,120 799,141 10,935 6,874 0 16,177
Nova Scotia 909,282 678,015 229,723 622 0 0 1,169 New Brunswick 738,133 520,864 214,707 1 0 0 1,945
Prince Edward Is. 134,557 83,200 51,357 0 0 0 0 TOTAL 28,846,819 25,292,033 3,171,849 205,588 46,191 3,013 128,159
% of Total Population 100% 87.68% 11.00% 0.71% 0.16% 0.01% 0.44%
0% 20% 40% 60% 80% 100%
Percetage of Provincial Population
Nunavut Territories
Northwest Territories
Yukon Territory
British Columbia
Quebec
Newfoundland
Alberta
Saskatchewan
Manitoba
Ontario
Nova Scotia
New Brunswick
Prince Edward Is.
5 km 15 km 25 km 35 km 45 km Unreachable Figure 8. Provincial breakdown of the various radiuses that could serve the population.

UHF BROADBAND STUDY
- 16 -
DANIEL COSSETTE
Figure 9. Resultant map displaying the coverage area for the varies radiuses.

UHF BROADBAND STUDY
- 17 -
DANIEL COSSETTE
DISCUSSION
The results from the study are very encouraging because as one can see from Figure 9, WiMAX towers could provide access to 99.56% of the Canadian population where the bulk of the population could be served within 15 km.
Figure 8 shows the provincial and territory breakdown of the various radiuses. The east coast results show that the bulk of the population is within 15 km of service and only about 10,000 people out of could 2.2 million would not be reachable. In central Canada (Ontario and Quebec), the results seem to show that the majority of the population could be served using 35 kilometre towers. This strongly demonstrates that the population lives near each others. In western parts of the country the story is different from the east. Even though a large part of the population could be served using WiMAX there is still a large number of persons that are unreachable. This is likely attributed to the population dispersion. The results in the final map are slightly distorted because areas shown to be unreachable are represented by large vast areas. This does not mean that there are a large number of people living in these areas but that the few people who do; are scattered. This is due to the Enumeration Area’s covering large areas and only representing a few persons. These few people were distributed across large areas and did not truly represent where they reside.
Overall the methods and techniques used were able to fairly accurately represent the distribution of the Canadian population. However we had to assume that the population was evenly distributed across the Enumeration Area and as the final map illustrates that is not the case. CONCLUSION
In conclusion, the use of WiMAX would provide good competition to DSL and Cable internet. It could be financially viable to nearly 100% of the Canadian population and would also be a solution to providing broadband access to those whom do not have internet access internet. This should be interest to various government agencies, private companies and service providers. In order to make the project more representative of the population in the future socioeconomic profiles of existing subscribers would be included in order to compare with those whom currently do not have assess.
In the future, a method of making the project more representative and accurate for the Canadian population would be to include socioeconomic profiles of existing broadband subscribers and compared to those whom do not have broadband access. This would allow for a better understanding of who could and would support access to broadband. Data for this type of analysis would require data of who is current served and unserved and utilizing census information, such as income and expenditures from DMTI. This would help refine estimates accordingly better model of the potential customer base for WiMAX and related technologies.