A GIS based emission inventory development for...
14
A GIS based emission inventory development for Tehran Hossein Shahbazi, Sina Taghvaee, Vahid Hosseini ⁎, Hossein Afshin Mechanical Engineering Department, Sharif University of Technology, Tehran, Iran article info abstract Article history: Received 13 April 2016 Received in revised form 4 July 2016 Accepted 24 August 2016 Available online xxxx Tehran with a population of 8.2 million urban residents, suffers from rapid urbanization in recent years resulting in severe air pollution. The aim of this study is to develop a high resolution emission inventory of primary air pollutants for Tehran. Tehran pollution sources are classified into two major categories. Mobile sources, including vehicles such as passenger car, taxi, motorcycle, pickup, minibus, bus and truck, and sta- tionary sources; consisting of industries, general service and household, energy conversion, terminals and gas stations. The emission of SOx, NOx, CO, VOCs and PM in the year of 2013 were estimated as 37.411 kt, 85.524 kt, 506.690 kt, 83.640 kt and 8.496 kt, respectively. The results also indicate that mobile sources produced nearly 85% of the total aggregated pollutants while the stationary sources pollutants accounted for the remaining 15%. In a more elaborated view, 6.22% of SOx, 46.1% of NOx, 97.5% of CO, 86% of VOCs and 69.8% of PM were emitted from mobile sources while stationary sources produced the remaining amount of pollutants. © 2016 Elsevier B.V. All rights reserved. Keywords: Air pollution Emission inventory Spatial disaggregation Tehran Emission trend 1. Introduction With rapid growth of energy consumption and number of motor vehicles in urban areas, air pollutant emissions have drastically increased in recent years. Several scientific studies confirm the association be- tween cardiovascular and respiratory diseases with increased level of air pollution (Mabahwi et al., 2014; Wai et al., 2015). Furthermore, cities with higher level of air pollution have higher mortality and Urban Climate 17 (2016) 216–229 ⁎ Corresponding author. E-mail addresses: [email protected] (H. Shahbazi), [email protected] (S. Taghvaee), [email protected] (V. Hosseini), [email protected] (H. Afshin) http://dx.doi.org/10.1016/j.uclim.2016.08.005 2212-0955 © 2016 Elsevier B.V. All rights reserved. Contents lists available at ScienceDirect Urban Climate journal homepage: http://www.elsevier.com/locate/uclim
Transcript of A GIS based emission inventory development for...
Urban Climate 17 (2016) 216–229
Contents lists available at ScienceDirect
Urban Climate
j ou rna l homepage : ht tp : / /www.e lsev ie r .com/ locate /uc l im
A GIS based emission inventory developmentfor Tehran
Hossein Shahbazi, Sina Taghvaee, Vahid Hosseini ⁎, Hossein AfshinMechanical Engineering Department, Sharif University of Technology, Tehran, Iran
a r t i c l e i n f o
⁎ Corresponding author.E-mail addresses: [email protected] (H. S
(V. Hosseini), [email protected] (H. Afshin)
http://dx.doi.org/10.1016/j.uclim.2016.08.0052212-0955 © 2016 Elsevier B.V. All rights reserved.
a b s t r a c t
Article history:Received 13 April 2016Received in revised form 4 July 2016Accepted 24 August 2016Available online xxxx
Tehran with a population of 8.2 million urban residents, suffers fromrapid urbanization in recent years resulting in severe air pollution. Theaim of this study is to develop a high resolution emission inventory ofprimary air pollutants for Tehran. Tehran pollution sources are classifiedinto two major categories. Mobile sources, including vehicles such aspassenger car, taxi, motorcycle, pickup, minibus, bus and truck, and sta-tionary sources; consisting of industries, general service and household,energy conversion, terminals and gas stations. The emission of SOx,NOx, CO, VOCs and PM in the year of 2013 were estimated as37.411 kt, 85.524 kt, 506.690 kt, 83.640 kt and 8.496 kt, respectively.The results also indicate that mobile sources produced nearly 85% ofthe total aggregated pollutants while the stationary sources pollutantsaccounted for the remaining 15%. In a more elaborated view, 6.22% ofSOx, 46.1% of NOx, 97.5% of CO, 86% of VOCs and 69.8% of PM wereemitted from mobile sources while stationary sources produced theremaining amount of pollutants.
© 2016 Elsevier B.V. All rights reserved.
Keywords:Air pollutionEmission inventorySpatial disaggregationTehranEmission trend
1. Introduction
With rapid growth of energy consumption and number of motor vehicles in urban areas, air pollutantemissions have drastically increased in recent years. Several scientific studies confirm the association be-tween cardiovascular and respiratory diseases with increased level of air pollution (Mabahwi et al., 2014;Wai et al., 2015). Furthermore, cities with higher level of air pollution have higher mortality and
hahbazi), [email protected] (S. Taghvaee), [email protected]

217H. Shahbazi et al. / Urban Climate 17 (2016) 216–229
morbidity rate, especially among infants and other vulnerable groups of society (Cao et al., 2011; Zhouet al., 2014).
Tehranwith a population of 8.2 million residents and a daily greater population due tomigration from vi-cinities, suffers from severe air pollution (Amini et al., 2014). The overall visibility trends show a great de-crease in visual range during 1958 to 2008 in Tehran (Sabetghadam et al., 2012). Moreover, Lung cancer,angina pectoris, and hospital emergency admissions for respiratory diseases are the results of high levels ofair pollution (Hosseinpoor et al., 2005). Therefore, air quality monitoring, predicting future year air quality,and developing air quality control plans play an important role in developing countries and populated citiessuch as Tehran.
Emission inventories are official databases that specify the amount of air pollution and greenhouse gasesdischarged into the atmosphere from different pollution sources for a given period of time. They are usuallydeveloped for variety of spatial and temporal scales based on usage purposes (Gioli et al., 2015). Emission in-ventories can also be used as a major foundation for air quality modeling in order to understand the fate ofpollution emitted from different sources, spatial distribution of pollutant concentrations, and identify theemission reduction opportunities (Fu et al., 2013; McGraw et al., 2010). Spatially and temporally emission in-ventories are used as primary inputs for atmospheric dispersion models like AERMOD and CALPUFF (Gabusiand Volta, 2005), Trajectory models such as LAGRANTO, TRAJKS and FLEXTRA (Stohl et al., 2001) and coupledchemical-atmospheric air quality models like CAMx (Nopmongcol et al., 2012). An accurate and updatedemission inventory can help governments for air quality policymaking to control pollution sources (Zhaoet al., 2015).
Different kinds of emission inventories have currently been developed. Some inventories are related tospecific sources of pollution (Mazaheri et al., 2011) or individual pollutants (Kyung et al., 2014). Additionally,some of them are continental (Ohara et al., 2007), national (Zhang et al., 2014), regional (Fu et al., 2013), orurban (Guttikunda and Calori, 2013).
The amount of emissions and their characteristics may change significantly over periods of time due tosubstantial changes in vehicle numbers, fleet composition, emission standards and fuel quality. Therefore,an updated emission inventory should be established in developing regions (Fu et al., 2013). This is especiallycrucial in Tehran, the economical and industrial center of Iran. Average emission rates for different categoriesof vehicles and mobile sources can be calculated by the means of International Vehicle Emission (IVE) model(Guo et al., 2007). Shahbazi et al., developed an emission inventory for Tehran mobile sources, using the IVEmodel. They showed that passenger cars are one of themain sources of CO, VOCs, NOx and SOx. According tothe results, 41, 64 and 85% of NOx, SOx and PM were emitted from medium and heavy-duty vehicles(Shahbazi et al., 2016).
However, the only comprehensive Tehran emission inventory was collaborated with Japan inter-national cooperation agency (JICA) in 1997. Based on the results of JICA report, mobile sources pro-duced nearly 71.2% of the total pollutants while the stationary sources pollutants accounted for theremaining 28.8%. Besides, it is worth mentioning that the public services and residential sector, ener-gy conversion and industry were responsible for 4.6%, 5.9% and 18.2% of total pollutants, respectively((JICA), 1997). As one of the fastest developing cities in the Middle East, the emission inventory forTehran has not been updated. Therefore, it is not presently reliable in air quality analysis andpolicymaking.
In this paper, we have established an emission inventory with high spatial resolution for city of Tehran in2013, including SOx, NOx, CO, VOCs, and PM. Combination of emission factors and activity data were used toestimate emissions from each pollution sources.
The spatial distribution of pollutant emissions over Tehranwere estimated and presented based on the lo-cation of pollution sources, activity data, and Tehran land-use.
Detail traffic modeling results in each road of Tehran were used in order to generate 500 m × 500 mgridded vehicle emission inventory. Diurnal variation of traffic related emissionswere obtained based on traf-fic volume data counted at about 106 intersections over Tehran.
For other pollution sources, high resolutions of population census, land-use data, and source locationwereused to estimate 500 m × 500 m gridded emission inventories.
In Section 2, the emission estimation methodology for each pollution sector, data sources for preparingemission factors and activity data are comprehensively discussed. Spatial distribution of pollutant emissionsover Tehran and source contributions are also presented in Section 3.
218 H. Shahbazi et al. / Urban Climate 17 (2016) 216–229
2. Data and methods
2.1. Study domain
The annual mean temperature of Tehran is 18.5 °C with a maximum of 40 °C in July and a minimum of−10 °C in January. It is also a city of low rainfall with an average of 150 mm of precipitation per year.
In terms of geography, Tehran has an average elevation of 1200m above sea level (Amini et al., 2014). Thecity also covers a total area of more than 700 km2 and its geographical coordinates are 35°7′N and 51°4′E(Bidokhti and Shariepour, 2010).
According to TehranAir Quality Control Company (AQCC) report, the air quality index included 160days ofunhealthy air from3/21/2013 to 3/20/2014. This report also introduces PM2.5 as a criteria pollutant that playsa significant role in Tehran air pollution. Air pollution is a serious problem in Tehran due to Rapid urbaniza-tion, old fleet composition, and heavy industrial activities along with meteorological and complex terrainconditions. The city is surrounded byAlborzMountains on the north and eastwhich blocks Tehran air'smove-ment. Furthermore, prevailing winds flow from west, south, and southeast and bring the industrial factoriesair pollution to the city center (Atash, 2007; Shahbazi et al., 2016). Because of Tehran's dominantmeteorolog-ical conditions and topology, stable meteorological conditions and temperature inversion mostly occur inautumn and winter seasons, which is one of the important reasons of occurring pollution episodes (Bahariet al., 2014). Hence, the worst air quality index was observed during the months of September, November,and December (AQCC, 2013).
2.2. Methodology
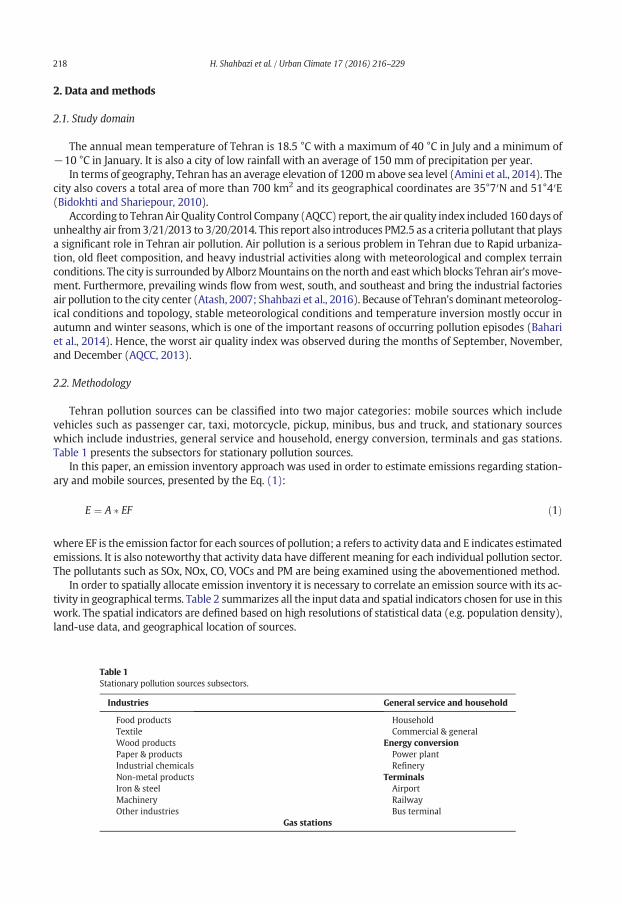
Tehran pollution sources can be classified into two major categories: mobile sources which includevehicles such as passenger car, taxi, motorcycle, pickup, minibus, bus and truck, and stationary sourceswhich include industries, general service and household, energy conversion, terminals and gas stations.Table 1 presents the subsectors for stationary pollution sources.
In this paper, an emission inventory approach was used in order to estimate emissions regarding station-ary and mobile sources, presented by the Eq. (1):
E ¼ A � EF ð1Þ
where EF is the emission factor for each sources of pollution; a refers to activity data and E indicates estimatedemissions. It is also noteworthy that activity data have different meaning for each individual pollution sector.The pollutants such as SOx, NOx, CO, VOCs and PM are being examined using the abovementioned method.
In order to spatially allocate emission inventory it is necessary to correlate an emission source with its ac-tivity in geographical terms. Table 2 summarizes all the input data and spatial indicators chosen for use in thiswork. The spatial indicators are defined based on high resolutions of statistical data (e.g. population density),land-use data, and geographical location of sources.
Table 1Stationary pollution sources subsectors.
Industries General service and household
Food products HouseholdTextile Commercial & generalWood products Energy conversionPaper & products Power plantIndustrial chemicals RefineryNon-metal products TerminalsIron & steel AirportMachinery RailwayOther industries Bus terminal
Gas stations

Table 2Major input data and spatial indicator for each pollution sources in Tehran considered in the present work.
Source category Type of input data Spatial allocation method
Energy conversion(refinery and power plant)
Fuel consumption Geographical coordinates
Residential combustion Natural gas consumption Population densityIndustrial combustion Fuel consumption Industrial areasGeneral and commercial combustion Natural gas consumption AreasRoad transport Link-base vehicle kilometer travel Road geographical coordinates and lengthAviation Flight schedule for each airplane technology Geographical coordinatesBus terminals Information collected from GPS units Geographical coordinatesGas stations Gasoline sale Geographical coordinatesRailway station Locomotive activity Geographical coordinates
219H. Shahbazi et al. / Urban Climate 17 (2016) 216–229
Fig. 1 shows thedistribution of industrial units over Tehran territory. Besides, location of roads and station-ary sources such as gas stations, terminals, power plants and refineries are presented in Fig. 2. After that, thespatially estimated inventories were gridded into 500m × 500m spatial grids for both stationary andmobilesources.
2.3. Activity data
Traffic data including total distance traveled by vehicles inside the study domain, were used to obtain ac-tivity data for mobile sources. Link-based traffic data has been obtained from the EMME/2 travel demandmodel (TDM) conducted by Tehran Comprehensive Transportation and Traffic Study (TCTTS) Company.The vehicle technology and age data were also extracted from car registration information provided by thetraffic police department of Iran and used to specify Tehran fleet composition. Altitude and meteorologicalconditions, as requirements of IVE model, were also prepared from Mehrabad weather station data(Shahbazi et al., 2016).
The amount of fuel sales in gas stations over Tehran was considered as activity data in order to calculatetheVOC evaporation emission during refueling processes. The fuel sales datawere obtained fromNational Ira-nian Oil Refining and Distribution Company (N.I.O.R.D.C). Based on the N.I.O.R.D.C annual report in 2013,nearly 3495 million liters of gasoline have been sold by 157 gas stations in Tehran (N.I.O.R.D.C, 2013).
Natural gas is the most consumed fuel in general services and household sectors for heating and cookingpurposes in Tehran. Hence, the amount of natural gas consumption in these two sectors were considered asactivity data, which was announced by Tehran Province Gas Company (TPGC, 2013).
Fig. 1. Distribution of Industrial units over Tehran.

Fig. 2. Distribution of roads and stationary pollution sources over Tehran Territory.
220 H. Shahbazi et al. / Urban Climate 17 (2016) 216–229
Mehrabad airport, located at thewestern zone of Tehran, is still by far the busiest airport in Iran in terms ofpassenger traffic and aircraft movements, having approximately 280 to 300 daily flights. Urban developmentconstruction has also caused the airport to be located in the Tehranmetropolitan area, which deteriorates theair quality index in adjacent zones. Mehrabad airport daily flight schedule including number of landings andtakeoffs for each technology of airplanes, were received from Iranian Civil Aviation Organization (CAO) andused as activity data for emission estimation.
Tehran railway station is another important source of pollution, located at the south region of Tehran. Boththe railway station diesel power plant and traffic of locomotiveswere studied as sources of pollution. Based onthe active locomotives, fleet compositions included 27 GM 2 stroke GT26-cw (16-645E3 engine model) and33 Siemens 4 stroke ER24PC (16V4000R43L engine model) locomotives. Eventually, Tehran railway stationactivity information such as locomotives travelwithin the station area, idle time for locomotives, and fuel con-sumption in the station were also obtained from Tehran railway headquarters.
Public transportation by buses is another source of emissions, which was also considered in this study.Hence, Bus stopping time at the terminals over the Tehran area was collected using fleet management soft-ware, which was powered by the Tehran municipality.
Energy conversion processes including refineries and power plants are important sources of pollution inTehran. There is one refinery near the south area of Tehran named Shahid Tondgooyan oil refinery that con-sumesHeavy oil. Tehran power plants are also named Besat, Ray, and Tarasht power plants. Besat power plantis located at the south of Tehran and consumes natural gas, gas oil, and kerosene. Similarly, Ray power plant isa significant source of emissions in the southern zones of Tehranby consumingnatural gas and gas oil. There isalso another power plant, named Tarasht power plant, which is in the western part of Tehran and consumesnatural gas. Fuel consumptions of Shahid Tondgooyan refinery, Besat, Ray and Tarasht power plants wereobtained from National Iranian Gas Company (NIGC) and energy balance sheet published by Iran EnergyEfficiency Organization (IEEO).
Activity data for industries and their subsectors, including fuel consumption data and number of each sub-sector, were also received from energy balance sheet and Tehran industries and jobs organizing company. It isnoteworthy that approximately 3100 industries exist in Tehran.
2.4. Emission factor
2.4.1. Mobile sourcesAs discussed by Shahbazi et al., emission rates from different vehicle categories in Tehran were calculated
using the International Vehicle Emission (IVE) model based on each vehicle technology, fuel quality, drivingpattern in different type of roads (Fotouhi and Montazeri-Gh, 2013), and ambient conditions (Shahbaziet al., 2016).

221H. Shahbazi et al. / Urban Climate 17 (2016) 216–229
2.4.2. Industry and energy conversionIn addition to mobile sources, industrial processes also emit significant level of pollutions. Food products,
textile, wood products, industrial chemicals, paper products, iron and steel, non-metal products and machin-ery are the common industries in Tehran. Energy conversion processes are other sources of pollution includ-ing refineries and power plants. Emission factors for industry and energy conversion whichwere used in thisstudy, were obtained by experimental measurements in the late 20th century and are presented in Table 3((JICA), 1997).
2.4.3. TerminalsDetailed Mehrabad aircraft fleet compositionswere extracted based on long term flight schedule analysis.
Considering Mehrabad airport fleet composition, it seems obvious that Fokker 100 and MD 83 are the mostcommon aircrafts in Iranian airline. Emission factors for different type of aircrafts were obtained from theAirport quality manual, which was provided by the International Civil Air Organization (ICAO, 2011).
Regarding the railway station, emission factors for GM 2 stroke GT26-cw (16-645E3 engine model) loco-motives were extracted from EMEP/EEA (Ntziachristos and Norris, 2013). These 2 stroke locomotives emitsignificant levels of pollutions, especially of NOx and SOx, while Siemens 4 stroke ER24PC (16V4000R43L en-ginemodel) locomotives have lower NOx and SOx pollution emission rates. Additionally, the emission factorsfor 4 stroke locomotives were also obtained from MTU corporation brochure (MTU corporation brochure,2014). Besides, emission factors for diesel power plant of railway station were similar to other Tehranpower plants.
In order to estimate pollution emission from bus terminals, the IVEmodel was also used to calculate aver-age diesel and CNG fleet emission rates while idling. The calculated emission rates are shown in Table 4.
2.4.4. Gas stationsGas stations were also being studied as a source of pollution for Volatile Organic Compounds (VOCs).
The emission factor for uncontrolled loading operations of underground storage tanks (UST) was obtainedby Eq. (2):
Table 3Emissio
Secto
Indus
Powe
LL ¼12:46 � S � P �M
Tð2Þ
where LL is the VOC emission factor (pounds per 1000 gallons of fuel loaded), S is the saturation factor, P refersto true vapor pressure of liquid loaded (pound per square inch absolute),M is the molecular weight of vapors(pound per pound mole) and T indicates the temperature of bulk liquid loaded (Rankin). S is obtained frommode of loading operation that assumes to be splash loading with no vapor balance. This assumption is def-initely proper in Tehran gas stations. Furthermore, P is obtained from another equation using Reid vapor pres-sure (Johnson, 1999). Emission factor for underground storage tanks breathing and emptying were alsoassumed to be 1.0 lb VOC/1000 gal (120 mg/l) loaded, found in Section 5-2 of AP-42 (AP-42, 1995).
n factors for industry and energy conversion.
r Fuel Unit Emission factor
SOX NOX CO VOC PM
try Gasoline g/Gj g/l 37 1.30 165 5.80 7744 272.34 298 10.48 41 1.44Kerosene g/Gj g/l 86 3.20 165 6.15 15 0.56 9 0.34 64 2.38Gas oil g/Gj g/l 336 12.94 164 6.32 13 0.50 9 0.35 65 2.50Heavy oil g/Gj g/l 1268 51.49 175 7.11 12 0.49 9 0.37 67 2.72LPG g/Gj g/kg 61 3.06 52 2.61 7 0.35 2 0.10 8 0.40NG g/Gj g/m3 1 0.04 73 3.00 7 0.29 1 0.04 6 0.02Solid fuel g/Gj g/kg 590 18.65 250 7.90 170 5.37 0 0.00 74 2.34
r plant & refinery Gas oil g/Gj g/l 336 12.94 284 10.94 15 0.58 15 0.58 66 2.54Heavy oil g/Gj g/l 1637 66.48 325 13.20 16 0.65 16 0.65 70 2.84NG g/Gj g/m3 1 0.04 234 9.60 7 0.29 16 0.66 6 0.25

Table 4Emission factors for locomotives, diesel power plant of railway station and buses.
Pollution source Unit Emission factor
CO NOx SOx VOC PM
16-645E3 2 stroke engine g/kWh 2.01 15.82 22.19 0.36 0.4316V4000R43L 4 stroke engine g/kWh 3.5 7.4 20.5 0.4 0.2Diesel power plant of railway station kg/ton fuel 0.78 14.68 17.37 0.78 3.41CNG bus (idle mode) mg/hr 66170 2720 20 550 70Diesel bus (idle mode) mg/hr 76280 172050 15570 23950 27030
222 H. Shahbazi et al. / Urban Climate 17 (2016) 216–229
Evaporative emissions can also be produced by vehicle refueling activity. Uncontrolled displacementlosses from vehicle refueling can be expressed using Eq. (3):
ER ¼ 264:2 −5:909ð Þ−0:0949 ΔTð Þ þ 0:0884 TDð Þ þ 0:485 RVPð Þ½ � ð3Þ
where ER (mg/l) is the refueling emissions, ΔT(°F) refers to the difference between temperature of dis-pensed fuel and temperature of fuel in vehicle tank, TD(°F) represents the temperature of dispensedfuel which is assumed to be the same as temperature of bulk fuel loaded at the UST and RVP (psia) isthe Reid vapor pressure. It is worth mentioning that the fuel temperature in vehicle tank is the same asthe air temperature. Therefore, we have calculated four emission factors for four seasons, with different aver-age air temperatures. Furthermore, the emission factor for spillage loss (leakage of nozzles)were calculated tobe 0.7 lb/1000 gal (80 mg/l) (AP-42, 1995). Table 5 shows the different VOC emission factors describedearlier.
2.4.5. General services and householdsIn this study, in order to measure emission factors from natural gas consumption in household and
commercial sectors, exhaust pollutant concentrations were measured by MRU VarioPlus Industrial multi-gas analyzer. Measured pollutant concentrations are then converted to concentrations in mass form, usingEq. (4):
Cd ¼ Cmeas � ρ ð4Þ
where Cd is the pollutant concentration (mg/m3), Cmeas refers to themeasured concentrations (ppm), and ρ isthe density of pollutant gases (kg/m3). Emission factors for various pollutants are then derived from Eq. (5):
EFx ¼ Cd �Vex;meas
Vex;th
!� Vex;th
HV
� �ð5Þ
EFx is the emission factor for a particular pollutant (gram/mega joule), Vex,meas refers to the measured
wherevolume (m3) of combustion products, Vex ,th represents the theoretical volume (m3) of combustion products(on the basis of dry analysis) and HV is the natural gas heat value (mega joule/m3).Table 5VOC emission factors for gas stations.
Activity VOC emission factor (mg/l)
Splash UST loading with no vapor balance 1284Uncontrolled vehicle refueling (spring) 1199Uncontrolled vehicle refueling (summer) 1555Uncontrooled vehicle refueling (fall) 896Uncontrolled vehicle refueling (winter) 526

223H. Shahbazi et al. / Urban Climate 17 (2016) 216–229
Assuming natural gas is entirely composed of methane (which is a valid assumption in Tehran) and com-bustion is stoichiometric, Vex,th is obtained using Eqs. (6) and (7). Furthermore, pollutants are assumed to beideal gases because of high temperature in the combustion chamber.
CH4 þ 2 O2 þ 3:76N2ð Þ→CO2 þ 2H2Oþ 7:52N2 6ð Þ⇒Vex;th ¼ 1 � CO2ð Þ þ 7:52 � N2ð Þ ¼ 8:52 m3 7ð Þ
However, in practice, lean combustion occurs in the combustion chamber. Neglecting unburned hydrocar-bons, CO, and NOx against other products for simplicity, Vex,meas(on the basis of dry analysis) is found by Eqs.(8) and (9). λ refers to Air-fuel equivalence ratio.
CH4 þ 2λ O2 þ 3:76N2ð Þ→CO2 þ 2H2Oþ 2λ−2ð ÞO2 þ 7:52λN2 ð8Þ
Vex;meas ¼ 1 � CO2ð Þ þ 2λ−2ð Þ � O2ð Þ þ 7:52λ � N2ð Þ ¼ 9:52λ−1 m3 ð9Þ
Combining Eqs. (7) and (9), the ratio of Vex ,meas to Vex , th is then achieved by some mathematicaloperations:
Vex;meas
Vex;th¼ 9:52λ−1
8:5210ð Þ⇒Vex;meas
Vex;th¼
14:76
14:76
−2λ−2
9:52λ−1
11ð Þ⇒Vex;meas
Vex;th¼ 21
21‐%O2 ex;measð Þ12ð Þ
Finally, using Eqs. (5) and (12), emission factor for different pollutants can be obtained by followingequation:
EFx ¼ Cd �21
21−%O2 ex;measð Þ
!� Vex;th
HV
� �ð13Þ
Emission factors were calculated using the above equation on the basis of dry analysis. Thus, HV is as-sumed to be a higher heating value for methane. Furthermore, pollutant concentrations and emission factorsweremeasured for different heating systems including powerhouse, package, and heater. The amount of nat-ural gas consumption in household and commercial sector on the basis of application, building type and land-use data provided by statistical center of Iran were also used to specify the distribution of different heatingtechnology.
3. Results and discussion
3.1. Pollutant emissions by sector
In 2013, total annual pollutant emissions in Tehran including SOx, NOx, CO, VOCs and PM from all sourcesof pollution mentioned in previous sections, were estimated to be about 722 kt. Mobile sources producednearly 85% of the total pollutants while the stationary sources pollutants accounted for the remaining 15%.Consequently, mobile sources play an important role in Tehran air pollution. In this study, mobile sourceswere categorized to seven types of vehicles including passenger car, taxi, motorcycle, pickup, minibus, busand truck. Table 6 shows the contribution of different categories of vehicles to air pollutant emissions frommobile sources in Tehran (Shahbazi et al., 2016).
Contribution of each sources of pollution in Tehran primary air pollutant emissions is also shown in Table7. According to this table, the annual emissions of SOx, NOx, CO, VOCs and PMwere 37.4 kt, 85.5 kt, 506.7 kt,83.6 kt and 8.5 kt respectively. In addition, contributions to total emissions based on each section for the abovementioned pollutants are presented in Fig. 3. It is noteworthy that mobile sources produce nearly 6.22% ofSOx, 46.1% of NOx, 97.5% of CO, 86% of VOCs and 69.8% of PM while stationary sources emit the remainingamount of pollutants.
Regarding SOx emissions, energy conversion (including power plants and oil refinery) and industrial pro-cesses are the most significant sources of pollution by contributing nearly 68.1% and 21.6%, respectively.
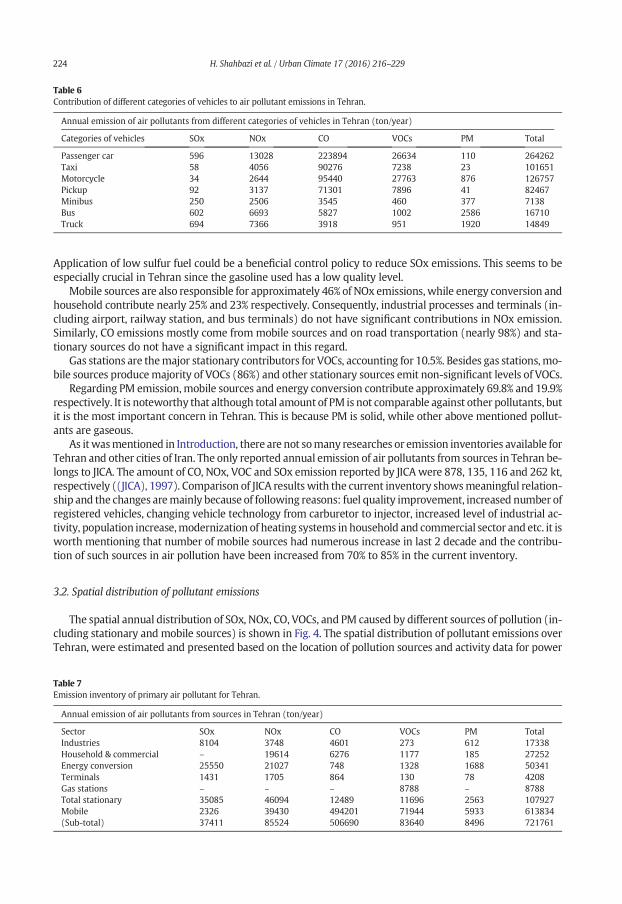
Table 6Contribution of different categories of vehicles to air pollutant emissions in Tehran.
Annual emission of air pollutants from different categories of vehicles in Tehran (ton/year)
Categories of vehicles SOx NOx CO VOCs PM Total
Passenger car 596 13028 223894 26634 110 264262Taxi 58 4056 90276 7238 23 101651Motorcycle 34 2644 95440 27763 876 126757Pickup 92 3137 71301 7896 41 82467Minibus 250 2506 3545 460 377 7138Bus 602 6693 5827 1002 2586 16710Truck 694 7366 3918 951 1920 14849
224 H. Shahbazi et al. / Urban Climate 17 (2016) 216–229
Application of low sulfur fuel could be a beneficial control policy to reduce SOx emissions. This seems to beespecially crucial in Tehran since the gasoline used has a low quality level.
Mobile sources are also responsible for approximately 46% of NOx emissions, while energy conversion andhousehold contribute nearly 25% and 23% respectively. Consequently, industrial processes and terminals (in-cluding airport, railway station, and bus terminals) do not have significant contributions in NOx emission.Similarly, CO emissions mostly come from mobile sources and on road transportation (nearly 98%) and sta-tionary sources do not have a significant impact in this regard.
Gas stations are themajor stationary contributors for VOCs, accounting for 10.5%. Besides gas stations, mo-bile sources producemajority of VOCs (86%) and other stationary sources emit non-significant levels of VOCs.
Regarding PM emission,mobile sources and energy conversion contribute approximately 69.8% and 19.9%respectively. It is noteworthy that although total amount of PM is not comparable against other pollutants, butit is the most important concern in Tehran. This is because PM is solid, while other above mentioned pollut-ants are gaseous.
As itwasmentioned in Introduction, there are not somany researches or emission inventories available forTehran and other cities of Iran. The only reported annual emission of air pollutants from sources in Tehran be-longs to JICA. The amount of CO, NOx, VOC and SOx emission reported by JICA were 878, 135, 116 and 262 kt,respectively ((JICA), 1997). Comparison of JICA results with the current inventory showsmeaningful relation-ship and the changes aremainly because of following reasons: fuel quality improvement, increased number ofregistered vehicles, changing vehicle technology from carburetor to injector, increased level of industrial ac-tivity, population increase,modernization of heating systems in household and commercial sector and etc. it isworth mentioning that number of mobile sources had numerous increase in last 2 decade and the contribu-tion of such sources in air pollution have been increased from 70% to 85% in the current inventory.
3.2. Spatial distribution of pollutant emissions
The spatial annual distribution of SOx, NOx, CO, VOCs, and PM caused by different sources of pollution (in-cluding stationary and mobile sources) is shown in Fig. 4. The spatial distribution of pollutant emissions overTehran, were estimated and presented based on the location of pollution sources and activity data for power
Table 7Emission inventory of primary air pollutant for Tehran.
Annual emission of air pollutants from sources in Tehran (ton/year)
Sector SOx NOx CO VOCs PM TotalIndustries 8104 3748 4601 273 612 17338Household & commercial – 19614 6276 1177 185 27252Energy conversion 25550 21027 748 1328 1688 50341Terminals 1431 1705 864 130 78 4208Gas stations – – – 8788 – 8788Total stationary 35085 46094 12489 11696 2563 107927Mobile 2326 39430 494201 71944 5933 613834(Sub-total) 37411 85524 506690 83640 8496 721761

0%
10%
20%
30%
40%
50%
60%
70%
80%
90%
100%
CO NOx VOCs SOx PM
Per
cen
t
Mobile Industries Household, Commercial Energy conversion Terminals Gas stations
Fig. 3. Sectoral contributions to air pollution emission in Tehran for the base year of 2013.
225H. Shahbazi et al. / Urban Climate 17 (2016) 216–229
plants, refineries, airport, railway station and gas stations. For commercial and industrial sources, high resolu-tions of land-use data prepared by Tehran municipality were used to estimate spatial distribution. Further-more, high resolutions of population census were used to estimate spatial distribution of pollutants forhousehold activities. It is noteworthy that household concentration map is considered same as populationconcentration in Tehran (Shahbazi et al., 2016). For Mobile sources, traffic modeling results in each road ofTehranwere also used to estimate spatial distribution of pollutants. Hence, emissions from different pollutionsource were distributed into 0.5 km × 0.5 km grids in order to be consistent with air quality models.
The spatial distribution of SOx shows that higher levels of emissions are in western and southern zonesbecause of the industrial activities and existence of power plants and oil refinery, respectively. NOx emissionismore concentrated in central zones of Tehran due to higher vehicle kilometers traveled (VKT) and high levelof household and commercial activities. It is noteworthy that VKT refers to the total distance traveled by ve-hicles inside the study domain. Besides, the Tehran oil refinery located at the southern part of city is a signif-icant source of NOx emissions.
Spatial distribution of CO analysis also indicates that central parts of city have higher level of emissions dueto higher VKT and transportation activities. The trend is almost the same for VOCs. VOC emissions are mostlyconcentrated in central areas of Tehran because of the heavy traffic pattern and high level of VKT.
High levels of PMemission intensity can also be observed in central parts of city due to large transportationactivities, motorcycles and diesel buses for public transportation. Besides, energy conversion (includingpower plants and oil refinery) has a significant role in emitting particulatematters that can be seen in PM spa-tial distribution. This leads to high intensity for PM emissions in southern zones. It is somehow possible to seethat high emission levels of PM are also related to heavy-duty vehicles and trucks, which includes suburbanroutes of Tehran.
3.3. Temporal profiles
Temporally resolved emission data are required for photochemical modeling. Therefore, usually monthly,daily and hourly profiles for each pollutant sources in the study area should be developed for such purposes. Itis also worthmentioning that further processing for chemical speciation is necessary in order to prepare suit-able emission data for chemical transport models which is not discussed here.
For mobile sources in Tehran, including different type of vehicle categories, monthly variation of emissionfor gasoline and diesel vehicles are derived from amonthly amount of fuel consumption in the city. Finally, Inorder to convert traffic related emission data to daily and hourly temporal resolution, traffic counting devicesdata and traffic counting data at about 106 intersections were used (Shahbazi et al., 2016).
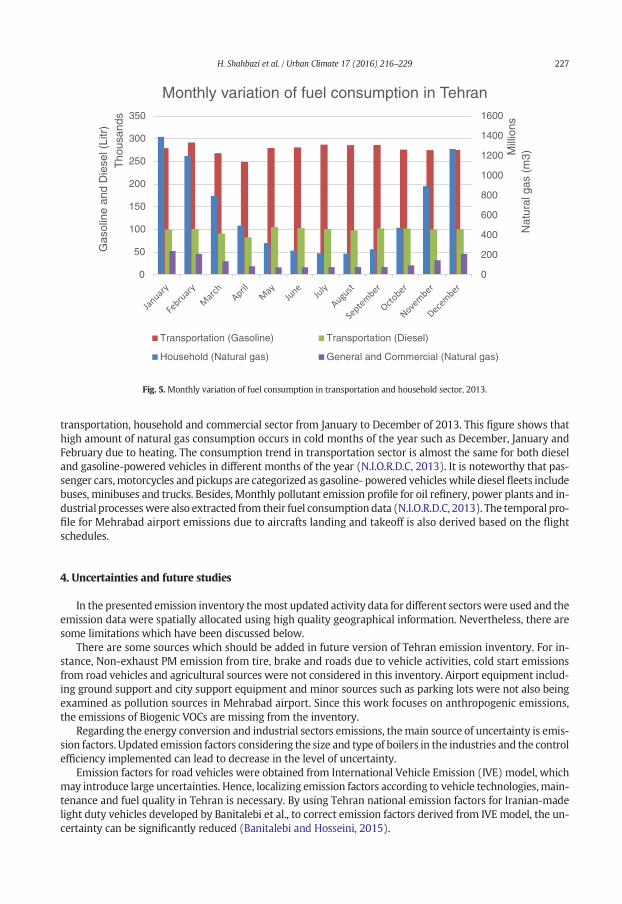
The same method was also used to develop monthly profiles for household, general and commercial sec-tors based on natural gas consumption. Fig. 5 shows the gas oil, gasoline and natural gas consumption in the

Fig. 4. Spatial distribution of a) SOx, b) NOx, c) CO d) VOCs e) PM emission for the base year of 2013.
226 H. Shahbazi et al. / Urban Climate 17 (2016) 216–229
0
200
400
600
800
1000
1200
1400
1600
0
50
100
150
200
250
300
350
Nat
ural
gas
(m
3)Mill
ions
Gas
olin
e an
d D
iese
l (Li
tr)
Tho
usan
ds
Monthly variation of fuel consumption in Tehran
Transportation (Gasoline) Transportation (Diesel)
Household (Natural gas) General and Commercial (Natural gas)
Fig. 5. Monthly variation of fuel consumption in transportation and household sector, 2013.
227H. Shahbazi et al. / Urban Climate 17 (2016) 216–229
transportation, household and commercial sector from January to December of 2013. This figure shows thathigh amount of natural gas consumption occurs in cold months of the year such as December, January andFebruary due to heating. The consumption trend in transportation sector is almost the same for both dieseland gasoline-powered vehicles in different months of the year (N.I.O.R.D.C, 2013). It is noteworthy that pas-senger cars,motorcycles and pickups are categorized as gasoline- powered vehicleswhile diesel fleets includebuses, minibuses and trucks. Besides, Monthly pollutant emission profile for oil refinery, power plants and in-dustrial processeswere also extracted from their fuel consumption data (N.I.O.R.D.C, 2013). The temporal pro-file for Mehrabad airport emissions due to aircrafts landing and takeoff is also derived based on the flightschedules.
4. Uncertainties and future studies
In the presented emission inventory themost updated activity data for different sectors were used and theemission data were spatially allocated using high quality geographical information. Nevertheless, there aresome limitations which have been discussed below.
There are some sources which should be added in future version of Tehran emission inventory. For in-stance, Non-exhaust PM emission from tire, brake and roads due to vehicle activities, cold start emissionsfrom road vehicles and agricultural sources were not considered in this inventory. Airport equipment includ-ing ground support and city support equipment and minor sources such as parking lots were not also beingexamined as pollution sources in Mehrabad airport. Since this work focuses on anthropogenic emissions,the emissions of Biogenic VOCs are missing from the inventory.
Regarding the energy conversion and industrial sectors emissions, themain source of uncertainty is emis-sion factors. Updated emission factors considering the size and type of boilers in the industries and the controlefficiency implemented can lead to decrease in the level of uncertainty.
Emission factors for road vehicles were obtained from International Vehicle Emission (IVE) model, whichmay introduce large uncertainties. Hence, localizing emission factors according to vehicle technologies, main-tenance and fuel quality in Tehran is necessary. By using Tehran national emission factors for Iranian-madelight duty vehicles developed by Banitalebi et al., to correct emission factors derived from IVE model, the un-certainty can be significantly reduced (Banitalebi and Hosseini, 2015).
228 H. Shahbazi et al. / Urban Climate 17 (2016) 216–229
Another important source of uncertainty is the activity of trucks especially during night when they areallowed to enter urban roads. Collecting more activity data on different roadways can lead to decrease inthe level of uncertainty.
In order to use chemical transport models for air quality modeling and forecasting, chemical speciatedemission inventory, based on considered chemicalmechanism is necessary. Hence the presented emission in-ventory should be converted into speciated format, based on the characteristics of each pollution sourceindividually.
Pollution emission from cities and sources located in the vicinity of Tehran have also large impact on Tehranair quality and should be somehow estimated and considered in the air pollution forecasting system. Thus, agreater version of emission inventory should be established for suburban zones of Tehran. Another importantobjective is to construct a fully specified weekly cycle to account for temporal changes in emissions across allother anthropogenic sources. Moreover, uncertainties of estimated emissions were not being examined in ourwork yet, because of the highly complex bottom-up methodology and should be considered in future studies.
5. Conclusion
In this paper, Tehran emission inventory of primary air pollutants for the base year of 2013was established.The main sources of air pollution were categorized into stationary sources (including industries, generalservices and households, energy conversion, terminals, and gas stations) and mobile sources. Detail trafficmodeling results in each road of Tehran were used in order to generate the 500 m × 500 m gridded vehicleemission inventory. Diurnal variation of traffic related emissions were obtained based on traffic volume datacounted at about 106 intersections over Tehran. For other pollution sources, high resolutions of populationcensus, land-use data, and source locationwere used to estimate 500m×500mgridded emission inventories.
Using emission factors and activity data, annual emissions of SOx, NOx, CO, VOC and PMwere estimated tobe 37.4 kt, 85.5 kt, 506.7 kt, 83.6 kt and 8.5 kt, respectively. Analyzing the contribution of each section to theabovementioned pollutants showed that mobile sources were responsible for 46.1% of NOx, 6.22% of SOx,97.5% of CO, 86% of VOCs, 69.8%of PM and 85% of total aggregated emissions, respectively. On the otherhand, total stationary sources contributed nearly 53.9% of NOx, 93.78% of SOx, 2.5% of CO, 14% of VOCs and31.2% of PM. Emissions from industrial processes accounted for nearly 22% of SOx and 7% of PM. Energy con-version contributed nearly 68% of SOx, 25% of NOx and 19.9% of PM. Gas stations were also the major station-ary contributors for VOCs, accounting for 10.5%. Additionally, 23% of NOx emission came from household andcommercial activities. The comparison of this inventory with previous study shows that the emission of airpollutants has significant changes in recent years due to several factors. Thus, updates of emission inventoriesare so much crucial in fast developing cities such as Tehran.
Spatial distribution analysis also indicated that high levels of SOx could be observed inwestern and south-ern zones due to industrial activities and energy conversion (existence of power plants and oil refinery), re-spectively. Furthermore, CO and VOCs were more concentrated in central parts of Tehran because of thehigh traffic rate of mobile sources. The distribution of NOx emissions also showed that the emissions weremostly higher in central zones due to higher VKT and high level of household and commercial activities.The trend was somehow the same for PM where central zones had a greater amount of emissions becauseof large transportation activity, motorcycles and diesel buses. It was also observed that suburban routes ofTehran had a high level of PM due to heavy-duty vehicles. Tehran oil refinery was also a significant sourceof NOx and PM, which led to high spatial distribution of such pollutant in southern parts of the city.
Acknowledgement
The contribution of deputy transportation of Tehran Municipality and Tehran air quality control Co. forproviding data to this study is acknowledged. Support from Pergas Pishro Ikad Co. is also acknowledged.
References
(JICA), J.I.C.A., 1997. The Study on an Integrated Master Plan for Air Pollution Control in the Greater Area in the Islamic Republic of Iran.Amini, H., Taghavi-Shahri, S.M., Henderson, S.B., Naddafi, K., Nabizadeh, R., Yunesian, M., 2014. Land use regressionmodels to estimate the
annual and seasonal spatial variability of sulfur dioxide and particulate matter in Tehran, Iran. Sci. Total Environ. 488-489, 343–353.

229H. Shahbazi et al. / Urban Climate 17 (2016) 216–229
AP-42, 1995. Compilation of Air Pollutant Emission Factors, Volume I: Stationary Point and Area Sources, Section 5.2 Transportation andMarketing of Petroleum Liquids.
AQCC, 2013. Air Quality Control Company [WWWDocument]. (URL http://air.tehran.ir/portals/0/ReportFiles/AirPollution/New/24.pdf).Atash, F., 2007. The deterioration of urban environments in developing countries: mitigating the air pollution crisis in Tehran, Iran. Cities
24, 399–409. http://dx.doi.org/10.1016/j.cities.2007.04.001.Bahari, R.A., Abbaspour, R.A., Pahlavani, P., 2014. Prediction of pm2.5 concentrations using temperature inversion effects based on an ar-
tificial neural network. The 1st isprs international conference on Geospatial Information Research http://dx.doi.org/10.5194/isprsarchives-XL-2-W3-73-2014.
Banitalebi, E., Hosseini, V., 2015. Development of hot exhaust emission factors for Iranian-made euro - 2 certified light-duty vehicles. En-viron. Sci. Technol. http://dx.doi.org/10.1021/acs.est.5b05611.
Bidokhti, A., Shariepour, Z., 2010. Upper air meteorological conditions of acute air pollution episodes (case study: Tehran). J. Environ.Stud. 35.
Cao, J., Yang, C., Li, J., Chen, R., Chen, B., Gu, B., Kan, H., 2011. Association between long-term exposure to outdoor air pollution and mor-tality in China: a cohort study. J. Hazard. Mater. 186, 1594–1600. http://dx.doi.org/10.1016/j.jhazmat.2010.12.036.
Fotouhi, A., Montazeri-Gh, M., 2013. Tehran driving cycle development using the k-means clustering method. Sci. Iran. 20, 286–293.http://dx.doi.org/10.1016/j.scient.2013.04.001.
Fu, X., Wang, S., Zhao, B., Xing, J., Cheng, Z., Liu, H., Hao, J., 2013. Emission inventory of primary pollutants and chemical speciation in 2010for the Yangtze River Delta region, China. Atmos. Environ. 70, 39–50. http://dx.doi.org/10.1016/j.atmosenv.2012.12.034.
Gabusi, V., Volta, M., 2005. Seasonal modelling assessment of ozone sensitivity to precursors in northern Italy. Atmos. Environ. 39,2795–2804. http://dx.doi.org/10.1016/j.atmosenv.2004.07.041.
Gioli, B., Gualtieri, G., Busillo, C., Calastrini, F., Zaldei, A., Toscano, P., 2015. Improving high resolution emission inventories with localproxies and urban eddy covariance flux measurements. Atmos. Environ. 115, 246–256.
Guo, H., Zhang, Q.Y., Shi, Y., Wang, D.H., 2007. Evaluation of the International Vehicle Emission (IVE)model with on-road remote sensingmeasurements. J. Environ. Sci. 19, 818–826. http://dx.doi.org/10.1016/S1001-0742(07)60137-5.
Guttikunda, S.K., Calori, G., 2013. A GIS based emissions inventory at 1 km × 1 km spatial resolution for air pollution analysis in Delhi,India. Atmos. Environ. 67, 101–111.
Hosseinpoor, A.R., Forouzanfar, M.H., Yunesian, M., Asghari, F., Naieni, K.H., Farhood, D., 2005. Air pollution and hospitalization due toangina pectoris in Tehran, Iran: a time-series study. Environ. Res. 99, 126–131. http://dx.doi.org/10.1016/j.envres.2004.12.004.
ICAO, 2011. Airport Air Quality Manual. Denmark. Doi:Doc. 9889.Johnson, G.T., 1999. Developing a Consistent Methodology to Calculate VOC and HAP Evaporative Emissions for Stage I and Stage II Op-
erations at Gasoline Service Stations for the 1999 NEI (DRAFT V2.0).Kyung, N., Pyo, Y., Morino, Y., Kurokawa, J., Ohara, T., 2014. Verification of NOx emission inventories over North Korea. Environ. Pollut.
195, 236–244.Mabahwi, N.A.B., Leh, O.L.H., Omar, D., 2014. Human health and wellbeing: human health effect of air pollution. Procedia Soc. Behav. Sci.
153, 221–229. http://dx.doi.org/10.1016/j.sbspro.2014.10.056.Mazaheri, M., Johnson, G.R., Morawska, L., 2011. An inventory of particle and gaseous emissions from large aircraft thrust engine oper-
ations at an airport. Atmos. Environ. 45, 3500–3507. http://dx.doi.org/10.1016/j.atmosenv.2010.12.012.McGraw, J., Haas, P., Young, L., Evens, A., 2010. Greenhouse gas emissions in Chicago: emissions inventories and reduction strategies for
Chicago and its metropolitan region. J. Great Lakes Res. 36, 104–114. http://dx.doi.org/10.1016/j.jglr.2009.11.010.MTU corporation brochure, 2014. (Manufacturer of Diesel Engines), Edition 1/14.N.I.O.R.D.C, 2013. National Iranian Oil Refining and Distribution Company [WWWDocument]. (URL http://niordc.ir/uploads/amarname_
1392_s_20150126_163139.rar).Nopmongcol, U., Koo, B., Tai, E., Jung, J., Piyachaturawat, P., Emery, C., Yarwood, G., Pirovano, G., Mitsakou, C., Kallos, G., 2012. Modeling
Europe with CAMx for the Air Quality Model Evaluation International Initiative (AQMEII). Atmos. Environ. 53, 177–185. http://dx.doi.org/10.1016/j.atmosenv.2011.11.023.
Ntziachristos, L., Norris, J., 2013. EMEP/EEA Air Pollutant Emission Inventory Guidebook 2013 (A.1.3.c Railways).Ohara, T., Akimoto, H., Kurokawa, J., Horii, N., Yamaji, K., Yan, X., Hayasaka, T., 2007. An Asian emission inventory of anthropogenic emis-
sion sources for the period 1980–2020. Atmos. Chem. Phys. Discuss. 7, 6843–6902.Sabetghadam, S., Ahmadi-Givi, F., Golestani, Y., 2012. Visibility trends in Tehran during 1958–2008. Atmos. Environ. 62, 512–520. http://
dx.doi.org/10.1016/j.atmosenv.2012.09.008.Shahbazi, H., Reyhanian, M., Hosseini, V., Afshin, H., 2016. The relative contributions of mobile sources to air pollutant emissions in Teh-
ran, Iran: an emission inventory approach. Emiss. Control Sci. Technol. 2 (1), 44–56. http://dx.doi.org/10.1007/s40825-015-0031-x.Stohl, A., Haimberger, L., Scheele, M.P., Wernli, H., 2001. An intercomparison of results from three trajectory models. Meteorol. Appl. 8,
127–135. http://dx.doi.org/10.1017/S1350482701002018.TPGC, 2013. Tehran Province Gas Company [WWW Document]. (URL http://www.nigc-tpgc.ir/Portal/Home/ShowPage.aspx?Object=
NEWS&CategoryID=d04aaa8e-faa7-4fa1-abde-d2365ed3e0a7&LayoutID=2cac6877-a104-401a-8404-cafbdd9b6e42).Wai, W., Tam, S., Wong, T.W., Wong, A.H.S., 2015. Association between air pollution and daily mortality and hospital admission due to
Ischaemic heart diseases in Hong Kong. Atmos. Environ. http://dx.doi.org/10.1016/j.atmosenv.2015.08.068.This.Zhang, B., Chen, Z.M., Qiao, H., Chen, B., Hayat, T., Alsaedi, A., 2014. Ecological informatics China's non-CO2 greenhouse gas emissions:
inventory and input–output analysis. Ecol. Inform.Zhao, Y., Qiu, L., Xu, R., Xie, F., Zhang, Q., Yu, Y., Nielsen, C.P., Qin, H., Wang, H., Wu, X., Li, W., Zhang, J., 2015. Advantages of city-scale
emission inventory for urban air quality research and policy: the case of Nanjing, a typical industrial city in the Yangtze RiverDelta, China. Atmos. Chem. Phys. Discuss. 15, 18691–18746. http://dx.doi.org/10.5194/acpd-15-18691-2015.
Zhou, M., Liu, Y., Wang, L., Kuang, X., Xu, X., Kan, H., 2014. Particulate air pollution and mortality in a cohort of Chinese men. Environ.Pollut. 186, 1–6. http://dx.doi.org/10.1016/j.envpol.2013.11.010.