Disaster Information Management on the Phreatic Eruption ...
Journal of Geographic Information System, 2013, 5, 242-247 http://dx.doi.org/10.4236/jgis.2013.53023 Published Online June 2013 (http://www.scirp.org/journal/jgis)
A GIS-Based DRASTIC Model for Assessing Phreatic Aquifere of Bekalta (Tunisian Sahel)
Asma El Hanini, Ayed Added, Saâdi Abdeljaoued Département de Géologie, Faculté des Sciences de Tunis, Université de Tunis El Manar, Laboratoire des Ressources
Minérales et Environnement, Tunis, Tunisia Email: [email protected]
Received February 23, 2013; revised March 23, 2013; accepted April 23, 2013
Copyright © 2013 Asma El Hanini et al. This is an open access article distributed under the Creative Commons Attribution License, which permits unrestricted use, distribution, and reproduction in any medium, provided the original work is properly cited.
ABSTRACT
The phreatic aquifer of Bekalta experienced a progressive degradation of water resources over time: using increasingly important waters for irrigation and drinking water, nitrate pollution, salinization... This aquifer is of great economic importance because it is used for irrigation and domestic consumption. Vulnerability map to nitrate pollution is a nec- essary tool to developing management to preserve the quality of groundwater. This study utilized the Geographic In- formation System technique and the DRASTIC model to assess the vulnerability of groundwater resources to contami- nation. The Geographic Information System (GIS) technology represents the best method to solve the main problems in the vulnerability survey. Indeed is allowed for swift organisation, quantification, and interpretation of large volumes of hydrological data with computer accuracy and minimal risk of human errors. The Visio model was exported and loaded into an ESRI Geodatabase in ArcCatalog as defined by the UML model. The purpose of this geodatabase is data har- monization process within modeling groundwater vulnerability to pollution. The resulting map shows evidence for three categories of vulnerability (low, middle and high). The resultant vulnerability map showed the predominant of moder- ately vulnerability class on the most of the Bekalta region which occupying an area of 68%. The low and high ground- water vulnerability classes occupy respectively an area of 30% and 2% of the total surface of the study area. Keywords: Phreatic Aquifer; Vulnerability; Pollution; GIS; Geodatabase; DRASTIC Model
1. Introduction
The use of GIS technology in the evaluation of aquifer vulnerability is necessary because GIS is a system for the acquisition, storage analysis, and display of geographic data. Groundwater can become contaminated naturally or because of numerous types of human activities. Residen- tial, municipal, commercial, industrial, and agricultural activities can all affect groundwater quality [1].
Groundwater contamination by nitrates is a worldwide problem mainly related to the excessive use of fertilizers in intensive agriculture [1,2].
The good climate and soil in the region Bekalta make the conditions excellent for agriculture, which consumes the highest portion of groundwater. Demand for water, mainly for agriculture has increased considerably over the last two decades, especially since 1994. Due to ex- cessive use of surface water and excessive abstraction of groundwater, local springs have dried up and water levels have been significantly lowered. The quality of ground- water has also been affected by over abstraction. Ground-
water of Bekalta has encountered high nitrate concentra- tion that exceeds 50 mg/l [3]. To ensure this aquifer to be water resource for the region of Bekalta, it is necessary to estimate which locations in this groundwater basin are more susceptible to receive and transport pollutions. Hence, groundwater vulnerability mapping becomes a crucial tool for quantifying the sensitivity of groundwater resources [4] to its environment and presents a visual tool for decision making, planning and law enforcement. The aim of this study is to assess groundwater vulnerability to pollution in the aquifer using the DRASTIC model [5] and geographical information system (ArcGIS) tech- niques in combination with seven data layers: Depth to groundwater, Recharge, Aquifer type, Soil type, Topog- raphy, Impact of the vadose zone, hydraulic Conduc- tivity.
The GIS framework consists of a scale-independent geodatabase to support vulnerability assessment tools. Custom tools automate the development and manipula- tion of model inputs, evaluation of outputs, maintenance
Copyright © 2013 SciRes. JGIS
A. EL HANINI ET AL. 243
of the project geodatabase, development and evaluation of models and model scenarios. The tool is flexible and scaleable, allowing for the user to update, define and refine models and model input parameters [6].
2. Study Area
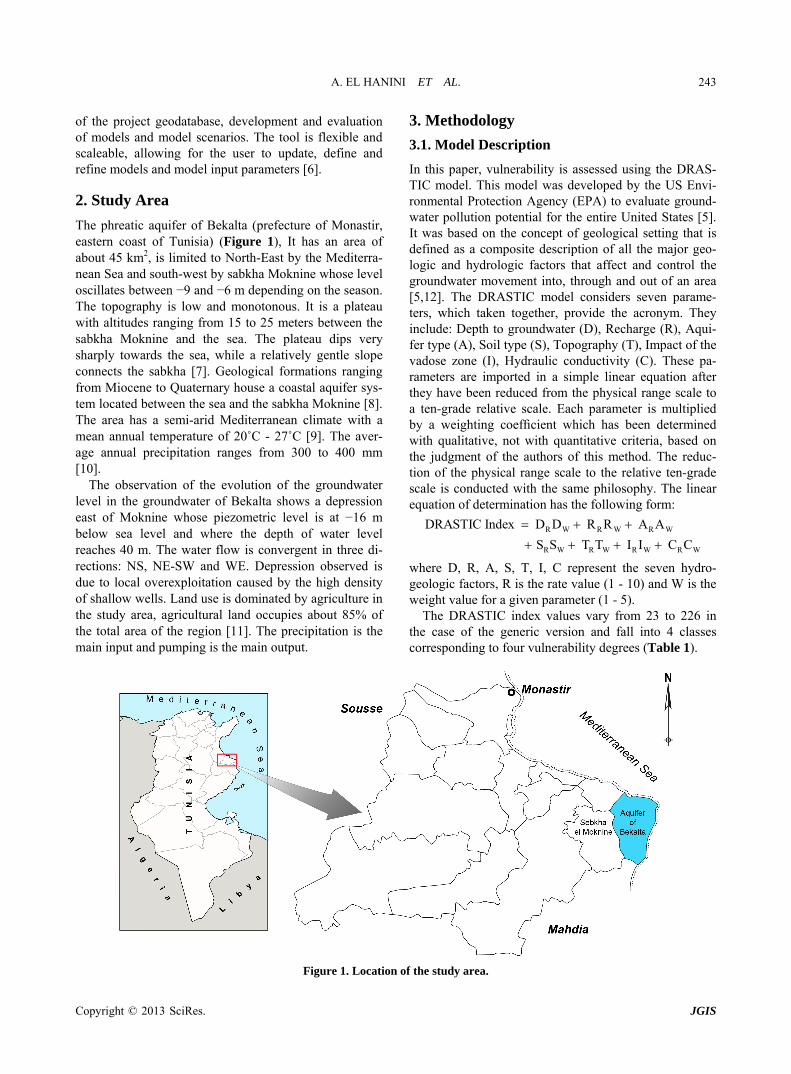
The phreatic aquifer of Bekalta (prefecture of Monastir, eastern coast of Tunisia) (Figure 1), It has an area of about 45 km2, is limited to North-East by the Mediterra- nean Sea and south-west by sabkha Moknine whose level oscillates between −9 and −6 m depending on the season. The topography is low and monotonous. It is a plateau with altitudes ranging from 15 to 25 meters between the sabkha Moknine and the sea. The plateau dips very sharply towards the sea, while a relatively gentle slope connects the sabkha [7]. Geological formations ranging from Miocene to Quaternary house a coastal aquifer sys- tem located between the sea and the sabkha Moknine [8]. The area has a semi-arid Mediterranean climate with a mean annual temperature of 20˚C - 27˚C [9]. The aver- age annual precipitation ranges from 300 to 400 mm [10].
The observation of the evolution of the groundwater level in the groundwater of Bekalta shows a depression east of Moknine whose piezometric level is at −16 m below sea level and where the depth of water level reaches 40 m. The water flow is convergent in three di- rections: NS, NE-SW and WE. Depression observed is due to local overexploitation caused by the high density of shallow wells. Land use is dominated by agriculture in the study area, agricultural land occupies about 85% of the total area of the region [11]. The precipitation is the main input and pumping is the main output.
3. Methodology
3.1. Model Description
In this paper, vulnerability is assessed using the DRAS- TIC model. This model was developed by the US Envi- ronmental Protection Agency (EPA) to evaluate ground- water pollution potential for the entire United States [5]. It was based on the concept of geological setting that is defined as a composite description of all the major geo- logic and hydrologic factors that affect and control the groundwater movement into, through and out of an area [5,12]. The DRASTIC model considers seven parame- ters, which taken together, provide the acronym. They include: Depth to groundwater (D), Recharge (R), Aqui- fer type (A), Soil type (S), Topography (T), Impact of the vadose zone (I), Hydraulic conductivity (C). These pa- rameters are imported in a simple linear equation after they have been reduced from the physical range scale to a ten-grade relative scale. Each parameter is multiplied by a weighting coefficient which has been determined with qualitative, not with quantitative criteria, based on the judgment of the authors of this method. The reduc- tion of the physical range scale to the relative ten-grade scale is conducted with the same philosophy. The linear equation of determination has the following form:
R W R W R W
R W R W R W R W
DRASTIC Index D D R R A A
S S T T I I C C
where D, R, A, S, T, I, C represent the seven hydro- geologic factors, R is the rate value (1 - 10) and W is the weight value for a given parameter (1 - 5).
The DRASTIC index values vary from 23 to 226 in the case of the generic version and fall into 4 classes corresponding to four vulnerability degrees (Table 1).
Figure 1. Location of the study area.
Copyright © 2013 SciRes. JGIS
A. EL HANINI ET AL. 244
3.2. Building a GIS Database
The conceptual data model (CDM) presented was con- structed using Microsoft Visio to create a UML (Unified Modeling Language) representation of the objects and relationships. Building a GIS database implies several steps to be followed. The first and the most important one is the creation of a conceptual data model which de- termines exactly the data that would be stored in the da- tabase, in what format (spatial or tabular data). A con- ceptual data model (CDM) is a diagram organized in a logical structure. The CDM for the groundwater geoda- tabase was built in UML language using MS Visio soft- ware.
The proposed structure database from the CDM is formed by seven modules each having interrelated object components: maps (soil type, land use, topography, ge- ology…), climatology (Precipitation, temperature...), hydrogeology (wells, drilling profiles, aquifer type…), hydrogeochemistry (nitrate…), tectonic (faults, dips…), Hydrology (wadis, sebkha…) and road networks (roads, track…).
The main morphological units for characterizing the aquifer are the groundwater bodies which are stored as polygons and represent the central object within Aquifers module. All other components like wells, hydro geologi- cal cross sections, lithological cross sections are con- nected to the groundwater bodies object. The wells are characterized by hydro geological, hydrochemical and
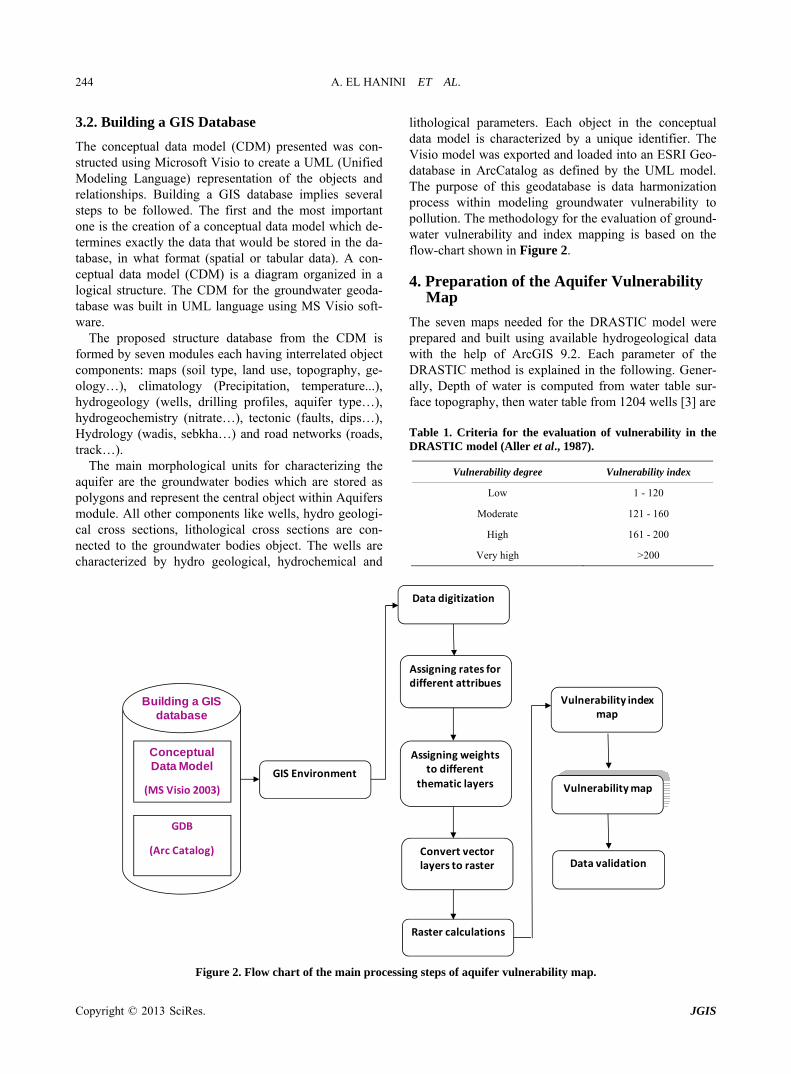
lithological parameters. Each object in the conceptual data model is characterized by a unique identifier. The Visio model was exported and loaded into an ESRI Geo- database in ArcCatalog as defined by the UML model. The purpose of this geodatabase is data harmonization process within modeling groundwater vulnerability to pollution. The methodology for the evaluation of ground- water vulnerability and index mapping is based on the flow-chart shown in Figure 2.
4. Preparation of the Aquifer Vulnerability Map
The seven maps needed for the DRASTIC model were prepared and built using available hydrogeological data with the help of ArcGIS 9.2. Each parameter of the DRASTIC method is explained in the following. Gener- ally, Depth of water is computed from water table sur- face topography, then water table from 1204 wells [3] are Table 1. Criteria for the evaluation of vulnerability in the DRASTIC model (Aller et al., 1987).
Vulnerability degree Vulnerability index
Low 1 - 120
Moderate 121 - 160
High 161 - 200
Very high >200
Data digitization
Assigning rates for different attribues
Conceptual Data Model
(MS Visio 2003)
GDB
(Arc Catalog)
Building a GIS database
GIS EnvironmentAssigning weights
to different thematic layers
Convert vector layers to raster
Raster calculations
Vulnerability map
Data validation
Vulnerability index map
Figure 2. Flow chart of the main processing steps of aquifer vulnerability map.
Copyright © 2013 SciRes. JGIS
A. EL HANINI ET AL. 245
digitized and interpolated to water values distributed in study area. To prepare the net recharge layer, by applying the [13] equation that take into account the amount of precipitation, irrigation and hydrologic soil groups. A hydrogeologic map of the study area was used to classify the aquifer media and was prepared from the field stud- ies, borehole data from 6 hydrogeological boreholes [3, 14].
For this study, the soil media of the basin was taken from soil map [3], and reclassified in order to meet the classification of the DRASTIC model. The surface slope map was established using the topographic map of Mok- nine 1/50,000 scale [15]. The digital elevation model (DEM) was used to extract the slope of the study area. The impact of vadose zone was obtained using drilling profiles from directorate of groundwater [3,14]. The hy- draulic conductivity of the aquifer has been determined referring to 9 values of hydraulic conductivity already mentioned. Moreover, we used the established map of aquifer lithology as a base to estimate the values of hy- draulic conductivity using [16].
The data that were finally used for the application of DRASTIC model are listed in Table 2. After the creation of the primary layers, the polygon data were classified into the certain classes (Table 2) and then they were converted to raster format (vector to raster conversion). The point data (depth to groundwater table and hydraulic conductivity) were interpolated using the Ordinary Krig- ing interpolator. Finally, the slope map was derived from the DEM of the study area. The seven produced raster
maps were reclassified using the assigned rates. Finally, the reclassified layers were used as input parameters for the raster calculator function. The DRASTIC index for the given area is calculated by multiplying each parame- ters ratings by the assigned weights that reflect the rela-tive contribution of each factor to the contamination process in general. The final vulnerability map was ob- tained by running the model in the ArcGIS 9.2 software in GIS environment by using the seven hydrogeological data layers The DRASTIC indices were first classified into ranges by imposing arbitrary thresholds.
5. Results and Discussion
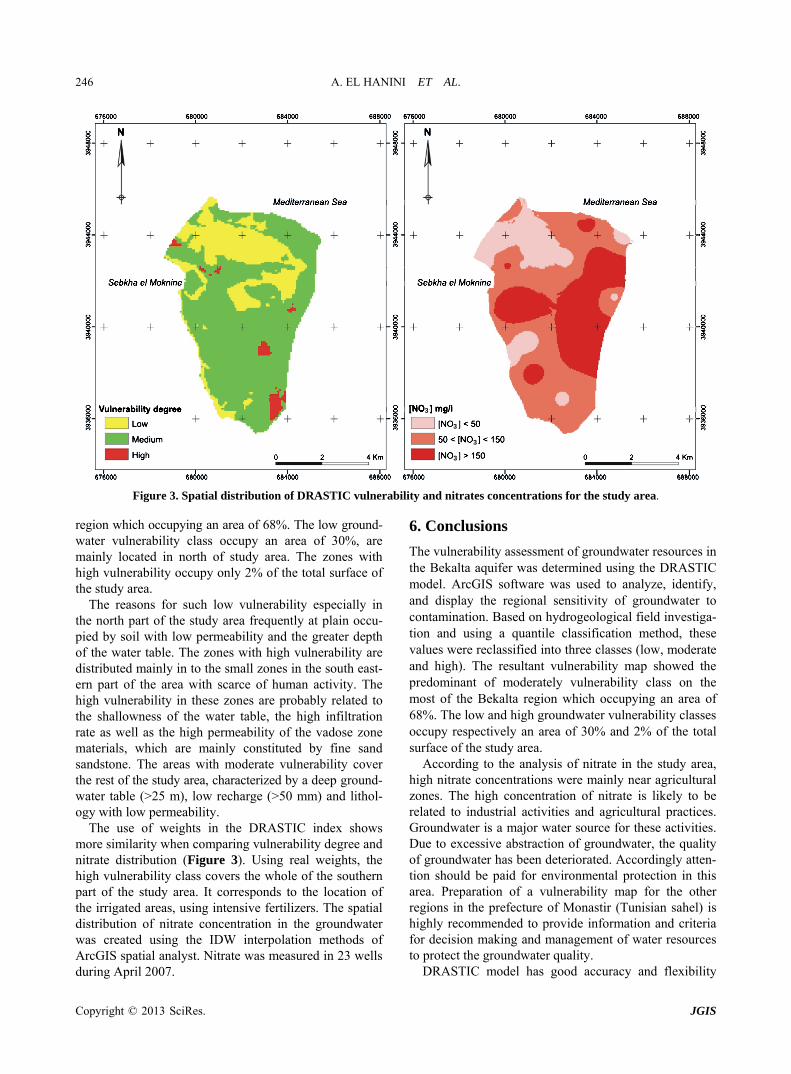
The final groundwater vulnerability map was obtained using the seven data layers in GIS environment (Figure 3). All parameter maps were converted into raster format and multiplied by their respective weights. The range of the DRASTIC vulnerability index in this studied was between 26 and 160. These values were reclassified into three classes using the quantile classification scheme: low vulnerable zones, moderate vulnerable zones and high vulnerable zones. According to the results of the groundwater vulnerability assessment, the study area can be divided into three zones: low groundwater vulnerabil- ity risk zone (risk index < 120); middle groundwater vulnerability risk zone (risk indexes 120 - 140), and high risk zone (risk index > 140) [17]. The DRASTIC aquifer vulnerability map (Figure 3) shows the predominant of moderately vulnerability class on the most of the Bekalta
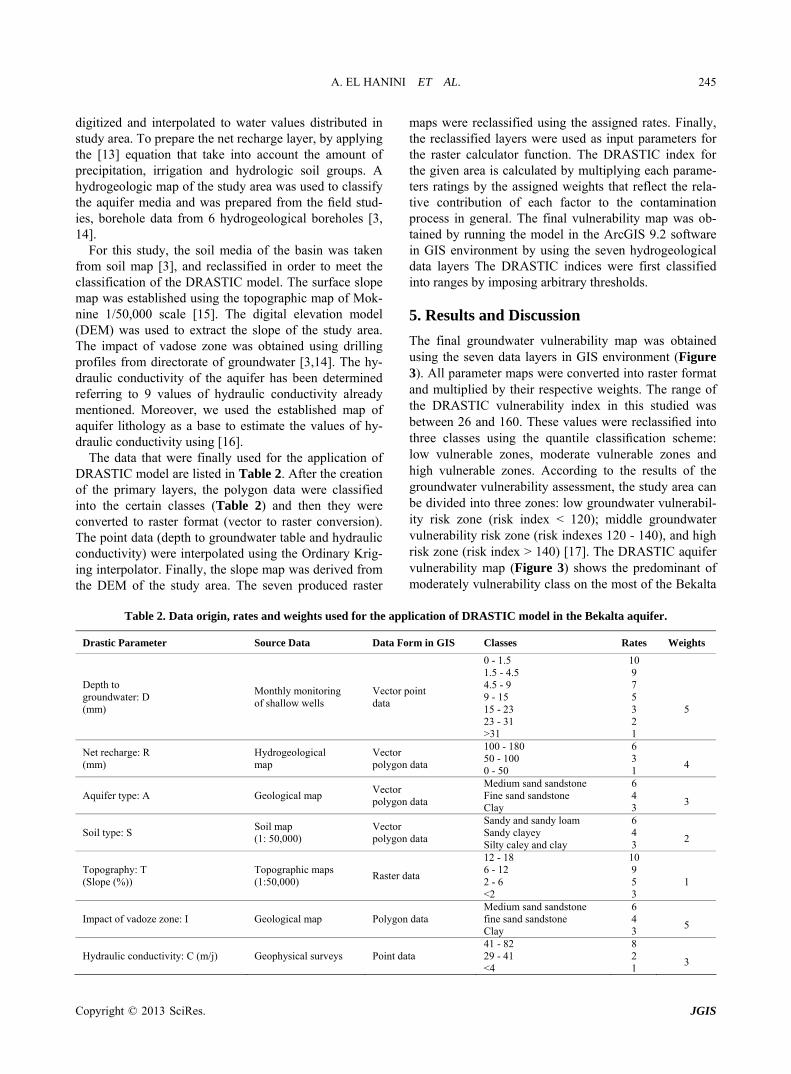
Table 2. Data origin, rates and weights used for the application of DRASTIC model in the Bekalta aquifer.
Drastic Parameter Source Data Data Form in GIS Classes Rates Weights
Depth to groundwater: D (mm)
Monthly monitoring of shallow wells
Vector point data
0 - 1.5 1.5 - 4.5 4.5 - 9 9 - 15 15 - 23 23 - 31 >31
10 9 7 5 3 2 1
5
Net recharge: R (mm)
Hydrogeological map
Vector polygon data
100 - 180 50 - 100 0 - 50
6 3 1
4
Aquifer type: A Geological map Vector polygon data
Medium sand sandstone Fine sand sandstone Clay
6 4 3
3
Soil type: S Soil map (1: 50,000)
Vector polygon data
Sandy and sandy loam Sandy clayey Silty caley and clay
6 4 3
2
Topography: T (Slope (%))
Topographic maps (1:50,000)
Raster data
12 - 18 6 - 12 2 - 6 <2
10 9 5 3
1
Impact of vadoze zone: I Geological map Polygon data Medium sand sandstone fine sand sandstone Clay
6 4 3
5
Hydraulic conductivity: C (m/j) Geophysical surveys Point data 41 - 82 29 - 41 <4
8 2 1
3
Copyright © 2013 SciRes. JGIS
A. EL HANINI ET AL. 246
3
3
3
3
Figure 3. Spatial distribution of DRASTIC vulnerability and nitrates concentrations for the study area. region which occupying an area of 68%. The low ground- water vulnerability class occupy an area of 30%, are mainly located in north of study area. The zones with high vulnerability occupy only 2% of the total surface of the study area.
The reasons for such low vulnerability especially in the north part of the study area frequently at plain occu- pied by soil with low permeability and the greater depth of the water table. The zones with high vulnerability are distributed mainly in to the small zones in the south east- ern part of the area with scarce of human activity. The high vulnerability in these zones are probably related to the shallowness of the water table, the high infiltration rate as well as the high permeability of the vadose zone materials, which are mainly constituted by fine sand sandstone. The areas with moderate vulnerability cover the rest of the study area, characterized by a deep ground- water table (>25 m), low recharge (>50 mm) and lithol- ogy with low permeability.
The use of weights in the DRASTIC index shows more similarity when comparing vulnerability degree and nitrate distribution (Figure 3). Using real weights, the high vulnerability class covers the whole of the southern part of the study area. It corresponds to the location of the irrigated areas, using intensive fertilizers. The spatial distribution of nitrate concentration in the groundwater was created using the IDW interpolation methods of ArcGIS spatial analyst. Nitrate was measured in 23 wells during April 2007.
6. Conclusions
The vulnerability assessment of groundwater resources in the Bekalta aquifer was determined using the DRASTIC model. ArcGIS software was used to analyze, identify, and display the regional sensitivity of groundwater to contamination. Based on hydrogeological field investiga- tion and using a quantile classification method, these values were reclassified into three classes (low, moderate and high). The resultant vulnerability map showed the predominant of moderately vulnerability class on the most of the Bekalta region which occupying an area of 68%. The low and high groundwater vulnerability classes occupy respectively an area of 30% and 2% of the total surface of the study area.
According to the analysis of nitrate in the study area, high nitrate concentrations were mainly near agricultural zones. The high concentration of nitrate is likely to be related to industrial activities and agricultural practices. Groundwater is a major water source for these activities. Due to excessive abstraction of groundwater, the quality of groundwater has been deteriorated. Accordingly atten- tion should be paid for environmental protection in this area. Preparation of a vulnerability map for the other regions in the prefecture of Monastir (Tunisian sahel) is highly recommended to provide information and criteria for decision making and management of water resources to protect the groundwater quality.
DRASTIC model has good accuracy and flexibility
Copyright © 2013 SciRes. JGIS
A. EL HANINI ET AL. 247
and is much more effective in geoenvironemental de- tailed study [18]. In this study, as a result, DRASTIC model output is considered an estimate of intrinsic vul- nerability because it relies only on physical hydrogeo- logic factors and does not include natural and human sources of contamination or behavior of specific con- taminants. Application of other models of vulnerability like SINTAC model and SI model is also necessary which is more frequently used in semi arid zones. How- ever, the map should be validated by groundwater flow models and/or statistical methods before interpretation and incorporated into the decision-making process.
For the development of the geodatabase, ArcGIS Model Builder is used in conjunction with custom de- signed Graphical User Interfaces (GUIs) in the construc- tion of an ArcGIS Desktop toolbox. The custom tools automate the development and manipulation of model inputs, evaluation of outputs, maintenance of the project geodatabase, the development and evaluation of models and model scenarios, and the implementation of vulner- ability assessments. The geodatabase data model is flexi- ble and scaleable, allowing for the user to update, define and refine model input parameters. The GIS technique has provided an efficient tool for assessing and analyzing the vulnerability to groundwater contamination. The stu- dy suggests that this model can be an effective tool for local authorities, water authority and decision makers who are responsible for managing groundwater resources.
REFERENCES [1] US EPA, “Wellhead Protection: A Guide for Small Com-
munities,” Office of Research and Development, Office of Water, Washington DC, 1993.
[2] World Health Organization, “Health Hazards from Ni- trates in Drinking Water,” WHO, Regional office for Europe.
[3] CRDA Monastir, “Agricultural Map of Monastir,” Direc- torate of Statistics, Ministry of Agriculture of Tunisia, Tunis, 2007.
[4] A. Rahman, “A GIS Based DRASTIC Model for Assess- ing Groundwater Vulnerability in Shallow Aquifer in Ali- garh, India,” Applied Geography, Vol. 28, No. 1, 2008, p. 32e53.
[5] L. Aller, T. Bennet, J. H. Leher, R. J. Petty and G. Hack- ett, “DRASTIC: A Standardized System For Evaluating Ground Water Pollution Potential Using Hydrogeological Settings,” EPA 600/2-87-035, 1987, p. 622.
[6] A. Singh, T. Jones, J. Pickens and R. M. Holt, “WRVAT:
A Comprehensive GIS-Based Water Resources Vulner-ability Assessment Tool,” Gulf Coast Association of Geo- logical Societies Transactions, Vol. 62, 2012, pp. 615- 618.
[7] D.Ben Salah, M. Besbes, G. De Marsily, L. Moullard and H. Zebidi, “Artificial Recharge Wells for Regeneration and Conservation of Coastal Aquifer Teboulba,” 3rd In- ternational Symposium on Groundwater, Palermo, 1975, p. 10.
[8] R. Amri, “Note on Water Resources in the Prefecture of Monastir,” Internal Report, DGRE of Tunisia, Tunis, 1990, p. 11.
[9] INM (National Institute of Meteorology), “Monthly Cli- matological Tables,” Station of Monastir, Tunis, 2007.
[10] DGRE (General Directorate of Water Resources), “Pie- zometric Directory of Tunisia,” DGRE, Tunis, 2007.
[11] CRDA Monastir, “Notes Relating to the Internal Data of Agricultural Activities of the Prefecture of Monastir,” Ministry of Agriculture, Tunis, 1999.
[12] K. A. Musa, J. M. Akhir and I. Abdullah, “Groundwater Prediction Potential Zone in Langat Basin Using the Inte- gration of Remote Sensing and GIS,” 2000. www.GISdevelopment.net
[13] J. R. Williams and D. E. Kissel, “Water Percolation: An Indicator of Nitrogen-leaching Potential in Managing Ni- trogen for Groundwater Quality and Farm Profitability,” In: R. F. Follett, D. R. Keeney and R. M. Cruse, Eds., Soil Science Society of America, Madison Inc., Wisconsin, 1991, pp. 59-83.
[14] A. Ferjani and R. Amri, “Report of Work Completion of Drilling: Groundwater Level of Téboulba Aquifer, Pre- fecture of Monastir,” Internal Report No. 18951/4, 1992, p. 6.
[15] OTC (Office of Topography and Cartography), “Topog- raphic Map of Tunisia 1:50,000,” Sheet of Moknine No. 66, Tunis, 1994.
[16] R. Rodriguez, R. Reyes, J. Rosales, J. Berlin, J. A. Mejia and A. Ramos, “Structuring of Thematic Maps of Ground- water Vulnerability Indices of the Urban Area of Sala- manca Gto., City of Salamanca,” CEAG, IGF-UNAM Technical Report, Mexico, 2001, p. 120,
[17] B. A. Engel, K. C. S. Navulur, B. S. Cooper and L. Hahn, “Estimating Groundwater Vulnerability to Non-Point Source Pollution from Nitrates and Pesticides on a Re- gional Scale,” IAHS Publication, 1996, pp. 521-526.
[18] R. C. Gogu and A. Dassargues, “Current trends and Fu- ture Challenges in Groundwater Vulnerability Assess- ment Using Overlay and Index Methods,” Environmental Geology, Vol. 39, No. 6, 2000, pp. 549-559. http://dx.doi.org/10.1007/s002540050466
Copyright © 2013 SciRes. JGIS