A geolinguistic approach for comprehending local influence ... geolinguistic approach for...
26
Quinn, S. - A Geolinguistic Approach for Comprehending Local Influence in OpenStreetMap 1 This document is an author's accepted version of an article that was published in Cartographica in Summer 2016. The final publication is available through University of Toronto Press at http://www.utpjournals.press/doi/abs/10.3138/cart.51.2.3301. A geolinguistic approach for comprehending local influence in OpenStreetMap Sterling Quinn Department of Geography The Pennsylvania State University Abstract OpenStreetMap (OSM) thrives on allowing anyone in the world to contribute features to a free online geographic database, thereby allowing international mixes of contributors to create the map in any given place. Using South America as a test area, I explore the geography of OSM contributors by applying automated language identification to the free-form comments that contributors make when saving their work. By cross-referencing these languages with self- reported hometowns from user profiles, I evaluate the effectiveness of language detection as a method for inferring the percentage of local contributors versus the percentage of "armchair mappers" from elsewhere. I show that most English-speaking contributors to the South American OSM are from outside the continent (rather than multilingual locals). The percentage of English usage is higher in poor areas and rural areas, suggesting that residents of these places exercise less control over their map contents. Finally, I demonstrate that some features related to daily needs of health, education, and transportation are mapped with higher priority by contributors who speak the local language. These findings give researchers and organizations a deeper understanding of the OSM contributor base and potential shortcomings that might affect the data's fitness for use in any given place. Keywords volunteered geographic information, OpenStreetMap, language identification, digital divides, South America, Latin America
Transcript of A geolinguistic approach for comprehending local influence ... geolinguistic approach for...
Quinn, S. - A Geolinguistic Approach for Comprehending Local Influence in OpenStreetMap
1
This document is an author's accepted version of an article that was published in Cartographica in
Summer 2016. The final publication is available through University of Toronto Press at
http://www.utpjournals.press/doi/abs/10.3138/cart.51.2.3301.
A geolinguistic approach for comprehending local influence in
OpenStreetMap
Sterling Quinn Department of Geography
The Pennsylvania State University
Abstract
OpenStreetMap (OSM) thrives on allowing anyone in the world to contribute features to a free
online geographic database, thereby allowing international mixes of contributors to create the
map in any given place. Using South America as a test area, I explore the geography of OSM
contributors by applying automated language identification to the free-form comments that
contributors make when saving their work. By cross-referencing these languages with self-
reported hometowns from user profiles, I evaluate the effectiveness of language detection as a
method for inferring the percentage of local contributors versus the percentage of "armchair
mappers" from elsewhere. I show that most English-speaking contributors to the South American
OSM are from outside the continent (rather than multilingual locals). The percentage of English
usage is higher in poor areas and rural areas, suggesting that residents of these places exercise
less control over their map contents. Finally, I demonstrate that some features related to daily
needs of health, education, and transportation are mapped with higher priority by contributors
who speak the local language. These findings give researchers and organizations a deeper
understanding of the OSM contributor base and potential shortcomings that might affect the
data's fitness for use in any given place.
Keywords
volunteered geographic information, OpenStreetMap, language identification, digital divides,
South America, Latin America
Quinn, S. - A Geolinguistic Approach for Comprehending Local Influence in OpenStreetMap
2
1. Introduction
Volunteered geographic information (VGI) by one of its earliest definitions relies on citizens as
sensors to gather information about the world around them (Goodchild, 2007). It is tempting to
think of these citizens as a data collecting army, sweeping the globe almost like a satellite in an
orchestrated march toward recording and filing away information about everything observed.
With such a view, it can be easily forgotten that these citizen sensors exhibit calibrations,
capabilities, and geographic distributions that are in no way uniform. Unguided by algorithms or
code, each brings their own experiences, motives, and geographies the data collection process.
Factors such as gender, income, technical skill, travel experience, love of a particular place,
personal hobbies, and work-related requirements may affect the items that contributors prioritize
in the map. This paper focuses on how VGI contributors' places of residence influence the
collected data in a particular region, specifically examining the geographic distribution of local
versus nonlocal contributors and the types of map features prioritized by each.
The OpenStreetMap project (OSM) is an especially suitable laboratory for studying the
ways that contributor location affects VGI. OpenStreetMap is a digital map of the world wherein
any person with an Internet connection is invited to share information about the coordinates and
attributes of any place. All contributions are poured into a single online geographic database that
can be downloaded and represented in different ways by cartographers and GIS analysts. When
viewing cartographic depictions of OSM, it is easy to overlook the fact that the data is a
patchwork affair of contributions from editors in different places with different resources and
motives.
For example, contributors who have never visited a place can still add to OSM by tracing
items from satellite and aerial photography, which is often freely included as a background layer
in the OSM editing programs. This "armchair mapping" approach is convenient when no other
information is available, and has often been employed in humanitarian situations when a vector
map of roads and infrastructure is needed in a hurry (Zook and others, 2010); however, tracing
imagery alone limits the categories of entities that can be discerned for addition to the map. This
inevitably results in a shallower product. Long before OSM and the popular uptake of the World
Wide Web, Harley (1990) warned of the loss of cartographic information that could result from
replacing field surveys with a heavier reliance on remotely sensed imagery. Contributors can
perhaps get this "field" knowledge of remote places through vacations, tours, business trips,
educational excursions, humanitarian service, or military experience. But beyond even this, I
propose that there remain integral aspects of everyday human routines that are still stubbornly
difficult to collect without the participation of people who spend long periods of time living in or
near the mapped area, and that a greater level of participation by local residents raises the
priority given in OSM toward mapping these everyday needs.
But how can it be known whether a contributor is "local", and how does the presence of
local contributors vary across space? A challenge of studying the geographies of OSM
contribution is that OSM itself does not directly store or depict any information about contributor
location. In this paper I study the degree to which this barrier can be overcome by identifying
and mapping patterns of language use among contributors. These geolinguistic contours can
reveal subtleties in local participation patterns previously missed by coarser-grained reports. For
example, it is known that the Global North dominates in the production of digital information
(Graham and others, 2014, 2015), and that this pattern holds true in OSM in the sense that most
Quinn, S. - A Geolinguistic Approach for Comprehending Local Influence in OpenStreetMap
3
contributors are from Europe and North America (Neis and Zipf, 2012); however, less attention
has been given to the finer-grained geographies of OSM participation occurring in the Global
South. My research indicates that some areas in the Global South maintain a substantial
percentage of local OSM contributors, while other areas appear to be created mostly by armchair
mappers working from afar.
The objectives of this research are threefold, all working toward the goal of shedding
light on the spatial distributions of OSM contributors and the ways that their locations affect map
contents. First, I evaluate a method for detecting the relative amount of local influence in OSM,
by analyzing the languages contributors use when they make metadata comments about their
edits. Second, I map and interpret spatial patterns in language use among OSM contributors,
focusing particularly on the use of English and its relationship to other sociodemographic
variables such as income and rurality. Third, I determine which types of entities in OSM are
highly prioritized by local language contributors versus those prioritized by nonlocal language
contributors.
I use South America as a study area for these efforts, due to its manageable number of
languages, its small percentage of English speakers, and the dearth of academic research on
OSM in the Global South in general. Selecting an entire continent for analysis allows for some
comparison between countries and regions, and permits follow-up at finer-grained scales.
Finally, South America is a place where wide variations in OSM coverage are visible as one
navigates across cities and countries. Some metropolis's are missing entire neighborhoods or just
have basic features traced from aerial photographs, while in other locations it appears that
mappers with an intimate knowledge of local neighborhoods have dedicated much time and
energy toward the map.
Beyond evaluating a new method to assess the local character of OSM edits, this study
shines a light on the data integrity of OSM, or at least perceived integrity, in a region where the
map has not received much scholarly attention. A large percentage of contributions coming from
outside the locality may engender concerns of error, bias, or vandalism, whether intentional or
unintentional. The results of this research will help local organizations better understand the
fitness-for-use of OSM for their projects, while also guiding OSM communities to the places and
contributors that might benefit from further attention. The study also explores the potential for
local contributors to generate kinds of information critical to the health of communities that may
be missed by top-down institutional mapping efforts.
2. Background and related theory
Although the terms of use and contribution for an online collaborative project such as OSM
might be wide open from a strictly legal standpoint, the project itself might remain inaccessible
to many. Graham and others (2014) showed that access to broadband is necessary for achieving
high levels of user-generated content, but noted that connectivity alone does not resolve gaps in
representation and participation, nor does it immediately change cultural attitudes toward the
technology. For OSM contributors, some degree of English language knowledge is required to
understand the tagging metadata applied to geometric features to associate them with real-world
entities. For example, a tag of amenity=school applied to a point or polygon identifies a school.
These tags are not translated into other languages, since they are frequently read and interpreted
by automated computer programs.
Quinn, S. - A Geolinguistic Approach for Comprehending Local Influence in OpenStreetMap
4
A mapping project such as OSM may therefore be lacking contributions by local
residents in places where English is not widely spoken, perhaps missing some of the features that
would be helpful in meeting the needs of residents, such as transportation, civil services, and
health care options. These omissions can be hard to notice in cases where the map already
appears "full" of data contributed by nonlocal residents tracing aerial imagery or other persons
importing bulk datasets from a national or provincial scale. Challenging the notion that
neogeography efforts such as OSM reflect a fully "democratized" product, Haklay (2013, p. 67)
remarked, " we need to take into account the everyday geography of communities in streets,
villages, and slums and find ways to ensure that the technical codes of neogeography provide the
space for the voices from these places to be heard and represented." In this spirit, Elwood (2008)
observes that the presence of VGI is a marker of inclusion and empowerment for the people and
places it represents.
This reflects a hope that a wider group of citizen sensors will contribute information
about the world around them, and in the Global South, this means residents of the Global South.
A notable effort of this sort is described by Hagen (2010), wherein local residents of a Nairobi
slum mapped clinics, potable water outlets, toilets, places of worship, and other points of interest
that would help to meet local basic needs and provide evidence of the community's existence
when lobbying for civil services. Also common in OSM is that a single enthusiastic contributor
will take it upon his or her-self to map a neighborhood or hometown in great detail, providing
information only obtainable on the ground such as street names, house numbers, business names,
and so forth. These efforts realize a vision by Crampton (2009) and other critical cartographers
of open source tools being employed by the disempowered for the advancement of counter-
knowledges and counter-mapping, thereby lending evidence to Harley's (1988) assertion that
"there is no such thing as an empty space on a map".
Because of VGI's reliance on self-selected human sensors, projects such as OSM pose
special geographic questions for study. Each contributor brings knowledge of a unique set of
places. In particular this includes locations where the contributor has lived, but the realm of
known places may also extend across the globe for people who have traveled often or who are
able to interpret and trace aerial photography. The number of contributors and their collective
platial knowledge vary across any chosen extent or scale within the map.
This mix of contributors and their places of expertise are often unknown to the end user
of the VGI. In many cases, GIS analysts and cartographers are accustomed to using datasets
gathered by relatively small groups of highly trained individuals who use strict quality control
procedures and carefully calibrated equipment. Although these individuals may not have
personal experience in the places being mapped, they employ systematic data collection
techniques to retrieve the needed information. When making a switch to VGI, it can be easy to
forget how radically the data collection procedures differ from these more traditional datasets.
The approach in VGI is bottom-up, rather than top-down, opening up doors to represent new
places and people, but also holding the potential for human omissions and idiosyncrasies to slip
into the map.
I have observed that professionals encountering OSM online often do not understand or
question the human biases and variations in the data as long as it appears complete on the
surface. Yet, a visually "busy" map can mask deficiencies in the data that affect the map's
usefulness for certain purposes (Quest 2014). The unstructured nature of the contributors is
disguised by the uniform digital symbols and labels used across the extent of the map, and may
be easily forgotten or neglected by organizations considering the data for practical applications
Quinn, S. - A Geolinguistic Approach for Comprehending Local Influence in OpenStreetMap
5
such as disaster response, routing, urban planning, or scientific research. This is not a trivial
issue, because the digital map itself can affect users' perceptions, use, and (re)production of
physical space (Zook and Graham 2007; Graham, Zook, and Boulton 2013). For example, we
can imagine that a restaurant, church, garden, or other amenity placed on the digital map might
attract more attention in the physical world than its unmapped counterparts, thus strengthening
its role in the creation of the place.
2.1 Who is mapping whom in OSM?
By far OSM's largest contributor base is in Europe (Neis and Zipf 2012), where the project was
founded as an open source alternative to the fee-laden GIS data offered by government
organizations such as the UK Ordnance Survey. A now sizable list of academic investigations
including Haklay (2010), Girres and Touya (2012), and Neis, Zielstra, and Zipf (2011) has
shown that in numerous European cities, OSM coverage and precisional accuracy meet or exceed
that of institutionally-produced alternatives. At the same time, other regions of the world have
seen comparatively little activity in OSM (Latif et al. 2011; Neis, Zielstra, and Zipf 2013). In
many cases these stagnant areas appear to be places with less wealth, following a pattern Haklay
(2010) observed of deprived regions in the UK receiving less attention in OSM.
When viewing OSM in these regions where the map is still developing, it is natural to ask
how much of the contributed information is coming from Europe or elsewhere overseas, and how
much is coming from a local audience. Furthermore, it makes sense to investigate the different
ways in which local and nonlocal contributors affect the character of the data contributed to
OSM. Ultimately this is a question of who is mapping whom, relating to the myriad lived
experiences and knowledges of place brought to the map by unique cultures and peoples. These
questions are not limited to geographical locations of contributors. Stephens (2013) noted ways
that the wide gender imbalance in OSM contributors affects not only the prevalence of certain
types of entities in OSM, but also the community voting processes that determine the accepted
ontologies of entities. Her conclusion that "In a map or be mapped world, men are mapping and
women are being mapped" provoked self-reflection within the VGI community (Wright 2013,
Leszczynski and Wilson 2013).
Could similar differences in map content exist when populations in one locale are
mapping populations in another locale? How is a map made by locals different from a map that
is made largely by external influence? The web in general is affected by geographic disparities in
the quantity and focus of user-generated content, a phenomenon which can be sometimes be
detected by considering regions of language use. In their study of languages used in Google
Maps-indexed content, Graham and Zook (2013) observe that "the digital footprints of languages
on the geoweb are readily visualized and in some cases can be particularly sharp" (p. 89), and
"not only does the density of linguistic footprints vary over space, but their potential objects of
attention also differ substantially" (p. 91 – 92, emphasis added). The methods and results below
explore the extent to which geolinguistic patterns can infer the degree of local participation in
OSM across space, while attempting to better understand how this geographic distribution of
OSM contributors affects the end data product.
Quinn, S. - A Geolinguistic Approach for Comprehending Local Influence in OpenStreetMap
6
3. Language identification of OSM contributor comments as a means of assessing local
influence
Contributor locations are not systematically reported in any of the OSM data or metadata;
therefore, other clues must be exploited in order to gain some kind of picture of the geographic
distribution of OSM contributors. The OSM system administrators have access to the IP
addresses of contributors (revealed in articles such as Maron, Slater, and Coast 2012) which
could be geocoded to map contributor locations; however, these addresses are not available with
the same degree of open access as the OSM data itself. Another means of detecting contributor
locations would be to examine the thousands of user-created wiki and profile pages created by
OSM contributors, some of which contain autobiographical information revealing the user's
hometown (eg, "I'm a software engineer in Rio de Janeiro, Brazil"). This technique is not very
scalable and it misses the large percentage of users who do not create any profile; however, it
does provide some measure of "ground truth" that can be used to evaluate other methods.
As a case in point, whenever OSM contributors save their work (a unit of contribution
known as a "changeset"), they are invited to leave a message describing their edits. Contributors
use this opportunity to supply the rationale, evidence, or justification behind the set of changes
they are saving. These changeset comments are written in a great variety of languages and are
linked to the geographic coordinates of the changesets. I propose that the languages used in these
comments could be detected by automated software and then cross-matched against self-reported
locations in OSM user profiles to understand how much local and nonlocal influence is
associated with each language. This analysis could offer insights about the geographic
distribution of OSM contributors in a region, as well as the types of entities favored by these
contributors in their volunteer mappings.
Changeset comments range from empty space to abbreviated notes to verbose prose. All
of the messages are saved in the full changeset history file made available to the public at
planet.osm.org. In addition to the contributor comments, the changeset metadata includes the
geographic bounding box of the edits. The bounding box can be used to map the general location
of the changes. Each changeset also has a unique ID that can be linked with items in the OSM
full history dump files to examine the actual geometry and attribute modifications in greater
detail. The methods described below take advantage of each of these pieces of information.
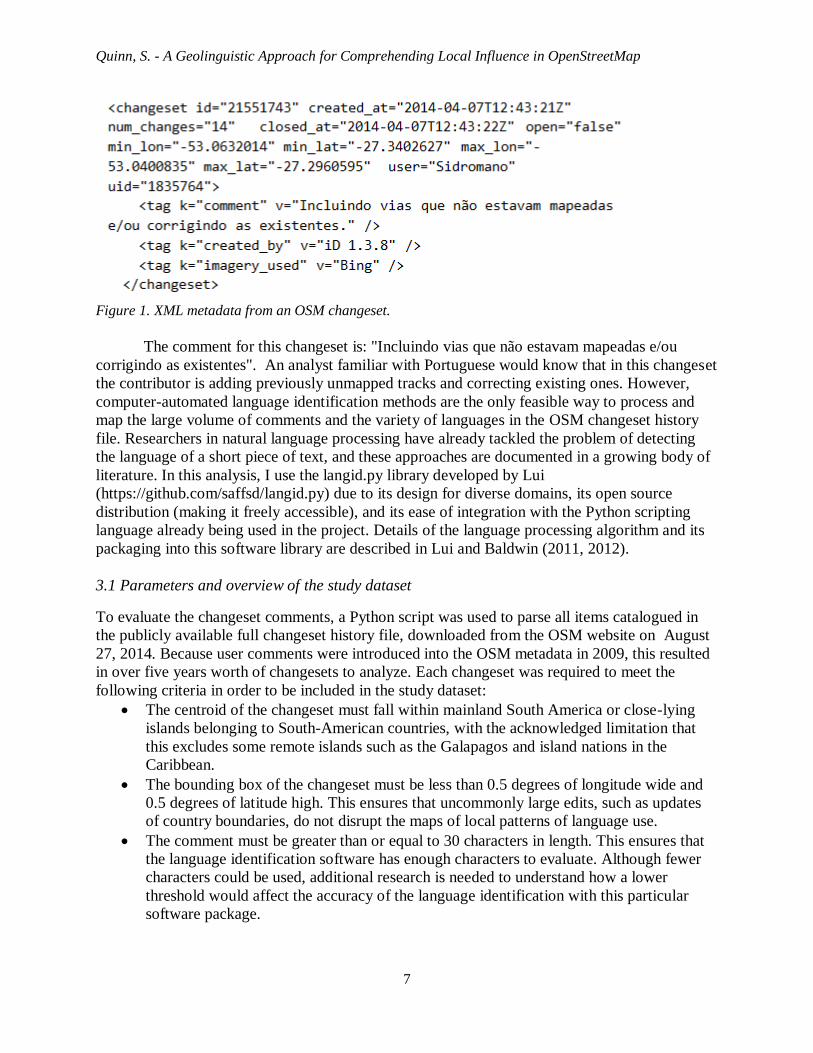
Figure 1 shows the metadata for a single changeset taken from the full changeset history.
The XML shows that the changeset has an ID number of 21551743 and was made by user
Sidromano on April 7, 2014 in southern Brazil. The changeset affected 14 features and the editor
used was the iD browser-based editor, version 1.3.8, with Bing Maps imagery in the background.
Quinn, S. - A Geolinguistic Approach for Comprehending Local Influence in OpenStreetMap
7
Figure 1. XML metadata from an OSM changeset.
The comment for this changeset is: "Incluindo vias que não estavam mapeadas e/ou
corrigindo as existentes". An analyst familiar with Portuguese would know that in this changeset
the contributor is adding previously unmapped tracks and correcting existing ones. However,
computer-automated language identification methods are the only feasible way to process and
map the large volume of comments and the variety of languages in the OSM changeset history
file. Researchers in natural language processing have already tackled the problem of detecting
the language of a short piece of text, and these approaches are documented in a growing body of
literature. In this analysis, I use the langid.py library developed by Lui
(https://github.com/saffsd/langid.py) due to its design for diverse domains, its open source
distribution (making it freely accessible), and its ease of integration with the Python scripting
language already being used in the project. Details of the language processing algorithm and its
packaging into this software library are described in Lui and Baldwin (2011, 2012).
3.1 Parameters and overview of the study dataset
To evaluate the changeset comments, a Python script was used to parse all items catalogued in
the publicly available full changeset history file, downloaded from the OSM website on August
27, 2014. Because user comments were introduced into the OSM metadata in 2009, this resulted
in over five years worth of changesets to analyze. Each changeset was required to meet the
following criteria in order to be included in the study dataset:
The centroid of the changeset must fall within mainland South America or close-lying
islands belonging to South-American countries, with the acknowledged limitation that
this excludes some remote islands such as the Galapagos and island nations in the
Caribbean.
The bounding box of the changeset must be less than 0.5 degrees of longitude wide and
0.5 degrees of latitude high. This ensures that uncommonly large edits, such as updates
of country boundaries, do not disrupt the maps of local patterns of language use.
The comment must be greater than or equal to 30 characters in length. This ensures that
the language identification software has enough characters to evaluate. Although fewer
characters could be used, additional research is needed to understand how a lower
threshold would affect the accuracy of the language identification with this particular
software package.
Quinn, S. - A Geolinguistic Approach for Comprehending Local Influence in OpenStreetMap
8
The comment must not contain more than two commas. Some contributors just fill the
comment with a comma-separated list of places edited, and these lists convey nothing
about the contributor's language of choice.
The language identification must receive a confidence score of greater than 0.99 from the
langid.py software. The software has a built-in system of evaluating how confident it is
that the identification succeeded. This metric can be used as a threshold for eliminating
records whose language was indiscernible. Although a value of 0.99 may seem high, the
intent was to start with the records that the software thought it evaluated correctly and
evaluate its performance from that point.
The changeset must not originate from the OpenStreetMap Foundation as part of the
2012 data redaction. This redaction consisted of batch edits related to the implementation
of a new OSM license (Wood 2012). All of these messages have the same text and are
commented in English. Including these would bias the rest of the analysis.
Out of all changesets meeting the above criteria, I selected those whose comments were
identified by the langid.py software as being written in Dutch, English, French, German,
Portuguese, or Spanish. Five of these are the major language of at least one South American
country, whereas the remaining one (German) is spoken by a sizable body of OpenStreetMap
contributors (Neis and Zipf 2012) and was therefore anticipated to have at least some presence
on the South American map.
This filtering resulted in a final study dataset consisting of 103,266 changesets for
analysis. These were created by 6,502 unique contributors, with a median of 2 changesets per
contributor. It should be noted that a total of 1,546 (1.5%) of the changesets that met all other
filter criteria were removed because the software detected some language other than the six
target languages. Although it is likely that some of these are miscoded instances of the target
languages and could be detected and corrected manually, the purpose of this study is to test the
effectiveness of an automated method. Although the filtering process reduced the number of
available changesets that could be analyzed, the result was still a large and geographically
representative sample of changesets.
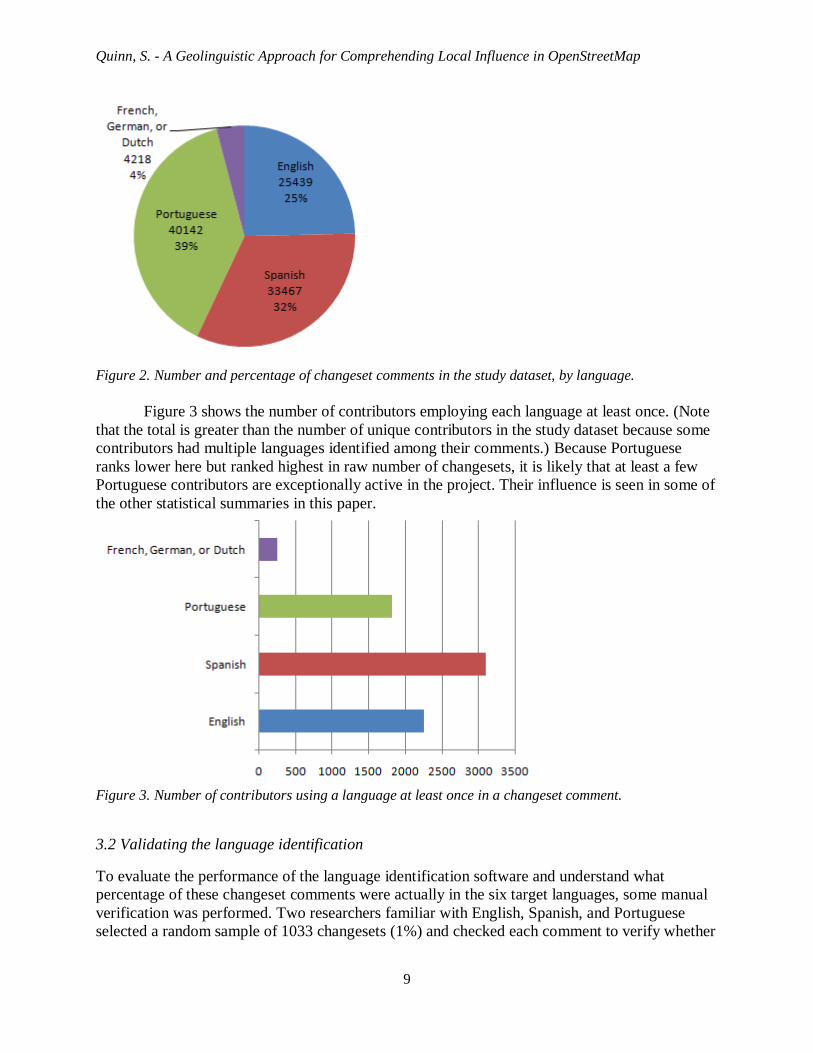
Figure 2 shows the number and percentage of changeset comments identified for each
language. Portuguese is dominant here, followed by Spanish and then English. The French,
German, and Dutch changesets make up about 4% of the total. Note that any of the languages
excluded from the analysis (even if they were miscoded instances of the target languages), would
constitute less than 2% of the pie if they had been included here.
Quinn, S. - A Geolinguistic Approach for Comprehending Local Influence in OpenStreetMap
9
Figure 2. Number and percentage of changeset comments in the study dataset, by language.
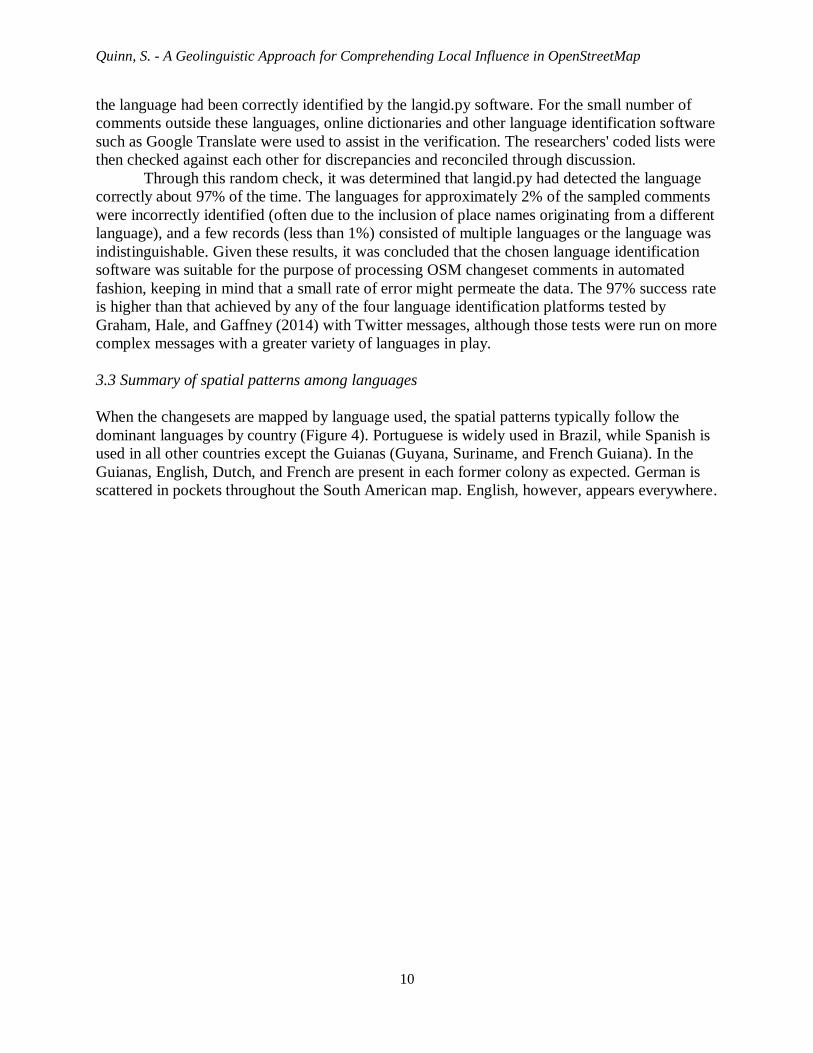
Figure 3 shows the number of contributors employing each language at least once. (Note
that the total is greater than the number of unique contributors in the study dataset because some
contributors had multiple languages identified among their comments.) Because Portuguese
ranks lower here but ranked highest in raw number of changesets, it is likely that at least a few
Portuguese contributors are exceptionally active in the project. Their influence is seen in some of
the other statistical summaries in this paper.
Figure 3. Number of contributors using a language at least once in a changeset comment.
3.2 Validating the language identification
To evaluate the performance of the language identification software and understand what
percentage of these changeset comments were actually in the six target languages, some manual
verification was performed. Two researchers familiar with English, Spanish, and Portuguese
selected a random sample of 1033 changesets (1%) and checked each comment to verify whether
Quinn, S. - A Geolinguistic Approach for Comprehending Local Influence in OpenStreetMap
10
the language had been correctly identified by the langid.py software. For the small number of
comments outside these languages, online dictionaries and other language identification software
such as Google Translate were used to assist in the verification. The researchers' coded lists were
then checked against each other for discrepancies and reconciled through discussion.
Through this random check, it was determined that langid.py had detected the language
correctly about 97% of the time. The languages for approximately 2% of the sampled comments
were incorrectly identified (often due to the inclusion of place names originating from a different
language), and a few records (less than 1%) consisted of multiple languages or the language was
indistinguishable. Given these results, it was concluded that the chosen language identification
software was suitable for the purpose of processing OSM changeset comments in automated
fashion, keeping in mind that a small rate of error might permeate the data. The 97% success rate
is higher than that achieved by any of the four language identification platforms tested by
Graham, Hale, and Gaffney (2014) with Twitter messages, although those tests were run on more
complex messages with a greater variety of languages in play.
3.3 Summary of spatial patterns among languages
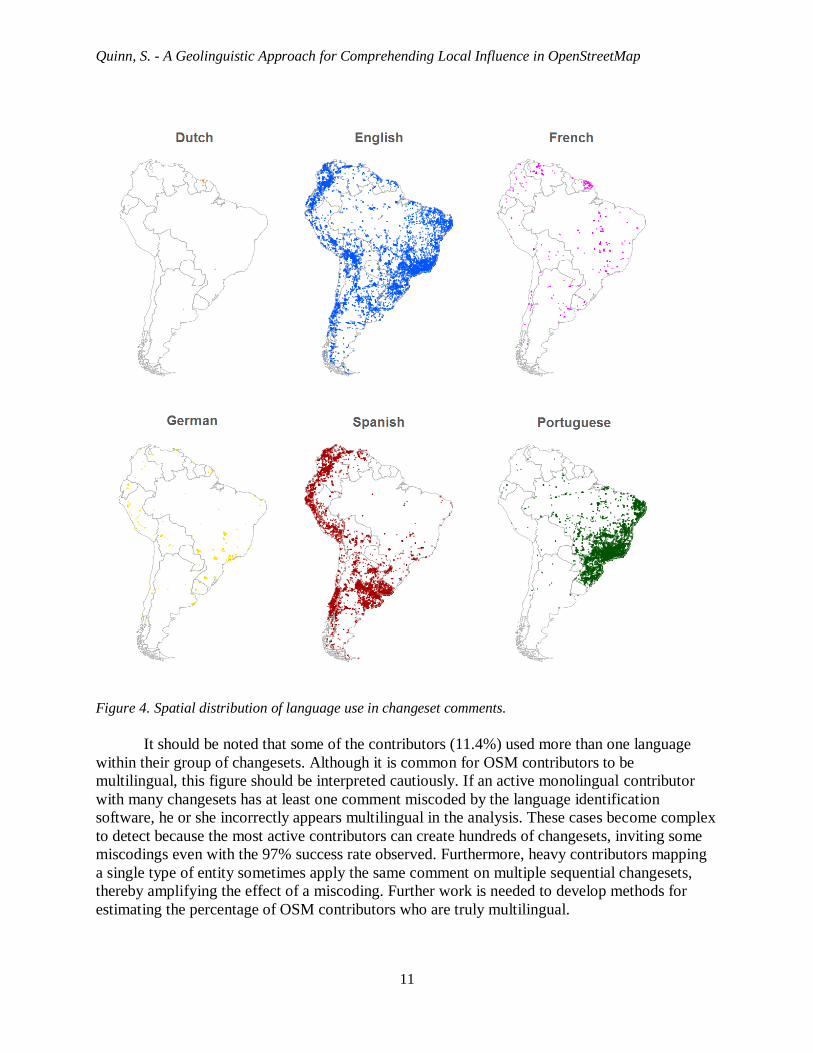
When the changesets are mapped by language used, the spatial patterns typically follow the
dominant languages by country (Figure 4). Portuguese is widely used in Brazil, while Spanish is
used in all other countries except the Guianas (Guyana, Suriname, and French Guiana). In the
Guianas, English, Dutch, and French are present in each former colony as expected. German is
scattered in pockets throughout the South American map. English, however, appears everywhere.
Quinn, S. - A Geolinguistic Approach for Comprehending Local Influence in OpenStreetMap
11
Figure 4. Spatial distribution of language use in changeset comments.
It should be noted that some of the contributors (11.4%) used more than one language
within their group of changesets. Although it is common for OSM contributors to be
multilingual, this figure should be interpreted cautiously. If an active monolingual contributor
with many changesets has at least one comment miscoded by the language identification
software, he or she incorrectly appears multilingual in the analysis. These cases become complex
to detect because the most active contributors can create hundreds of changesets, inviting some
miscodings even with the 97% success rate observed. Furthermore, heavy contributors mapping
a single type of entity sometimes apply the same comment on multiple sequential changesets,
thereby amplifying the effect of a miscoding. Further work is needed to develop methods for
estimating the percentage of OSM contributors who are truly multilingual.
Quinn, S. - A Geolinguistic Approach for Comprehending Local Influence in OpenStreetMap
12
3.4 Evaluating languages against confirmed locations from user wiki and profile pages
If we see a comment in a local language, to what degree of confidence can we infer that the
contributor was local in origin? After all, someone might edit South America with a Spanish-
language comment, while living in some location outside the continent, such as Spain or Mexico.
Furthermore, the use of English does not automatically indicate a nonlocal user, as someone
from South America might comment in English with the motive that the text will be understood
by more OSM contributors throughout the world. How often do these types of situations actually
occur, and what percentage of local users are associated with each language? This question has
not been studied in previous literature, and it is necessary to address in order to appropriately
interpret the findings of the automated language identification.
As suggested previously, self-reported home locations on OSM user profile and wiki
pages can provide a reference dataset of known user origins. The OSM wiki is a framework of
web pages editable by anyone in the OSM community. These pages help organize the work
around different themes (ie, "Food Security") or geographic regions (ie, "WikiProject Uruguay").
Importantly for our purposes, any OSM user can create a personal page on the wiki to describe
his or her interests, technical background, languages, and GPS equipment. Similar, but not
equivalent, are profile pages that users create on openstreetmap.org without having to learn the
wiki syntax. Both of these types of pages frequently contain autobiographical text such as "My
name is Linda and I'm from Florida". By connecting these profile clues with the language(s) that
a contributor is known to employ in his or her comments, I estimated the percentage of the
contributors for each language originating from South America using the following methods.
The wiki and profile pages are both available in a known URL format in which the OSM
user name is inserted at the end. Using an automated script, all the user names from the South
American study dataset of changesets were inserted into the URLs and a web request was made
for the HTML of the user's profile and wiki page. For many contributors no web page was
returned, meaning that the contributor had not created a profile or wiki page; however, any
request that returned a page was manually opened and scrutinized for direct indications of the
user's home country. The following types of information were considered acceptable indicators
of a person's country of origin: location reported by the contributor directly in the text of the
page, location of school or place of employment mentioned on the page, location mentioned in
personal web page linked from the page, predominant location mentioned in the page text or
diary (blog) where onsite mapping had occurred, or location of OSM user groups the contributor
belonged to (eg, "Users in Germany") when such groups were not in logical geographic conflict
with each other
(some contributors join groups in every country where they have mapped).
This analysis resulted in 567 contributors (8.7% of the total contributors in the study
dataset) whose changeset comment languages could be linked with their places of residence at
least at the country level. Perhaps not surprisingly, these contributors are more active in OSM
than the typical contributor; they accounted for 37,148 changesets (36.0% of the total changesets
in the study dataset) with a median of 4 changesets per contributor (as compared with a median
of 2 changesets per contributor for the entire study dataset). The percentage of OSM users
revealing their location in unstructured profile text and their collective levels of contribution to
the project are similar to those found for Wikipedia by Graham and others (2015).
Quinn, S. - A Geolinguistic Approach for Comprehending Local Influence in OpenStreetMap
13
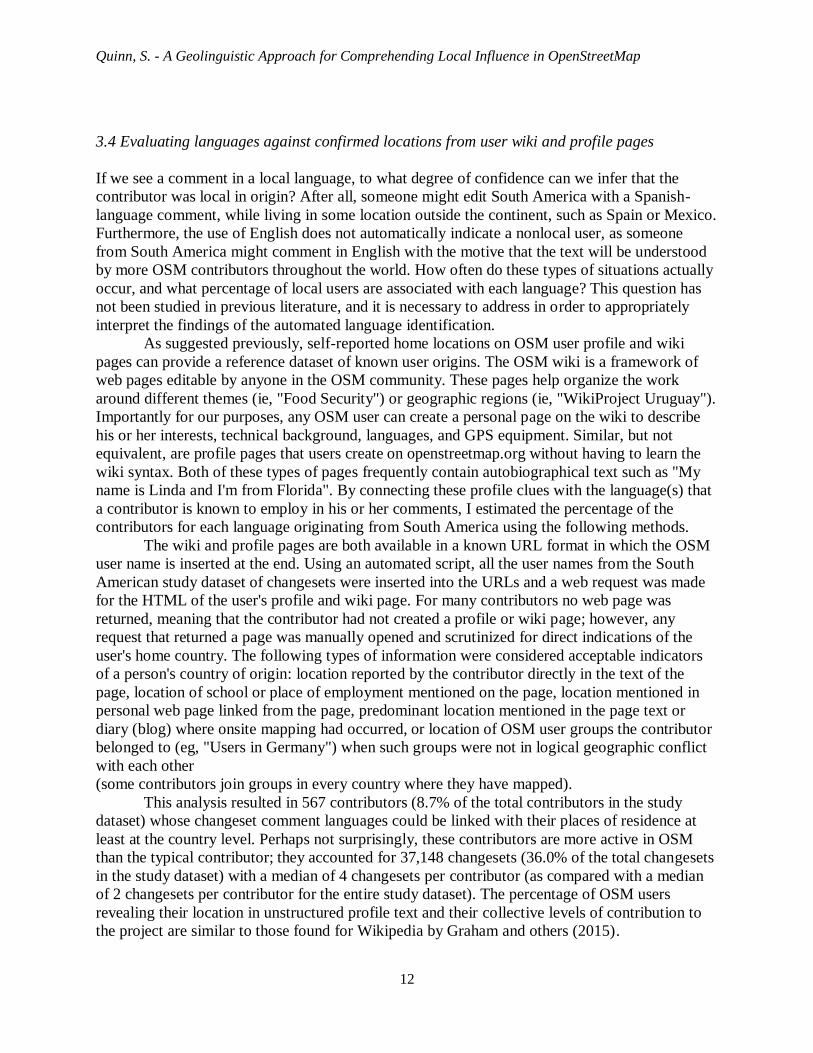
The percentages of contributors residing inside and outside of South America were then
calculated for each language. For example, 225 contributors who wrote comments in Spanish
also revealed some location information in their profile or wiki pages. Of these, 86.7% were
from South America and 13.3% were from somewhere outside South America (primarily Europe
and the United States). Nearly equivalent percentages to this were observed for Portuguese users;
however, English was different: out of the 303 contributors who wrote messages in English,
34.7% were from South America and 65.3% were from outside South America. The results for
each language are summarized in Figure 5. Note that the number of contributors listed in Figure
5 exceeds the total of 567 unique contributors because more than one language was detected for
some contributors.
Figure 5. Locations of contributors maintaining a profile or wiki page where a location could be
detected, grouped by language used in changeset comments
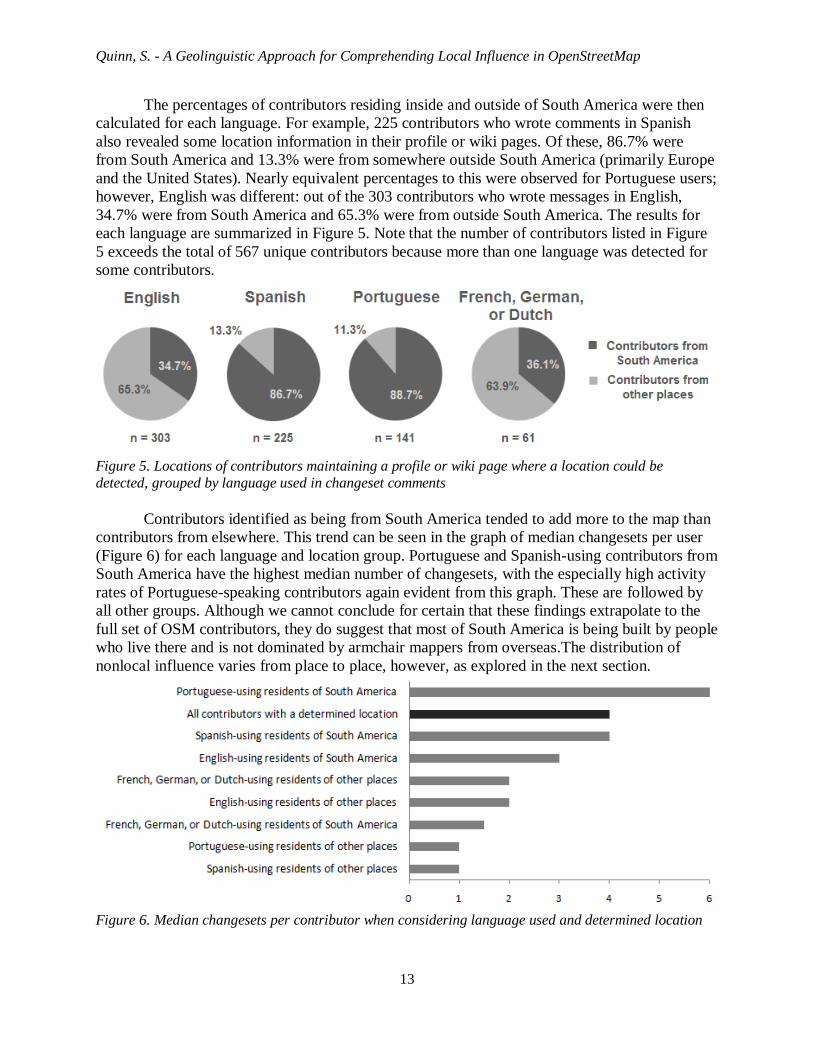
Contributors identified as being from South America tended to add more to the map than
contributors from elsewhere. This trend can be seen in the graph of median changesets per user
(Figure 6) for each language and location group. Portuguese and Spanish-using contributors from
South America have the highest median number of changesets, with the especially high activity
rates of Portuguese-speaking contributors again evident from this graph. These are followed by
all other groups. Although we cannot conclude for certain that these findings extrapolate to the
full set of OSM contributors, they do suggest that most of South America is being built by people
who live there and is not dominated by armchair mappers from overseas.The distribution of
nonlocal influence varies from place to place, however, as explored in the next section.
Figure 6. Median changesets per contributor when considering language used and determined location
Quinn, S. - A Geolinguistic Approach for Comprehending Local Influence in OpenStreetMap
14
4. Geographies of English usage
The portion of English-language comments in any particular place is of special interest because
of the relatively high percentage of nonlocal contributors associated with English during the
profile check. Although we cannot confidently infer a place of origin for any one English
speaking user, the above methods suggest that a group of English speaking contributors is more
likely to have a greater composition of nonlocal people than a group of Spanish or Portuguese
speaking contributors. It follows that mapping the distribution of English-commented changesets
could reveal the areas that are experiencing the most nonlocal influence in OSM.
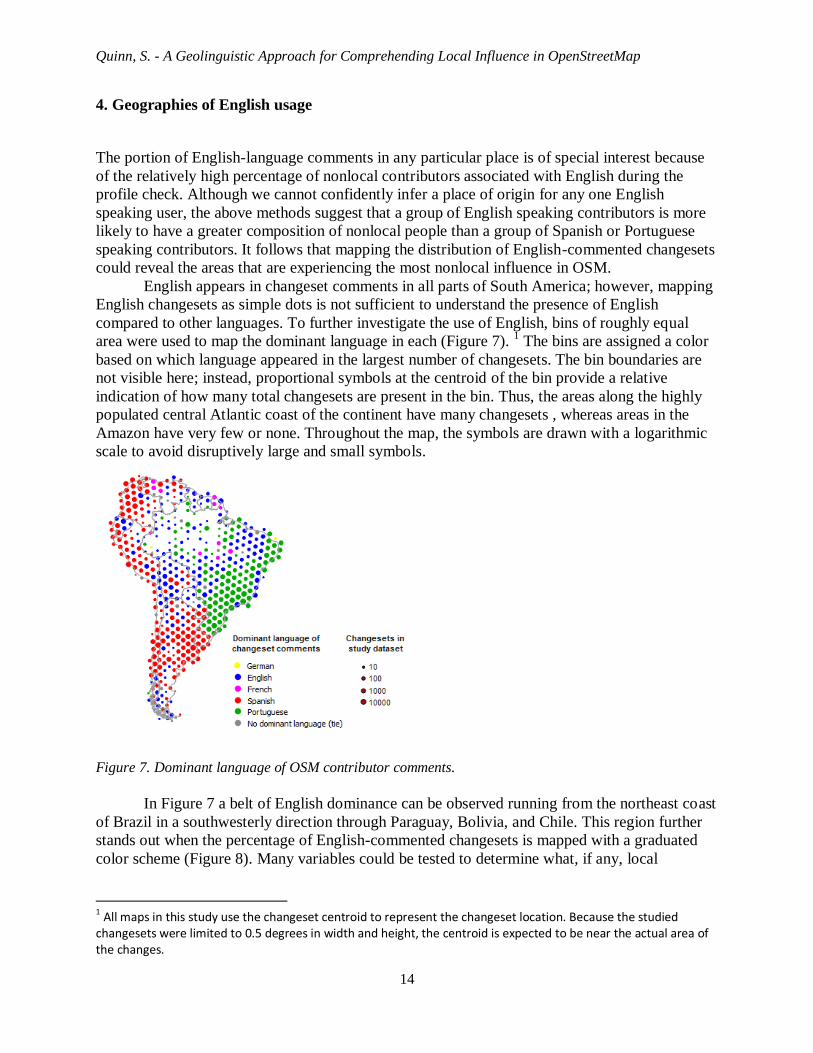
English appears in changeset comments in all parts of South America; however, mapping
English changesets as simple dots is not sufficient to understand the presence of English
compared to other languages. To further investigate the use of English, bins of roughly equal
area were used to map the dominant language in each (Figure 7). 1 The bins are assigned a color
based on which language appeared in the largest number of changesets. The bin boundaries are
not visible here; instead, proportional symbols at the centroid of the bin provide a relative
indication of how many total changesets are present in the bin. Thus, the areas along the highly
populated central Atlantic coast of the continent have many changesets , whereas areas in the
Amazon have very few or none. Throughout the map, the symbols are drawn with a logarithmic
scale to avoid disruptively large and small symbols.
Figure 7. Dominant language of OSM contributor comments.
In Figure 7 a belt of English dominance can be observed running from the northeast coast
of Brazil in a southwesterly direction through Paraguay, Bolivia, and Chile. This region further
stands out when the percentage of English-commented changesets is mapped with a graduated
color scheme (Figure 8). Many variables could be tested to determine what, if any, local
1 All maps in this study use the changeset centroid to represent the changeset location. Because the studied
changesets were limited to 0.5 degrees in width and height, the centroid is expected to be near the actual area of the changes.
Quinn, S. - A Geolinguistic Approach for Comprehending Local Influence in OpenStreetMap
15
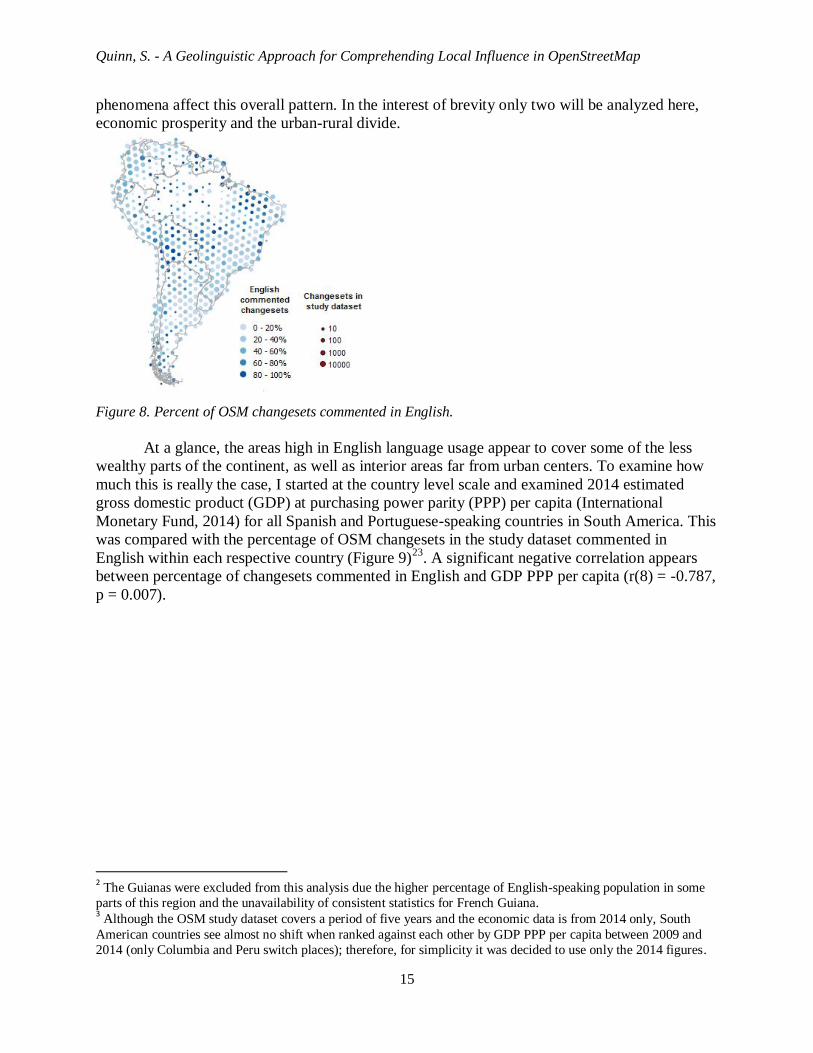
phenomena affect this overall pattern. In the interest of brevity only two will be analyzed here,
economic prosperity and the urban-rural divide.
Figure 8. Percent of OSM changesets commented in English.
At a glance, the areas high in English language usage appear to cover some of the less
wealthy parts of the continent, as well as interior areas far from urban centers. To examine how
much this is really the case, I started at the country level scale and examined 2014 estimated
gross domestic product (GDP) at purchasing power parity (PPP) per capita (International
Monetary Fund, 2014) for all Spanish and Portuguese-speaking countries in South America. This
was compared with the percentage of OSM changesets in the study dataset commented in
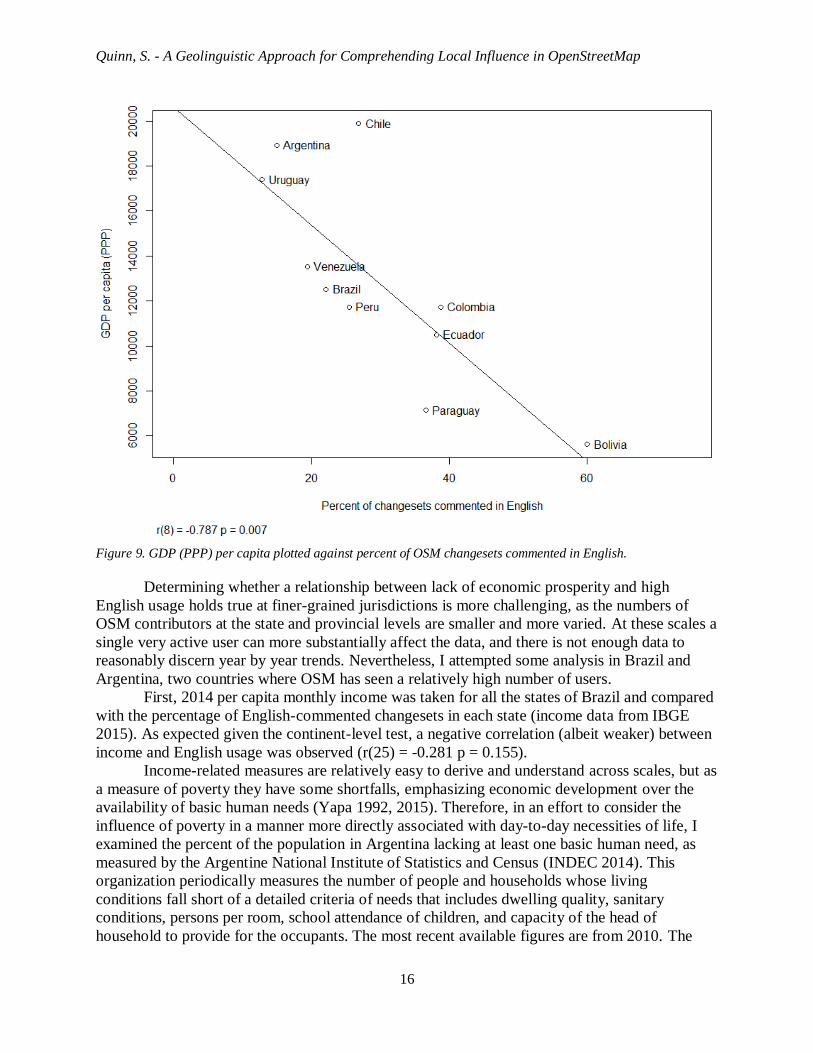
English within each respective country (Figure 9)23
. A significant negative correlation appears
between percentage of changesets commented in English and GDP PPP per capita (r(8) = -0.787,
p = 0.007).
2 The Guianas were excluded from this analysis due the higher percentage of English-speaking population in some
parts of this region and the unavailability of consistent statistics for French Guiana. 3 Although the OSM study dataset covers a period of five years and the economic data is from 2014 only, South
American countries see almost no shift when ranked against each other by GDP PPP per capita between 2009 and
2014 (only Columbia and Peru switch places); therefore, for simplicity it was decided to use only the 2014 figures.
Quinn, S. - A Geolinguistic Approach for Comprehending Local Influence in OpenStreetMap
16
Figure 9. GDP (PPP) per capita plotted against percent of OSM changesets commented in English.
Determining whether a relationship between lack of economic prosperity and high
English usage holds true at finer-grained jurisdictions is more challenging, as the numbers of
OSM contributors at the state and provincial levels are smaller and more varied. At these scales a
single very active user can more substantially affect the data, and there is not enough data to
reasonably discern year by year trends. Nevertheless, I attempted some analysis in Brazil and
Argentina, two countries where OSM has seen a relatively high number of users.
First, 2014 per capita monthly income was taken for all the states of Brazil and compared
with the percentage of English-commented changesets in each state (income data from IBGE
2015). As expected given the continent-level test, a negative correlation (albeit weaker) between
income and English usage was observed (r(25) = -0.281 p = 0.155).
Income-related measures are relatively easy to derive and understand across scales, but as
a measure of poverty they have some shortfalls, emphasizing economic development over the
availability of basic human needs (Yapa 1992, 2015). Therefore, in an effort to consider the
influence of poverty in a manner more directly associated with day-to-day necessities of life, I
examined the percent of the population in Argentina lacking at least one basic human need, as
measured by the Argentine National Institute of Statistics and Census (INDEC 2014). This
organization periodically measures the number of people and households whose living
conditions fall short of a detailed criteria of needs that includes dwelling quality, sanitary
conditions, persons per room, school attendance of children, and capacity of the head of
household to provide for the occupants. The most recent available figures are from 2010. The
Quinn, S. - A Geolinguistic Approach for Comprehending Local Influence in OpenStreetMap
17
percentage of Argentine residents lacking at least one of these necessities at the provincial level
was correlated with the percentage of OSM changesets commented in English, but the
correlation is even weaker than that observed with the Brazil analysis (r(22) = 0.155 p = 0.471).
The number of changesets in Argentine provinces is generally lower than in Brazilian states, and
the variation involved makes it unlikely that a strong correlation could be observed at this point,
although the picture may become clearer in the years to come as OSM attracts more contributors.
Exact figures from all the above tests are listed in tables in Appendix I.
Considering all of these analyses with the previous findings that most English-using
contributors in South America are coming from outside the continent, there is some indication
that poor places in South America have a lesser degree of local ownership over their maps than
affluent places. Further research into this issue is encouraged in order to understand other
variables that might be in play and whether the correlations hold at a more local level as OSM
increases its volume of data in future years.
Another trend that might be inferred by looking at the maps of languages usage is that
English-commented changesets seem to be more common in rural areas. To determine how much
this is really the case, the urban and rural dimensions of English usage in OSM were examined
by obtaining vector polygons of built-up land use areas from Natural Earth (Natural Earth 2015).
The methodology for creating these polygons is described by Schneider and others (2003). In the
built-up areas of South America, 19.4% of changesets were commented in English, whereas in
non-built-up areas, 29% of changesets were commented in English. These findings seem to
indicate that nonlocal influence in the South American OSM is higher in rural places than in
cities, but that even in rural places the majority of mappers are probably still local in origin.
5. What do the users of the different languages prioritize?
Does it even matter when large percentages of people are mapping a place from overseas, and if
it does, how are the distant contributors mapping differently than the local contributors? To
address this question, some further analysis was performed examining which OSM tags are
prioritized by English, Spanish, and Portuguese speaking contributors. To maintain focus on
countries with mostly Spanish or Portuguese speaking populations, all changesets in the Guianas
(Guyana, Suriname, and French Guiana) were excluded from the following part of the analysis.
An automated script was used to tally and rank the frequency of all OSM tags used in
connection with the three above-mentioned languages. A tag consists of metadata in key-value
form describing some physical entity in the world. For example, in OSM, "amenity" is a key
used for denoting a broad assortment of community facilities. Thus, the tag amenity=school is
used to denote a school; amenity is the key and school is the value. In this analysis I focused
particularly on four of the most commonly used OSM keys: amenity, highway, shop, and leisure,
wanting to see if the users of different languages prioritized differently the values given to these
keys.
To understand how the users of the different languages prioritized the different tags, the
following procedure was repeated for each key: First, a list was created of all values that ranked
within the top 10 of any of the three languages. The rank of each value in English was then
compared with the average ranking of the value in Spanish and the value in Portuguese, and then
the difference was recorded. This conveyed which values English speaking contributors tended
to favor when compared with speakers of the local languages.
Quinn, S. - A Geolinguistic Approach for Comprehending Local Influence in OpenStreetMap
18
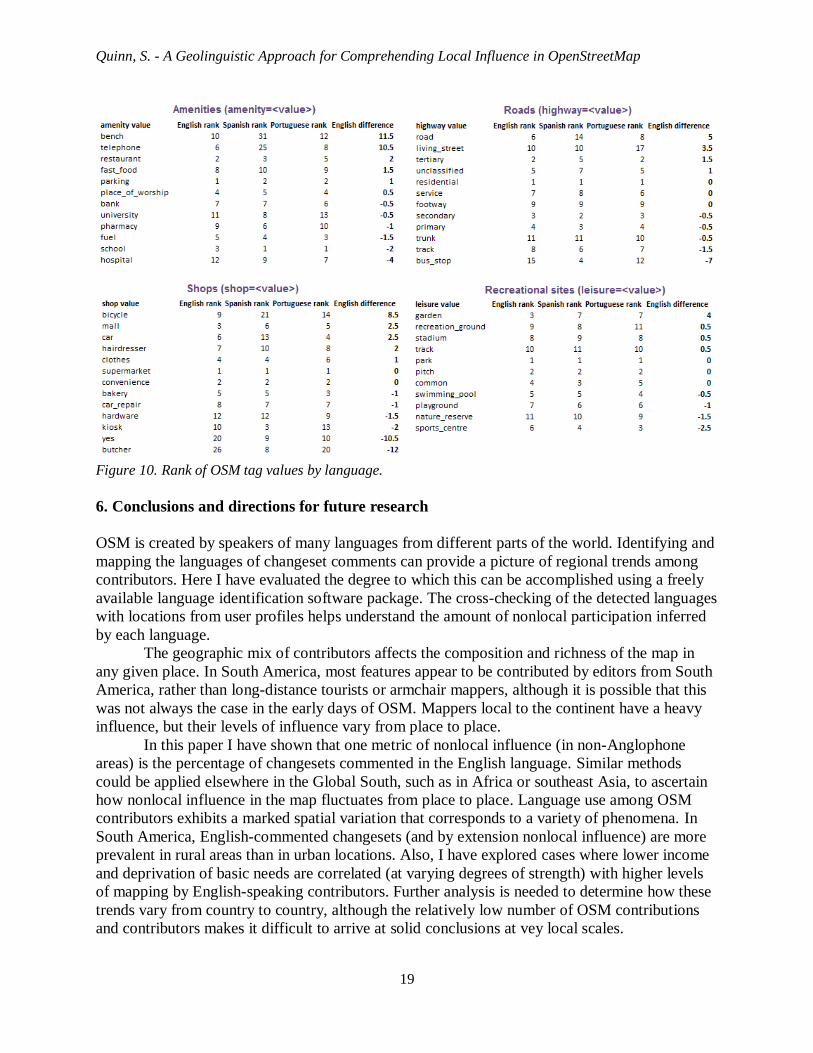
The results show that English, Spanish, and Portuguese speakers favor many of the same
tags. However, some of the tags favored by speakers of the local languages (Spanish and
Portuguese) tend to have a closer connection to providing basic day-to-day needs such as health,
transportation, fuel, recreation, and neighborhood "corner store" purchases. In contrast, tags
markedly favored by English speakers are more connected to sites of tourism and consumerism,
as well as objects that can be traced from aerial photography.
For example, after ranking all values given to the amenity key, amenity=hospital ranked
an average of four places higher for Spanish and Portuguese speaking contributors than for
English speaking contributors. amenity=school ranked two places higher and amenity=fuel
ranked 1.5 places higher. In comparison, English speakers favored amenity=bench (a difference
of 11.5 places in rank), amenity=telephone (10.5 places), amenity=restaurant (2 places), and
amenity = fast_food (1.5 places).
When highways were considered, the tag highway=road (5 places) was the highest
ranked for English speakers when compared to the average tag ranks for the Spanish and
Portuguese speaking contributors. The value "road" is often used when the highway is traced
from aerial imagery and the tracer does not have enough in situ evidence to assign a more
specific classification. In contrast, highway=bus_stop (7 places) was most favored by Spanish
and Portuguese speaking contributors when compared with English speaking contributors. Bus
stops are not easily visible from the air, and in some parts of Latin America bus stops are not
even marked on the ground, although their locations are widely known by local residents and are
critical for reaching places of employment and other necessary errands. They are examples of
features that satisfy the needs of everyday residential life that are more likely to be supplied by
local mappers.
The full results of this analysis in Figure 10 show similar patterns. English speaking
contributors placed higher priority on mapping bicycle shops, shopping malls, and auto
dealerships, while Spanish and Portuguese speaking contributors tended to map smaller
neighborhood businesses such as butcher shops, general stores (shop=yes), and kiosks. When
analyzing places of leisure, English speakers marked gardens, stadiums, and tracks while
Spanish and Portuguese speakers placed higher priority on marking sports complexes, nature
reserves, and playgrounds. The difference here may be related to which places of leisure are
more easily discerned from interpreting aerial photographs, assuming there is a greater
percentage of armchair mappers among the English speaking contributors. For example, most
OSM contributors can identify a track or a stadium in a photograph, while it is harder to identify
playground equipment or know which areas constitute protected natural space without actually
visiting a site. Also, tourists seem more likely to visit (or remember) landmark destinations such
as stadiums and shopping malls, rather than routine destinations such as playgrounds and butcher
shops.
Quinn, S. - A Geolinguistic Approach for Comprehending Local Influence in OpenStreetMap
19
Figure 10. Rank of OSM tag values by language.
6. Conclusions and directions for future research
OSM is created by speakers of many languages from different parts of the world. Identifying and
mapping the languages of changeset comments can provide a picture of regional trends among
contributors. Here I have evaluated the degree to which this can be accomplished using a freely
available language identification software package. The cross-checking of the detected languages
with locations from user profiles helps understand the amount of nonlocal participation inferred
by each language.
The geographic mix of contributors affects the composition and richness of the map in
any given place. In South America, most features appear to be contributed by editors from South
America, rather than long-distance tourists or armchair mappers, although it is possible that this
was not always the case in the early days of OSM. Mappers local to the continent have a heavy
influence, but their levels of influence vary from place to place.
In this paper I have shown that one metric of nonlocal influence (in non-Anglophone
areas) is the percentage of changesets commented in the English language. Similar methods
could be applied elsewhere in the Global South, such as in Africa or southeast Asia, to ascertain
how nonlocal influence in the map fluctuates from place to place. Language use among OSM
contributors exhibits a marked spatial variation that corresponds to a variety of phenomena. In
South America, English-commented changesets (and by extension nonlocal influence) are more
prevalent in rural areas than in urban locations. Also, I have explored cases where lower income
and deprivation of basic needs are correlated (at varying degrees of strength) with higher levels
of mapping by English-speaking contributors. Further analysis is needed to determine how these
trends vary from country to country, although the relatively low number of OSM contributions
and contributors makes it difficult to arrive at solid conclusions at vey local scales.
Quinn, S. - A Geolinguistic Approach for Comprehending Local Influence in OpenStreetMap
20
When interpreting the results of language identification and the cross-checks with user
profiles, several limitations deserve mention. Within the set of users who edited South America
and revealed their locations, I showed that most English speaking contributors are not from
South America, and most speakers of Spanish and Portuguese are from South America; however,
conclusions about place of origin cannot be made at the individual level based solely on
language use. Also, the vast majority of users have said nothing about themselves through a
profile or wiki page, and we cannot be sure whether their geographic distribution would match
the patterns of more active users who tended to reveal a location. A general survey asking the
locations of OSM contributors might be one way to confirm this, although the set of respondents
might just closely match the same active group that created profile pages. Other methods seeking
to derive location clues from unstructured text (Lee et al. 2013) may hold promise in future
analysis when applied to OSM profile pages, contributor comments, and OSM-hashtatgged
social media posts.
From my experience reading hundreds of these biographical pages, the user profiles from
within South America tend to be briefer in nature than those from the European contributors
mapping the continent (who are often OSM "power users"). It is possible that the methods
presented in this paper underestimate the number of users in South America due a lower
propensity by these users to create detailed profiles or any profile at all. The degree of severity of
this underestimation is unknown, but would in no way nullify the importance of beginning with
the analysis presented here.
When compared with Spanish and Portuguese speaking contributors, English speaking
contributors emphasize features that can be easily traced from aerial photographs or observed in
passing, such as roads and stadiums. Also, their favoring of shopping malls, restaurants, fast food
outlets, and auto dealerships seems to reflect an interest in sites of tourism and consumerism. On
the other hand Spanish and Portuguese speaking contributors emphasize features related to daily
routines such as taking children to school, visiting the corner store, riding the bus, or visiting the
doctor. Many of these features can only be observed or verified by someone on site. These local
influences make the map more valuable for the residents it serves, while reducing the empty
spaces on the map where thousands of people may dwell unnoticed or uncared for in
"cartographies of silence" (Harley 1988, Brunn and Wilson 2013).
The comparison of tags favored by local and nonlocal languages could be extended into
many other categories of features, especially if combinations of tags are considered. One
example would be a study of whether Spanish and Portuguese speakers are more likely than
English speaking contributors to add a street name when marking a road. Further inquiries into
the tags added by speakers of other languages would also help support or refute the assertions
made here about features favored by local and nonlocal contributors. I found that there were not
enough tags added by French, German, or Dutch speaking contributors in South America to
warrant independent analyses of these languages; however, the tags from all languages other than
Spanish or Portuguese might be combined with the English ones to see if the above results are
substantially affected.
An analysis of "localness" in OSM could involve a variety of scales. Here I have used a
coarse-grained binary approach at the continental level to determine if a contributor should be
considered local or not. To some degree the study was forced into this scale by the small number
of user profile pages available for validating the findings. Studies at the provincial or municipal
level may reveal interesting differences in local vs. nonlocal contributions if more advanced
language processing can be used on the contributor comments to ascertain editor locations (eg,
Quinn, S. - A Geolinguistic Approach for Comprehending Local Influence in OpenStreetMap
21
geocoding comments such as "this is my street" vs. "I traced this from Bing imagery"). Large-
scale, systematic surveys of contributors might also provide insight, although garnering enough
participation seems daunting when considering Budhathoki's (2010, p.66-67) blanket survey of
OSM contributors that saw no respondents from South America (the next fewest respondents
from an inhabited continent was 16).
Potential users of crowdsourced VGI such as OSM should look beyond the map image
and consider the set of contributors that created the data and how the end product might have
been affected by them. This is particularly important in low-income regions, places lacking
robust Internet infrastructure, and among peoples where online participation is otherwise low or
suppressed. Further work is needed to compare the motives of local and nonlocal mappers, and
investigate the ways that these types of contributors might be fostered (and retained) in areas of
the world where their particular contributions are needed.
Acknowledgements
The author would like to thank Greg Milbourne for assisting with data processing and analysis, Alan MacEachren for advice rendered throughout the project, and the GeoVISTA Center for providing
computing resources.
Appendix I
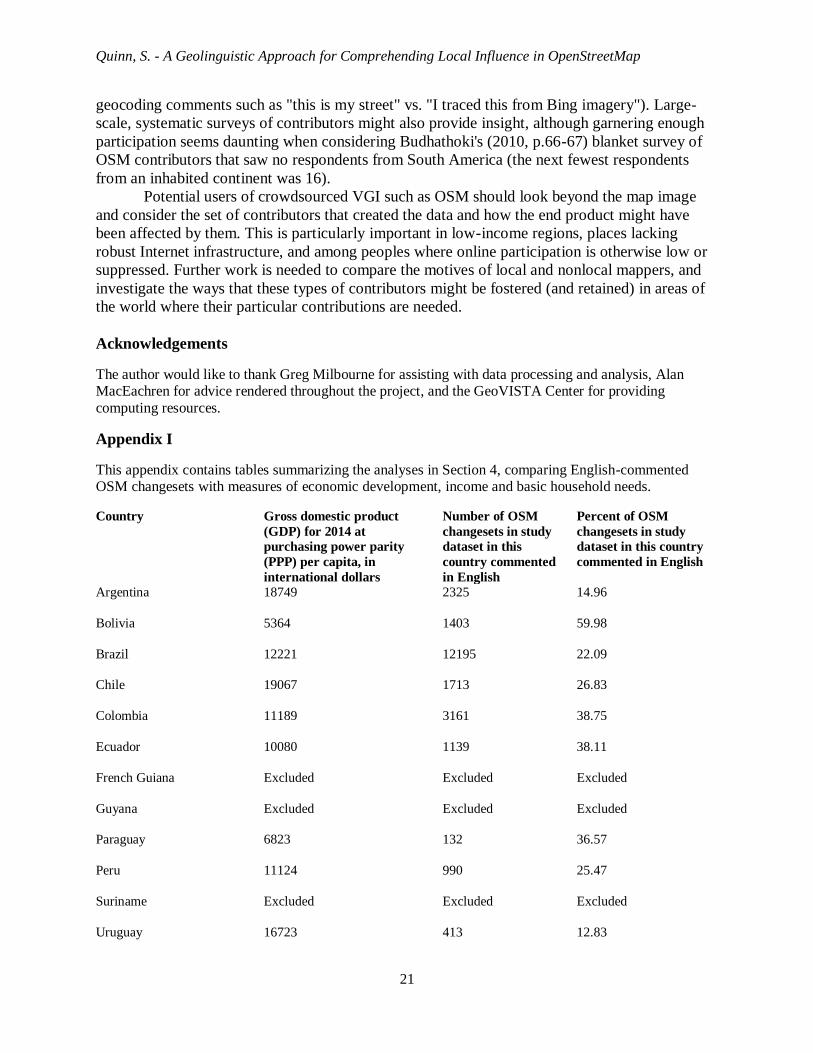
This appendix contains tables summarizing the analyses in Section 4, comparing English-commented OSM changesets with measures of economic development, income and basic household needs.
Country Gross domestic product
(GDP) for 2014 at
purchasing power parity
(PPP) per capita, in
international dollars
Number of OSM
changesets in study
dataset in this
country commented
in English
Percent of OSM
changesets in study
dataset in this country
commented in English
Argentina 18749 2325 14.96
Bolivia 5364 1403 59.98
Brazil 12221 12195 22.09
Chile 19067 1713 26.83
Colombia 11189 3161 38.75
Ecuador 10080 1139 38.11
French Guiana Excluded Excluded Excluded
Guyana Excluded Excluded Excluded
Paraguay 6823 132 36.57
Peru 11124 990 25.47
Suriname Excluded Excluded Excluded
Uruguay 16723 413 12.83
Quinn, S. - A Geolinguistic Approach for Comprehending Local Influence in OpenStreetMap
22
Venezuela 13604 571 19.38
Table 1. 2014 GDP (PPP) per capita and percent of OSM changesets commented in English at the country level
Brazilian state
Monthly income for 2014
in Brazilian real
Number of OSM
changesets in study
dataset in this state
commented in English
Percent of OSM
changesets in study
dataset in this state
commented in English
Acre 670 33 73.33
Alagoas 604 126 6.98
Amapá 753 84 61.76
Amazonas 739 125 26.65
Bahia 697 759 23.94
Ceará 616 283 40.9
Distrito Federal 2055 205 20.24
Espírito Santo 1052 444 60.33
Goiás 1031 270 19.85
Maranhão 461 185 55.39
Mato Grosso 1032 372 50.07
Mato Grosso do Sul 1053 357 44.96
Minas Gerais 1049 1989 23.39
Pará 631 209 20.15
Paraíba 682 121 20.54
Paraná 1210 513 19.61
Pernambuco 802 231 45.56
Piauí 659 202 69.66
Rio de Janeiro 1193 1242 20.5
Rio Grande do Norte 695 70 10.04
Rio Grande do Sul 1318 1488 25.39
Quinn, S. - A Geolinguistic Approach for Comprehending Local Influence in OpenStreetMap
23
Rondônia 762 35 26.72
Roraima 871 5 17.86
Santa Catarina 1245 364 15.77
São Paulo 1432 1886 15.77
Sergipe 758 86 27.74
Tocantins 765 104 24.47
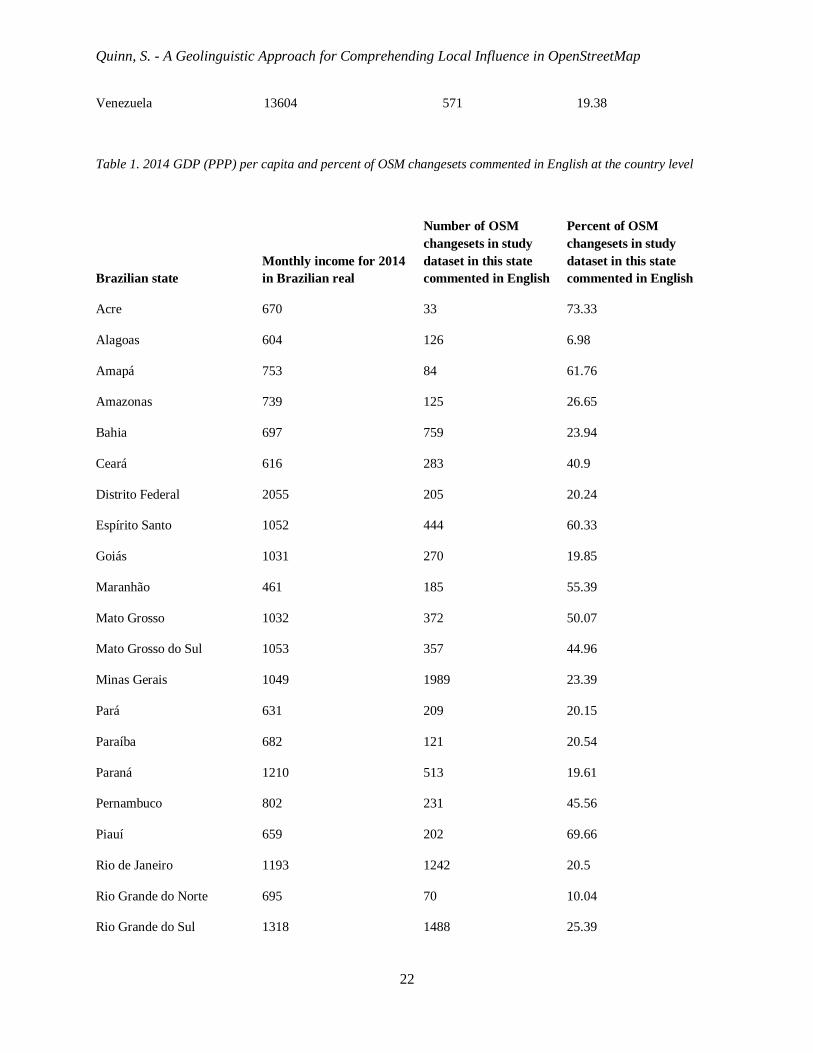
Table 2. 2014 monthly income in Brazilian states and percent of OSM changesets commented in English.
Argentine province
Percent of population
lacking at least one basic
human need in 2010
Number of OSM
changesets in study
dataset in this
province commented
in English
Percent of OSM
changesets in study
dataset in this province
commented in English
Buenos Aires 11.2 632 10.22
Catamarca 14.6 23 45.1
Chaco 23.1 83 14.14
Chubut 10.7 22 12.22
Ciudad Autónoma De
Buenos Aires 7 279 18.37
Córdoba 8.7 255 21.18
Corrientes 19.7 14 6.42
Entre Rios 11.6 60 18.02
Formosa 25.2 9 30
Jujuy 18.1 19 18.81
La Pampa 5.7 9 9.89
La Rioja 15.5 26 45.61
Mendoza 10.3 192 34.41
Misiones 19.1 39 3.28
Neuquén 12.4 27 6.78
Quinn, S. - A Geolinguistic Approach for Comprehending Local Influence in OpenStreetMap
24
Rio Negro 11.7 96 23.76
Salta 23.7 80 45.71
San Juan 14 51 43.22
San Luis 10.7 14 10
Santa Cruz 9.7 84 56.76
Santa Fe 9.5 153 10.7
Santiago Del Estero 22.7 40 30.53
Tierra Del Fuego, Antártida
E Islas Del Atlantico Sur 14.5 26 50
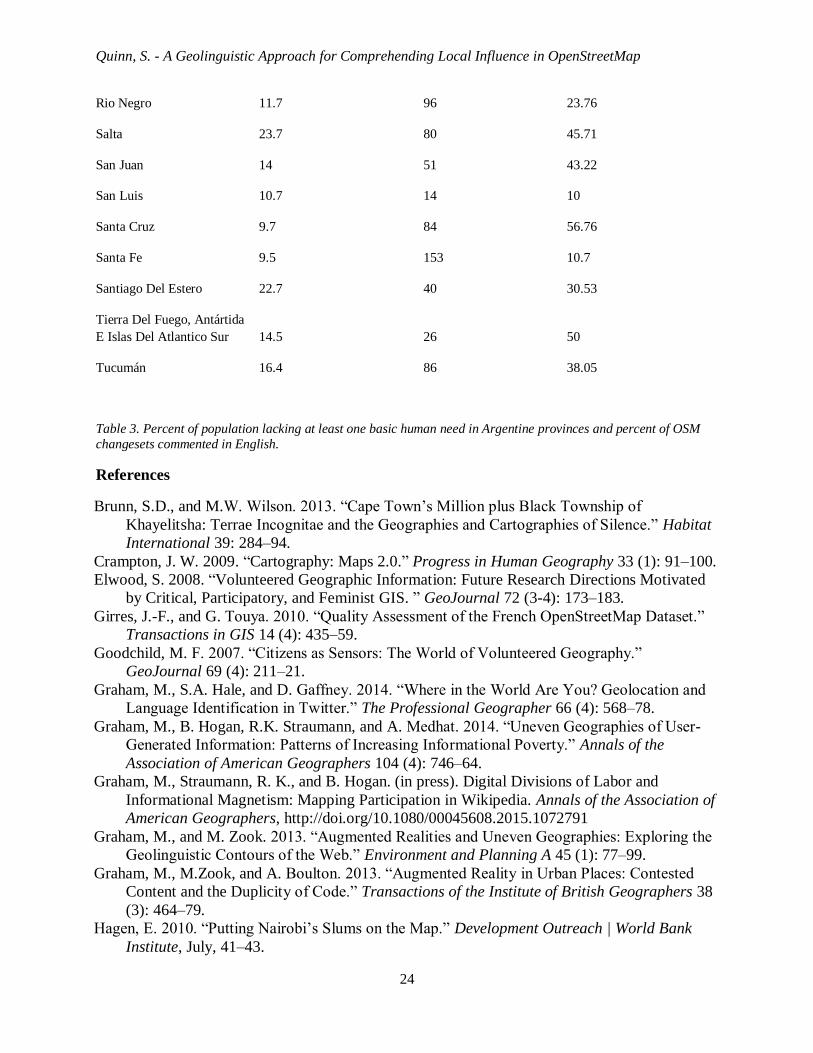
Tucumán 16.4 86 38.05
Table 3. Percent of population lacking at least one basic human need in Argentine provinces and percent of OSM
changesets commented in English.
References
Brunn, S.D., and M.W. Wilson. 2013. ―Cape Town’s Million plus Black Township of
Khayelitsha: Terrae Incognitae and the Geographies and Cartographies of Silence.‖ Habitat
International 39: 284–94.
Crampton, J. W. 2009. ―Cartography: Maps 2.0.‖ Progress in Human Geography 33 (1): 91–100.
Elwood, S. 2008. ―Volunteered Geographic Information: Future Research Directions Motivated
by Critical, Participatory, and Feminist GIS. ‖ GeoJournal 72 (3-4): 173–183.
Girres, J.-F., and G. Touya. 2010. ―Quality Assessment of the French OpenStreetMap Dataset.‖
Transactions in GIS 14 (4): 435–59.
Goodchild, M. F. 2007. ―Citizens as Sensors: The World of Volunteered Geography.‖
GeoJournal 69 (4): 211–21.
Graham, M., S.A. Hale, and D. Gaffney. 2014. ―Where in the World Are You? Geolocation and
Language Identification in Twitter.‖ The Professional Geographer 66 (4): 568–78.
Graham, M., B. Hogan, R.K. Straumann, and A. Medhat. 2014. ―Uneven Geographies of User-
Generated Information: Patterns of Increasing Informational Poverty.‖ Annals of the
Association of American Geographers 104 (4): 746–64.
Graham, M., Straumann, R. K., and B. Hogan. (in press). Digital Divisions of Labor and
Informational Magnetism: Mapping Participation in Wikipedia. Annals of the Association of
American Geographers, http://doi.org/10.1080/00045608.2015.1072791
Graham, M., and M. Zook. 2013. ―Augmented Realities and Uneven Geographies: Exploring the
Geolinguistic Contours of the Web.‖ Environment and Planning A 45 (1): 77–99.
Graham, M., M.Zook, and A. Boulton. 2013. ―Augmented Reality in Urban Places: Contested
Content and the Duplicity of Code.‖ Transactions of the Institute of British Geographers 38
(3): 464–79.
Hagen, E. 2010. ―Putting Nairobi’s Slums on the Map.‖ Development Outreach | World Bank
Institute, July, 41–43.
Quinn, S. - A Geolinguistic Approach for Comprehending Local Influence in OpenStreetMap
25
Haklay, M. 2010. ―How Good Is Volunteered Geographical Information? A Comparative Study
of OpenStreetMap and Ordnance Survey Datasets.‖ Environment and Planning. B, Planning
& Design 37 (4): 682.
Haklay, M. 2013. ―Neogeography and the Delusion of Democratisation.‖ Environment and
Planning A 45 (1): 55–69.
Harley, J.B. 1988. ―Silences and Secrecy: The Hidden Agenda of Cartography in Early Modern
Europe.‖ Imago Mundi 40 (1): 57–76.
Harley, J.B. 1990. ―Cartography, Ethics and Social Theory.‖ Cartographica: The International
Journal for Geographic Information and Geovisualization 27 (2): 1–23.
IBGE (Instituto Brasileiro de Geografia e Estatistica). 2015. ―IBGE divulga rendimento
domiciliar per capita segundo a PNAD Contínua para o FPE.‖ Available at
http://saladeimprensa.ibge.gov.br/noticias?view=noticia&id=1&busca=1&idnoticia=2833.
INDEC (Instituto Nacional de Estadística y Censos) - Argentina. 2014. ―Indicadores
sociodemográficos - Condiciones de vida.‖ Available at
http://www.indec.mecon.ar/indicadores-sociodemograficos.asp.
International Monetary Fund. 2014. ―World Economic Outlook Database.‖ Available at
http://www.imf.org/external/pubs/ft/weo/2014/01/weodata/index.aspx
Latif, S., K.M.R. Islam, M.M.I. Khan, and S.I. Ahmed. 2011. ―OpenStreetMap for the Disaster
Management in Bangladesh.‖ In Open Systems (ICOS), 2011 IEEE Conference on, 429–33.
Leszczynski, A., and M.W. Wilson. 2013. ―Guest Editorial: Theorizing the Geoweb.‖
GeoJournal 78 (6): 915–19.
Lee, K., Ganti, R., Srivatsa, M., and P. Mohapatra. 2013. "Spatio-temporal Provenance:
Identifying Location Information from Unstructured Text." In Pervasive Computing and
Communications Workshops (PERCOM Workshops), 2013 IEEE International Conference
on (pp. 499–504). IEEE. Retrieved from
http://ieeexplore.ieee.org/xpls/abs_all.jsp?arnumber=6529548
Lui, M., and T. Baldwin. 2011. ―Cross-Domain Feature Selection for Language Identification.‖
In In Proceedings of 5th International Joint Conference on Natural Language Processing,
553–61.
———. 2012. ―Langid. Py: An off-the-Shelf Language Identification Tool.‖ In Proceedings of
the ACL 2012 System Demonstrations, 25–30. Association for Computational Linguistics.
Maron, M., G. Slater, and S. Coast. 2012. ―Google IP Vandalizing OpenStreetMap |
OpenStreetMap Blog.‖ January 17. Available at
https://blog.openstreetmap.org/2012/01/17/google-ip-vandalizing-openstreetmap/.
Natural Earth. 2015. Urban Areas. Available at
http://www.naturalearthdata.com/downloads/10m-cultural-vectors/10m-urban-area/.
Neis, P., D. Zielstra, and A. Zipf. 2011. ―The Street Network Evolution of Crowdsourced Maps:
OpenStreetMap in Germany 2007–2011.‖ Future Internet 4 (1): 1–21.
———. 2013. ―Comparison of Volunteered Geographic Information Data Contributions and
Community Development for Selected World Regions.‖ Future Internet 5 (2): 282–300.
Neis, P., and A. Zipf. 2012. ―Analyzing the Contributor Activity of a Volunteered Geographic
Information project—The Case of OpenStreetMap.‖ ISPRS International Journal of Geo-
Information 1 (2): 146–65.
Quest, C. 2014. ―OSM Quality Assurance Thru Cross Checking Statistics and External Datasets.‖
Presented at State of the Map 2014, 7–9 November, Buenos Aires. Available at
http://vimeo.com/album/3134207/video/112233941.
Quinn, S. - A Geolinguistic Approach for Comprehending Local Influence in OpenStreetMap
26
Schneider, A., M. A. Fried, D. K. McIver, and C. Woodcock. 2003. ―Mapping Urban Areas by
Fusing Multiple Sources of Coarse Resolution Remotely Sensed Data.‖ Photogrammetric
Engineering and Remote Sensing 69: 1377–86.
Stephens, M. 2013. ―Gender and the Geoweb: Divisions in the Production of User-Generated
Cartographic Information.‖ GeoJournal 78 (6): 1–16.
Wood, H. 2012. ―Licence Redaction Ready to Begin | OpenStreetMap Blog.‖ July 9. Available at
https://blog.openstreetmap.org/2012/07/09/licence-redaction-ready/.
Wright, A. 2013. ―Changing the Ratio of OpenStreetMap Communities.‖ presented at the State
of the Map 2013, 6–8 September, Birmingham, England. Available at
http://lanyrd.com/2013/sotm/scphhf/.
Yapa, L. 2015. ―Why We Cannot All Be Middle Class in America.‖ In Routledge Handbook on
Poverty and the United States, eds. S. Haymes, M.V. de Haymes, and R. Miller. New York:
Routledge. 576–83.
Yapa, L. 1992. ―Why Do They Map GNP per Capita.‖ In Natural and Technological Disasters:
Causes, Effects, and Preventive Measures, eds. Majumdar, S.K., G.S. Forbes, E.W. Miller,
and R.F. Schmalz. Easton, MA: The Pennsylvania Academy of Science. 495–510.
Yasseri, T., R. Sumi, and J. Kertész. 2012. ―Circadian Patterns of Wikipedia Editorial Activity: A
Demographic Analysis.‖ PloS One 7 (1): e30091.
Zook, M.A., and M. Graham. 2007. ―The Creative Reconstruction of the Internet: Google and the
Privatization of Cyberspace and DigiPlace.‖ Geoforum 38 (6): 1322–43.
Zook, M., M. Graham, T. Shelton, and S. Gorman. 2010. ―Volunteered Geographic Information
and Crowdsourcing Disaster Relief: A Case Study of the Haitian Earthquake.‖ World
Medical & Health Policy 2 (2): 7–33.
-