A Geography of Illicit Crops (coca leaf) and Armed Conflict...
70
Working Paper no.47 A GEOGRAPHY OF I LLICIT CROPS (COCA LEAF ) AND ARMED CONFLICT IN COLOMBIA Ana María Díaz Fabio Sánchez CEDE Universidad de los Andes July 2004 Copyright © Ana María Díaz and Fabio Sánchez, 2004 Although every effort is made to ensure the accuracy and reliability of material published in this Working Paper, the Development Research Centre and LSE accept no responsibility for the veracity of claims or accuracy of information provided by contributors. All rights reserved. No part of this publication may be reproduced, stored in a retrieval system or transmitted in any form or by any means without the prior permission in writing of the publisher nor be issued to the public or circulated in any form other than that in which it is published. Requests for permission to reproduce this Working Paper, of any part thereof, should be sent to: The Editor, Crisis States Programme, Development Research Centre, DESTIN, LSE, Houghton Street, London WC2A 2AE.
Transcript of A Geography of Illicit Crops (coca leaf) and Armed Conflict...
Working Paper no.47
A GEOGRAPHY OF ILLICIT CROPS (COCA LEAF) AND ARMED CONFLICT
IN COLOMBIA
Ana María Díaz Fabio Sánchez
CEDE Universidad de los Andes
July 2004
Copyright © Ana María Díaz and Fabio Sánchez, 2004 Although every effort is made to ensure the accuracy and reliability of material published in this Working Paper, the Development Research Centre and LSE accept no responsibility for the veracity of claims or accuracy of information provided by contributors. All rights reserved. No part of this publication may be reproduced, stored in a retrieval system or transmitted in any form or by any means without the prior permission in writing of the publisher nor be issued to the public or circulated in any form other than that in which it is published. Requests for permission to reproduce this Working Paper, of any part thereof, should be sent to: The Editor, Crisis States Programme, Development Research Centre, DESTIN, LSE, Houghton Street, London WC2A 2AE.
1
Crisis States Programme
A Geography of Illicit Crops (Coca Leaf) and Armed Conflict in Colombia
Ana María Díaz and Fabio Sánchez CEDE, Universidad de los Andes
Abstract
Colombia is currently the world’s largest producer of coca leaf and the principal producer of opium poppies in the Americas; the plants are the basic raw materials used to produce cocaine and heroin. This document analyses the current relationship between these crops and illegal armed groups in Colombia, using the hypothesis that the geographical intensification of the conflict is the principal cause of expanding illicit crop production. This relationship was analysed using a theoretical model, in which an interaction between illegal armed activity and strategic territorial control lead to cocaine production. Spatial analysis techniques were then applied, especially spatial association indicators; and a clear spatial dynamic was observed, related to the two aspects mentioned above. Non-parametric exercises were also carried out using matching estimators, to determine the effect illegal armed groups have on coca crops, and also to analyse the efficiency of aerial eradication policies. The results suggest that a large percentage of coca production in Colombia is due to the effects of illegal armed activity. We therefore conclude that the expansion of illegal crop growing is a consequence of the expanding conflict. In contrast, coca crops can only be used to explain a small part of the armed conflict in Colombia. In addition, we found that crop eradication via aerial spraying has not been an efficient tool in the fight against coca production in the country. Introduction
Colombia has become the world’s largest producer of coca leaf and the main producer of opium poppies in the Americas; these plants are the basic raw materials used to produce cocaine and heroin. The nineties were characterised by an expansion of coca growing in the order of 286 percent (cultivated hectares increased from 37,500 in 1992 to 144,807 in 2001). This expansion was accompanied by reduced cultivation in Peru and Bolivia. Various different social sciences have studied this phenomenon, most focusing on the causes and consequences, with little empirical or quantitative evidence. Evidence exists that coca and opium crops are closely linked to the finances of illegal armed groups, which is in line with recent literature regarding internal conflicts and civil wars. A lack of external funding leads the irregular groups towards an economic activity in which they have the competitive edge. In most cases, this activity is based on economic depredation or extortion – particularly of primary goods – via the selective or indiscriminate use of violence.1 They are also, of course, involved in monetary extortion and kidnapping, in which the use of intense violence is employed. The irregular groups’ objective to dominate and control coca and opium poppy growing areas has lead to the intimidation of local communities, and the use of violence against them.
1 Ian Bannon & Paul, Collier, ‘Natural Resources and Conflict: What We Can do’, in Ian Bannon & Paul Collier (eds), Natural Resources and Violent Conflict, Washington, D.C.: The World Bank, 2003.
2
However, coca and poppy crops are not a depredatory activity per se. There is a certain added value to their production; there is a market for the product, in which the irregular groups intervene; and they are the basic raw materials of psychoactive drugs. Nevertheless, geographical expansion goes beyond these economic factors. The illegal groups’ strategic objectives regarding territorial control also play an important role here. In recent years the evidence has suggested a growing link between the expansion of illegal crops2 and the activities of the armed groups, to the extent that profits from coca and poppy production, in addition to those generated by the production of psychoactive drugs, have become one of the main ways that these groups finance their activities. Therefore, this paper analyses the above mentioned relationship, with the hypothesis that the geographical expansion and intensification of the conflict is the principal cause behind the expansion of illegal crops. To verify the hypothesis patterns of spatial diffusion and contagion between coca production and the activities of illegal armed groups were analysed using current spatial analysis techniques. A theoretical model of the illicit crops/conflict relationship was also developed to reach a better understanding of its dynamics and interrelations. Furthermore, in order to analyse the empirical causality relationship between illicit crops and the conflict, the level of illegal armed activity in coca growing areas in municipalities or regions was studied using the non-parametric method known as matching estimators. This paper is divided into six sections. The first is an analysis of coca trends in the Andean region, and how they have been interpreted by different authors. The second section offers a brief history of coca, and recent trends in the Andean region. The third is a description of coca trends in Colombia and regional dynamics over recent years, as well as a brief mention of the principal interpretations and hypotheses of the causes and consequences of illicit crop growing in Colombia. The fourth section develops the theoretic model and tries to explain the relationship between illegal crops and the conflict. The fifth section relates coca geography with that of the internal conflict in Colombia, by using spatial analysis techniques, in particular related to the clusters and dynamics of illicit crop diffusion, and reviews the impact of eradication efforts. The sixth section presents an econometric analysis of the effects of the armed conflict on the number of cultivated hectares and vice versa. Finally, we present our conclusions in the last section. Interpreting Coca Trends in the Andean Region
Coca is native to the Andean Region (Bolivia, Peru and Colombia). Its cultivation and consumption (as leaf) has long been part of the traditions and customs of Andean peasant farmers, above all in Bolivia and Peru. In recent decades, specifically since international demand for drugs began to increase, this region has become the world’s leading producer of coca: 200,000 hectares of coca are under cultivation in this part of the world. The cultivated area in these three countries was stable throughout the nineties. But in recent years the proportion of the total grown in each country has changed substantially. Colombia went from being an importer of coca base to being a net producer of coca leaf – from 19 percent of total regional cultivation in 1990 to 72 percent in 2001. Over the same period Peru’s share fell from 57 percent to 17 percent, and Bolivia’s from 25 percent to 10 percent.3 2 The cultivation of plants such as coca, opium poppies and marijuana, that are processed into natural psychoactive drugs. Coca grows in warm, humid zones with high rainfall, which are between 300 and 1,600m above sea level. Opium poppies, on the other hand, thrive in mountainous areas between 1,800 and 3,000m above sea level. 3 In the international environment, it is believed that drug income is a fundamental part of development in the Andean countries (see Francisco E. Thoumi, El Imperio de la Droga: Narcotráfico, economía y sociedad en Los
3
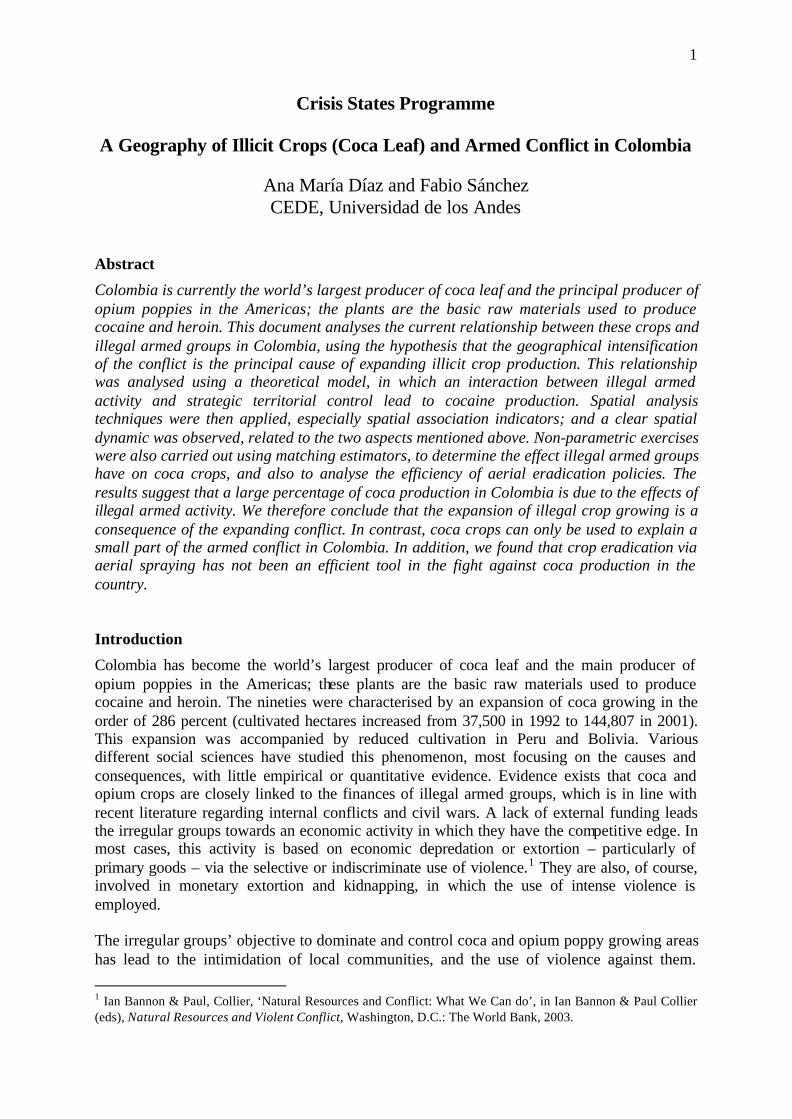
This relocation of coca production in the region (Graph 1) was the result of successful eradication and interdiction efforts in Bolivia and Peru. Although these policies enjoyed domestic success, they did not have the same results at regional level. Reduced production in these two countries was compensated for by new crops in Colombia. Graph 1. Coca Production in the Andean Region 1990-2001
0
50000
100000
150000
200000
250000
1990
1991
1992
1993
1994
1995
1996
1997
1998
1999
2000
2001
Hec
tare
s
Bolivia Colombia Perú
Source: US State Department Each country has used a different strategy to reduce the supply of coca. Bolivia favoured eradication, Peru placed greater importance on fighting trafficking (shutting down aerial and fluvial export routes and thus inspiring the abandonment of cultivated land), and Colombia has favoured chemical fumigation, eradication and crop substitution. Although the Andean region is the principal world supplier of cocaine, it is also produced in parts of Africa, Asia, some areas of the USA (Hawaii), Guam and Latin America (Brazil, Ecuador, the Guyanas and Venezuela).There follows a brief history of coca production in Bolivia, Peru and, specifically, Colombia. Bolivia
Between 1720 and 1950 Bolivian coca was grown mainly in the Yungas region, in the Department of La Paz. It was a legal activity and coca was a principal part of the Bolivian diet.4 During the 1950s, Chapare, in the Department of Cochabamba, began to overtake Yungas due to the productive advantages of this region, 5 becoming the leading producer in the 1960s and 70s.
Andes, Bogotá, Editorial Planeta Colombiana, 2002; and Roberto Steiner, ‘Los Dólares del Narcotráfico’, Cuadernos de Fedesarrollo , 2, Bogotá: Editorial Tercer Mundo, 1997). However, investigations based on rigorous calculations have shown that cocaine income is just 3.4 percent of Peruvian GDP, less than 5 percent of Bolivian GDP and around 5 percent of Colombian GDP. Today it is 3 percent of Colombian GDP, whilst in the first half of the 1980s it was 7 percent of GDP. This shows that other sectors exist in these countries that offer better economic growth perspectives than the coca business. 4 Thoumi (2002). 5 These natural advantages are that coca can be produced without a need for terracing, and that plants may be harvested four times a year instead of three, as is the case in Yungas. Furthermore, Chapare coca contains more alkaloids than Yunga coca, and processing costs are therefore lower.
4
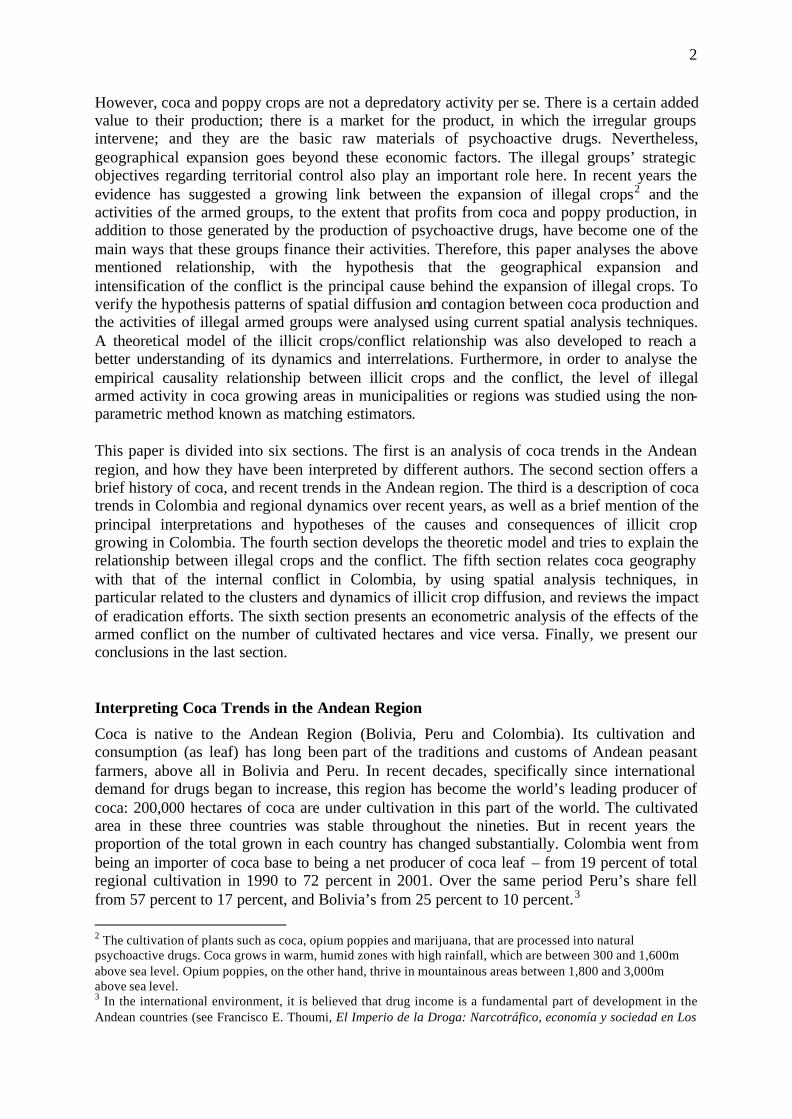
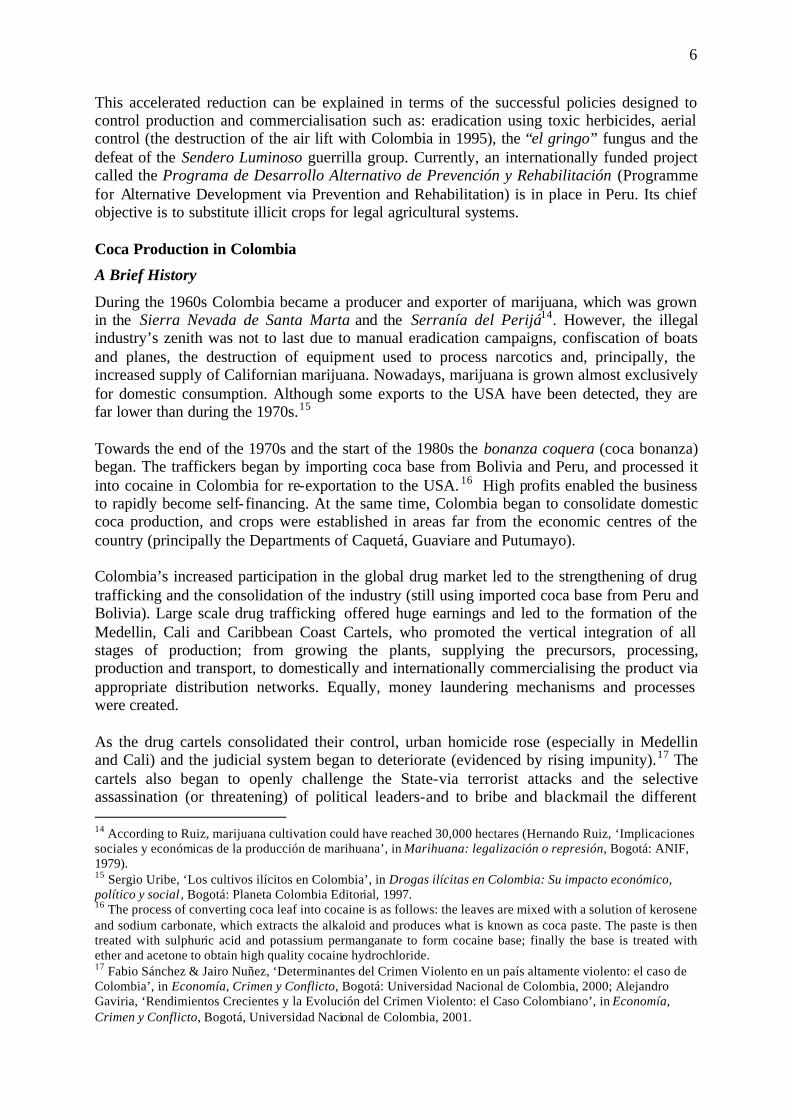
Until the end of the 1960s, the evolution of coca in Bolivia was fairly stable. However, high profits and sustained increases in international demand for coca, in addition to the Bolivian economic crisis in the 1980s and the closure of tin mines in 1985, led to a rise in illegal coca cultivation. An operational structure was consolidated during these years that facilitated the transition from the first phase of production to the cocaine business itself, although the final stage of production – the fabrication of cocaine hydrochloride – was controlled by the Colombian cartels.6 The coca situation in Bolivia today is very different to the sustained growth of the 1980s. In 1987 there were 60,000 hectares of coca being cultivated in Bolivia, which supplied a large proportion of international demand (Graph 2). During subsequent years production remained stable at around 50,000 hectares. However, the effect of government programmes7 designed to fight illicit production led to a fall in production that sharpened from 1997 when Plan Dignidad (the Dignity Plan) came into force.8 The programme, supported by the US government, aimed to reduce supply to the minimum level needed to satisfy domestic demand for coca leaf. Since 1997 coca production in Bolivia has fallen significantly; it currently makes a marginal contribution to the global market. Graph 2. Coca production in Bolivia from 1980 to 2001
0
10000
20000
30000
40000
50000
60000
70000
1980
1981
1982
1983
1984
1985
1986
1987
1988
1989
1990
1991
1992
1993
1994
1995
1996
1997
1998
1999
2000
2001
Hec
tare
s
Source: US State Department
6 Fernando Rojas, La Economía de la Coca, La Paz: Instituto de Investigación Socio-Económicas, Universidad Católica Boliviana, 2002. 7 Law 1008 (1988), regulated production, distribution and commercialisation and offered alternative development sources. It also defined legal production zones. Amongst other programmes are the: Estrategia Nacional de Lucha contra el Narcotráfico (the National Drug War Strategy) and the Estrategia Nacional de Desarrollo Alternativo (Opción Cero) (National Alternative Development Strategy (Zero Option)), that focussed on offering monetary compensation for each hectare of coca eradicated, substituting illegal crops for legal alternatives, as well as eradication and interdiction. 8 This plan is known as the Estrategia Boliviana de Lucha contra el Narcotráfico (Bolivian Drug War Strategy) and is based on four aspects: a) alternative development, b) prevention and rehabilitation, c) the eradication of illegal coca, and d) interdiction. International aid to the value of $952 million over five years was used by the Bolivian government to implement and continue the plan; $108 million (11 percent) were spent on eradicating coca crops, and $700 million (73 percent) on alternative development, which was based on the five commercially viable crops: banana, pineapple, oil palm, maracuya (a variety of passion fruit) and black pepper.
5
Peru
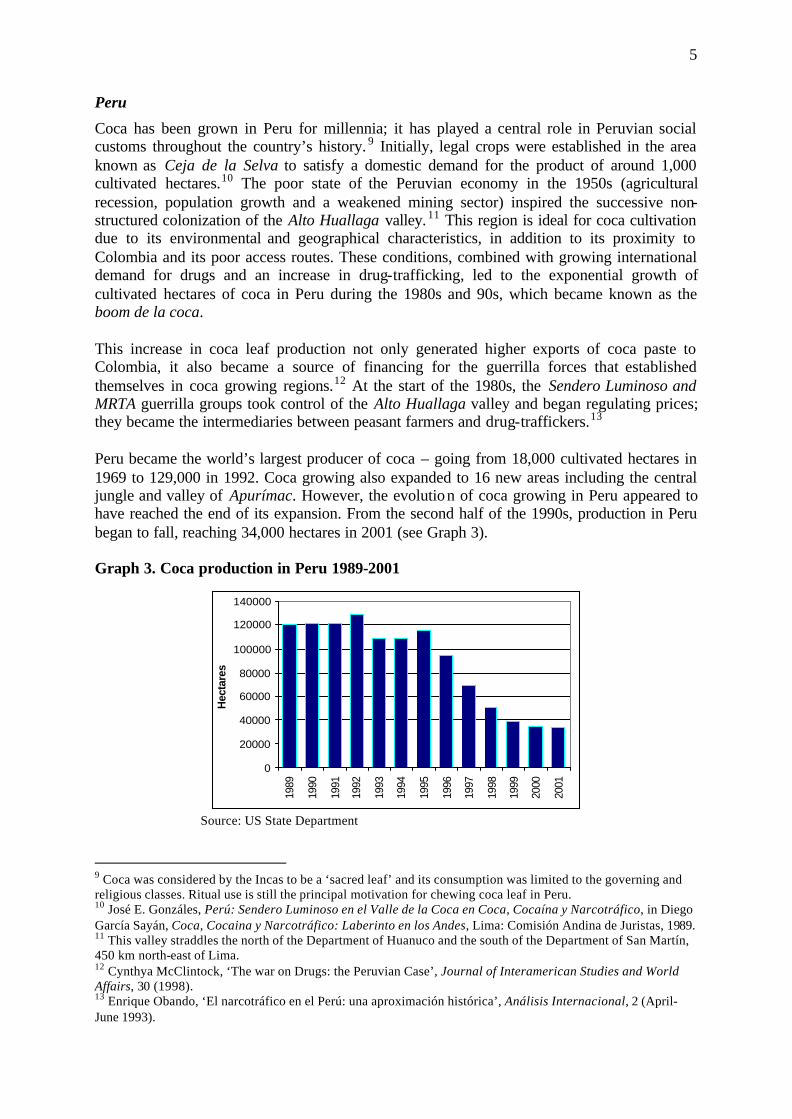
Coca has been grown in Peru for millennia; it has played a central role in Peruvian social customs throughout the country’s history. 9 Initially, legal crops were established in the area known as Ceja de la Selva to satisfy a domestic demand for the product of around 1,000 cultivated hectares.10 The poor state of the Peruvian economy in the 1950s (agricultural recession, population growth and a weakened mining sector) inspired the successive non-structured colonization of the Alto Huallaga valley. 11 This region is ideal for coca cultivation due to its environmental and geographical characteristics, in addition to its proximity to Colombia and its poor access routes. These conditions, combined with growing international demand for drugs and an increase in drug-trafficking, led to the exponential growth of cultivated hectares of coca in Peru during the 1980s and 90s, which became known as the boom de la coca. This increase in coca leaf production not only generated higher exports of coca paste to Colombia, it also became a source of financing for the guerrilla forces that established themselves in coca growing regions.12 At the start of the 1980s, the Sendero Luminoso and MRTA guerrilla groups took control of the Alto Huallaga valley and began regulating prices; they became the intermediaries between peasant farmers and drug-traffickers.13 Peru became the world’s largest producer of coca – going from 18,000 cultivated hectares in 1969 to 129,000 in 1992. Coca growing also expanded to 16 new areas including the central jungle and valley of Apurímac. However, the evolution of coca growing in Peru appeared to have reached the end of its expansion. From the second half of the 1990s, production in Peru began to fall, reaching 34,000 hectares in 2001 (see Graph 3). Graph 3. Coca production in Peru 1989-2001
0
20000
40000
60000
80000
100000
120000
140000
1989
1990
1991
1992
1993
1994
1995
1996
1997
1998
1999
2000
2001
Hec
tare
s
Source: US State Department
9 Coca was considered by the Incas to be a ‘sacred leaf’ and its consumption was limited to the governing and religious classes. Ritual use is still the principal motivation for chewing coca leaf in Peru. 10 José E. Gonzáles, Perú: Sendero Luminoso en el Valle de la Coca en Coca, Cocaína y Narcotráfico, in Diego García Sayán, Coca, Cocaina y Narcotráfico: Laberinto en los Andes, Lima: Comisión Andina de Juristas, 1989. 11 This valley straddles the north of the Department of Huanuco and the south of the Department of San Martín, 450 km north-east of Lima. 12 Cynthya McClintock, ‘The war on Drugs: the Peruvian Case’, Journal of Interamerican Studies and World Affairs, 30 (1998). 13 Enrique Obando, ‘El narcotráfico en el Perú: una aproximación histórica’, Análisis Internacional, 2 (April-June 1993).
6
This accelerated reduction can be explained in terms of the successful policies designed to control production and commercialisation such as: eradication using toxic herbicides, aerial control (the destruction of the air lift with Colombia in 1995), the “el gringo” fungus and the defeat of the Sendero Luminoso guerrilla group. Currently, an internationally funded project called the Programa de Desarrollo Alternativo de Prevención y Rehabilitación (Programme for Alternative Development via Prevention and Rehabilitation) is in place in Peru. Its chief objective is to substitute illicit crops for legal agricultural systems. Coca Production in Colombia
A Brief History
During the 1960s Colombia became a producer and exporter of marijuana, which was grown in the Sierra Nevada de Santa Marta and the Serranía del Perijá14. However, the illegal industry’s zenith was not to last due to manual eradication campaigns, confiscation of boats and planes, the destruction of equipment used to process narcotics and, principally, the increased supply of Californian marijuana. Nowadays, marijuana is grown almost exclusively for domestic consumption. Although some exports to the USA have been detected, they are far lower than during the 1970s.15 Towards the end of the 1970s and the start of the 1980s the bonanza coquera (coca bonanza) began. The traffickers began by importing coca base from Bolivia and Peru, and processed it into cocaine in Colombia for re-exportation to the USA. 16 High profits enabled the business to rapidly become self- financing. At the same time, Colombia began to consolidate domestic coca production, and crops were established in areas far from the economic centres of the country (principally the Departments of Caquetá, Guaviare and Putumayo). Colombia’s increased participation in the global drug market led to the strengthening of drug trafficking and the consolidation of the industry (still using imported coca base from Peru and Bolivia). Large scale drug trafficking offered huge earnings and led to the formation of the Medellin, Cali and Caribbean Coast Cartels, who promoted the vertical integration of all stages of production; from growing the plants, supplying the precursors, processing, production and transport, to domestically and internationally commercialising the product via appropriate distribution networks. Equally, money laundering mechanisms and processes were created. As the drug cartels consolidated their control, urban homicide rose (especially in Medellin and Cali) and the judicial system began to deteriorate (evidenced by rising impunity).17 The cartels also began to openly challenge the State-via terrorist attacks and the selective assassination (or threatening) of political leaders-and to bribe and blackmail the different 14 According to Ruiz, marijuana cultivation could have reached 30,000 hectares (Hernando Ruiz, ‘Implicaciones sociales y económicas de la producción de marihuana’, in Marihuana: legalización o represión, Bogotá: ANIF, 1979). 15 Sergio Uribe, ‘Los cultivos ilícitos en Colombia’, in Drogas ilícitas en Colombia: Su impacto económico, político y social , Bogotá: Planeta Colombia Editorial, 1997. 16 The process of converting coca leaf into cocaine is as follows: the leaves are mixed with a solution of kerosene and sodium carbonate, which extracts the alkaloid and produces what is known as coca paste. The paste is then treated with sulphuric acid and potassium permanganate to form cocaine base; finally the base is treated with ether and acetone to obtain high quality cocaine hydrochloride. 17 Fabio Sánchez & Jairo Nuñez, ‘Determinantes del Crimen Violento en un país altamente violento: el caso de Colombia’, in Economía, Crimen y Conflicto, Bogotá: Universidad Nacional de Colombia, 2000; Alejandro Gaviria, ‘Rendimientos Crecientes y la Evolución del Crimen Violento: el Caso Colombiano’, in Economía, Crimen y Conflicto, Bogotá, Universidad Nacional de Colombia, 2001.
7
branches of politics. The Colombian State under different governments began to strengthen the national police and intelligence organisations, and, with the support of the US government, began to persecute the cartels. The Medellin and Cali cartels were the main targets from 1990 to 1996, by which time most of their leaders had been killed or jailed. As the cartels got weaker, control of the cocaine business began to change hands. One part of the business passed into the hands of the second or third generation of cartels (Norte del Valle, Costa, Medellín, Eje Cafetero), and the much of the rest fell under the control of armed groups operating illegally (guerrillas and illegal self-defence groups). The production of coca and the sale of cocaine became one of the groups’ principal sources of financing.18 Drug trafficking has also become an important part of territorial control; it has the double function of offering the groups a social base (in terms of the labour force involved) and the income they need to escalate and expand their armed struggle. At the end of the 1980s, opium poppies began to appear on high-plains and indigenous reserves between 2,200 and 2,800 meters above sea level. 19 According to Ramírez, opium poppy growing zones are characterised by a low institutional presence, a lack of access roads and low coverage of State services.20 During the 1990s there was a dramatic rise in the number of hectares cultivated with opium poppies in the mountainous areas of the departments of Caquetá, Cauca, Huila, Tolima, Cesar, Cundinamarca and Boyacá. Production of opium poppies has also risen alongside the guerrilla force’s expansion; 21 and profits from the production and trafficking of opium poppies have also become a source of financing for the illegal armed groups. Recent Trends
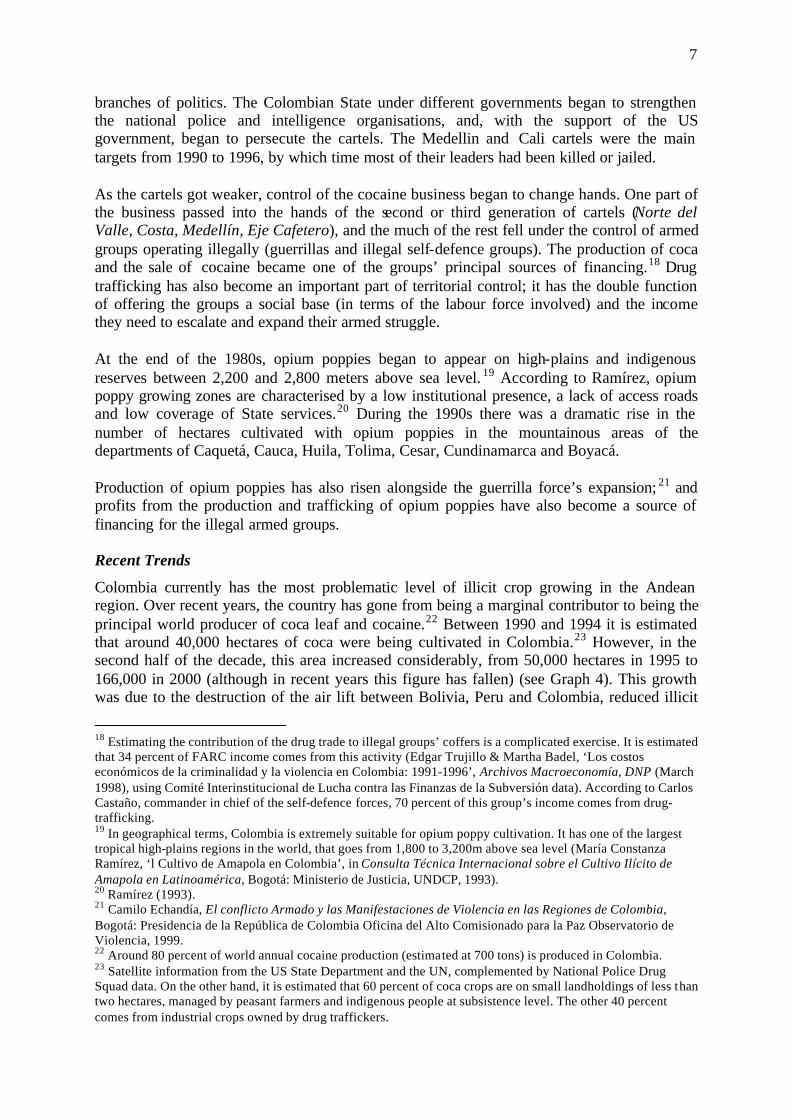
Colombia currently has the most problematic level of illicit crop growing in the Andean region. Over recent years, the country has gone from being a marginal contributor to being the principal world producer of coca leaf and cocaine.22 Between 1990 and 1994 it is estimated that around 40,000 hectares of coca were being cultivated in Colombia.23 However, in the second half of the decade, this area increased considerably, from 50,000 hectares in 1995 to 166,000 in 2000 (although in recent years this figure has fallen) (see Graph 4). This growth was due to the destruction of the air lift between Bolivia, Peru and Colombia, reduced illicit
18 Estimating the contribution of the drug trade to illegal groups’ coffers is a complicated exercise. It is estimated that 34 percent of FARC income comes from this activity (Edgar Trujillo & Martha Badel, ‘Los costos económicos de la criminalidad y la violencia en Colombia: 1991-1996’, Archivos Macroeconomía, DNP (March 1998), using Comité Interinstitucional de Lucha contra las Finanzas de la Subversión data). According to Carlos Castaño, commander in chief of the self-defence forces, 70 percent of this group’s income comes from drug-trafficking. 19 In geographical terms, Colombia is extremely suitable for opium poppy cultivation. It has one of the largest tropical high-plains regions in the world, that goes from 1,800 to 3,200m above sea level (María Constanza Ramírez, ‘l Cultivo de Amapola en Colombia’, in Consulta Técnica Internacional sobre el Cultivo Ilícito de Amapola en Latinoamérica, Bogotá: Ministerio de Justicia, UNDCP, 1993). 20 Ramírez (1993). 21 Camilo Echandía, El conflicto Armado y las Manifestaciones de Violencia en las Regiones de Colombia, Bogotá: Presidencia de la República de Colombia Oficina del Alto Comisionado para la Paz Observatorio de Violencia, 1999. 22 Around 80 percent of world annual cocaine production (estimated at 700 tons) is produced in Colombia. 23 Satellite information from the US State Department and the UN, complemented by National Police Drug Squad data. On the other hand, it is estimated that 60 percent of coca crops are on small landholdings of less than two hectares, managed by peasant farmers and indigenous people at subsistence level. The other 40 percent comes from industrial crops owned by drug traffickers.
8
production in Bolivia and Peru and enhanced demand for narcotics, all accompanied by the illegal groups’ need for financing. 24
Graph 4. Production of coca leaf and opium poppies in Colombia 1991-2000
0
20000
40000
60000
80000
100000
120000
140000
160000
180000
19
91
19
92
19
93
19
94
19
95
19
96
19
97
19
98
19
99
20
00
20
01
20
02
Hecta
res Coca
Poppy
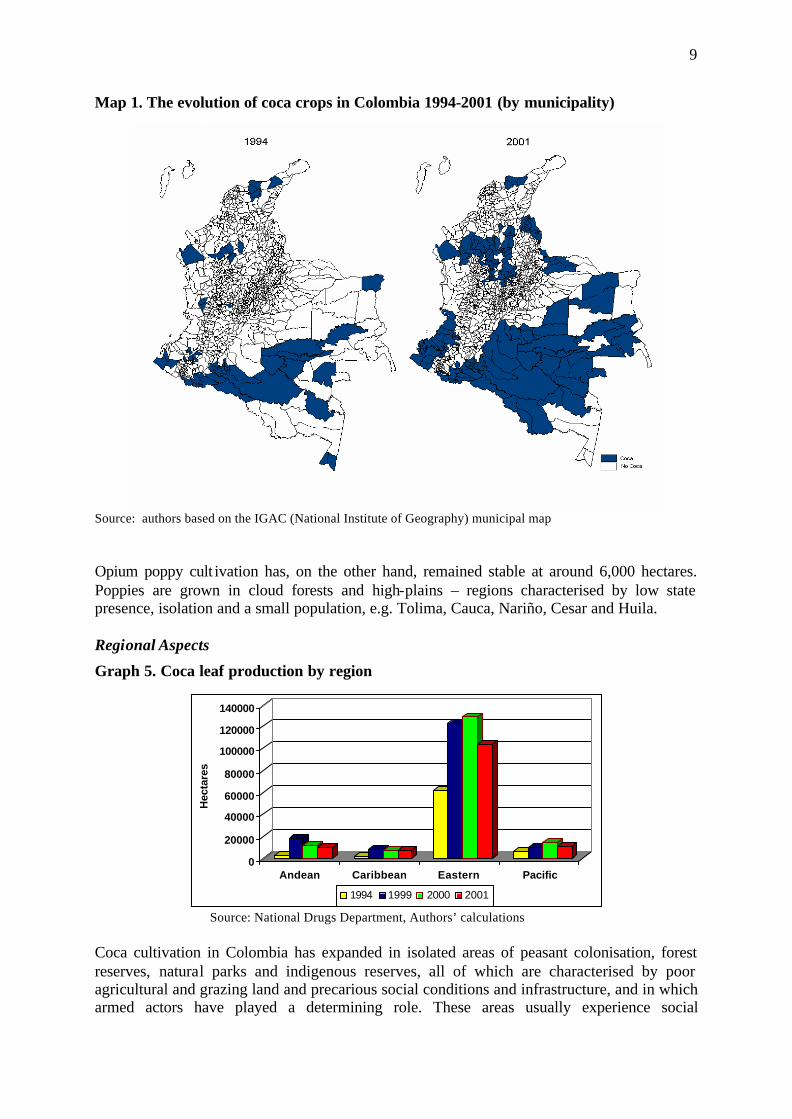
Source: Colombian National Police Force, Antinarcotics Division25 The geographic and spatial expansion of illicit crops has been massive (see Map 1). In 1994 these crops were only grown in a few departments and municipalities in the south of Colombia. Supported by the presence of illegal groups, they subsequently spread wildly throughout the south, south-east and south-west of the country, as well as in some important corridors such as Magdalena Medio (the middle Magdalena region). The three departments with the highest number of cultivated hectares were Putumayo (60,000), Guaviare (27,000) and Nariño (15,000). From 2001 the number of cultivated hectares fell considerably, reaching 102,000 in 2002.26 The most significant reductions were in Putumayo, Meta, Cauca and Caquetá, mainly due to aerial spraying. Furthermore, there has been a substantial amount of voluntary eradication in other departments, especially Bolívar, Meta, Cauca and Vichada. This drop in cultivation has been due to the three pronged approach of the current anti-drugs policy: forced eradication, the systematic interdiction of the production chain and alternative development programmes. Aerial fumigation has been the most heavily used tool of the war on drugs since the end of the 70s, and its employment intensified from the mid-90s (see Annex, Table A1). Between 1999 and 2001, more than 195,000 hectares were fumigated – 48 percent of this total (more than 94,000 hectares) in 2001 alone. Alternative development programmes, designed to substitute the coca-cocaine cycle with legal agricultural initiatives, have become ever more important since the National Alternative Development Plan was created in 1994, and again with Plan Colombia.27 24 The growth of this activity in Colombia is due to its high levels of profitability, especially in the distribution stage, its low agro economic cost and the trans-national nature of the business 25 The opium poppy data comes from the second national aerial census of illicit poppy crops, October 2001. The 2002 data comes from the US anti-drugs tsar John Waltes, ‘El 60 percent de la heroína que se consume en Estados Unidos proviene de Colombia’, El Tiempo (13 May 2003). 26 SIMCI data, Sistema Integrado de Monitoreo de Cultivos Ilícitos (Illicit Crop Monitoring Integral System), using satellite analysis methodology complemented by aerial information on areas with illegal crops. The reliability of the results is estimated to be +/- 90 percent. 27 By 2001, 54,551 families had benefited from this type of program (DNE).
9
Map 1. The evolution of coca crops in Colombia 1994-2001 (by municipality)
Source: authors based on the IGAC (National Institute of Geography) municipal map Opium poppy cult ivation has, on the other hand, remained stable at around 6,000 hectares. Poppies are grown in cloud forests and high-plains – regions characterised by low state presence, isolation and a small population, e.g. Tolima, Cauca, Nariño, Cesar and Huila. Regional Aspects
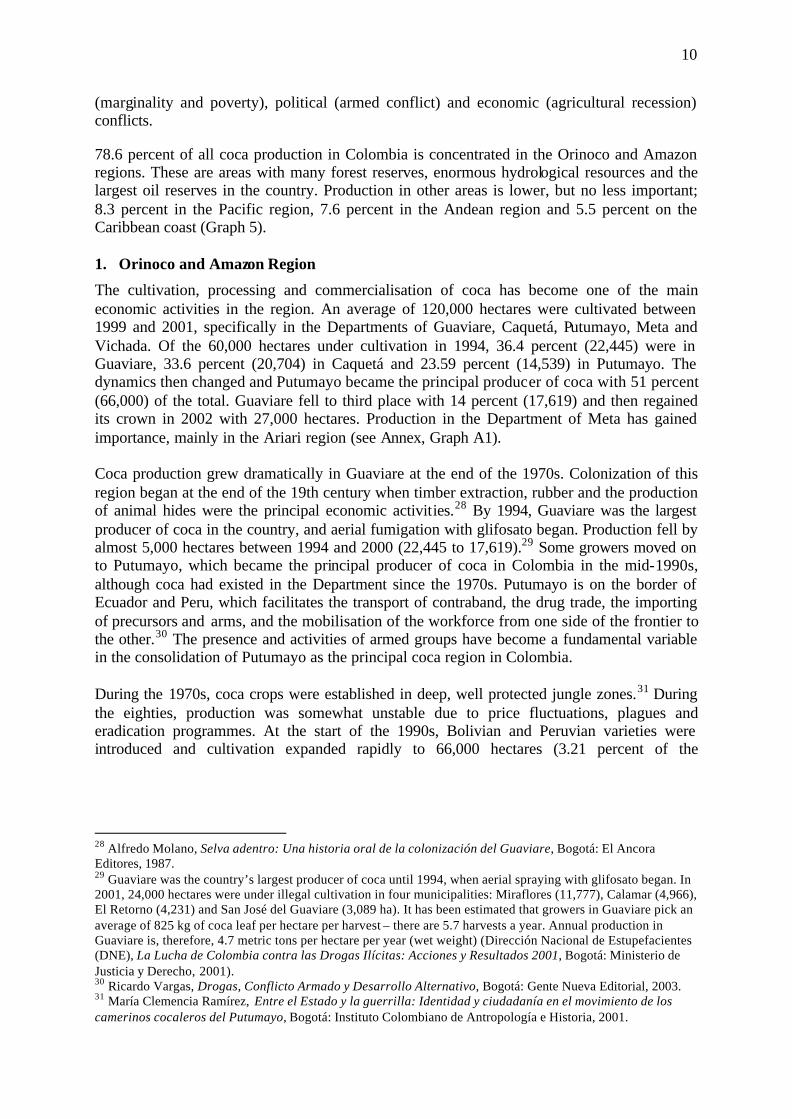
Graph 5. Coca leaf production by region
0
20000
40000
60000
80000
100000
120000
140000
Hec
tare
s
Andean Caribbean Eastern Pacific
1994 1999 2000 2001
Source: National Drugs Department, Authors’ calculations Coca cultivation in Colombia has expanded in isolated areas of peasant colonisation, forest reserves, natural parks and indigenous reserves, all of which are characterised by poor agricultural and grazing land and precarious social conditions and infrastructure, and in which armed actors have played a determining role. These areas usually experience social
10
(marginality and poverty), political (armed conflict) and economic (agricultural recession) conflicts. 78.6 percent of all coca production in Colombia is concentrated in the Orinoco and Amazon regions. These are areas with many forest reserves, enormous hydrological resources and the largest oil reserves in the country. Production in other areas is lower, but no less important; 8.3 percent in the Pacific region, 7.6 percent in the Andean region and 5.5 percent on the Caribbean coast (Graph 5). 1. Orinoco and Amazon Region
The cultivation, processing and commercialisation of coca has become one of the main economic activities in the region. An average of 120,000 hectares were cultivated between 1999 and 2001, specifically in the Departments of Guaviare, Caquetá, Putumayo, Meta and Vichada. Of the 60,000 hectares under cultivation in 1994, 36.4 percent (22,445) were in Guaviare, 33.6 percent (20,704) in Caquetá and 23.59 percent (14,539) in Putumayo. The dynamics then changed and Putumayo became the principal producer of coca with 51 percent (66,000) of the total. Guaviare fell to third place with 14 percent (17,619) and then regained its crown in 2002 with 27,000 hectares. Production in the Department of Meta has gained importance, mainly in the Ariari region (see Annex, Graph A1). Coca production grew dramatically in Guaviare at the end of the 1970s. Colonization of this region began at the end of the 19th century when timber extraction, rubber and the production of animal hides were the principal economic activities.28 By 1994, Guaviare was the largest producer of coca in the country, and aerial fumigation with glifosato began. Production fell by almost 5,000 hectares between 1994 and 2000 (22,445 to 17,619).29 Some growers moved on to Putumayo, which became the principal producer of coca in Colombia in the mid-1990s, although coca had existed in the Department since the 1970s. Putumayo is on the border of Ecuador and Peru, which facilitates the transport of contraband, the drug trade, the importing of precursors and arms, and the mobilisation of the workforce from one side of the frontier to the other.30 The presence and activities of armed groups have become a fundamental variable in the consolidation of Putumayo as the principal coca region in Colombia. During the 1970s, coca crops were established in deep, well protected jungle zones.31 During the eighties, production was somewhat unstable due to price fluctuations, plagues and eradication programmes. At the start of the 1990s, Bolivian and Peruvian varieties were introduced and cultivation expanded rapidly to 66,000 hectares (3.21 percent of the
28 Alfredo Molano, Selva adentro: Una historia oral de la colonización del Guaviare, Bogotá: El Ancora Editores, 1987. 29 Guaviare was the country’s largest producer of coca until 1994, when aerial spraying with glifosato began. In 2001, 24,000 hectares were under illegal cultivation in four municipalities: Miraflores (11,777), Calamar (4,966), El Retorno (4,231) and San José del Guaviare (3,089 ha). It has been estimated that growers in Guaviare pick an average of 825 kg of coca leaf per hectare per harvest – there are 5.7 harvests a year. Annual production in Guaviare is, therefore, 4.7 metric tons per hectare per year (wet weight) (Dirección Nacional de Estupefacientes (DNE), La Lucha de Colombia contra las Drogas Ilícitas: Acciones y Resultados 2001, Bogotá: Ministerio de Justicia y Derecho, 2001). 30 Ricardo Vargas, Drogas, Conflicto Armado y Desarrollo Alternativo, Bogotá: Gente Nueva Editorial, 2003. 31 María Clemencia Ramírez, Entre el Estado y la guerrilla: Identidad y ciudadanía en el movimiento de los camerinos cocaleros del Putumayo, Bogotá: Instituto Colombiano de Antropología e Historia, 2001.
11
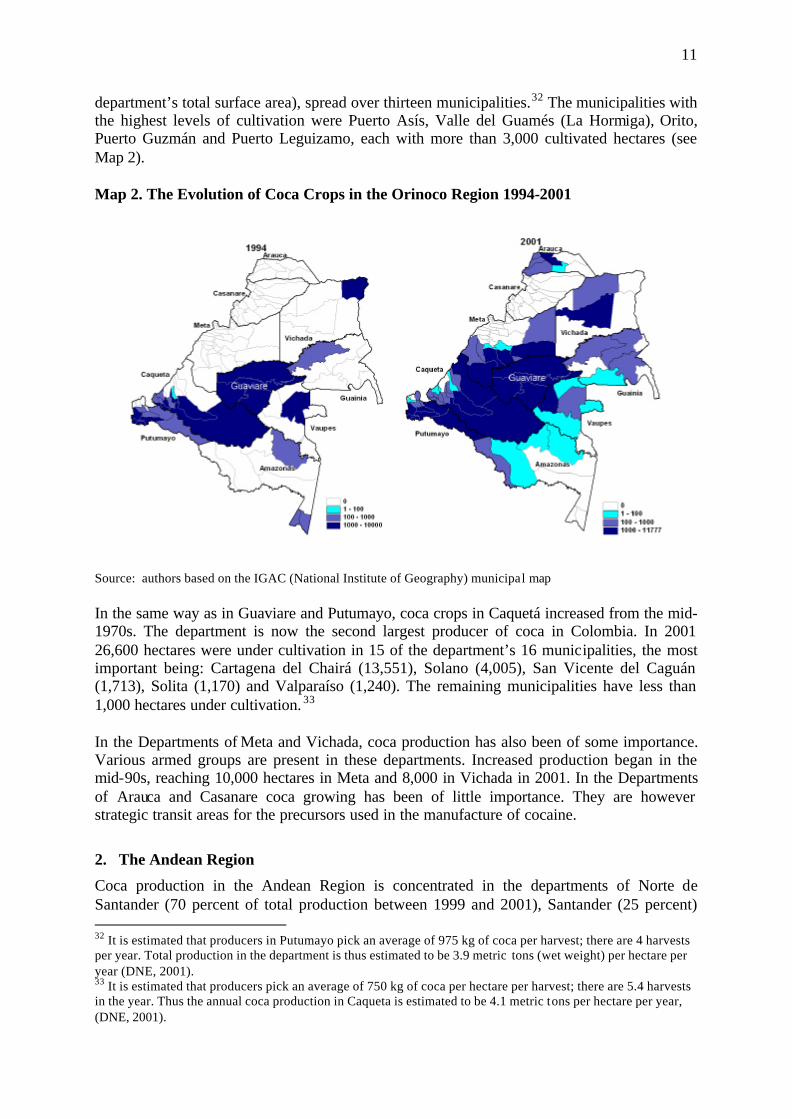
department’s total surface area), spread over thirteen municipalities.32 The municipalities with the highest levels of cultivation were Puerto Asís, Valle del Guamés (La Hormiga), Orito, Puerto Guzmán and Puerto Leguizamo, each with more than 3,000 cultivated hectares (see Map 2). Map 2. The Evolution of Coca Crops in the Orinoco Region 1994-2001
Source: authors based on the IGAC (National Institute of Geography) municipal map In the same way as in Guaviare and Putumayo, coca crops in Caquetá increased from the mid-1970s. The department is now the second largest producer of coca in Colombia. In 2001 26,600 hectares were under cultivation in 15 of the department’s 16 municipalities, the most important being: Cartagena del Chairá (13,551), Solano (4,005), San Vicente del Caguán (1,713), Solita (1,170) and Valparaíso (1,240). The remaining municipalities have less than 1,000 hectares under cultivation. 33 In the Departments of Meta and Vichada, coca production has also been of some importance. Various armed groups are present in these departments. Increased production began in the mid-90s, reaching 10,000 hectares in Meta and 8,000 in Vichada in 2001. In the Departments of Arauca and Casanare coca growing has been of little importance. They are however strategic transit areas for the precursors used in the manufacture of cocaine.
2. The Andean Region
Coca production in the Andean Region is concentrated in the departments of Norte de Santander (70 percent of total production between 1999 and 2001), Santander (25 percent) 32 It is estimated that producers in Putumayo pick an average of 975 kg of coca per harvest; there are 4 harvests per year. Total production in the department is thus estimated to be 3.9 metric tons (wet weight) per hectare per year (DNE, 2001). 33 It is estimated that producers pick an average of 750 kg of coca per hectare per harvest; there are 5.4 harvests in the year. Thus the annual coca production in Caqueta is estimated to be 4.1 metric tons per hectare per year, (DNE, 2001).
12
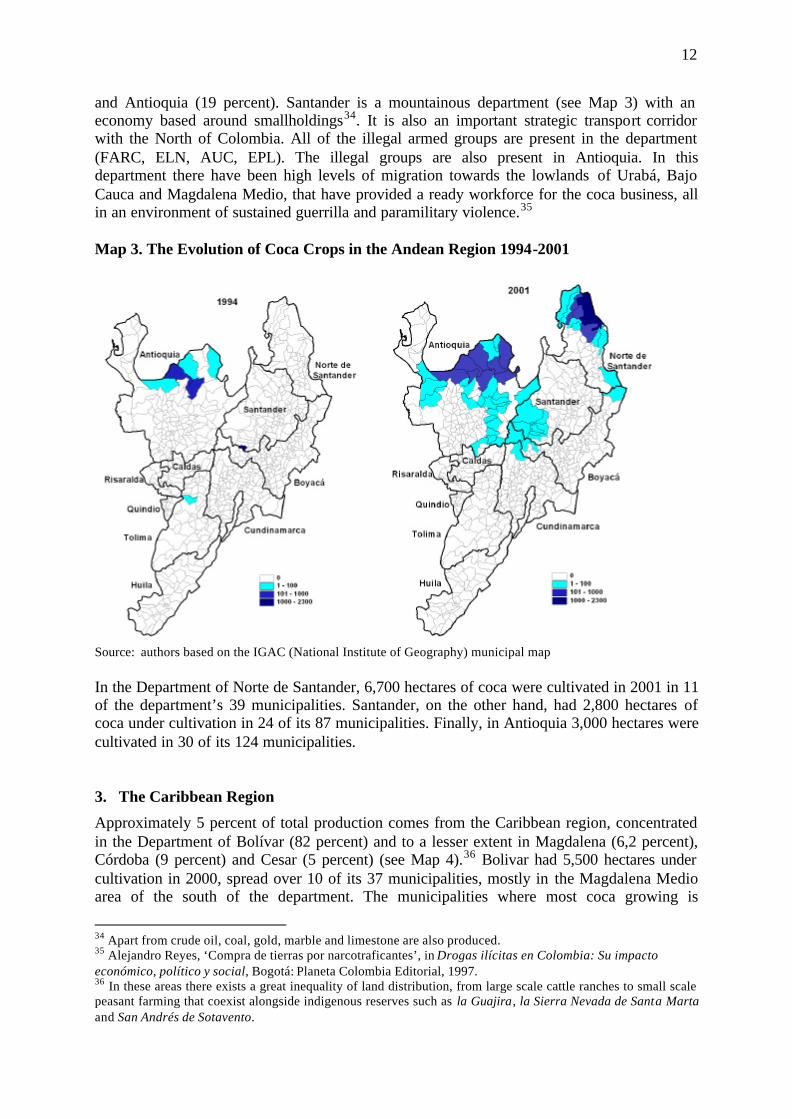
and Antioquia (19 percent). Santander is a mountainous department (see Map 3) with an economy based around smallholdings34. It is also an important strategic transport corridor with the North of Colombia. All of the illegal armed groups are present in the department (FARC, ELN, AUC, EPL). The illegal groups are also present in Antioquia. In this department there have been high levels of migration towards the lowlands of Urabá, Bajo Cauca and Magdalena Medio, that have provided a ready workforce for the coca business, all in an environment of sustained guerrilla and paramilitary violence.35 Map 3. The Evolution of Coca Crops in the Andean Region 1994-2001
Source: authors based on the IGAC (National Institute of Geography) municipal map In the Department of Norte de Santander, 6,700 hectares of coca were cultivated in 2001 in 11 of the department’s 39 municipalities. Santander, on the other hand, had 2,800 hectares of coca under cultivation in 24 of its 87 municipalities. Finally, in Antioquia 3,000 hectares were cultivated in 30 of its 124 municipalities. 3. The Caribbean Region
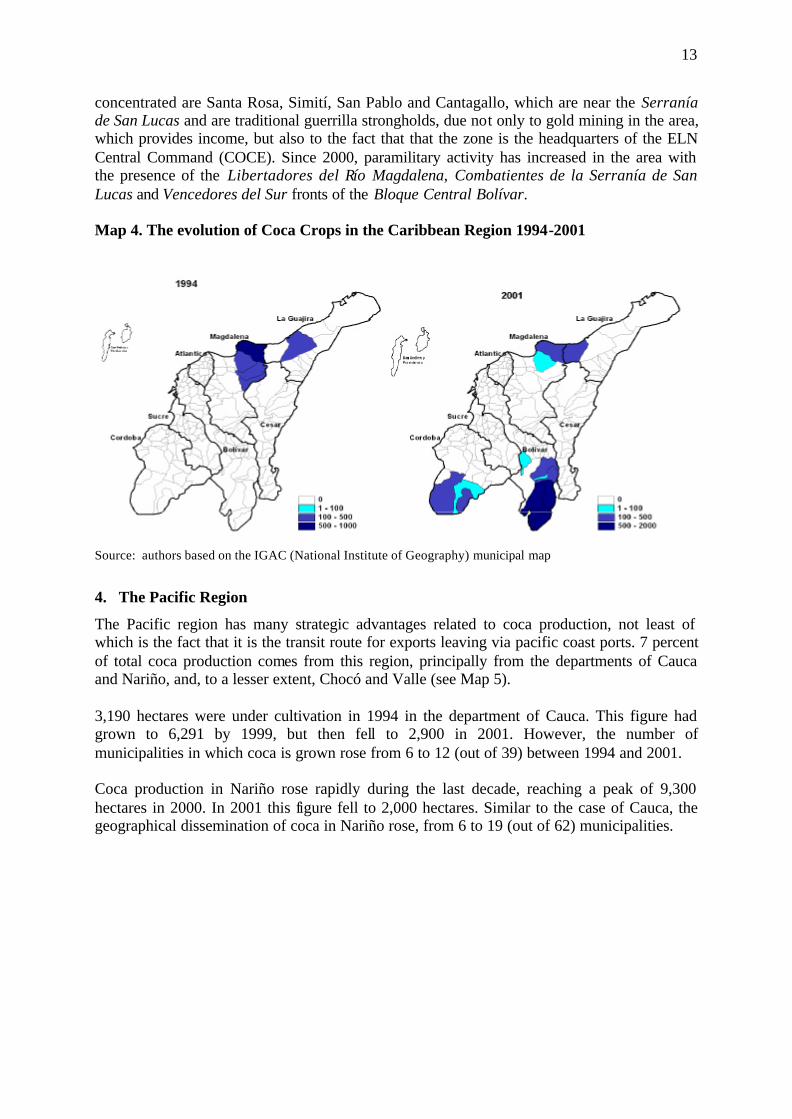
Approximately 5 percent of total production comes from the Caribbean region, concentrated in the Department of Bolívar (82 percent) and to a lesser extent in Magdalena (6,2 percent), Córdoba (9 percent) and Cesar (5 percent) (see Map 4).36 Bolivar had 5,500 hectares under cultivation in 2000, spread over 10 of its 37 municipalities, mostly in the Magdalena Medio area of the south of the department. The municipalities where most coca growing is
34 Apart from crude oil, coal, gold, marble and limestone are also produced. 35 Alejandro Reyes, ‘Compra de tierras por narcotraficantes’, in Drogas ilícitas en Colombia: Su impacto económico, político y social, Bogotá: Planeta Colombia Editorial, 1997. 36 In these areas there exists a great inequality of land distribution, from large scale cattle ranches to small scale peasant farming that coexist alongside indigenous reserves such as la Guajira, la Sierra Nevada de Santa Marta and San Andrés de Sotavento.
13
concentrated are Santa Rosa, Simití, San Pablo and Cantagallo, which are near the Serranía de San Lucas and are traditional guerrilla strongholds, due not only to gold mining in the area, which provides income, but also to the fact that that the zone is the headquarters of the ELN Central Command (COCE). Since 2000, paramilitary activity has increased in the area with the presence of the Libertadores del Río Magdalena, Combatientes de la Serranía de San Lucas and Vencedores del Sur fronts of the Bloque Central Bolívar. Map 4. The evolution of Coca Crops in the Caribbean Region 1994-2001
Source: authors based on the IGAC (National Institute of Geography) municipal map
4. The Pacific Region
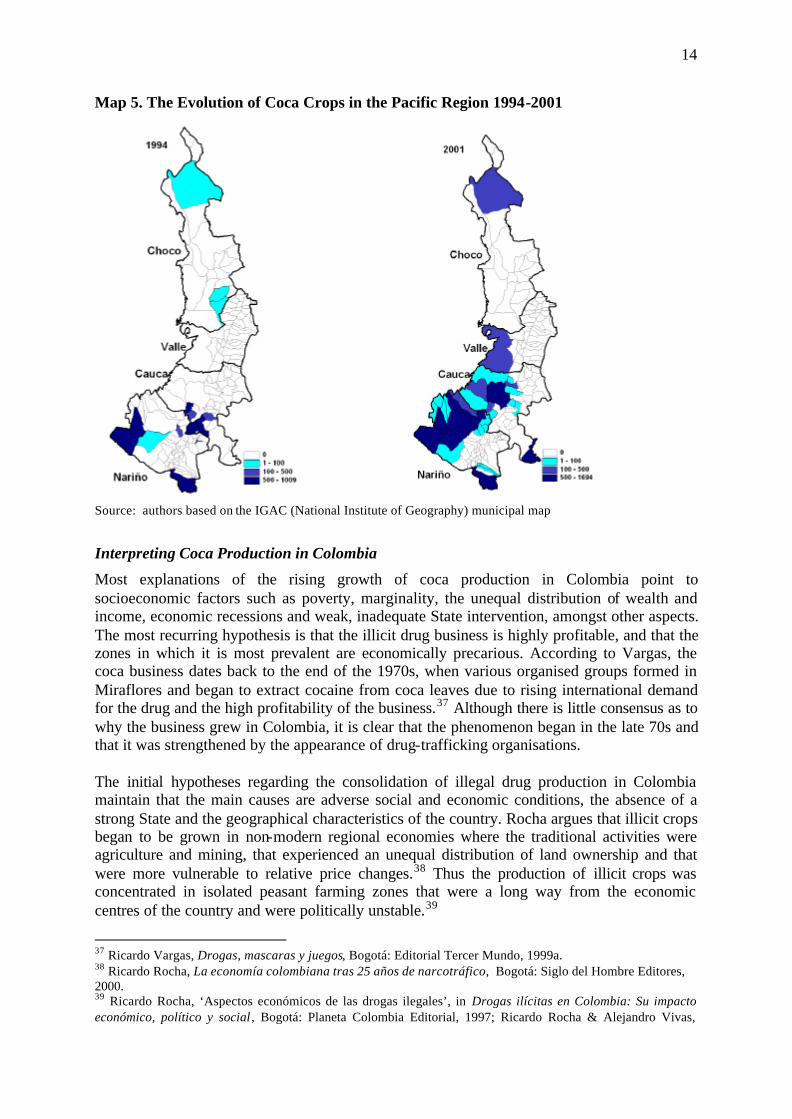
The Pacific region has many strategic advantages related to coca production, not least of which is the fact that it is the transit route for exports leaving via pacific coast ports. 7 percent of total coca production comes from this region, principally from the departments of Cauca and Nariño, and, to a lesser extent, Chocó and Valle (see Map 5). 3,190 hectares were under cultivation in 1994 in the department of Cauca. This figure had grown to 6,291 by 1999, but then fell to 2,900 in 2001. However, the number of municipalities in which coca is grown rose from 6 to 12 (out of 39) between 1994 and 2001. Coca production in Nariño rose rapidly during the last decade, reaching a peak of 9,300 hectares in 2000. In 2001 this figure fell to 2,000 hectares. Similar to the case of Cauca, the geographical dissemination of coca in Nariño rose, from 6 to 19 (out of 62) municipalities.
14
Map 5. The Evolution of Coca Crops in the Pacific Region 1994-2001
Source: authors based on the IGAC (National Institute of Geography) municipal map
Interpreting Coca Production in Colombia
Most explanations of the rising growth of coca production in Colombia point to socioeconomic factors such as poverty, marginality, the unequal distribution of wealth and income, economic recessions and weak, inadequate State intervention, amongst other aspects. The most recurring hypothesis is that the illicit drug business is highly profitable, and that the zones in which it is most prevalent are economically precarious. According to Vargas, the coca business dates back to the end of the 1970s, when various organised groups formed in Miraflores and began to extract cocaine from coca leaves due to rising international demand for the drug and the high profitability of the business.37 Although there is little consensus as to why the business grew in Colombia, it is clear that the phenomenon began in the late 70s and that it was strengthened by the appearance of drug-trafficking organisations. The initial hypotheses regarding the consolidation of illegal drug production in Colombia maintain that the main causes are adverse social and economic conditions, the absence of a strong State and the geographical characteristics of the country. Rocha argues that illicit crops began to be grown in non-modern regional economies where the traditional activities were agriculture and mining, that experienced an unequal distribution of land ownership and that were more vulnerable to relative price changes.38 Thus the production of illicit crops was concentrated in isolated peasant farming zones that were a long way from the economic centres of the country and were politically unstable.39
37 Ricardo Vargas, Drogas, mascaras y juegos, Bogotá: Editorial Tercer Mundo, 1999a. 38 Ricardo Rocha, La economía colombiana tras 25 años de narcotráfico, Bogotá: Siglo del Hombre Editores, 2000. 39 Ricardo Rocha, ‘Aspectos económicos de las drogas ilegales’, in Drogas ilícitas en Colombia: Su impacto económico, político y social , Bogotá: Planeta Colombia Editorial, 1997; Ricardo Rocha & Alejandro Vivas,
15
Similarly, Vargas found that illicit crops were most prevalent in regions with a total absence of State presence and high levels of violence, where guerrilla groups later arrived to “impose order” and support the peasant farmers.40 Vargas has also argued that factors such as a weak State presence, armed illegal groups and the production and trafficking of illicit crops generate higher levels of violence in a region. The problem worsens as it spreads to neighbouring municipalities.41 Thoumi states that Colombia was the perfect place for the establishment and consolidation of narcotics production due to the lack of State presence, the patronal system, the violent nature of society and the existing culture of illegal exports.42 The large number of Colombian immigrants in the USA facilitated the development of distribution networks. However, Thoumi rejects the arguments related to poverty and inequality as the root cause of the illegal economy and denies the relationship between poverty and the cultivation of illicit crops.43 Other hypotheses maintain that regional crises during the 1980s in the cotton, textiles, sugar and emerald markets drove the development of coca production. To these factors may be added the crisis of profitability and competitivity, the difficulties related to finance and the accumulation of capital, the limitations associated with obtaining advanced technology and a precarious commercial infrastructure.44 Similarly, De Rementería states that the coca industry was established due to the unjust conditions of international commerce that Latin American countries have to face. Specifically, the author studies the appearance of illicit crops in terms of the adverse conditions created by an agricultural crisis. According to the author, the origins of the crisis are the subsidies that industrialised countries began to pay their farmers, which then generated competitive disadvantages for producers in developing countries. The response has been to minimise costs by extensively using land, amplifying the agricultural frontier or substituting production with natural drugs.45 Mora et al. state that colonisation and coca crops do not generate permanent social riches in an area; on the contrary, they generate resource and labour exploitation. 46 Tovar considers that coca has become an alternative source of capital in marginal communities that want to better their conditions and overcome the exclusion they have suffered at the hands of the traditional dominant classes.47 The investigations mentioned show some of the diverse hypotheses regarding the origin, causes and consequences of illicit drug production in Colombia; most of them are based on ‘Crecimiento regional en Colombia: ¿Persiste la desigualdad?’, Revista de economía del Rosario, 1:1 (January 1998), pp.67-108; and Thoumi (2002). 40 Ricardo Vargas, ‘La bonanza de la marimba empezó aquí’, in La Verdad del ’93: paz, derechos humanos y violencia, Bogotá: CINEP, 1994. 41 Vargas (1999a). 42 Francisco E. Thoumi, Economía política y narcotráfico, Bogotá: Tercer Mundo, 1994. 43 Thoumi (2002). 44 Darío Betancourt & Martha L. García, Contrabandistas, marimberos y mafiosos: historia social de la mafia colombiana (1965 – 1992), Bogotá: Tercer Mundo, 1994. 45 Ibán de Rementería, La guerra de las drogas: Cultivos ilícitos y desarrollo alternativo , Bogotá: Editorial Planeta Colombiana SA, 2001. 46 Leonidas Mora, Jaime Jaramillo & Fernando Cubides, Colonización Coca y Guerilla, Bogotá: Alianza Editores Colombiana, 1986. 47 Hermes Tovar, Colombia: droga, economía, guerra y paz, Bogotá: Planeta Colombiana Editorial, 1999.
16
much qualitative but little quantitative evidence. However, no investigation has been carried out about the spatial dynamics of illicit crops and their relationship with illegal armed groups. Thus, the purpose of this investigation is to offer empirical evidence to show that the intensification of the Colombian armed conflict has been the main cause behind the expansion of illicit crops in Colombia. Financing Armed Conflict and Illegal Crops: Developing a Model
Recent Literature on Financing Armed Conflict
Internal armed conflicts may be defined as the confrontation between State forces and organised armed groups that are fighting for a determined political, ideological or economic end, including, in some cases, the subversion of a pre-established social order. It should be noted that although social, political, economic and international conditions may be the cause of confrontation, they are often not in themselves enough to generate armed conflict. One of the most important factors related to the growth, development and consolidation of a rebel group is its financial viability;48 this is its guarantee of survival, and allows the group to scale up its armed activities. The financial viability of rebels or insurgents, and more specifically the depredation of productive activities in the zone in which they operate, have become the subject of economic analysis. In recent literature, insurgents are seen as political agentswhose final objective is to maximise their own benefits via the depredation of productive economic activities, whether they be legal or not.49 Hirshleifer states that a conflict depends on the level of profitability of depredation – each group of contenders invests its efforts (militants, arms, munitions, etc.) with the hope of winning a share of the bounty. Thus, the result of the conflict depends on the rebel group’s ability to transform its resources into an offensive capacity in different geographical conditions and human contexts. If both contenders enjoy an increase in their wealth, the richest of the two will advance, and smaller contenders will become non-viable or will become dominated by the bigger players over time.50 Similarly, Grossman developed general equilibrium models to analyse insurrection and revolutionary movements, in which rebellion is a non-productive activity that competes with productive activities for society’s scarce resources51. In the models there are two main agents: the government and peasant families.52 The result of the confrontation depends on the technologies of insurrection, production and repression. In the case that insurrection is successful, the peasants’ bounty will be the government’s resources and clients. Equally, Collier and Hoeffler (1998, 2001) and Collier (2000), believe that civil wars arise only if there are financially viable organisations, and that the circumstances under which they
48 It is important to note that financial viability is a necessary, but is not the only factor in the generation of a conflict situation. 49 In some cases, rebels are seen as an extreme manifestation of organised crime. 50 Jack Hirshleifer, ‘The Technology of Conflict as an Economic Activity’, UCLA Working Paper 491, Los Angeles: UCLA, 1990. 51 Herschel Grossman, ‘A General Equilibrium Model of Insurrections’, American Economic Review, 81:4 (1991), pp.912-921; and ‘Kleptocracy and Revolutions’, Oxford Economic Paper, 51 (1994), pp 267-283. 52 The government hopes to maximise income from its clients, and thus taxes land and productive activities and employs soldiers to dissuade or repress insurrection. For their part, peasant families respond to government policies by assigning time to production, militancy or insurrection.
17
exist are genuinely exceptional.53 There is, therefore, a wide gap between popular perceptions of the causes of conflict and the results of recent economic analyses. Popular perception sees rebellion as a social movement motivated by extreme discontent. In reality it matters little whether the rebels are motivated by greed, by a desire for power or due to their discontent, which is why the feasibility of depredation is a cause of conflict. Collier and Hoffler state that the abundance of natural resources is the factor most closely linked to the rise of a civil conflict.54 In contrast, DiJohn argues that natural resources per se do not cause conflict. Civil wars are rather the result of country specific historical and political processes, and once the conflict is underway the existence of natural resources makes possible the prolongation of the war.55 However, one must remember that the end result of depredation is different between rebel groups and criminal organisations. According to Restrepo an organisation in conflict reinvests all its resources in the armed struggle, that is, it increases its military apparatus and the offensive use of violence.56 Criminal organisations, on the other hand, look towards increasing profits. In this context, Gutiérrez states that Collier and Hoefler’s ‘greedy war’ hypothesis may not be strictly applied to the Colombian case. In spite of the fact that economic incentives for combatants are precarious, there is a degree of individual motivation to fight that the ‘greedy war’ theory cannot explain. In addition, this hypothesis does not contemplate possible interrelations between the different groups and social organisations.57 The Colombian armed conflict began in the 1960s and, after a long period in hibernation during which its growth was precarious and limited to a few rural areas, especially colonisation zones at the frontiers of agricultural expansion, the rebel groups (FARC, ELN and illegal self-defence forces specifically) began a process of accelerated growth in the 1980s. This numerical growth and territorial expansion, as well as a significant increase in their capacity for military action, was linked to their new economic prosperity. 58 This prosperity came from the exploitation of legal and illegal exports, without directly participating in them and thus without incurring the direct costs of military activity.59 The depredation of productive activities by armed groups in Colombia has taken place through three stages according to Rangel: predatory, parasitic and symbiotic. The predatory stage is when the groups have very weak links with the population and, therefore, their activities require minimum exposure and produce one-off benefits (activities such as territorial piracy, bank robberies, random kidnappings, occasional extortion, amongst others). The parasitic phase begins following long-term social infiltration and includes activities such
53 Paul Collier & Anne Hoeffler, ‘On Economic Causes of Civil War’, Oxford Economic Papers 50 (1998), pp.563-573; and ‘Greed and Grievance in Civil War’, World Bank Working Paper, CSAE WPS/2002-01 (2001). Paul Collier, ‘Economic Causes of Civil Conflicts and their Implications for Policy’, World Bank Working Paper (June 2000). 54 Collier & Hoeffler (1998, 2001). 55 Jonathan DiJohn, ‘Mineral Resource Abundance and Violent Political Conflict: A Critical Assesment of the Rentier State Hypothesis’, Crisis State Working Paper, 20, London: London School of Economics, 2002. 56 Jorge Alberto Restrepo, ‘Análisis económico de conflictos internos’, Documento prepared for Fundación Ideas para la Paz, 2001. This is not to say that top officials are not remunerated, that hierarchy does not determine the level of remuneration, nor that there is no personal enrichment, on whatever side, due to the conflict. 57 Francisco Gutiérrez, ‘Criminal Rebels? A Discussion on War and Criminality from the Colombian Experience’, Crisis States Working Paper, 17, London: London School of Economics, 2003. 58 Alfredo Rangel, Guerra Insurgente: conflicto es Malasia, Perú, Filipina, El Salvador y Colombia, Bogota: Editorial Intermedio, 2001. 59 Boris Salazar & María del Pilar Castillo, La Hora de los Dinosaurios: conflicto y depredación en Colombia, Bogotá: Fondo Editorial CEREC, 2001.
18
as protection-based extortion, amongst others. Finally, there is the symbiotic stage in which the guerrilla economy becomes an integral part of the regional economy and the distinction between legal and illegal activities becomes blurred.60 The principal sources of financing for illegal armed groups, in whichever stage, have traditionally been extortion, different types of robbery, kidnapping, scams, piracy, the theft of municipal fiscal resources and, recently, drug-trafficking; the latter having become a principal source of financing. 61 In fact, the guerrillas’ role in the drug trade was initially el gramaje (a by weight tax on the production of coca leaf or coca base of between 10 percent and 15 percent) charged to peasant farmers, and the taxes levied on the laboratories, runways and river ports used by drug-traffickers, in exchange for guaranteeing their security. During the 1990s, guerrilla participation grew considerably; they established their own system of production, transport and commercialisation of both precursors and the final product.62 The way in which the guerrillas control and regulate the coca business in Colombia is a classic example of the symbiotic relationship between insurgency and the regional economy, and, in some areas, the distinction between what is legal and what is not has all but disappeared. Similarly, the illegal self-defence groups grew and developed between 1982 and 1994, to offer security to the population in the face of guerrilla actions and to protect land ownership.63 In 1994, the first paramilitary summit was held with the objective of unifying the command structure, concentrating operations and expanding the movement throughout the country. This strategy was consolidated by offensive action, and in the mid-1990s the exponential growth of violent paramilitary activity began. This growth happened alongside a growth in their sources of financing, which until then had been based on the payment of obligatory fees for their security services, donations from large-scale landowners and the middle classes and, finally, their links with the drug-trade. In recent years, guerrilla (FARC and ELN) and paramilitary links with the production, processing and commercialisation of illegal drugs have become ever stronger.64 A struggle has evolved for the control of strategic zones, related as much to finances as to the armed struggle itself.65 The money that comes from these sources of financing is reinvested in strengthening the war machine. Although this does not allow us to establish a direct link between illicit crops and violence, it does show the enormous importance of this activity to guerrilla finances and the drug-trade. Bottía stated that the FARC are dedicated to expanding their sphere of influence to include the municipalities that guarantee their continued
60 Alfredo Rangel, Colombia: Guerra en el fin de siglo, Bogotá: Editorial Tercer Mundo, 2000. 61 Vargas (1999a) analysed guerrillas finances over the period 1991-1996 and concluded that 44.4 percent came from drug-trafficking; 27.4 percent from extortion and robbery; 21.9 percent from kidnapping, and 6.3 percent from municipal funds (Quoted in Thoumi, 2002). 62 Jesús E. La Rotta, Las finanzas de la Subversión Colombiana: una forma de explotar la nación , Bogotá: Alianza Editorial Colombiana, 1996; Vargas (2003). 63 In Colombia, the organisation of armed civilian groups by the State or local leaders began in the 19th century. The practice effectively ended around the 1940s and 50s, when the armed groups were formed that contributed to the period known as ‘La Violencia’. In 1965, decree 3398 defined the defence of the nation as “the organisation provision and employment of all the inhabitants and resources of the country, in peacetime, to guarantee national independence and institutional stability” and gave temporary powers to the Ministry of Defence to arm civilians. The decree was incorporated into law 48, 1968. 64 Echandía (1999). 65 Thoumi (2002) states that fighting between the guerrillas and paramilitaries for control of areas such as Urabá, is an indication of both groups’ need to control strategic drug-trafficking routes, which are also used to import arms and precursors.
19
financing. 66 Sánchez et al. conclude that drug-trafficking is a crime that is closely linked to the expansion of illegal armed groups, that is, that the increase in illegal crops is the result of these groups’ expansion. 67 Although great advances have been made in terms of analysing the relationship between armed groups and coca production in Colombia, no analysis has yet been made into the dynamics of illegal crop expansion and its relationship with the armed conflict. Below we present a theoretical model that explains this relationship. A Theoretical Model of the Relationship Between Coca and the Conflict
1. The Model
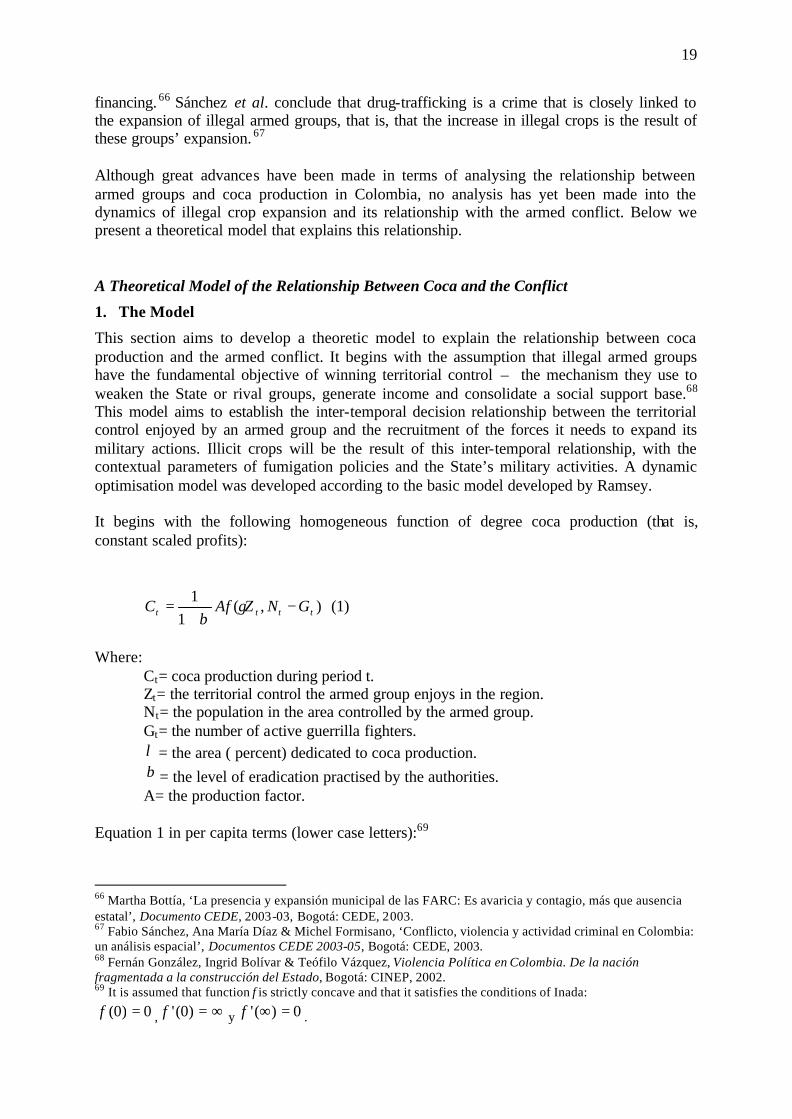
This section aims to develop a theoretic model to explain the relationship between coca production and the armed conflict. It begins with the assumption that illegal armed groups have the fundamental objective of winning territorial control – the mechanism they use to weaken the State or rival groups, generate income and consolidate a social support base.68 This model aims to establish the inter-temporal decision relationship between the territorial control enjoyed by an armed group and the recruitment of the forces it needs to expand its military actions. Illicit crops will be the result of this inter-temporal relationship, with the contextual parameters of fumigation policies and the State’s military activities. A dynamic optimisation model was developed according to the basic model developed by Ramsey. It begins with the following homogeneous function of degree coca production (that is, constant scaled profits):
),(1
1tttt GNZAfC −
+= γ
β (1)
Where:
Ct= coca production during period t. Zt= the territorial control the armed group enjoys in the region. Nt= the population in the area controlled by the armed group. Gt= the number of active guerrilla fighters. λ = the area ( percent) dedicated to coca production. β = the level of eradication practised by the authorities. A= the production factor.
Equation 1 in per capita terms (lower case letters):69
66 Martha Bottía, ‘La presencia y expansión municipal de las FARC: Es avaricia y contagio, más que ausencia estatal’, Documento CEDE, 2003-03, Bogotá: CEDE, 2003. 67 Fabio Sánchez, Ana María Díaz & Michel Formisano, ‘Conflicto, violencia y actividad criminal en Colombia: un análisis espacial’, Documentos CEDE 2003-05, Bogotá: CEDE, 2003. 68 Fernán González, Ingrid Bolívar & Teófilo Vázquez, Violencia Política en Colombia. De la nación fragmentada a la construcción del Estado, Bogotá: CINEP, 2002. 69 It is assumed that function f is strictly concave and that it satisfies the conditions of Inada:
0)0( =f , ∞=)0('f y 0)(' =∞f .
20
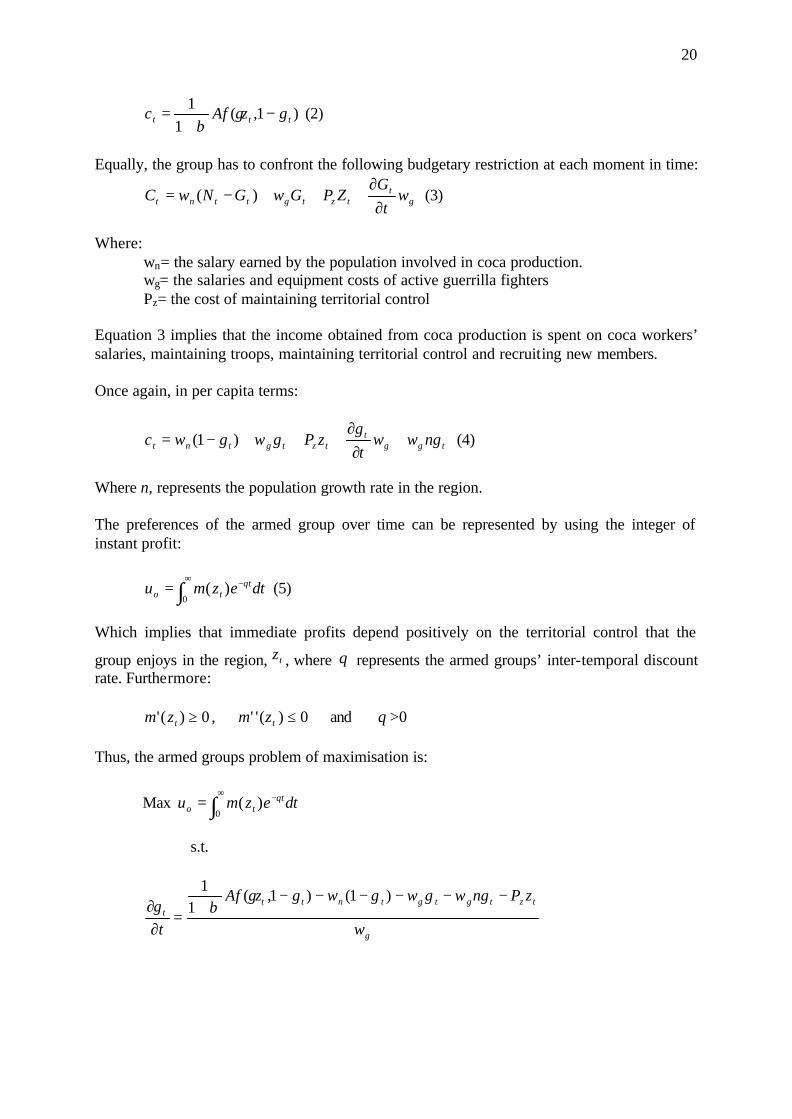
)1,(1
1ttt gzAfc −
+= γ
β (2)
Equally, the group has to confront the following budgetary restriction at each moment in time:
gt
tztgttnt wt
GZPGwGNwC
∂∂
+++−= )( (3)
Where:
wn= the salary earned by the population involved in coca production. wg= the salaries and equipment costs of active guerrilla fighters Pz= the cost of maintaining territorial control
Equation 3 implies that the income obtained from coca production is spent on coca workers’ salaries, maintaining troops, maintaining territorial control and recruiting new members. Once again, in per capita terms:
tggt
tztgtnt ngwwtg
zPgwgwc +∂
∂+++−= )1( (4)
Where n, represents the population growth rate in the region. The preferences of the armed group over time can be represented by using the integer of instant profit:
∫∞ −=0
)( dtezmu tto
θ (5)
Which implies that immediate profits depend positively on the territorial control that the
group enjoys in the region, tz , where θ represents the armed groups’ inter-temporal discount rate. Furthermore:
0)(' ≥tzm , 0)('' ≤tzm and θ >0 Thus, the armed groups problem of maximisation is:
Max ∫∞ −=0
)( dtezmu tto
θ
s.t.
g
tztgtgtnttt
w
zPngwgwgwgzAf
tg
−−−−−−+
=∂
∂)1()1,(
11
γβ
21
Where the control variable is tz and the state variable is tg . This means that the armed group must find an optimum path to territorial control that allows it to maximise profitability, subject to inter-temporal restrictions. The optimum path to territorial control determines the optimum number of guerrilla troops and coca production during each period. Thus, the Hamiltonian is:
−−−−−−+
+= −
g
tztgtgtntt
ttt
w
zPngwgwgwgzAfzmeH
)1()1,(1
1
)(γ
βµθ
Given that t
tt e θλµ −= Therefore, the first order conditions for the Hamiltonian and the transversal conditions are, respectively:
(1) 0)1,(
11
)(' =
−−+
+= −
g
zttz
ttt
t w
PgzAfzme
zH
γβ
γλ
δδ θ
(2) •−
− −=
−−+−+
−= µ
γβ
λδδ θ
g
ggnttgt
tt w
nwwwgzAfe
gH t
)1,(1
11
0=
∞→ tttgLim µ
Having derived the first order conditions and with some algebra, we found the dynamic equations for control variable zt, and for state variable gt.
=•
tz
−−+
−+
−
++−−+
+ −
zttz
ttzz
tz
tzzg
ggnttgg
PgzAf
gzAf
zm
zmw
nwwwgzAfw
t
tt
t
tt
t
)1,(1
1
)1,(1
1
)(
)(
)1,(1
1
,,
1
γβ
γ
γβ
γ
γβ
θ (6)
g
tztgtgtntt
t w
zPngwgwgwgzAfg
−−−−−−+
=•
)1()1,(1
1γ
β (7)
22
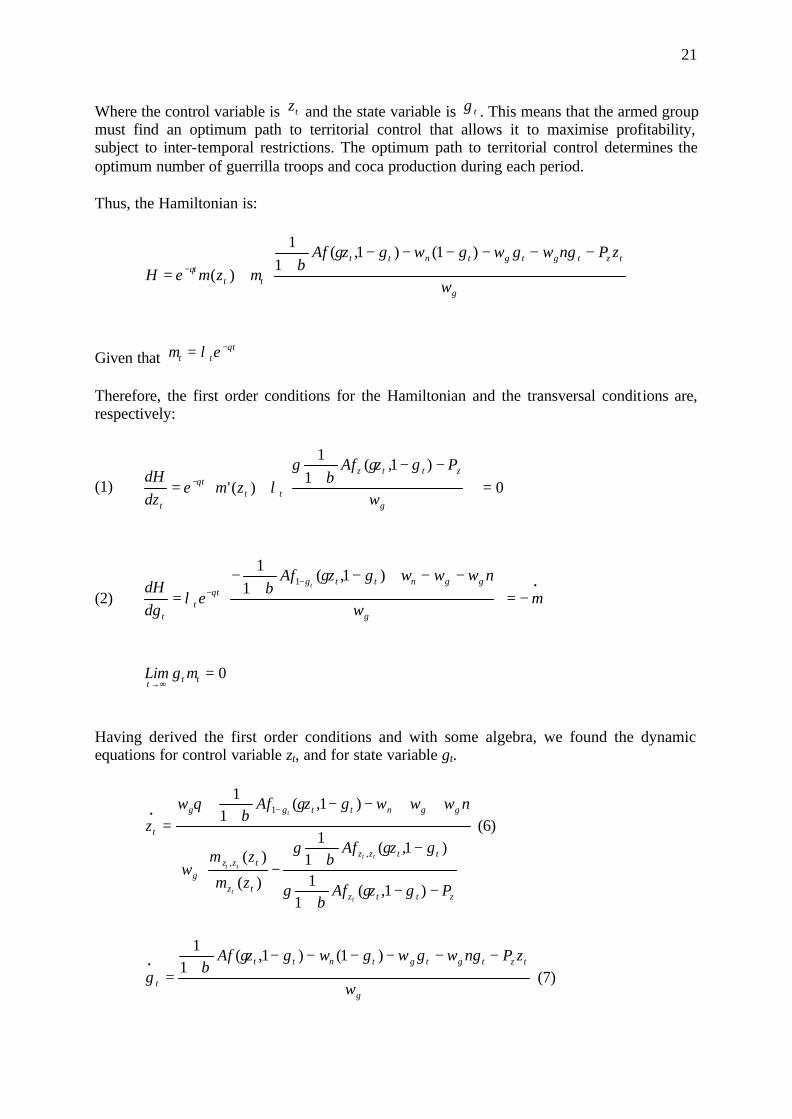
In a stationary state, •
tz = •
tg = 0. The phase diagram, in plane (zt, gt) allows us to determine the equilibrium dynamics (zt*,gt*), and establish whether it is stable 70.
The phase diagram and the curves •
tz = •
tg = 0 are presented in the graph below:
The different signs are due to the result of three plausible equilibriums, which depend on the
sign of the following derivatives 0<
t
t
gz
δδ
in •g , t
t
zg
δδ
•
and t
t
gz
δδ
•
, and also on whether the curve •
tz =0 cuts the curve •
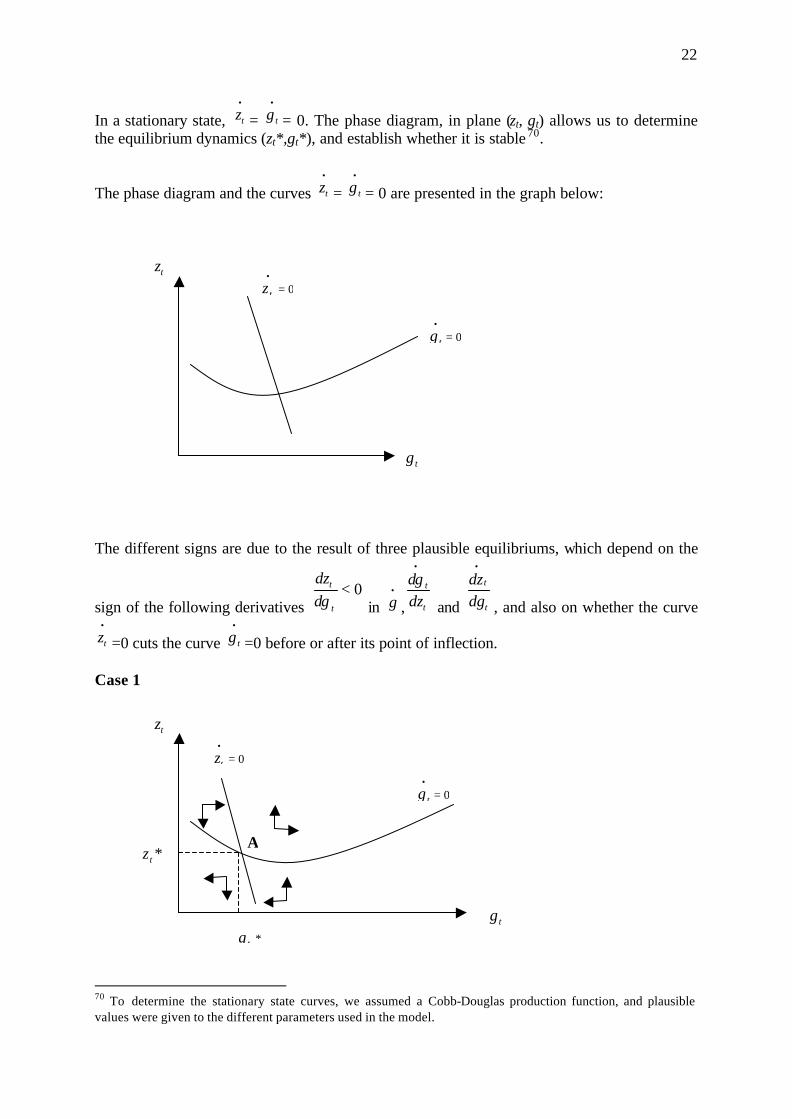
tg =0 before or after its point of inflection. Case 1
70 To determine the stationary state curves, we assumed a Cobb-Douglas production function, and plausible values were given to the different parameters used in the model.
•
tg = 0
tg
tz•
tz = 0
•
tg = 0
tg
tz
*tz
tg *
A
•
tz = 0
23
In case 1, equilibrium is established at point A under the assumption that 0<
t
t
gz
δδ
in •g , t
t
zg
δδ
•
>
0, and t
t
gz
δδ
•
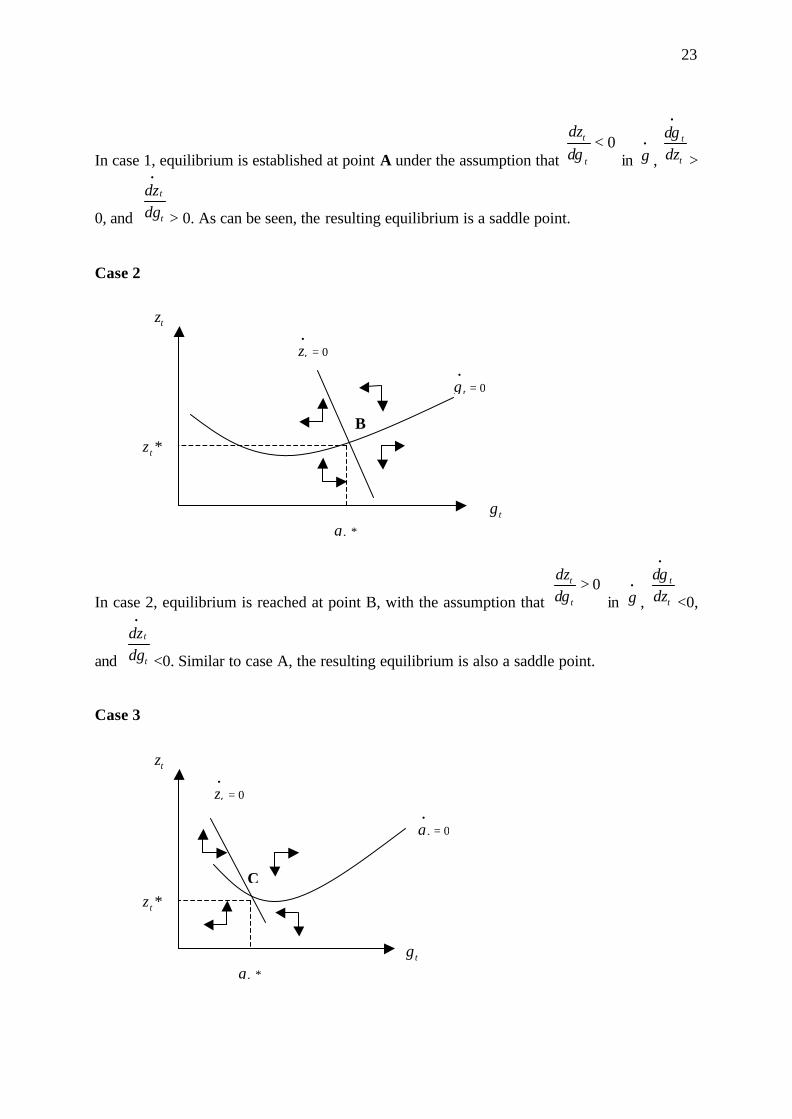
> 0. As can be seen, the resulting equilibrium is a saddle point. Case 2
In case 2, equilibrium is reached at point B, with the assumption that 0>
t
t
gz
δδ
in •g , t
t
zg
δδ
•
<0,
and t
t
gz
δδ
•
<0. Similar to case A, the resulting equilibrium is also a saddle point. Case 3
•
tg = 0
tg
tz
*tz
tg *
B
•
tz = 0
•
tg = 0
tg
tz
*tz
tg *
C
•
tz = 0
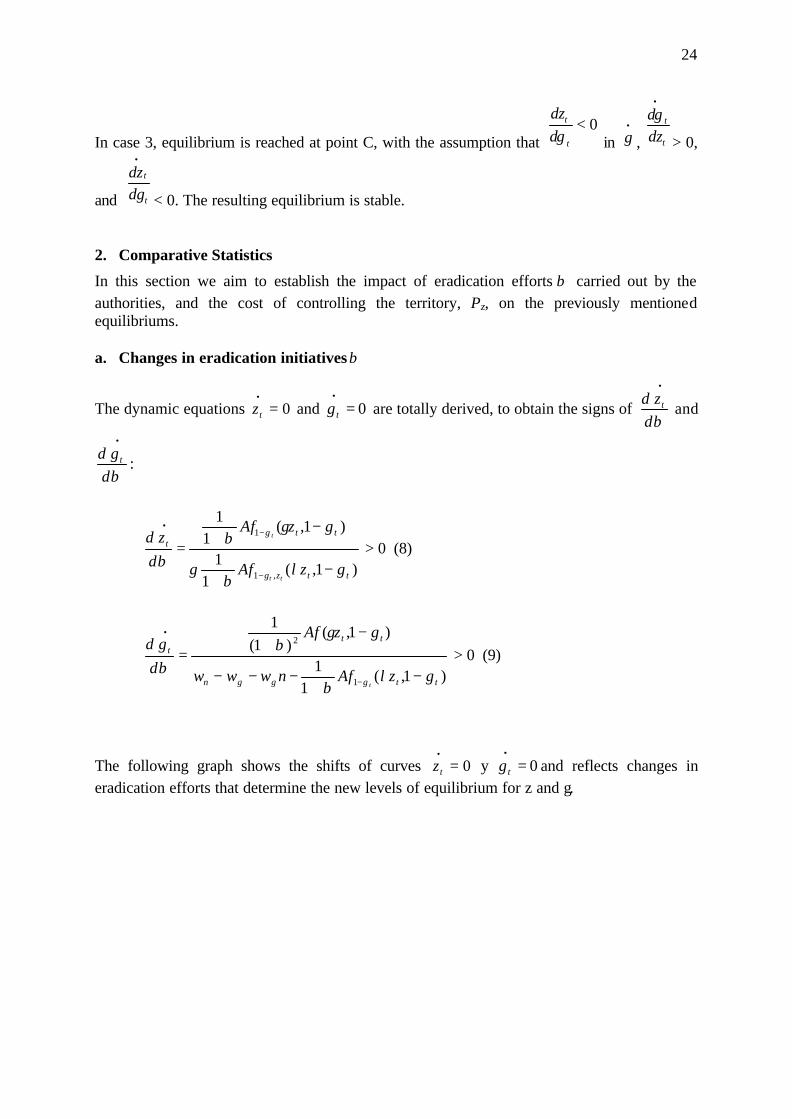
24
In case 3, equilibrium is reached at point C, with the assumption that 0<
t
t
gz
δδ
in •g , t
t
zg
δδ
•
> 0,
and t
t
gz
δδ
•
< 0. The resulting equilibrium is stable. 2. Comparative Statistics
In this section we aim to establish the impact of eradication efforts β carried out by the authorities, and the cost of controlling the territory, Pz, on the previously mentioned equilibriums. a. Changes in eradication initiativesβ
The dynamic equations 0=•
tz and 0=•
tg are totally derived, to obtain the signs of δβδ
•
tz and
δβδ
•
tg:
)1,(1
1
)1,(1
1
,1
1
ttzg
ttgt
gzAf
gzAfz
tt
t
−+
−+
=
−
−•
λβ
γ
γβ
δβδ
> 0 (8)
)1,(1
1
)1,()1(
1
1
2
ttgggn
ttt
gzAfnwww
gzAfg
t−
+−−−
−+
=
−
•
λβ
γβ
δβδ
> 0 (9)
The following graph shows the shifts of curves 0=•
tz y 0=•
tg and reflects changes in eradication efforts that determine the new levels of equilibrium for z and g.
25
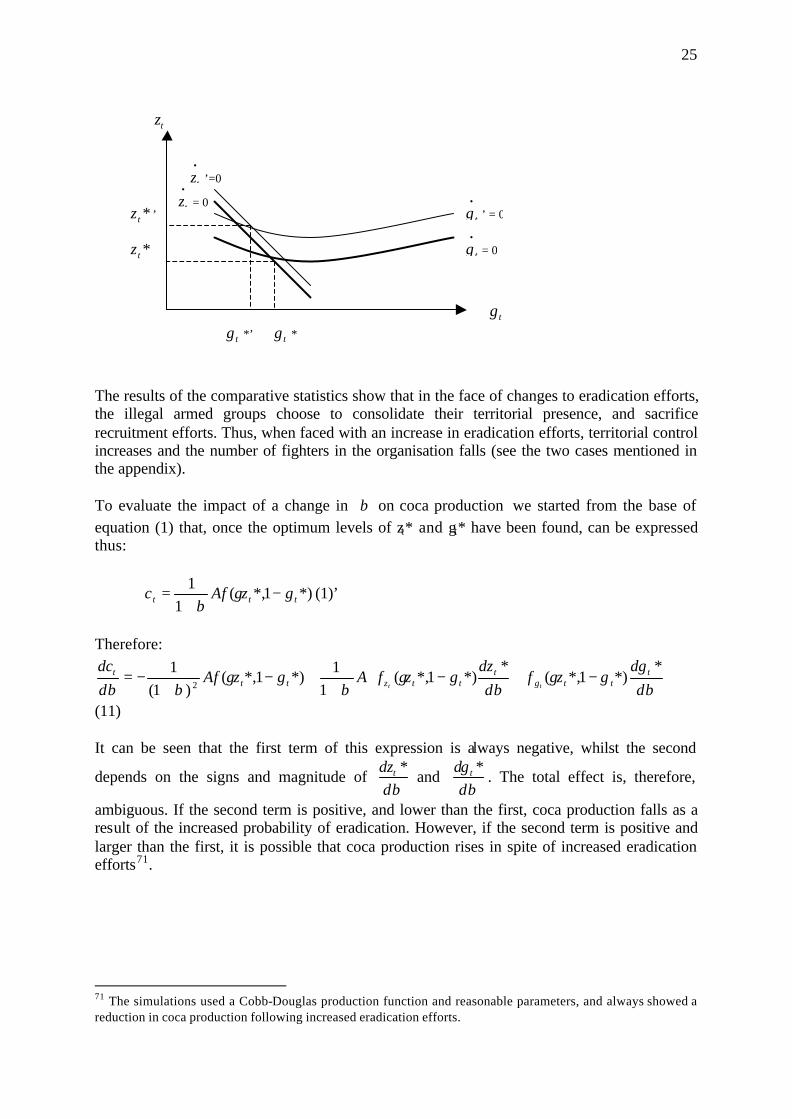
The results of the comparative statistics show that in the face of changes to eradication efforts, the illegal armed groups choose to consolidate their territorial presence, and sacrifice recruitment efforts. Thus, when faced with an increase in eradication efforts, territorial control increases and the number of fighters in the organisation falls (see the two cases mentioned in the appendix). To evaluate the impact of a change in β on coca production we started from the base of equation (1) that, once the optimum levels of zt* and gt* have been found, can be expressed thus:
*)1*,(1
1ttt gzAfc −
+= γ
β(1)’
Therefore:
−+−+
+−+
−=δβ
δγ
δβδ
γβ
γβδβ
δ **)1*,(
**)1*,(
11
*)1*,()1(
12
tttg
tttztt
t ggzf
zgzfAgzAf
ctt
(11) It can be seen that the first term of this expression is always negative, whilst the second
depends on the signs and magnitude of δβδ *tz
and δβ
δ *tg. The total effect is, therefore,
ambiguous. If the second term is positive, and lower than the first, coca production falls as a result of the increased probability of eradication. However, if the second term is positive and larger than the first, it is possible that coca production rises in spite of increased eradication efforts71.
71 The simulations used a Cobb-Douglas production function and reasonable parameters, and always showed a reduction in coca production following increased eradication efforts.
tg
tz
*tz
tg *’
•
tz = 0
•
tz ’=0
•
tg = 0
•
tg ’ = 0
tg *
*tz ’
26
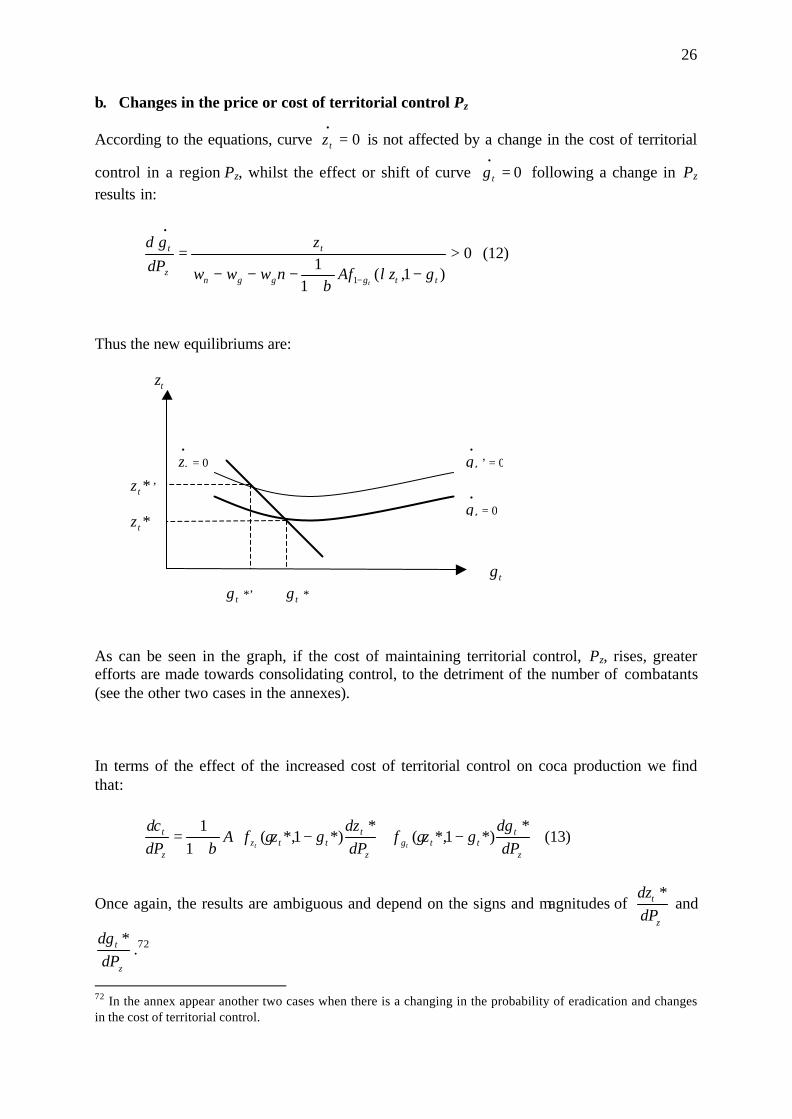
b. Changes in the price or cost of territorial control Pz
According to the equations, curve 0=•
tz is not affected by a change in the cost of territorial
control in a region Pz, whilst the effect or shift of curve 0=•
tg following a change in Pz results in:
0)1,(
11
1
>−
+−−−
=
−
•
ttgggn
t
z
t
gzAfnwww
zPg
tλ
βδδ
(12)
Thus the new equilibriums are:
As can be seen in the graph, if the cost of maintaining territorial control, Pz, rises, greater efforts are made towards consolidating control, to the detriment of the number of combatants (see the other two cases in the annexes). In terms of the effect of the increased cost of territorial control on coca production we find that:
−+−+
=z
tttg
z
tttz
z
t
Pg
gzfPz
gzfAPc
tt δδ
γδδ
γβδ
δ **)1*,(
**)1*,(
11
(13)
Once again, the results are ambiguous and depend on the signs and magnitudes of z
t
Pz
δδ *
and
z
t
Pgδδ *
.72
72 In the annex appear another two cases when there is a changing in the probability of eradication and changes in the cost of territorial control.
tg
tz
*tz
tg *’
•
tz = 0
•
tg = 0
•
tg ’ = 0
tg *
*tz ’
27
In summary, the theoretical model shows that there exist optimal levels of territorial control and number of active guerrilla fighters that determine the amount of coca produced. However, changes in exogenous variables such as activity of the army (related to the price of territorial control) or eradication efforts have ambiguous effects on coca production.
Coca Geography and Armed Conflict in Colombia
The Geography of the Armed Conflict and its Relationship with Coca
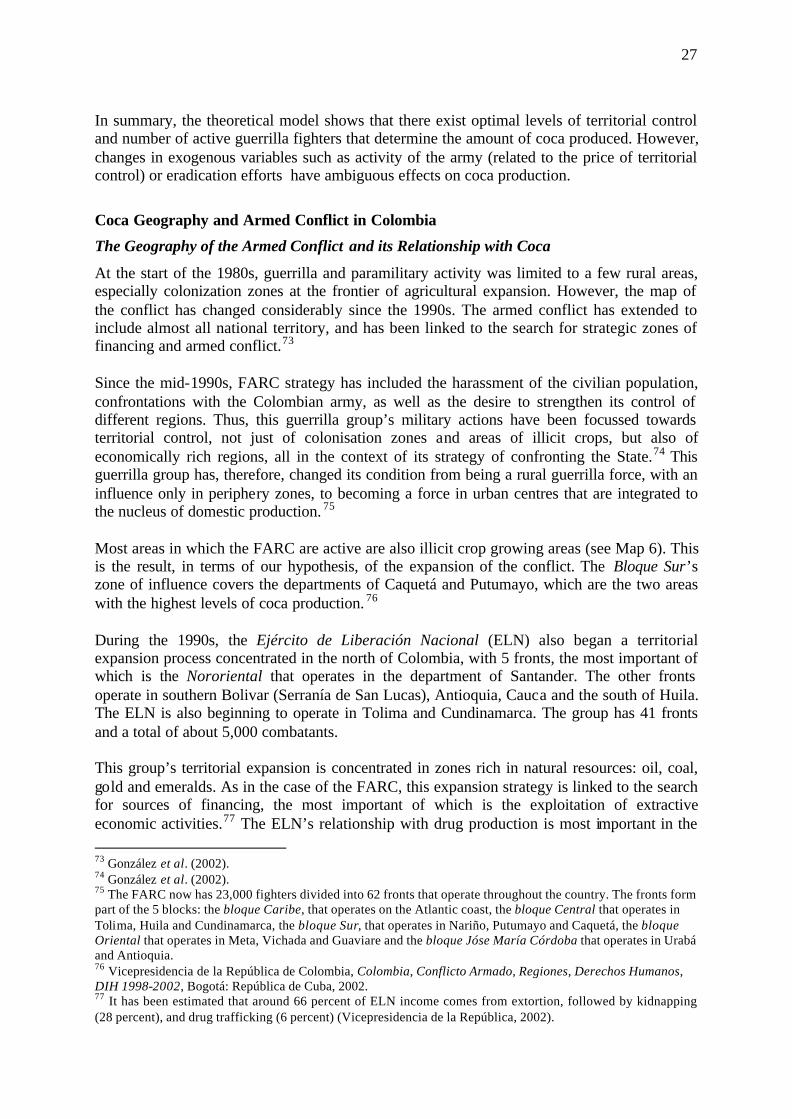
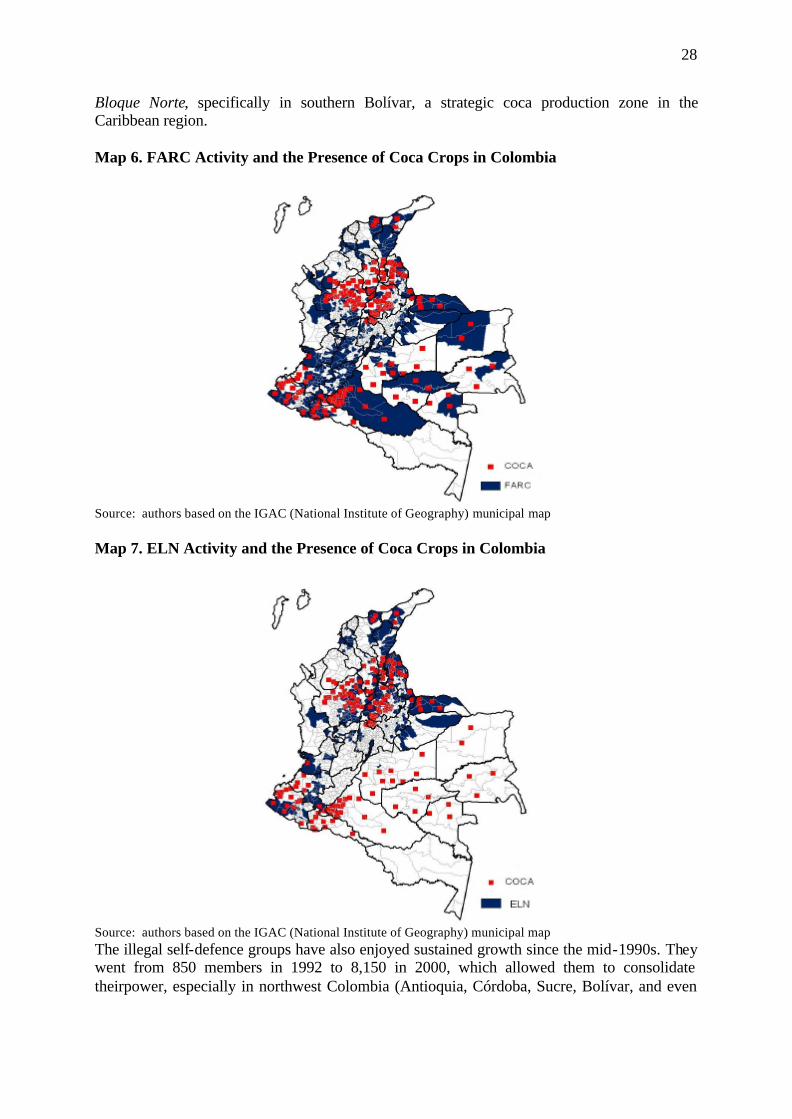
At the start of the 1980s, guerrilla and paramilitary activity was limited to a few rural areas, especially colonization zones at the frontier of agricultural expansion. However, the map of the conflict has changed considerably since the 1990s. The armed conflict has extended to include almost all national territory, and has been linked to the search for strategic zones of financing and armed conflict.73 Since the mid-1990s, FARC strategy has included the harassment of the civilian population, confrontations with the Colombian army, as well as the desire to strengthen its control of different regions. Thus, this guerrilla group’s military actions have been focussed towards territorial control, not just of colonisation zones and areas of illicit crops, but also of economically rich regions, all in the context of its strategy of confronting the State.74 This guerrilla group has, therefore, changed its condition from being a rural guerrilla force, with an influence only in periphery zones, to becoming a force in urban centres that are integrated to the nucleus of domestic production. 75 Most areas in which the FARC are active are also illicit crop growing areas (see Map 6). This is the result, in terms of our hypothesis, of the expansion of the conflict. The Bloque Sur’s zone of influence covers the departments of Caquetá and Putumayo, which are the two areas with the highest levels of coca production. 76 During the 1990s, the Ejército de Liberación Nacional (ELN) also began a territorial expansion process concentrated in the north of Colombia, with 5 fronts, the most important of which is the Nororiental that operates in the department of Santander. The other fronts operate in southern Bolivar (Serranía de San Lucas), Antioquia, Cauca and the south of Huila. The ELN is also beginning to operate in Tolima and Cundinamarca. The group has 41 fronts and a total of about 5,000 combatants. This group’s territorial expansion is concentrated in zones rich in natural resources: oil, coal, gold and emeralds. As in the case of the FARC, this expansion strategy is linked to the search for sources of financing, the most important of which is the exploitation of extractive economic activities.77 The ELN’s relationship with drug production is most important in the 73 González et al. (2002). 74 González et al. (2002). 75 The FARC now has 23,000 fighters divided into 62 fronts that operate throughout the country. The fronts form part of the 5 blocks: the bloque Caribe, that operates on the Atlantic coast, the bloque Central that operates in Tolima, Huila and Cundinamarca, the bloque Sur, that operates in Nariño, Putumayo and Caquetá, the bloque Oriental that operates in Meta, Vichada and Guaviare and the bloque Jóse María Córdoba that operates in Urabá and Antioquia. 76 Vicepresidencia de la República de Colombia, Colombia, Conflicto Armado, Regiones, Derechos Humanos, DIH 1998-2002, Bogotá: República de Cuba, 2002. 77 It has been estimated that around 66 percent of ELN income comes from extortion, followed by kidnapping (28 percent), and drug trafficking (6 percent) (Vicepresidencia de la República, 2002).
28
Bloque Norte, specifically in southern Bolívar, a strategic coca production zone in the Caribbean region. Map 6. FARC Activity and the Presence of Coca Crops in Colombia
Source: authors based on the IGAC (National Institute of Geography) municipal map Map 7. ELN Activity and the Presence of Coca Crops in Colombia
Source: authors based on the IGAC (National Institute of Geography) municipal map The illegal self-defence groups have also enjoyed sustained growth since the mid-1990s. They went from 850 members in 1992 to 8,150 in 2000, which allowed them to consolidate theirpower, especially in northwest Colombia (Antioquia, Córdoba, Sucre, Bolívar, and even
29
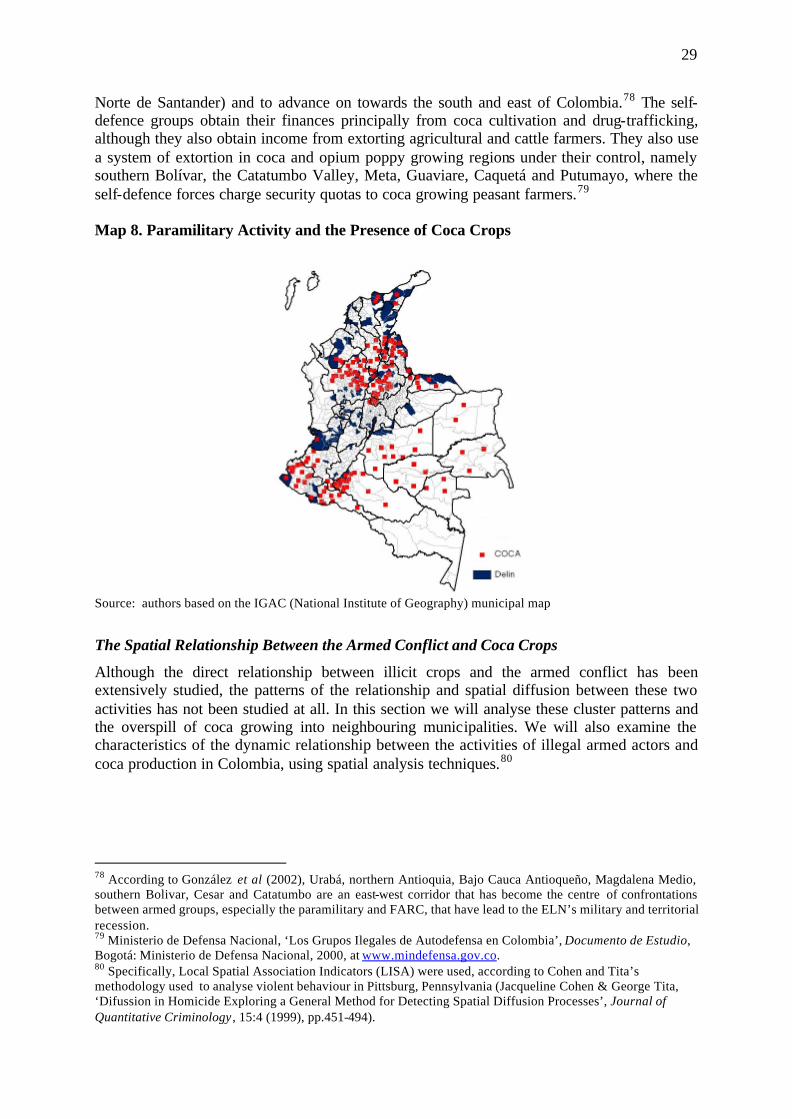
Norte de Santander) and to advance on towards the south and east of Colombia.78 The self-defence groups obtain their finances principally from coca cultivation and drug-trafficking, although they also obtain income from extorting agricultural and cattle farmers. They also use a system of extortion in coca and opium poppy growing regions under their control, namely southern Bolívar, the Catatumbo Valley, Meta, Guaviare, Caquetá and Putumayo, where the self-defence forces charge security quotas to coca growing peasant farmers.79 Map 8. Paramilitary Activity and the Presence of Coca Crops
Source: authors based on the IGAC (National Institute of Geography) municipal map
The Spatial Relationship Between the Armed Conflict and Coca Crops
Although the direct relationship between illicit crops and the armed conflict has been extensively studied, the patterns of the relationship and spatial diffusion between these two activities has not been studied at all. In this section we will analyse these cluster patterns and the overspill of coca growing into neighbouring municipalities. We will also examine the characteristics of the dynamic relationship between the activities of illegal armed actors and coca production in Colombia, using spatial analysis techniques.80
78 According to González et al (2002), Urabá, northern Antioquia, Bajo Cauca Antioqueño, Magdalena Medio, southern Bolivar, Cesar and Catatumbo are an east-west corridor that has become the centre of confrontations between armed groups, especially the paramilitary and FARC, that have lead to the ELN’s military and territorial recession. 79 Ministerio de Defensa Nacional, ‘Los Grupos Ilegales de Autodefensa en Colombia’, Documento de Estudio, Bogotá: Ministerio de Defensa Nacional, 2000, at www.mindefensa.gov.co. 80 Specifically, Local Spatial Association Indicators (LISA) were used, according to Cohen and Tita’s methodology used to analyse violent behaviour in Pittsburg, Pennsylvania (Jacqueline Cohen & George Tita, ‘Difussion in Homicide Exploring a General Method for Detecting Spatial Diffusion Processes’, Journal of Quantitative Criminology , 15:4 (1999), pp.451-494).
30
1. Spatial Indicators Of The Armed Conflict And Coca Crops
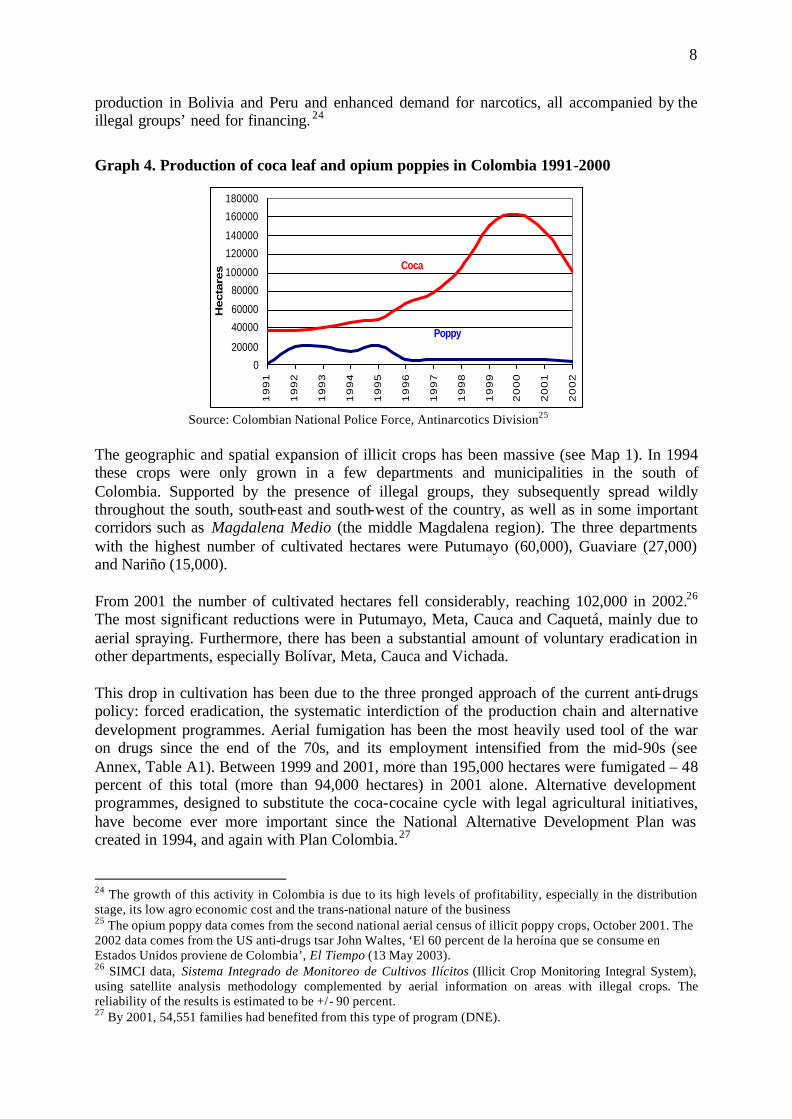
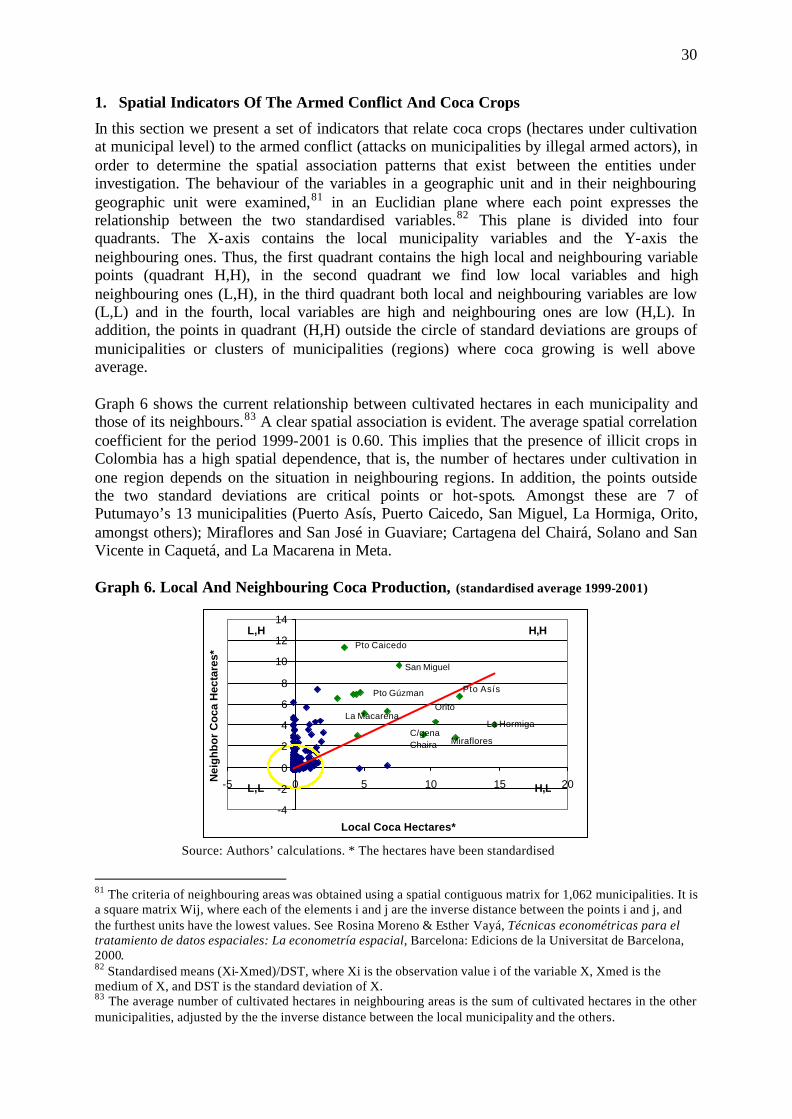
In this section we present a set of indicators that relate coca crops (hectares under cultivation at municipal level) to the armed conflict (attacks on municipalities by illegal armed actors), in order to determine the spatial association patterns that exist between the entities under investigation. The behaviour of the variables in a geographic unit and in their neighbouring geographic unit were examined,81 in an Euclidian plane where each point expresses the relationship between the two standardised variables.82 This plane is divided into four quadrants. The X-axis contains the local municipality variables and the Y-axis the neighbouring ones. Thus, the first quadrant contains the high local and neighbouring variable points (quadrant H,H), in the second quadrant we find low local variables and high neighbouring ones (L,H), in the third quadrant both local and neighbouring variables are low (L,L) and in the fourth, local variables are high and neighbouring ones are low (H,L). In addition, the points in quadrant (H,H) outside the circle of standard deviations are groups of municipalities or clusters of municipalities (regions) where coca growing is well above average. Graph 6 shows the current relationship between cultivated hectares in each municipality and those of its neighbours.83 A clear spatial association is evident. The average spatial correlation coefficient for the period 1999-2001 is 0.60. This implies that the presence of illicit crops in Colombia has a high spatial dependence, that is, the number of hectares under cultivation in one region depends on the situation in neighbouring regions. In addition, the points outside the two standard deviations are critical points or hot-spots. Amongst these are 7 of Putumayo’s 13 municipalities (Puerto Asís, Puerto Caicedo, San Miguel, La Hormiga, Orito, amongst others); Miraflores and San José in Guaviare; Cartagena del Chairá, Solano and San Vicente in Caquetá, and La Macarena in Meta.
Graph 6. Local And Neighbouring Coca Production, (standardised average 1999-2001)
-4
-2
0
2
4
6
8
10
12
14
-5 0 5 10 15 20
Local Coca Hectares*
Nei
gh
bo
r C
oca
Hec
tare
s*
H,HL,H
L,L H,L
La Hormiga
Pto Asís
Miraflores
Orito
San Miguel
Pto Caicedo
Pto Gúzman
La Macarena
C/gena Chaira
Source: Authors’ calculations. * The hectares have been standardised
81 The criteria of neighbouring areas was obtained using a spatial contiguous matrix for 1,062 municipalities. It is a square matrix Wij, where each of the elements i and j are the inverse distance between the points i and j, and the furthest units have the lowest values. See Rosina Moreno & Esther Vayá, Técnicas econométricas para el tratamiento de datos espaciales: La econometría espacial, Barcelona: Edicions de la Universitat de Barcelona, 2000. 82 Standardised means (Xi-Xmed)/DST, where Xi is the observation value i of the variable X, Xmed is the medium of X, and DST is the standard deviation of X. 83 The average number of cultivated hectares in neighbouring areas is the sum of cultivated hectares in the other municipalities, adjusted by the the inverse distance between the local municipality and the others.
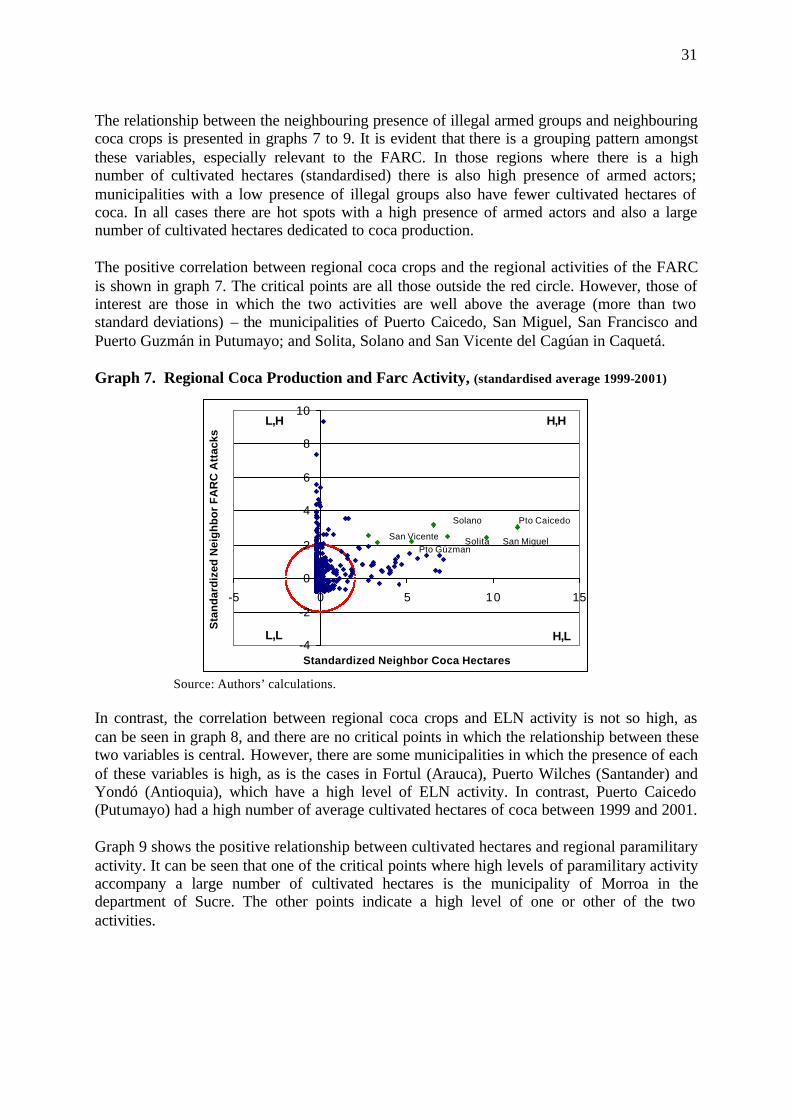
31
The relationship between the neighbouring presence of illegal armed groups and neighbouring coca crops is presented in graphs 7 to 9. It is evident that there is a grouping pattern amongst these variables, especially relevant to the FARC. In those regions where there is a high number of cultivated hectares (standardised) there is also high presence of armed actors; municipalities with a low presence of illegal groups also have fewer cultivated hectares of coca. In all cases there are hot spots with a high presence of armed actors and also a large number of cultivated hectares dedicated to coca production. The positive correlation between regional coca crops and the regional activities of the FARC is shown in graph 7. The critical points are all those outside the red circle. However, those of interest are those in which the two activities are well above the average (more than two standard deviations) – the municipalities of Puerto Caicedo, San Miguel, San Francisco and Puerto Guzmán in Putumayo; and Solita, Solano and San Vicente del Cagúan in Caquetá. Graph 7. Regional Coca Production and Farc Activity, (standardised average 1999-2001)
-4
-2
0
2
4
6
8
10
-5 0 5 10 15
Standardized Neighbor Coca Hectares
Sta
nd
ard
ized
Nei
gh
bo
r F
AR
C A
ttac
ks
H,HL,H
L,L H,L
Pto Caicedo
San MiguelSolita
Solano
Pto GúzmanSan Vicente
Source: Authors’ calculations. In contrast, the correlation between regional coca crops and ELN activity is not so high, as can be seen in graph 8, and there are no critical points in which the relationship between these two variables is central. However, there are some municipalities in which the presence of each of these variables is high, as is the cases in Fortul (Arauca), Puerto Wilches (Santander) and Yondó (Antioquia), which have a high level of ELN activity. In contrast, Puerto Caicedo (Putumayo) had a high number of average cultivated hectares of coca between 1999 and 2001. Graph 9 shows the positive relationship between cultivated hectares and regional paramilitary activity. It can be seen that one of the critical points where high levels of paramilitary activity accompany a large number of cultivated hectares is the municipality of Morroa in the department of Sucre. The other points indicate a high level of one or other of the two activities.
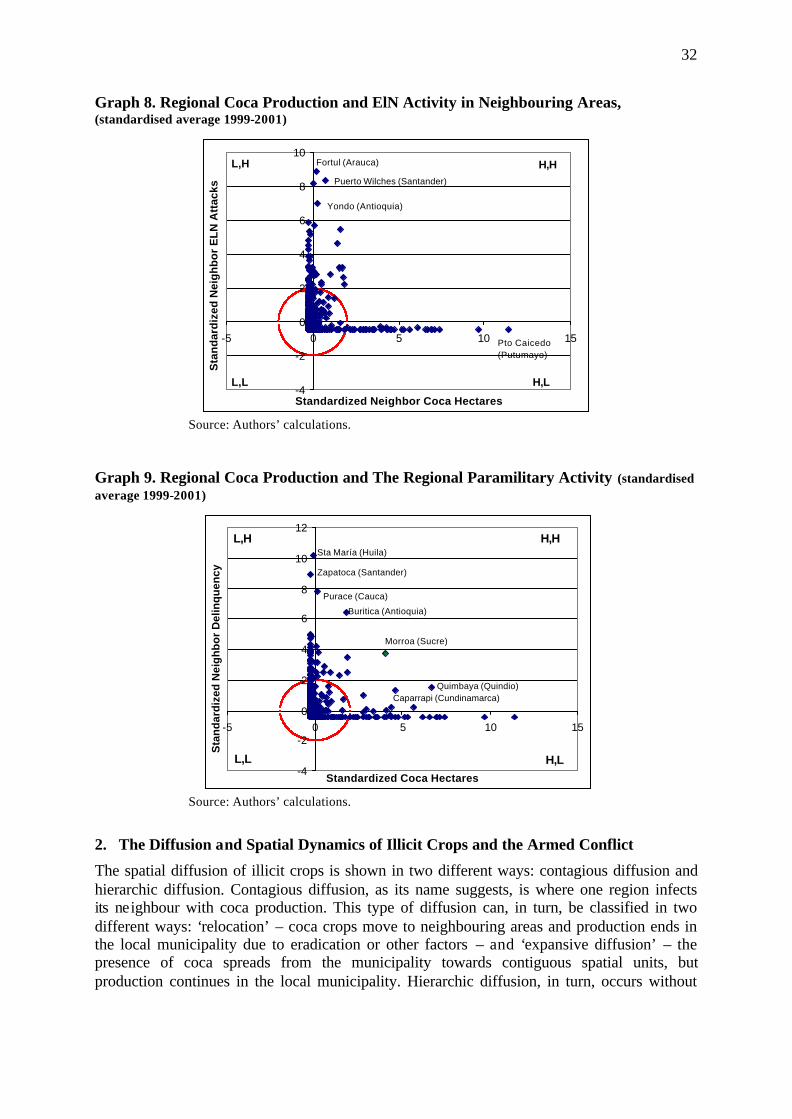
32
Graph 8. Regional Coca Production and ElN Activity in Neighbouring Areas, (standardised average 1999-2001)
-4
-2
0
2
4
6
8
10
-5 0 5 10 15
Standardized Neighbor Coca Hectares
Sta
nd
ard
ized
Nei
gh
bo
r E
LN
Att
acks
H,HL,H
L,L H,L
Fortul (Arauca)
Puerto Wilches (Santander)
Yondo (Antioquia)
Pto Caicedo (Putumayo)
Source: Authors’ calculations. Graph 9. Regional Coca Production and The Regional Paramilitary Activity (standardised average 1999-2001)
-4
-2
0
2
4
6
8
10
12
-5 0 5 10 15
Standardized Coca Hectares
Sta
nd
ard
ized
Nei
gh
bo
r D
elin
qu
ency
H,HL,H
L,L H,L
Morroa (Sucre)
Quimbaya (Quindio)Caparrapi (Cundinamarca)
Buritica (Antioquia)
Purace (Cauca)
Zapatoca (Santander)
Sta María (Huila)
Source: Authors’ calculations.
2. The Diffusion and Spatial Dynamics of Illicit Crops and the Armed Conflict
The spatial diffusion of illicit crops is shown in two different ways: contagious diffusion and hierarchic diffusion. Contagious diffusion, as its name suggests, is where one region infects its neighbour with coca production. This type of diffusion can, in turn, be classified in two different ways: ‘relocation’ – coca crops move to neighbouring areas and production ends in the local municipality due to eradication or other factors – and ‘expansive diffusion’ – the presence of coca spreads from the municipality towards contiguous spatial units, but production continues in the local municipality. Hierarchic diffusion, in turn, occurs without
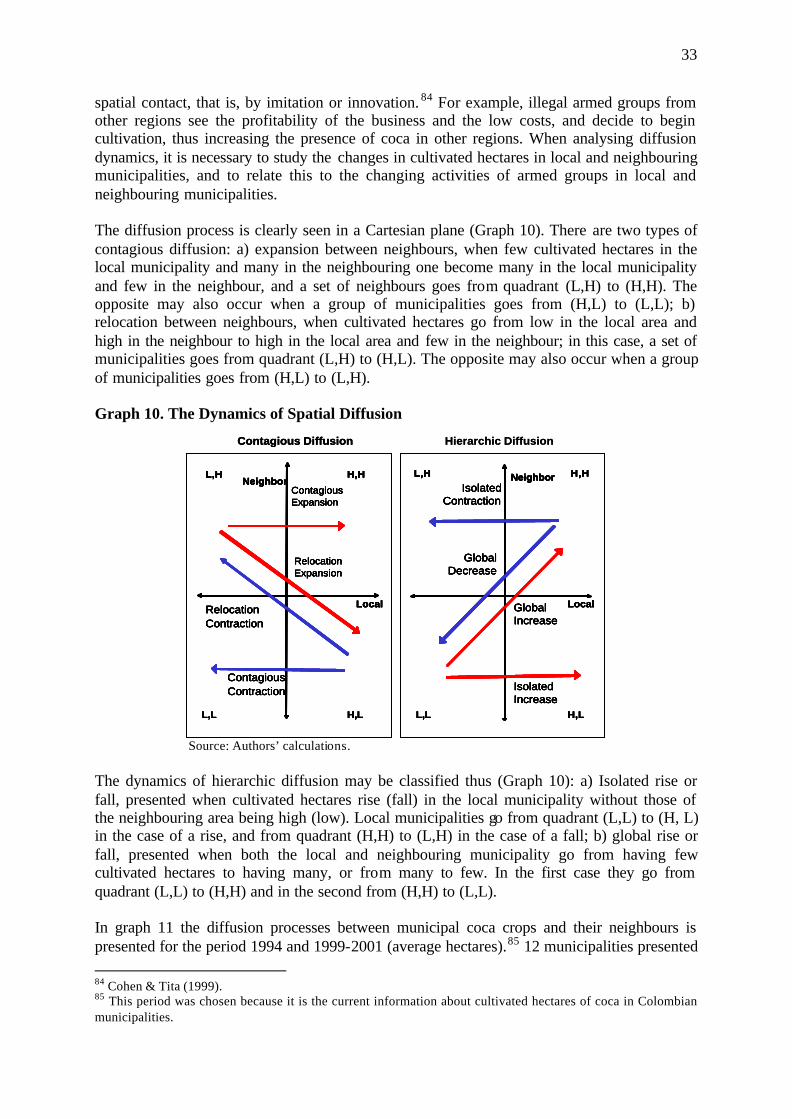
33
spatial contact, that is, by imitation or innovation. 84 For example, illegal armed groups from other regions see the profitability of the business and the low costs, and decide to begin cultivation, thus increasing the presence of coca in other regions. When analysing diffusion dynamics, it is necessary to study the changes in cultivated hectares in local and neighbouring municipalities, and to relate this to the changing activities of armed groups in local and neighbouring municipalities. The diffusion process is clearly seen in a Cartesian plane (Graph 10). There are two types of contagious diffusion: a) expansion between neighbours, when few cultivated hectares in the local municipality and many in the neighbouring one become many in the local municipality and few in the neighbour, and a set of neighbours goes from quadrant (L,H) to (H,H). The opposite may also occur when a group of municipalities goes from (H,L) to (L,L); b) relocation between neighbours, when cultivated hectares go from low in the local area and high in the neighbour to high in the local area and few in the neighbour; in this case, a set of municipalities goes from quadrant (L,H) to (H,L). The opposite may also occur when a group of municipalities goes from (H,L) to (L,H). Graph 10. The Dynamics of Spatial Diffusion
Hierarchic DiffusionContagious Diffusion
L,L
Contagious Expansion
Contagious Contraction
Relocation Contraction
Relocation Expansion
L,H H,H
H,L
Neighbor
Local
Isolated Contraction
Global Increase
Global Decrease
Isolated Increase
L,H H,H
L,L H,L
Neighbor
Local
Hierarchic DiffusionContagious Diffusion
L,L
Contagious Expansion
Contagious Contraction
Relocation Contraction
Relocation Expansion
L,H H,H
H,L
Neighbor
Local
Isolated Contraction
Global Increase
Global Decrease
Isolated Increase
L,H H,H
L,L H,L
Neighbor
Local
Contagious Diffusion
L,L
Contagious Expansion
Contagious Contraction
Relocation Contraction
Relocation Expansion
L,H H,H
H,L
Neighbor
Local
Isolated Contraction
Global Increase
Global Decrease
Isolated Increase
L,H H,H
L,L H,L
Neighbor
Local
L,L
Contagious Expansion
Contagious Contraction
Relocation Contraction
Relocation Expansion
L,H H,H
H,L
Neighbor
Local
Isolated Contraction
Global Increase
Global Decrease
Isolated Increase
L,H H,H
L,L H,L
Neighbor
Local
Contagious Expansion
Contagious Contraction
Relocation Contraction
Relocation Expansion
L,H H,H
H,L
Neighbor
Local
Isolated Contraction
Global Increase
Global Decrease
Isolated Increase
L,H H,H
L,L H,L
Neighbor
Local
Source: Authors’ calculations. The dynamics of hierarchic diffusion may be classified thus (Graph 10): a) Isolated rise or fall, presented when cultivated hectares rise (fall) in the local municipality without those of the neighbouring area being high (low). Local municipalities go from quadrant (L,L) to (H, L) in the case of a rise, and from quadrant (H,H) to (L,H) in the case of a fall; b) global rise or fall, presented when both the local and neighbouring municipality go from having few cultivated hectares to having many, or from many to few. In the first case they go from quadrant (L,L) to (H,H) and in the second from (H,H) to (L,L). In graph 11 the diffusion processes between municipal coca crops and their neighbours is presented for the period 1994 and 1999-2001 (average hectares).85 12 municipalities presented 84 Cohen & Tita (1999). 85 This period was chosen because it is the current information about cultivated hectares of coca in Colombian municipalities.
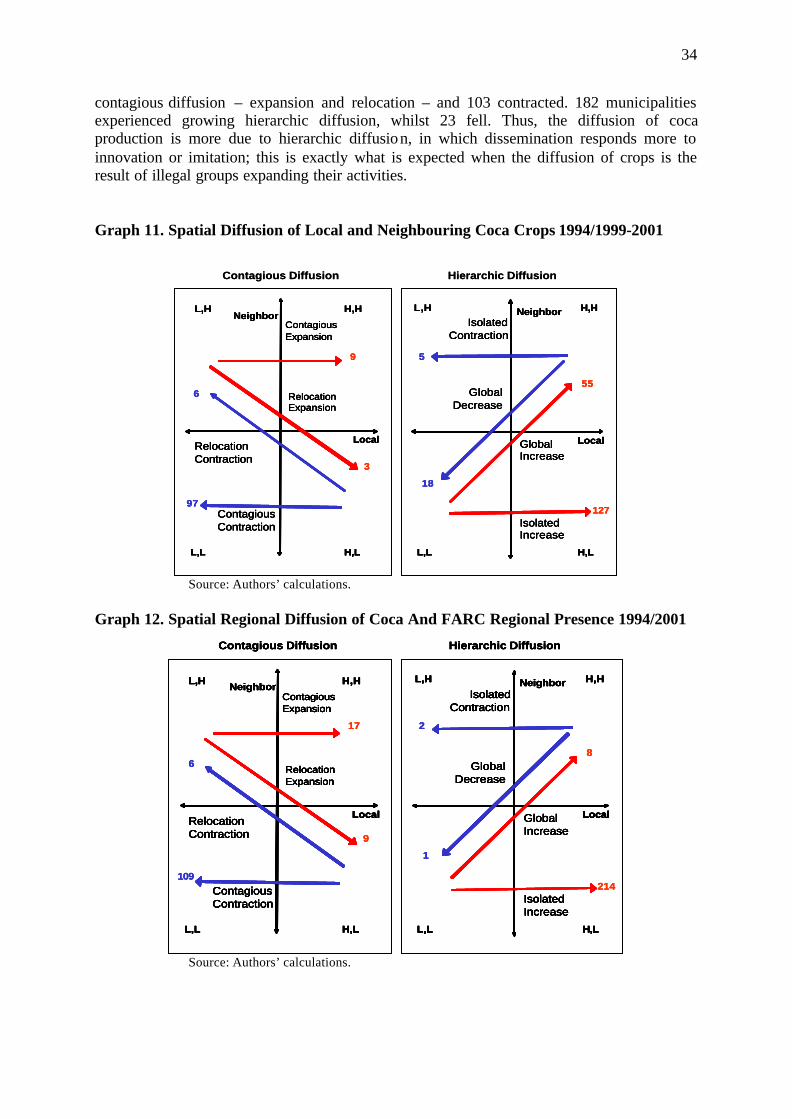
34
contagious diffusion – expansion and relocation – and 103 contracted. 182 municipalities experienced growing hierarchic diffusion, whilst 23 fell. Thus, the diffusion of coca production is more due to hierarchic diffusion, in which dissemination responds more to innovation or imitation; this is exactly what is expected when the diffusion of crops is the result of illegal groups expanding their activities. Graph 11. Spatial Diffusion of Local and Neighbouring Coca Crops 1994/1999-2001
Contagious Diffusion Hierarchic Diffusion
L,L
Contagious Expansion
Contagious Contraction
Relocation Contraction
Relocation Expansion
L,H H,H
H,L
Neighbor
Local
Isolated Contraction
Global Increase
Global Decrease
Isolated Increase
L,H H,H
L,L H,L
Neighbor
Local
97
6
9
3
127
55
18
5
Contagious Diffusion Hierarchic Diffusion
L,L
Contagious Expansion
Contagious Contraction
Relocation Contraction
Relocation Expansion
L,H H,H
H,L
Neighbor
Local
Isolated Contraction
Global Increase
Global Decrease
Isolated Increase
L,H H,H
L,L H,L
Neighbor
Local
L,L
Contagious Expansion
Contagious Contraction
Relocation Contraction
Relocation Expansion
L,H H,H
H,L
Neighbor
Local
Isolated Contraction
Global Increase
Global Decrease
Isolated Increase
L,H H,H
L,L H,L
Neighbor
Local
Contagious Expansion
Contagious Contraction
Relocation Contraction
Relocation Expansion
L,H H,H
H,L
Neighbor
Local
Isolated Contraction
Global Increase
Global Decrease
Isolated Increase
L,H H,H
L,L H,L
Neighbor
Local
97
6
9
3
127
55
18
5
97
6
9
3
127
55
18
5
Source: Authors’ calculations. Graph 12. Spatial Regional Diffusion of Coca And FARC Regional Presence 1994/2001
Contagious Diffusion Hierarchic Diffusion
L,L
Contagious Expansion
Contagious Contraction
Relocation Contraction
Relocation Expansion
L,H H,H
H,L
Neighbor
Local
Isolated Contraction
Global Increase
Global Decrease
Isolated Increase
L,H H,H
L,L H,L
Neighbor
Local
214109
6
17
9
8
1
2
Contagious Diffusion Hierarchic Diffusion
L,L
Contagious Expansion
Contagious Contraction
Relocation Contraction
Relocation Expansion
L,H H,H
H,L
Neighbor
Local
Isolated Contraction
Global Increase
Global Decrease
Isolated Increase
L,H H,H
L,L H,L
Neighbor
Local
214
Contagious Diffusion Hierarchic Diffusion
L,L
Contagious Expansion
Contagious Contraction
Relocation Contraction
Relocation Expansion
L,H H,H
H,L
Neighbor
Local
Isolated Contraction
Global Increase
Global Decrease
Isolated Increase
L,H H,H
L,L H,L
Neighbor
Local
Contagious Diffusion Hierarchic Diffusion
L,L
Contagious Expansion
Contagious Contraction
Relocation Contraction
Relocation Expansion
L,H H,H
H,L
Neighbor
Local
Isolated Contraction
Global Increase
Global Decrease
Isolated Increase
L,H H,H
L,L H,L
Neighbor
Local
L,L
Contagious Expansion
Contagious Contraction
Relocation Contraction
Relocation Expansion
L,H H,H
H,L
Neighbor
Local
Isolated Contraction
Global Increase
Global Decrease
Isolated Increase
L,H H,H
L,L H,L
Neighbor
Local
Contagious Expansion
Contagious Contraction
Relocation Contraction
Relocation Expansion
L,H H,H
H,L
Neighbor
Local
Isolated Contraction
Global Increase
Global Decrease
Isolated Increase
L,H H,H
L,L H,L
Neighbor
Local
214109
6
17
9
8
1
2
109
6
17
9
8
1
2
Source: Authors’ calculations.
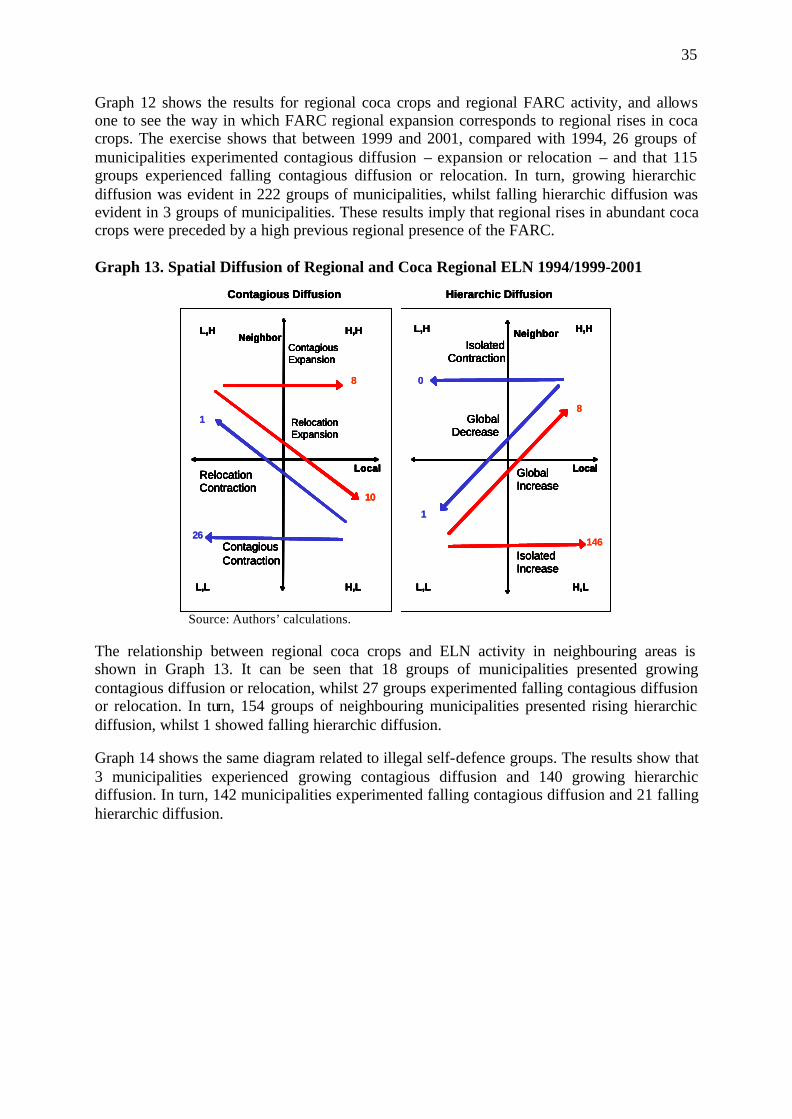
35
Graph 12 shows the results for regional coca crops and regional FARC activity, and allows one to see the way in which FARC regional expansion corresponds to regional rises in coca crops. The exercise shows that between 1999 and 2001, compared with 1994, 26 groups of municipalities experimented contagious diffusion – expansion or relocation – and that 115 groups experienced falling contagious diffusion or relocation. In turn, growing hierarchic diffusion was evident in 222 groups of municipalities, whilst falling hierarchic diffusion was evident in 3 groups of municipalities. These results imply that regional rises in abundant coca crops were preceded by a high previous regional presence of the FARC. Graph 13. Spatial Diffusion of Regional and Coca Regional ELN 1994/1999-2001
26
1
8
Contagious Diffusion Hierarchic Diffusion
L,L
Contagious Expansion
Contagious Contraction
Relocation Contraction
Relocation Expansion
L,H H,H
H,L
Neighbor
Local
Isolated Contraction
Global Increase
Global Decrease
Isolated Increase
L,H H,H
L,L H,L
Neighbor
Local
10
146
8
1
0
26
1
8
Contagious Diffusion Hierarchic Diffusion
L,L
Contagious Expansion
Contagious Contraction
Relocation Contraction
Relocation Expansion
L,H H,H
H,L
Neighbor
Local
Isolated Contraction
Global Increase
Global Decrease
Isolated Increase
L,H H,H
L,L H,L
Neighbor
Local
10
Contagious Diffusion Hierarchic Diffusion
L,L
Contagious Expansion
Contagious Contraction
Relocation Contraction
Relocation Expansion
L,H H,H
H,L
Neighbor
Local
Isolated Contraction
Global Increase
Global Decrease
Isolated Increase
L,H H,H
L,L H,L
Neighbor
Local
Contagious Diffusion Hierarchic Diffusion
L,L
Contagious Expansion
Contagious Contraction
Relocation Contraction
Relocation Expansion
L,H H,H
H,L
Neighbor
Local
Isolated Contraction
Global Increase
Global Decrease
Isolated Increase
L,H H,H
L,L H,L
Neighbor
Local
L,L
Contagious Expansion
Contagious Contraction
Relocation Contraction
Relocation Expansion
L,H H,H
H,L
Neighbor
Local
Isolated Contraction
Global Increase
Global Decrease
Isolated Increase
L,H H,H
L,L H,L
Neighbor
Local
Contagious Expansion
Contagious Contraction
Relocation Contraction
Relocation Expansion
L,H H,H
H,L
Neighbor
Local
Isolated Contraction
Global Increase
Global Decrease
Isolated Increase
L,H H,H
L,L H,L
Neighbor
Local
10
146
8
1
0
Source: Authors’ calculations. The relationship between regional coca crops and ELN activity in neighbouring areas is shown in Graph 13. It can be seen that 18 groups of municipalities presented growing contagious diffusion or relocation, whilst 27 groups experimented falling contagious diffusion or relocation. In turn, 154 groups of neighbouring municipalities presented rising hierarchic diffusion, whilst 1 showed falling hierarchic diffusion. Graph 14 shows the same diagram related to illegal self-defence groups. The results show that 3 municipalities experienced growing contagious diffusion and 140 growing hierarchic diffusion. In turn, 142 municipalities experimented falling contagious diffusion and 21 falling hierarchic diffusion.
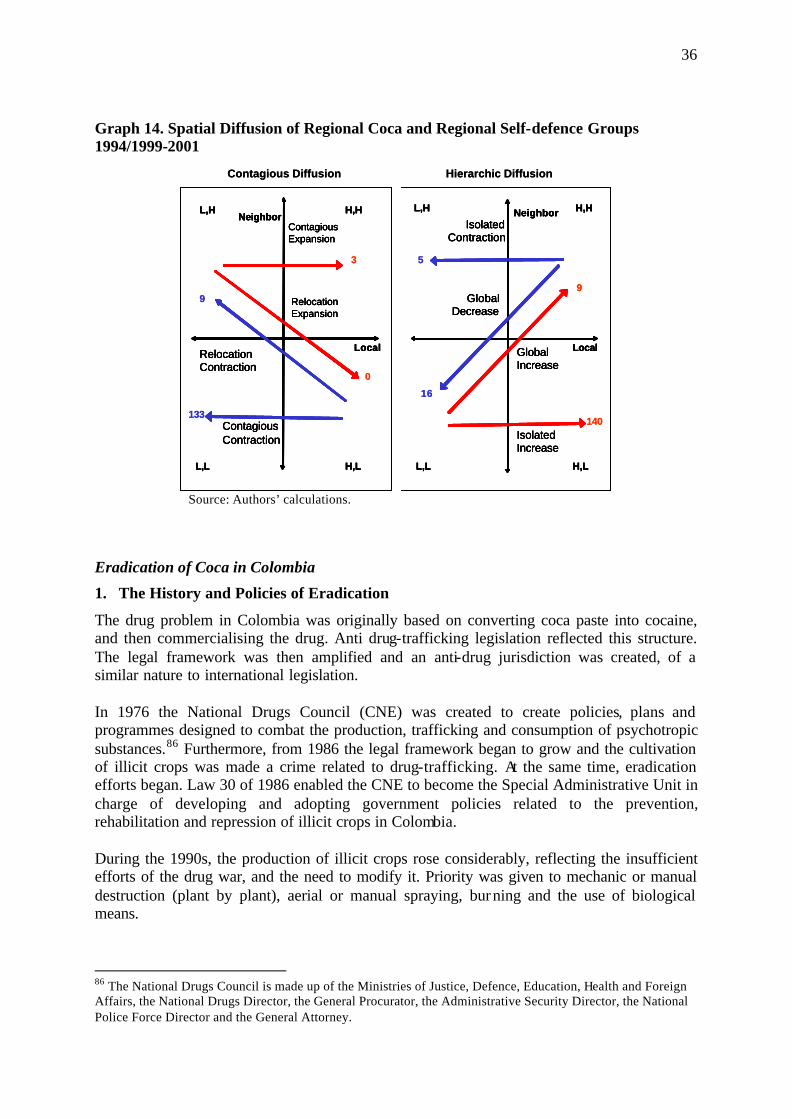
36
Graph 14. Spatial Diffusion of Regional Coca and Regional Self-defence Groups 1994/1999-2001
Contagious Diffusion Hierarchic Diffusion
L,L
Contagious Expansion
Contagious Contraction
Relocation Contraction
Relocation Expansion
L,H H,H
H,L
Neighbor
Local
Isolated Contraction
Global Increase
Global Decrease
Isolated Increase
L,H H,H
L,L H,L
Neighbor
Local
133
9
3
0
140
9
16
5
Contagious Diffusion Hierarchic Diffusion
L,L
Contagious Expansion
Contagious Contraction
Relocation Contraction
Relocation Expansion
L,H H,H
H,L
Neighbor
Local
Isolated Contraction
Global Increase
Global Decrease
Isolated Increase
L,H H,H
L,L H,L
Neighbor
Local
L,L
Contagious Expansion
Contagious Contraction
Relocation Contraction
Relocation Expansion
L,H H,H
H,L
Neighbor
Local
Isolated Contraction
Global Increase
Global Decrease
Isolated Increase
L,H H,H
L,L H,L
Neighbor
Local
Contagious Expansion
Contagious Contraction
Relocation Contraction
Relocation Expansion
L,H H,H
H,L
Neighbor
Local
Isolated Contraction
Global Increase
Global Decrease
Isolated Increase
L,H H,H
L,L H,L
Neighbor
Local
133
9
3
0
140
9
16
5
Source: Authors’ calculations. Eradication of Coca in Colombia
1. The History and Policies of Eradication
The drug problem in Colombia was originally based on converting coca paste into cocaine, and then commercialising the drug. Anti drug-trafficking legislation reflected this structure. The legal framework was then amplified and an anti-drug jurisdiction was created, of a similar nature to international legislation. In 1976 the National Drugs Council (CNE) was created to create policies, plans and programmes designed to combat the production, trafficking and consumption of psychotropic substances.86 Furthermore, from 1986 the legal framework began to grow and the cultivation of illicit crops was made a crime related to drug-trafficking. At the same time, eradication efforts began. Law 30 of 1986 enabled the CNE to become the Special Administrative Unit in charge of developing and adopting government policies related to the prevention, rehabilitation and repression of illicit crops in Colombia. During the 1990s, the production of illicit crops rose considerably, reflecting the insufficient efforts of the drug war, and the need to modify it. Priority was given to mechanic or manual destruction (plant by plant), aerial or manual spraying, burning and the use of biological means.
86 The National Drugs Council is made up of the Ministries of Justice, Defence, Education, Health and Foreign Affairs, the National Drugs Director, the General Procurator, the Administrative Security Director, the National Police Force Director and the General Attorney.
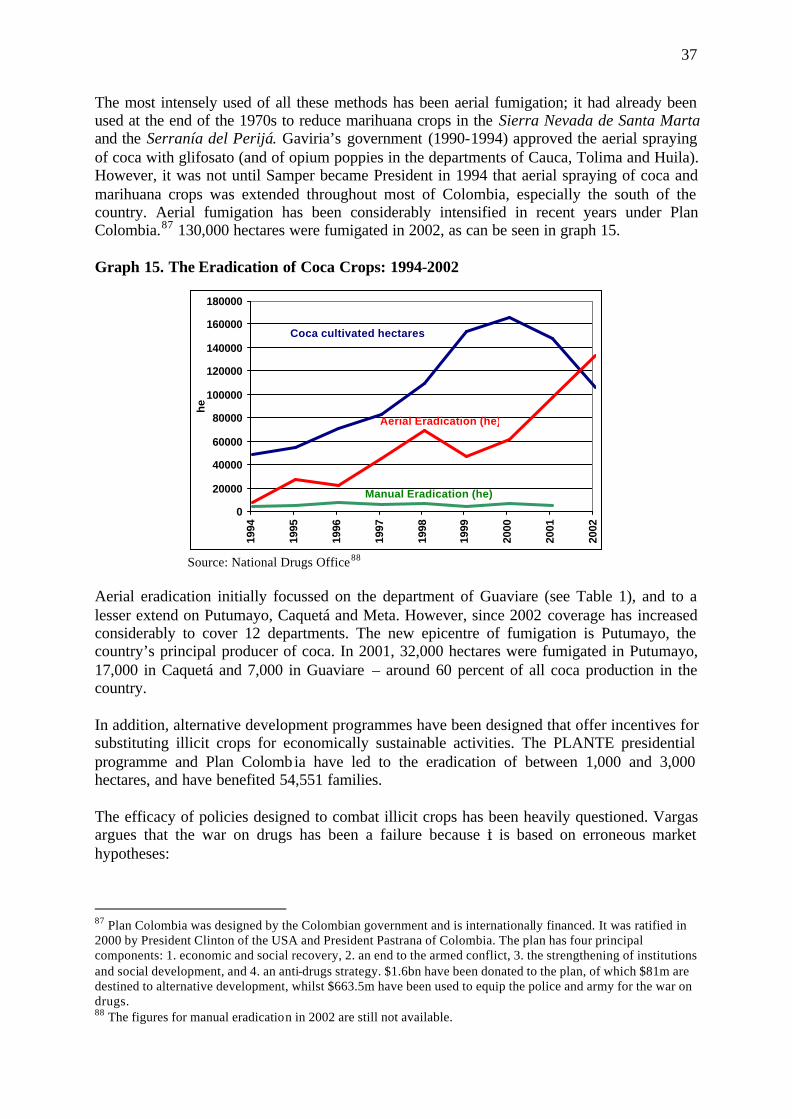
37
The most intensely used of all these methods has been aerial fumigation; it had already been used at the end of the 1970s to reduce marihuana crops in the Sierra Nevada de Santa Marta and the Serranía del Perijá. Gaviria’s government (1990-1994) approved the aerial spraying of coca with glifosato (and of opium poppies in the departments of Cauca, Tolima and Huila). However, it was not until Samper became President in 1994 that aerial spraying of coca and marihuana crops was extended throughout most of Colombia, especially the south of the country. Aerial fumigation has been considerably intensified in recent years under Plan Colombia.87 130,000 hectares were fumigated in 2002, as can be seen in graph 15. Graph 15. The Eradication of Coca Crops: 1994-2002
0
20000
40000
60000
80000
100000
120000
140000
160000
180000
1994
1995
1996
1997
1998
1999
2000
2001
2002
he
Coca cultivated hectares
Aerial Eradication (he)
Manual Eradication (he)
Source: National Drugs Office88 Aerial eradication initially focussed on the department of Guaviare (see Table 1), and to a lesser extend on Putumayo, Caquetá and Meta. However, since 2002 coverage has increased considerably to cover 12 departments. The new epicentre of fumigation is Putumayo, the country’s principal producer of coca. In 2001, 32,000 hectares were fumigated in Putumayo, 17,000 in Caquetá and 7,000 in Guaviare – around 60 percent of all coca production in the country. In addition, alternative development programmes have been designed that offer incentives for substituting illicit crops for economically sustainable activities. The PLANTE presidential programme and Plan Colombia have led to the eradication of between 1,000 and 3,000 hectares, and have benefited 54,551 families. The efficacy of policies designed to combat illicit crops has been heavily questioned. Vargas argues that the war on drugs has been a failure because it is based on erroneous market hypotheses:
87 Plan Colombia was designed by the Colombian government and is internationally financed. It was ratified in 2000 by President Clinton of the USA and President Pastrana of Colombia. The plan has four principal components: 1. economic and social recovery, 2. an end to the armed conflict, 3. the strengthening of institutions and social development, and 4. an anti-drugs strategy. $1.6bn have been donated to the plan, of which $81m are destined to alternative development, whilst $663.5m have been used to equip the police and army for the war on drugs. 88 The figures for manual eradication in 2002 are still not available.
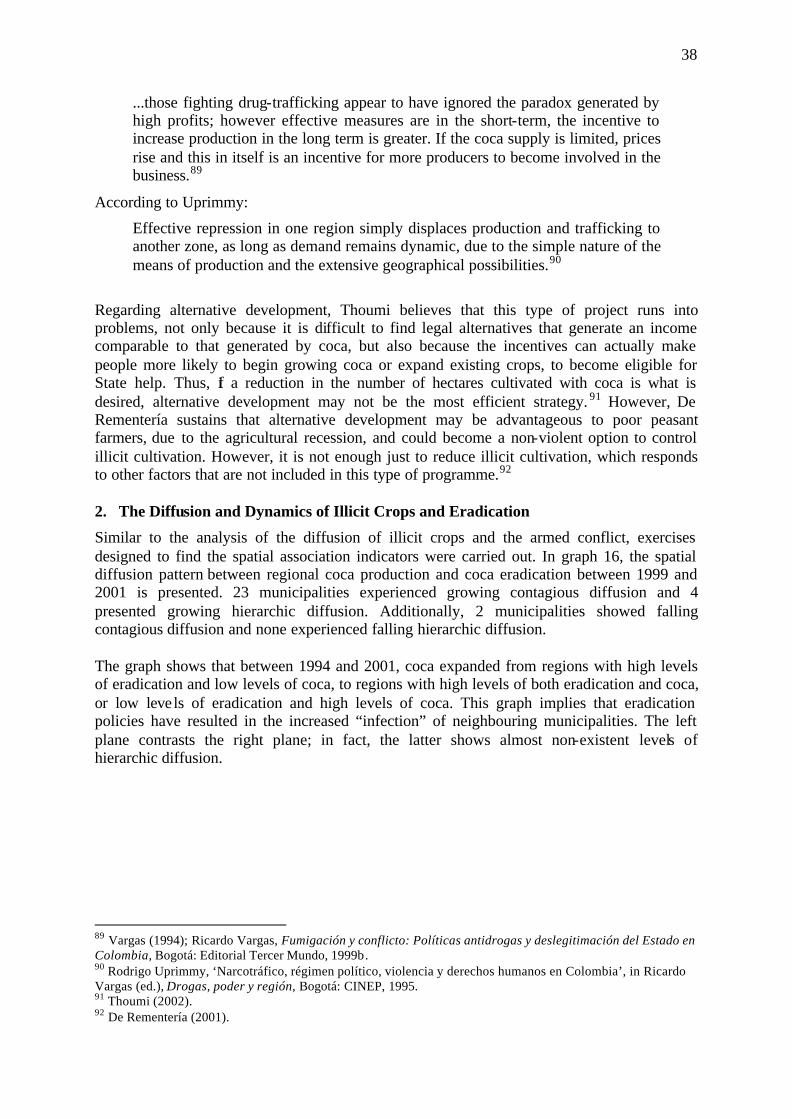
38
...those fighting drug-trafficking appear to have ignored the paradox generated by high profits; however effective measures are in the short-term, the incentive to increase production in the long term is greater. If the coca supply is limited, prices rise and this in itself is an incentive for more producers to become involved in the business.89
According to Uprimmy:
Effective repression in one region simply displaces production and trafficking to another zone, as long as demand remains dynamic, due to the simple nature of the means of production and the extensive geographical possibilities.90
Regarding alternative development, Thoumi believes that this type of project runs into problems, not only because it is difficult to find legal alternatives that generate an income comparable to that generated by coca, but also because the incentives can actually make people more likely to begin growing coca or expand existing crops, to become eligible for State help. Thus, if a reduction in the number of hectares cultivated with coca is what is desired, alternative development may not be the most efficient strategy. 91 However, De Rementería sustains that alternative development may be advantageous to poor peasant farmers, due to the agricultural recession, and could become a non-violent option to control illicit cultivation. However, it is not enough just to reduce illicit cultivation, which responds to other factors that are not included in this type of programme.92 2. The Diffusion and Dynamics of Illicit Crops and Eradication
Similar to the analysis of the diffusion of illicit crops and the armed conflict, exercises designed to find the spatial association indicators were carried out. In graph 16, the spatial diffusion pattern between regional coca production and coca eradication between 1999 and 2001 is presented. 23 municipalities experienced growing contagious diffusion and 4 presented growing hierarchic diffusion. Additionally, 2 municipalities showed falling contagious diffusion and none experienced falling hierarchic diffusion. The graph shows that between 1994 and 2001, coca expanded from regions with high levels of eradication and low levels of coca, to regions with high levels of both eradication and coca, or low levels of eradication and high levels of coca. This graph implies that eradication policies have resulted in the increased “infection” of neighbouring municipalities. The left plane contrasts the right plane; in fact, the latter shows almost non-existent levels of hierarchic diffusion.
89 Vargas (1994); Ricardo Vargas, Fumigación y conflicto: Políticas antidrogas y deslegitimación del Estado en Colombia, Bogotá: Editorial Tercer Mundo, 1999b. 90 Rodrigo Uprimmy, ‘Narcotráfico, régimen político, violencia y derechos humanos en Colombia’, in Ricardo Vargas (ed.), Drogas, poder y región, Bogotá: CINEP, 1995. 91 Thoumi (2002). 92 De Rementería (2001).
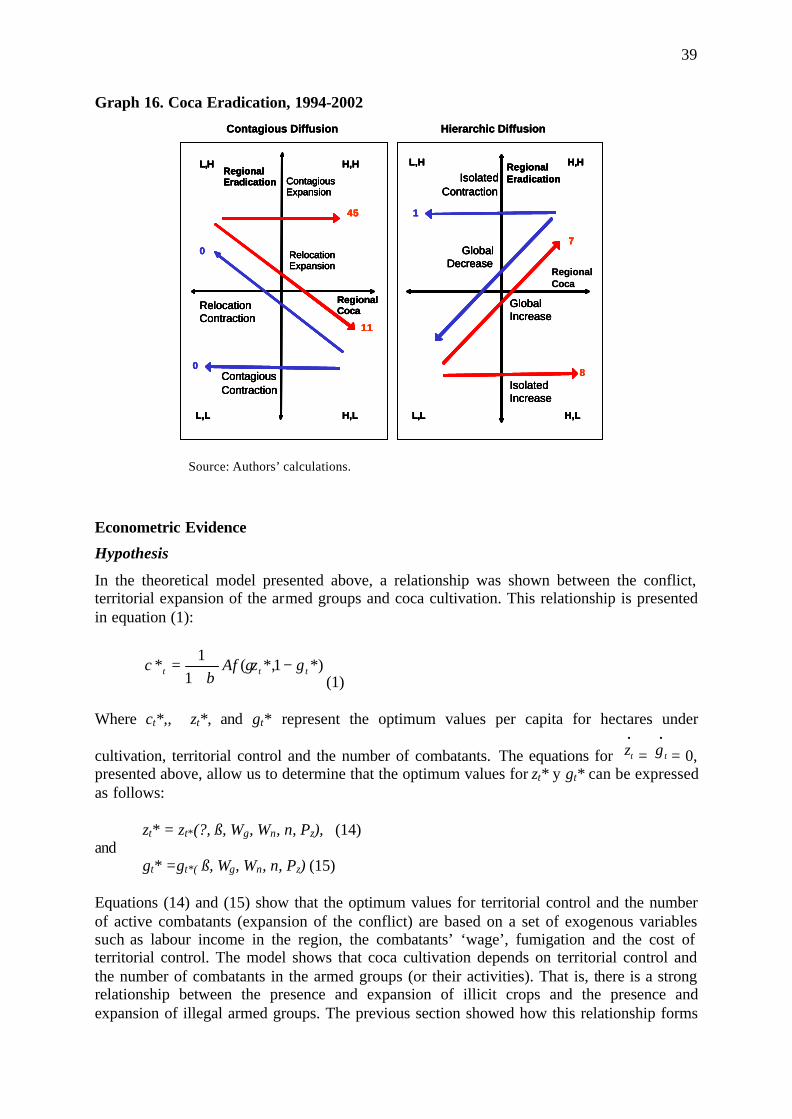
39
Graph 16. Coca Eradication, 1994-2002
Regional Coca
Contagious Diffusion Hierarchic Diffusion
L,L
Contagious Expansion
Contagious Contraction
Relocation Contraction
Relocation Expansion
L,H H,H
H,L
Regional Eradication
Regional Coca
Isolated Contraction
Global Increase
Global Decrease
Isolated Increase
L,H H,H
L,L H,L
Regional Eradication
0
0
45
11
8
7
1
Regional Coca
Contagious Diffusion Hierarchic Diffusion
L,L
Contagious Expansion
Contagious Contraction
Relocation Contraction
Relocation Expansion
L,H H,H
H,L
Regional Eradication
Regional Coca
Isolated Contraction
Global Increase
Global Decrease
Isolated Increase
L,H H,H
L,L H,L
Regional Eradication
0
0
45
11
8
7
1
L,L
Contagious Expansion
Contagious Contraction
Relocation Contraction
Relocation Expansion
L,H H,H
H,L
Regional Eradication
Regional Coca
Isolated Contraction
Global Increase
Global Decrease
Isolated Increase
L,H H,H
L,L H,L
Regional Eradication
0
0
45
11
8
7
1
Source: Authors’ calculations.
Econometric Evidence
Hypothesis
In the theoretical model presented above, a relationship was shown between the conflict, territorial expansion of the armed groups and coca cultivation. This relationship is presented in equation (1):
*)1*,(1
1* ttt gzAfc −
+= γ
β (1) Where ct*,, zt*, and gt* represent the optimum values per capita for hectares under
cultivation, territorial control and the number of combatants. The equations for •
tz = •
tg = 0, presented above, allow us to determine that the optimum values for zt* y gt* can be expressed as follows:
zt* = zt*(?, ß, Wg, Wn, n, Pz), (14) and
gt* =gt*( ß, Wg, Wn, n, Pz) (15) Equations (14) and (15) show that the optimum values for territorial control and the number of active combatants (expansion of the conflict) are based on a set of exogenous variables such as labour income in the region, the combatants’ ‘wage’, fumigation and the cost of territorial control. The model shows that coca cultivation depends on territorial control and the number of combatants in the armed groups (or their activities). That is, there is a strong relationship between the presence and expansion of illicit crops and the presence and expansion of illegal armed groups. The previous section showed how this relationship forms
40
via interaction between the spatial diffusion of illicit crops and the spatial diffusion of the conflict. The following subsection quantifies the magnitude of the relationship between the conflict and illicit crops using matching estimators, which allow us to correct any endogenous problems in the relationship.
Matching Estimators
To determine the effect of armed groups’ activities on coca cultivation, an econometric model could be used in which the dependant variable is the number of cultivated hectares and the independent variable is armed activity. It could also be controlled by proxy variables or could include the exogenous variables in equations (14) and (15) (poverty, inequality, and geographical, judicial and anti-drug activity variables, etc.),93 as is shown in the equation below:
tititititititi SAEJGEOGCoca ,,8,6,5,3,21, εαααααα ++++++= (16)
Where tiCoca , is the variable indicating the presence of illicit crops in municipality i in year t, G is the matrix that contains information related to the presence of each of the armed groups in municipality i at moment t, GEO is the matrix of geographical and spatial characteristics, J is a vector containing information related to judicial efficiency (a proxy of Pz), AE is a vector containing information related to productive activities and wealth in each of the municipalities and S is a matrix containing the socioeconomic characteristics of each municipality, such as GINI, NBI, level of education, amongst others (proxies of Wg and Wn). However, various errors are evident in this exercise; the estimates of the parameters could be biased, have erroneous significance levels and could therefore lead to incorrect conclusions. In the first place, there could be endogenity between the presence of coca crops and illegal armed activity – illegal armed actions could, in turn, depend on illegal productive activities. In the second place, the armed groups’ actions are a decision variable, that depends on variables GEO, J, AE and S, leading us to commit the error known as selection bias.94 In fact, the theoretical model shows how an “optimal” armed conflict (expressed as the number of men and women in arms or their activities) depends on variables GEO, J, AE and S, which gives theoretic credence to the hypothesis proposed here. To overcome the endogenous inconveniences, and to ensure that the empirical estimates reflect the theoretical model, a non-parametric method was used that enabled us to analyse the existing relationship between coca crops, illegal armed groups (FARC, ELN and illegal self-defence groups) and aerial spraying. The methodology used was that of matching estimators, which enabled us to answer the following question: What would be the value of cultivated hectares of coca in a municipality with illegal armed group presence if these groups had not been present? The answer will show the effect of the armed conflict (expressed via the
93 In fact, probabilistic econometric exercises were carried out (Spatial Probit) to try and find the determinants of illegal activity in Colombian municipalities, using spatial econometric tools. However, the results, although satisfactory, presented problems related to endogenity and multicolinearity, which is why the models were calculated using the methodology proposed here. 94 James Heckman, ‘Sample Selection Bias as a Specification Error (With an application to the Estimation of Labor Supply Functions)’, NBER Working Paper, w1072, Cambridge, Mass.: National Bureau of Economic Research, 1977; James Heckman, Hidehiko Ichmura, Jeffrey Smith & Petra Todd, ‘Characterizing Selection Bias Using Experimental Data’, Econometrica, 66:5 (1998), pp.1017-1098; Petra Todd, A Practical Guide to Implementing Matching Estimators, mimeo, 1999.
41
activity of these groups) on the number of hectares cultivated with coca in a municipality. The problem with this type of analysis is that it is impossible to observe the same municipality, at the same moment in time, with and without the activity of an armed group, and then to compare the number of hectares cultivated in each scenario. The fact that one of the events is not physically observable means that a simulation has to be carried out. In other words, if Coca1 and Coca2 represent the number of cultivated hectares of coca in municipalities with and without the presence of armed actors respectively, what we need to know is: How many cultivated hectares would there be in municipalities with the presence of illegal armed groups (Coca1Z, Ai=1), if those armed groups were not present (Coca2Z, Ai=0)? The difference between these two values, (Coca1Z, Ai=1) - (Coca2Z, Ai=0), is the effect of illegal armed group presence on cultivated hectares of coca. However, (Coca2Z, Ai=0) is non-observable. It is, therefore, necessary to simulate it via a secondary estimate of variable A (the activities of illegal armed groups). This simulation will permit a comparison of the number of hectares in each municipality with illegal armed activity, with those of municipalities without illegal armed activity but with a similar probability of experiencing the presence of an armed group. In other words, each municipality with armed group presence should be paired (compared) with the most similar municipality that does not present any illegal armed activity. The first step is to determine the probability that an armed group will begin activities in a given municipality by using binary, probit or logit selection models, which have explanatory variables that are similar or proxy to the equation’s exogenous variables (15), as well as other controls (persistence and diffusion variables of the group’s activities in the municipalities – temporary and spatial lags95 of the dependant variable – as well as, geographical, judicial, economic and social factors). These regressions will serve to estimate the prior probability. For example, if a probability model is constructed for FARC activity in Colombian municipalities, the probability of this group’s entering a municipality may be estimated, given the characteristics of all other municipalities. This probability will be enough to carry out the matching exercise. The probability of an armed group beginning activities could be high or low, independent of whether or not they had been active in the area before. We used the equation below to calculate this probability:
)()1Pr( ji ZfZA ω== (17) Using the probabilities that result from the probit models, municipalities may be paired via a matching estimator. This procedure consists of generating a control group that allows us to compare the effect of intervention on a municipality (in this case, illegal armed activity) with municipalities that have an equal probability of intervention, although they did not actually experience it. Various types of matching estimators may be used: simple average nearest neighbour, kernel or local linear regression. The simple average nearest neighbour estimator allows a comparison of each municipality with armed activity with those that have the closest mathematical probability of some kind of attack, but which have not yet experienced it. By using the values calculated for ? , a probability estimate of illegal armed activity can be made for each municipality (propensity score). The differences between each municipality with illegal armed activity and each
95 These are spatial Probit models. The spatial variables are presented in the spatial contiguity matrix, which solves the spatial autocorrelation problem. See Moreno and Vayá (2000).
42
municipality without it can then be calculated to form a distance vector that should be ordered from the lowest to the highest. The number of cultivated hectares in each municipality should then be compared with the N closest municipalities in terms of probability, but that do not have illegal armed activity. This investigation used 1, 3, 5, 7, 10 and 20 neighbours. Thus, for these N municipalities, the number of cultivated hectares of coca should be calculated as follows:
∑=
=N
j
jkm N
CocaCoca
1, (18)
Equation (18) simulates the number of hectares of coca municipality k would have had if it were a municipality without illegal armed activity. Therefore, (Cocai- Cocam,k) is the effect of illegal armed activity on the number of cultivated hectares. The simulation should be carried out for all municipalities with illegal armed activity, in order to find the average difference, called the average treatment effect on the treated (ATT):
∑=
−=
N
k t
kmk
NCocaCoca
ATT1
, )( (19)
Where Nt are municipalities with illegal armed activity. The ATT value is the effect of armed activity or the conflict on the number of cultivated hectares of coca. The kernel estimator methodology is similar to that of the simple average nearest neighbour, but a 1/x weighting is assigned to all observations in the comparison group. All municipalities with guerrilla presence are paired with weighed averages of all the controls, using weighs that are inversely proportional to the distance between the propensity scores of the treated and the control group. This means that the weighting is selected to ensure that the closest observations (in terms of distance |P(Xi ) - P(Xj )|) are given greater weighs. This weighting is reached via a kernel function that requires the choice of a bandwidth; this is equivalent to choosing the number of neighbours in the case of the simple average nearest neighbour.96 Finally, the lineal local regression estimators are based on a non parametric regression technique in which for each propensity score a weighed least square regression for Coca is estimated on a constant term and on the difference in probabilities between the treated and the controls, in those municipalities with illegal armed activity. We use the data in which the difference is zero, and the parameter of the constant will be the estimated difference.97 Once the estimators for whichever of these methodologies have been calculated, one must verify their reliability. As the techniques used are not parametric, a method should be used that allows us to obtain almost real solutions using random data. The procedure most often used in these cases is bootstrapping – taking samples from the original sample B that allow one to obtain the difference for each of the models. The prediction error is then quantified, and the average of all these errors is the estimate of the prediction standard error. This methodology may also be used to evaluate the effect of illicit crops on rebel and paramilitary activity, allowing us to examine the hypothesis that coca crops explain the
96 Todd (1999). 97 Todd (1999).
43
conflict. To do this, we tried to determine armed group activity in municipalities with coca crops if these coca crops had not existed. Therefore, the treatment variable is the presence of coca in all the municipalities, and the outcome variable is illegal armed activity measured as the activity of the groups (attacks or per capita attacks). Data
The econometric exercises used different variables for 1,062 Colombian municipalities in 1994 and 1999-2001. As stated above, econometric exercises were carried out on binary variables to find the probability of illegal armed activity (FARC, ELN and illegal self-defence groups). The available information was the number and type of activity or attack, by municipality and by group. This information was processed and a value of 1 was given if there was activity and 0 if there was not.98 The variables related to the presence of armed activity were divided into five groups: illegal armed group activities; geographical; infrastructure; justice and eradication activities; economic activity and social conditions. Armed conflict variables include the dependent variables lagged temporally and spatially, as well as the activity of other armed groups in the municipality. These variables affect Pz (if the group is the same Pz falls, and if it is a different group Pz rises). The geographical characteristics include altitude, land aptitude, erosion, the presence of water,99 and the distance to the most important markets and the departmental capital, all of which are linked to the cost of territorial control Pz in equation (15). Infrastructure includes municipal roads and phone lines. The proxy variables for economic activity are dummy variables related to the presence of extractive economies such as oil, coal, emeralds and gold, as well as cattle farming, all of which are variables related to coca workers’ incomes Wn and those of combatants Wg. The effort of the State is expressed as judicial efficiency and its effect on Pz, and coca eradication ß. Finally, social conditions are summarized as the Unsatisfied Basic Needs Index (NBI) and the Gini coefficient (rural land concentration), both of which affect Wn and Wg. Results
This section presents the results on the differences between cultivated hectares of coca in 2000 in municipalities with and without the presence of illegal armed activity, for all Colombian municipalities and then by region. Initially the determinants of guerrilla and paramilitary activity were calculated for the whole of the national territory and then by geographical region (Orinoco and Amazon, Andean, Caribbean and Pacific). Propensity scores were estimated using the spatial probit methodology. In general, the models accurately predicted the effect of the independent variables on the probability of an attack by an illegal armed group. Once all the propensity scores had been calculated, the number of cultivated hectares in municipalities with illegal armed activity were compared with the control group of municipalities without this type of activity, but which have a close probability of having it. 98 Included actions are: extortive terrorist acts, armed confrontation, attacks on installations, planes, urban and rural areas, ambushes, harassment, confrontations, terrestrial piracy and massacres. 99 All this information is from the Instituto Geográfico Agustín Codazzi. Altitude is measured as metres above sea level, aptitude and erosion are divided by range. Soil aptitude goes from 1 to 8, 1 being the most fertile and 8 the least. Erosion goes from 0 to 5, 0 representing no erosion and 5 severe erosion. A weighed average was then calculated for soil erosion and aptitude (see Fabio Sánchez & Jairo Nuñez, ‘Lageografía y el desarrollo económico en Colombia: una aproximación municipal’, Desarrollo y Sociedad 46 (1999)).
44
Simple average nearest neighbour, kernel and local lineal regression methodologies were used, each of which produced very similar results. The same procedure was used to determine the effect of illicit crops on armed activity. In order to analyse the efficacy of eradication policies, the same methodology was used to compare municipalities where eradication had taken place with those where it had not (although coca was being grown). A similar level of probability was found. 1. The Differences Between Cultivated Hectares of Coca as a Consequence of Illegal Armed Activity.
a. Armed Actors
The variables that determine the national and regional activities of the armed groups are divided into five groups: historical persistence and neighbouring activity; justice and drug trafficking; economic and social; geographic; and infrastructure (see Annex Table A2).100 In general, all the models present a good fit value and the variables have the expected signs. Historical persistence, geography and infrastructure positively affect armed activity, whilst judicial efficiency dissuades armed activities and thus has a negative coefficient. However, our interest is in determining the effect of armed activity on coca production in Colombia. By using matching estimators, the results shown in table 1 were obtained. In 2000, armed activity by at least one of the armed groups was present in 507 municipalities, and the difference between the average number of hectares in these municipalities and the control group is positive and significant. For example, according to the simple average nearest neighbour methodology, the average difference was 166.5 hectares. If this figure is multiplied by the 507 municipalities mentioned above, the total is 84,430 hectares – which means that about 50 percent of the total number of cultivated hectares in Colombia in 2000 was due to the presence of illegal armed activity. When the exercises were carried out at a regional level, the differences rose significantly, due to the fact that the variables that explain illegal armed activity and the coefficients obtained were different for each region. In Orinoco and Amazon, an average of 1,064 hectares were cultivated in the 59 municipalities with the presence of one of the armed groups; in the control groups the figure was 203.03 (using the average nearest neighbour estimator and local lineal regression). The number of cultivated hectares that can be attributed to the presence of armed actors is, therefore, 1,400 hectares. If this difference is multiplied by the number of municipalities in which there was illegal armed activity (59), it can be seen that approximately 60 percent of all cultivated hectares in 2000 in this region was due to the presence of armed activity. The number of cultivated hectares originating from the conflict in Orinoco and Amazon represent 47 percent of all coca cultivated in Colombia that year.
100 In this case a dummy variable of 1 was used if a municipality i presented illegal armed activity (FARC, ELN or illegal Self-defence groups) and of 0 if it did not.
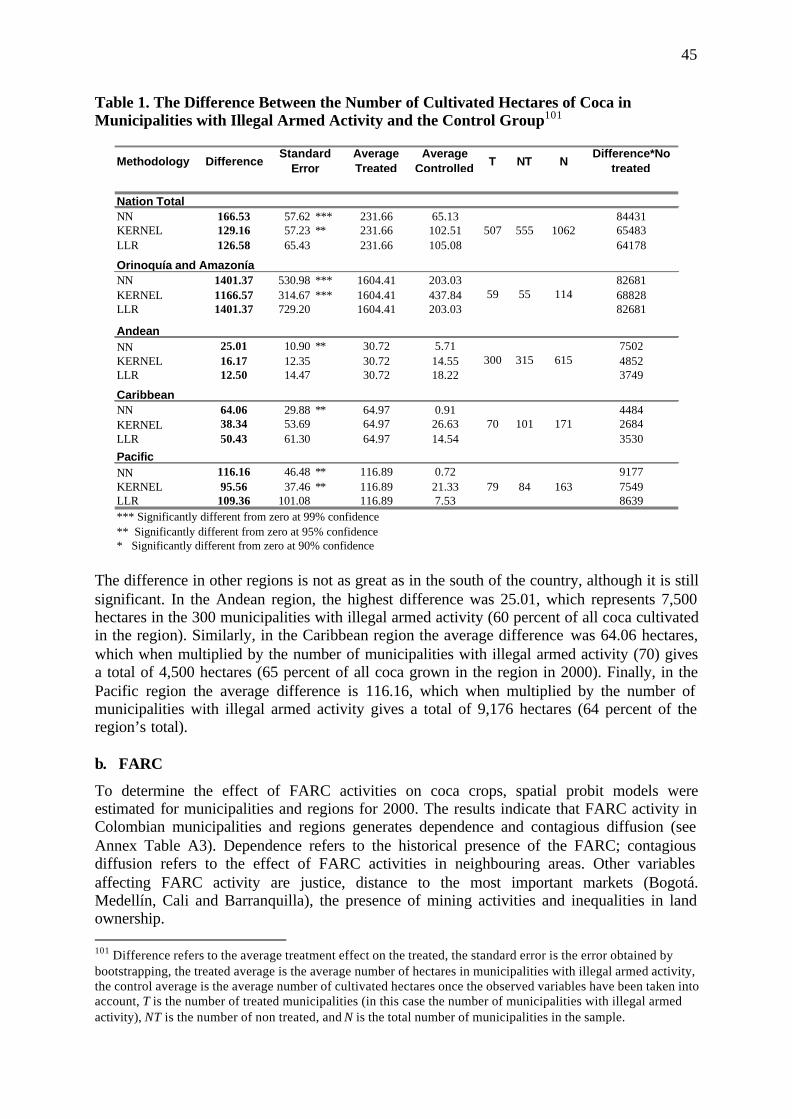
45
Table 1. The Difference Between the Number of Cultivated Hectares of Coca in Municipalities with Illegal Armed Activity and the Control Group101
Methodology DifferenceAverage Treated
Average Controlled T NT N
Difference*No treated
Nation Total NN 166.53 57.62 *** 231.66 65.13 84431KERNEL 129.16 57.23 ** 231.66 102.51 65483LLR 126.58 65.43 231.66 105.08 64178
Orinoquía and AmazoníaNN 1401.37 530.98 *** 1604.41 203.03 82681KERNEL 1166.57 314.67 *** 1604.41 437.84 68828LLR 1401.37 729.20 1604.41 203.03 82681
Andean NN 25.01 10.90 ** 30.72 5.71 7502KERNEL 16.17 12.35 30.72 14.55 4852LLR 12.50 14.47 30.72 18.22 3749
Caribbean NN 64.06 29.88 ** 64.97 0.91 4484KERNEL 38.34 53.69 64.97 26.63 2684LLR 50.43 61.30 64.97 14.54 3530
PacificNN 116.16 46.48 ** 116.89 0.72 9177KERNEL 95.56 37.46 ** 116.89 21.33 7549LLR 109.36 101.08 116.89 7.53 8639*** Significantly different from zero at 99% confidence** Significantly different from zero at 95% confidence* Significantly different from zero at 90% confidence
70 101 171
79 84 163
59 55 114
300 315 615
Standard Error
507 555 1062
The difference in other regions is not as great as in the south of the country, although it is still significant. In the Andean region, the highest difference was 25.01, which represents 7,500 hectares in the 300 municipalities with illegal armed activity (60 percent of all coca cultivated in the region). Similarly, in the Caribbean region the average difference was 64.06 hectares, which when multiplied by the number of municipalities with illegal armed activity (70) gives a total of 4,500 hectares (65 percent of all coca grown in the region in 2000). Finally, in the Pacific region the average difference is 116.16, which when multiplied by the number of municipalities with illegal armed activity gives a total of 9,176 hectares (64 percent of the region’s total). b. FARC
To determine the effect of FARC activities on coca crops, spatial probit models were estimated for municipalities and regions for 2000. The results indicate that FARC activity in Colombian municipalities and regions generates dependence and contagious diffusion (see Annex Table A3). Dependence refers to the historical presence of the FARC; contagious diffusion refers to the effect of FARC activities in neighbouring areas. Other variables affecting FARC activity are justice, distance to the most important markets (Bogotá. Medellín, Cali and Barranquilla), the presence of mining activities and inequalities in land ownership. 101 Difference refers to the average treatment effect on the treated, the standard error is the error obtained by bootstrapping, the treated average is the average number of hectares in municipalities with illegal armed activity, the control average is the average number of cultivated hectares once the observed variables have been taken into account, T is the number of treated municipalities (in this case the number of municipalities with illegal armed activity), NT is the number of non treated, and N is the total number of municipalities in the sample.
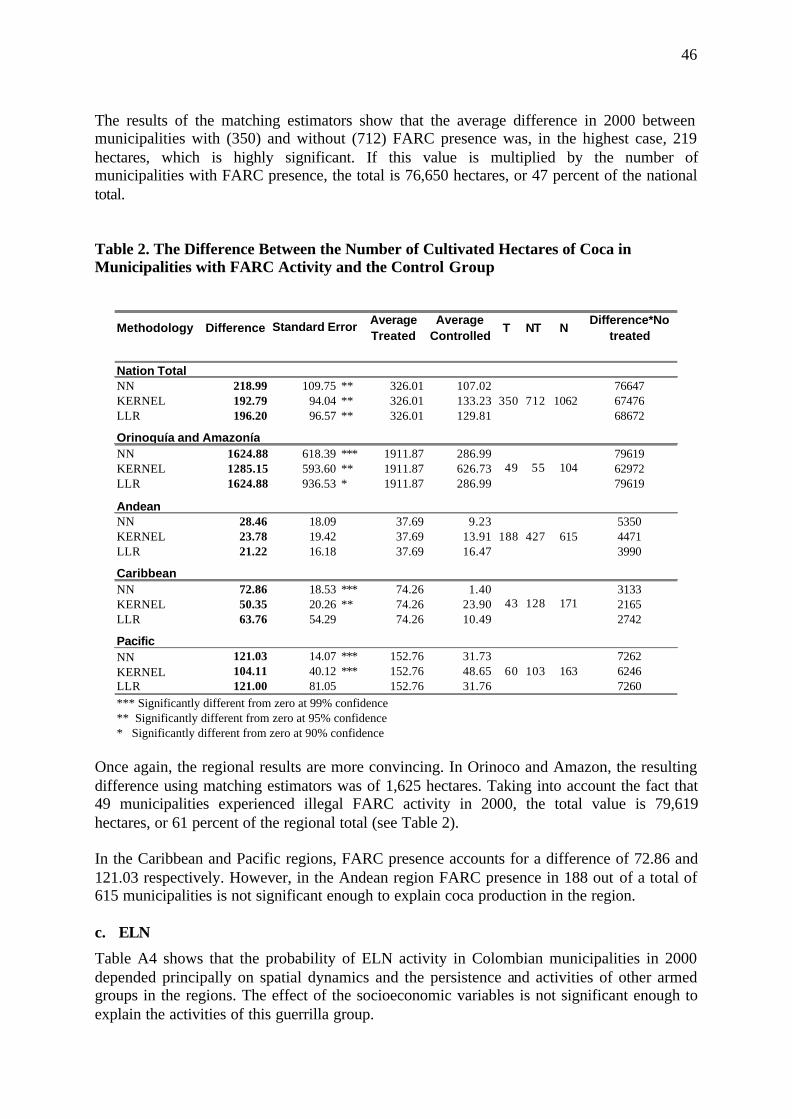
46
The results of the matching estimators show that the average difference in 2000 between municipalities with (350) and without (712) FARC presence was, in the highest case, 219 hectares, which is highly significant. If this value is multiplied by the number of municipalities with FARC presence, the total is 76,650 hectares, or 47 percent of the national total. Table 2. The Difference Between the Number of Cultivated Hectares of Coca in Municipalities with FARC Activity and the Control Group
Methodology DifferenceAverage Treated
Average Controlled
T NT NDifference*No
treated
Nation TotalNN 218.99 109.75 ** 326.01 107.02 76647KERNEL 192.79 94.04 ** 326.01 133.23 67476LLR 196.20 96.57 ** 326.01 129.81 68672
Orinoquía and AmazoníaNN 1624.88 618.39 *** 1911.87 286.99 79619KERNEL 1285.15 593.60 ** 1911.87 626.73 62972LLR 1624.88 936.53 * 1911.87 286.99 79619
Andean NN 28.46 18.09 37.69 9.23 5350KERNEL 23.78 19.42 37.69 13.91 4471LLR 21.22 16.18 37.69 16.47 3990
Caribbean NN 72.86 18.53 *** 74.26 1.40 3133KERNEL 50.35 20.26 ** 74.26 23.90 2165LLR 63.76 54.29 74.26 10.49 2742
PacificNN 121.03 14.07 *** 152.76 31.73 7262KERNEL 104.11 40.12 *** 152.76 48.65 6246LLR 121.00 81.05 152.76 31.76 7260*** Significantly different from zero at 99% confidence** Significantly different from zero at 95% confidence* Significantly different from zero at 90% confidence
60 103 163
188 427 615
43 128 171
350 712 1062
49 55 104
Standard Error
Once again, the regional results are more convincing. In Orinoco and Amazon, the resulting difference using matching estimators was of 1,625 hectares. Taking into account the fact that 49 municipalities experienced illegal FARC activity in 2000, the total value is 79,619 hectares, or 61 percent of the regional total (see Table 2). In the Caribbean and Pacific regions, FARC presence accounts for a difference of 72.86 and 121.03 respectively. However, in the Andean region FARC presence in 188 out of a total of 615 municipalities is not significant enough to explain coca production in the region. c. ELN
Table A4 shows that the probability of ELN activity in Colombian municipalities in 2000 depended principally on spatial dynamics and the persistence and activities of other armed groups in the regions. The effect of the socioeconomic variables is not significant enough to explain the activities of this guerrilla group.
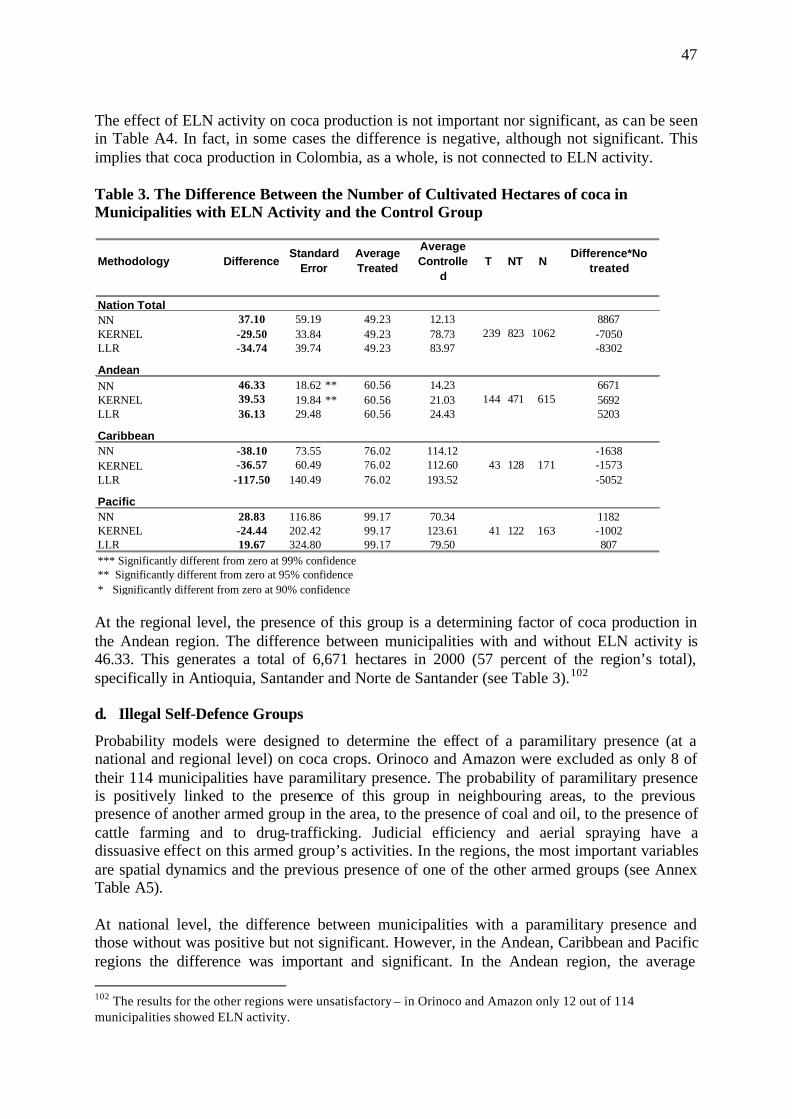
47
The effect of ELN activity on coca production is not important nor significant, as can be seen in Table A4. In fact, in some cases the difference is negative, although not significant. This implies that coca production in Colombia, as a whole, is not connected to ELN activity. Table 3. The Difference Between the Number of Cultivated Hectares of coca in Municipalities with ELN Activity and the Control Group
Methodology DifferenceAverage Treated
Average Controlle
dT NT N
Difference*No treated
Nation TotalNN 37.10 59.19 49.23 12.13 8867KERNEL -29.50 33.84 49.23 78.73 -7050LLR -34.74 39.74 49.23 83.97 -8302
Andean NN 46.33 18.62 ** 60.56 14.23 6671KERNEL 39.53 19.84 ** 60.56 21.03 5692LLR 36.13 29.48 60.56 24.43 5203
Caribbean NN -38.10 73.55 76.02 114.12 -1638KERNEL -36.57 60.49 76.02 112.60 -1573LLR -117.50 140.49 76.02 193.52 -5052
PacificNN 28.83 116.86 99.17 70.34 1182KERNEL -24.44 202.42 99.17 123.61 -1002LLR 19.67 324.80 99.17 79.50 807*** Significantly different from zero at 99% confidence** Significantly different from zero at 95% confidence* Significantly different from zero at 90% confidence
615
128 171
41 122 163
43
144 471
Standard Error
239 823 1062
At the regional level, the presence of this group is a determining factor of coca production in the Andean region. The difference between municipalities with and without ELN activity is 46.33. This generates a total of 6,671 hectares in 2000 (57 percent of the region’s total), specifically in Antioquia, Santander and Norte de Santander (see Table 3).102 d. Illegal Self-Defence Groups
Probability models were designed to determine the effect of a paramilitary presence (at a national and regional level) on coca crops. Orinoco and Amazon were excluded as only 8 of their 114 municipalities have paramilitary presence. The probability of paramilitary presence is positively linked to the presence of this group in neighbouring areas, to the previous presence of another armed group in the area, to the presence of coal and oil, to the presence of cattle farming and to drug-trafficking. Judicial efficiency and aerial spraying have a dissuasive effect on this armed group’s activities. In the regions, the most important variables are spatial dynamics and the previous presence of one of the other armed groups (see Annex Table A5). At national level, the difference between municipalities with a paramilitary presence and those without was positive but not significant. However, in the Andean, Caribbean and Pacific regions the difference was important and significant. In the Andean region, the average 102 The results for the other regions were unsatisfactory – in Orinoco and Amazon only 12 out of 114 municipalities showed ELN activity.
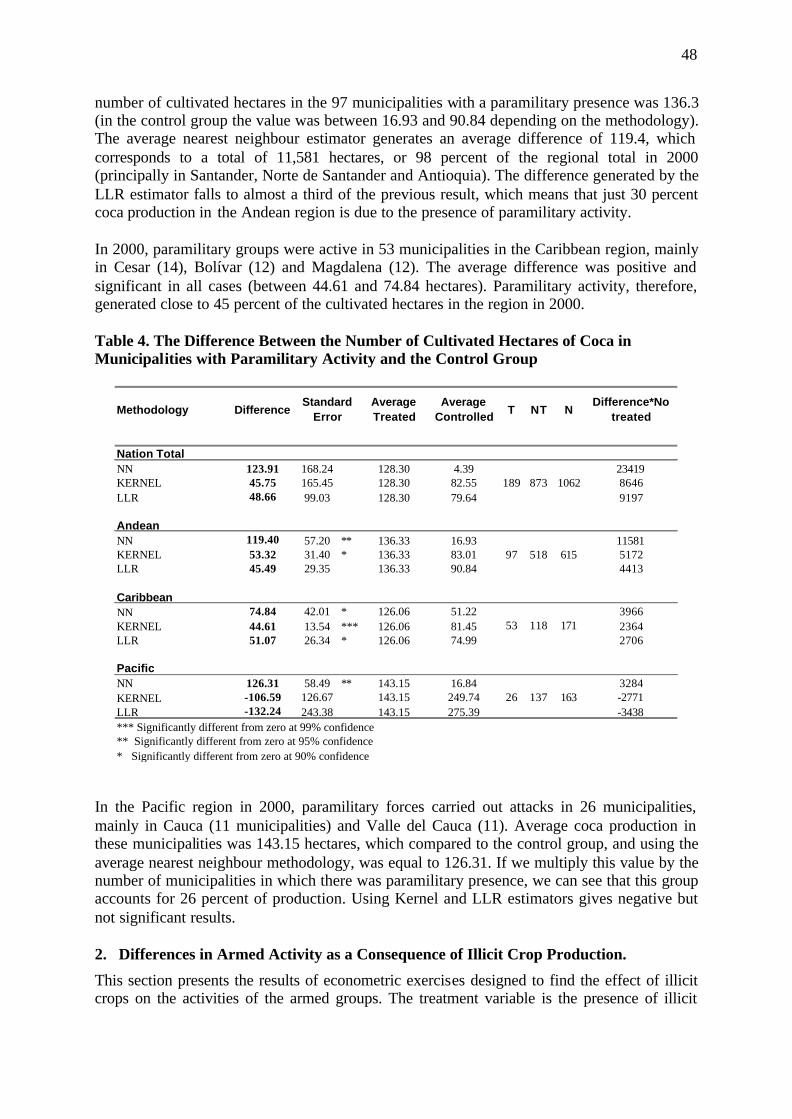
48
number of cultivated hectares in the 97 municipalities with a paramilitary presence was 136.3 (in the control group the value was between 16.93 and 90.84 depending on the methodology). The average nearest neighbour estimator generates an average difference of 119.4, which corresponds to a total of 11,581 hectares, or 98 percent of the regional total in 2000 (principally in Santander, Norte de Santander and Antioquia). The difference generated by the LLR estimator falls to almost a third of the previous result, which means that just 30 percent coca production in the Andean region is due to the presence of paramilitary activity. In 2000, paramilitary groups were active in 53 municipalities in the Caribbean region, mainly in Cesar (14), Bolívar (12) and Magdalena (12). The average difference was positive and significant in all cases (between 44.61 and 74.84 hectares). Paramilitary activity, therefore, generated close to 45 percent of the cultivated hectares in the region in 2000. Table 4. The Difference Between the Number of Cultivated Hectares of Coca in Municipalities with Paramilitary Activity and the Control Group
Methodology DifferenceAverage Treated
Average Controlled T NT N
Difference*No treated
Nation TotalNN 123.91 168.24 128.30 4.39 23419KERNEL 45.75 165.45 128.30 82.55 8646LLR 48.66 99.03 128.30 79.64 9197
AndeanNN 119.40 57.20 ** 136.33 16.93 11581KERNEL 53.32 31.40 * 136.33 83.01 5172LLR 45.49 29.35 136.33 90.84 4413
Caribbean NN 74.84 42.01 * 126.06 51.22 3966KERNEL 44.61 13.54 *** 126.06 81.45 2364LLR 51.07 26.34 * 126.06 74.99 2706
PacificNN 126.31 58.49 ** 143.15 16.84 3284KERNEL -106.59 126.67 143.15 249.74 -2771LLR -132.24 243.38 143.15 275.39 -3438*** Significantly different from zero at 99% confidence** Significantly different from zero at 95% confidence* Significantly different from zero at 90% confidence
1062
615
171
163
Standard Error
189 873
26 137
97 518
53 118
In the Pacific region in 2000, paramilitary forces carried out attacks in 26 municipalities, mainly in Cauca (11 municipalities) and Valle del Cauca (11). Average coca production in these municipalities was 143.15 hectares, which compared to the control group, and using the average nearest neighbour methodology, was equal to 126.31. If we multiply this value by the number of municipalities in which there was paramilitary presence, we can see that this group accounts for 26 percent of production. Using Kernel and LLR estimators gives negative but not significant results.
2. Differences in Armed Activity as a Consequence of Illicit Crop Production.
This section presents the results of econometric exercises designed to find the effect of illicit crops on the activities of the armed groups. The treatment variable is the presence of illicit
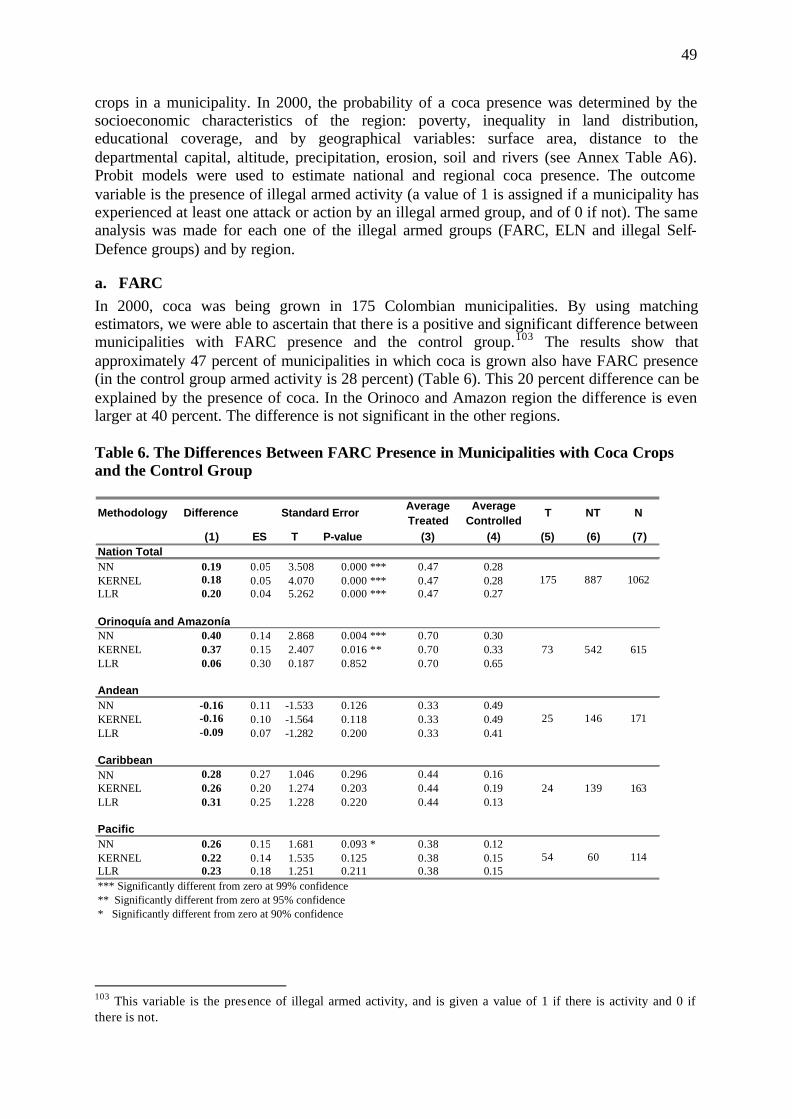
49
crops in a municipality. In 2000, the probability of a coca presence was determined by the socioeconomic characteristics of the region: poverty, inequality in land distribution, educational coverage, and by geographical variables: surface area, distance to the departmental capital, altitude, precipitation, erosion, soil and rivers (see Annex Table A6). Probit models were used to estimate national and regional coca presence. The outcome variable is the presence of illegal armed activity (a value of 1 is assigned if a municipality has experienced at least one attack or action by an illegal armed group, and of 0 if not). The same analysis was made for each one of the illegal armed groups (FARC, ELN and illegal Self-Defence groups) and by region.
a. FARC In 2000, coca was being grown in 175 Colombian municipalities. By using matching estimators, we were able to ascertain that there is a positive and significant difference between municipalities with FARC presence and the control group.103 The results show that approximately 47 percent of municipalities in which coca is grown also have FARC presence (in the control group armed activity is 28 percent) (Table 6). This 20 percent difference can be explained by the presence of coca. In the Orinoco and Amazon region the difference is even larger at 40 percent. The difference is not significant in the other regions. Table 6. The Differences Between FARC Presence in Municipalities with Coca Crops and the Control Group
Methodology DifferenceAverage Treated
Average Controlled
T NT N
(1) ES T P-value (3) (4) (5) (6) (7)Nation TotalNN 0.19 0.05 3.508 0.000 *** 0.47 0.28KERNEL 0.18 0.05 4.070 0.000 *** 0.47 0.28LLR 0.20 0.04 5.262 0.000 *** 0.47 0.27
Orinoquía and AmazoníaNN 0.40 0.14 2.868 0.004 *** 0.70 0.30KERNEL 0.37 0.15 2.407 0.016 ** 0.70 0.33LLR 0.06 0.30 0.187 0.852 0.70 0.65
Andean NN -0.16 0.11 -1.533 0.126 0.33 0.49KERNEL -0.16 0.10 -1.564 0.118 0.33 0.49LLR -0.09 0.07 -1.282 0.200 0.33 0.41
Caribbean NN 0.28 0.27 1.046 0.296 0.44 0.16KERNEL 0.26 0.20 1.274 0.203 0.44 0.19LLR 0.31 0.25 1.228 0.220 0.44 0.13
PacificNN 0.26 0.15 1.681 0.093 * 0.38 0.12KERNEL 0.22 0.14 1.535 0.125 0.38 0.15LLR 0.23 0.18 1.251 0.211 0.38 0.15*** Significantly different from zero at 99% confidence** Significantly different from zero at 95% confidence* Significantly different from zero at 90% confidence
24 139 163
54 60 114
73 542 615
25 146 171
Standard Error
175 887 1062
103 This variable is the presence of illegal armed activity, and is given a value of 1 if there is activity and 0 if there is not.
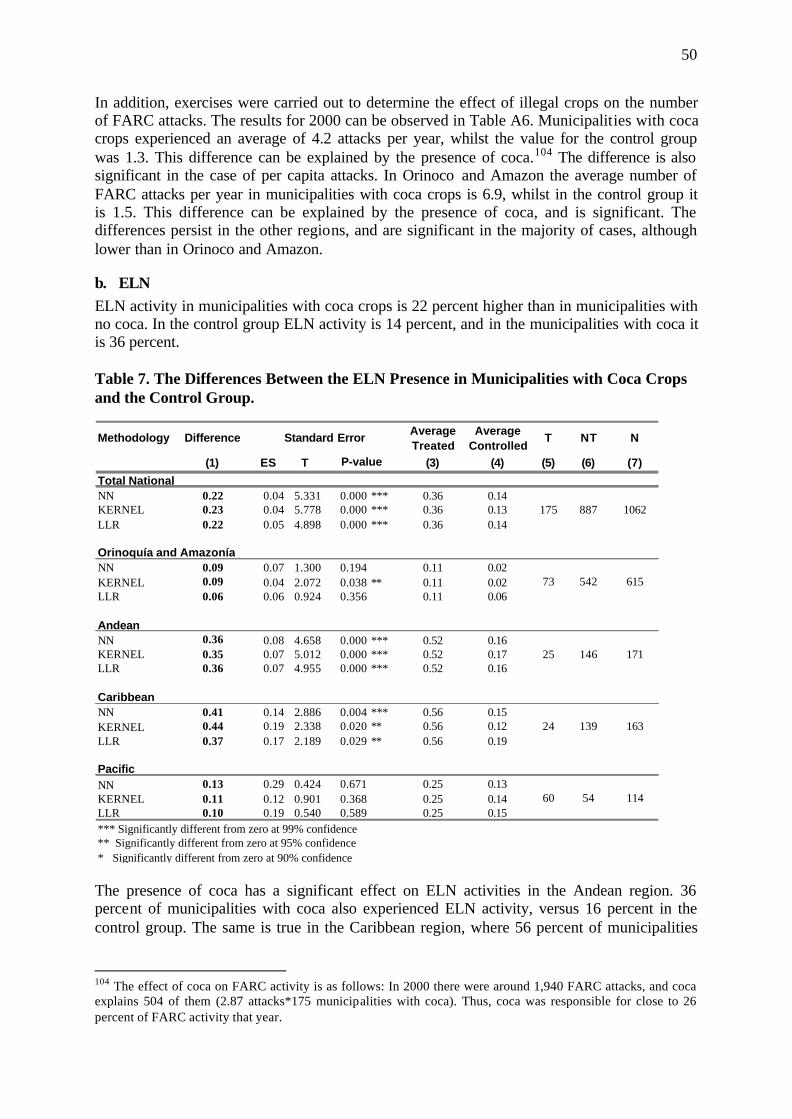
50
In addition, exercises were carried out to determine the effect of illegal crops on the number of FARC attacks. The results for 2000 can be observed in Table A6. Municipalities with coca crops experienced an average of 4.2 attacks per year, whilst the value for the control group was 1.3. This difference can be explained by the presence of coca.104 The difference is also significant in the case of per capita attacks. In Orinoco and Amazon the average number of FARC attacks per year in municipalities with coca crops is 6.9, whilst in the control group it is 1.5. This difference can be explained by the presence of coca, and is significant. The differences persist in the other regions, and are significant in the majority of cases, although lower than in Orinoco and Amazon.
b. ELN ELN activity in municipalities with coca crops is 22 percent higher than in municipalities with no coca. In the control group ELN activity is 14 percent, and in the municipalities with coca it is 36 percent. Table 7. The Differences Between the ELN Presence in Municipalities with Coca Crops and the Control Group.
Methodology Difference Average Treated
Average Controlled
T NT N
(1) ES T (3) (4) (5) (6) (7)
Total NationalNN 0.22 0.04 5.331 0.000 *** 0.36 0.14KERNEL 0.23 0.04 5.778 0.000 *** 0.36 0.13LLR 0.22 0.05 4.898 0.000 *** 0.36 0.14
Orinoquía and AmazoníaNN 0.09 0.07 1.300 0.194 0.11 0.02KERNEL 0.09 0.04 2.072 0.038 ** 0.11 0.02LLR 0.06 0.06 0.924 0.356 0.11 0.06
Andean NN 0.36 0.08 4.658 0.000 *** 0.52 0.16KERNEL 0.35 0.07 5.012 0.000 *** 0.52 0.17LLR 0.36 0.07 4.955 0.000 *** 0.52 0.16
Caribbean NN 0.41 0.14 2.886 0.004 *** 0.56 0.15KERNEL 0.44 0.19 2.338 0.020 ** 0.56 0.12LLR 0.37 0.17 2.189 0.029 ** 0.56 0.19
PacificNN 0.13 0.29 0.424 0.671 0.25 0.13KERNEL 0.11 0.12 0.901 0.368 0.25 0.14LLR 0.10 0.19 0.540 0.589 0.25 0.15*** Significantly different from zero at 99% confidence** Significantly different from zero at 95% confidence* Significantly different from zero at 90% confidence
P-value
24 139
73 542
163
60 54 114
615
25 146 171
Standard Error
175 887 1062
The presence of coca has a significant effect on ELN activities in the Andean region. 36 percent of municipalities with coca also experienced ELN activity, versus 16 percent in the control group. The same is true in the Caribbean region, where 56 percent of municipalities
104 The effect of coca on FARC activity is as follows: In 2000 there were around 1,940 FARC attacks, and coca explains 504 of them (2.87 attacks*175 municipalities with coca). Thus, coca was responsible for close to 26 percent of FARC activity that year.
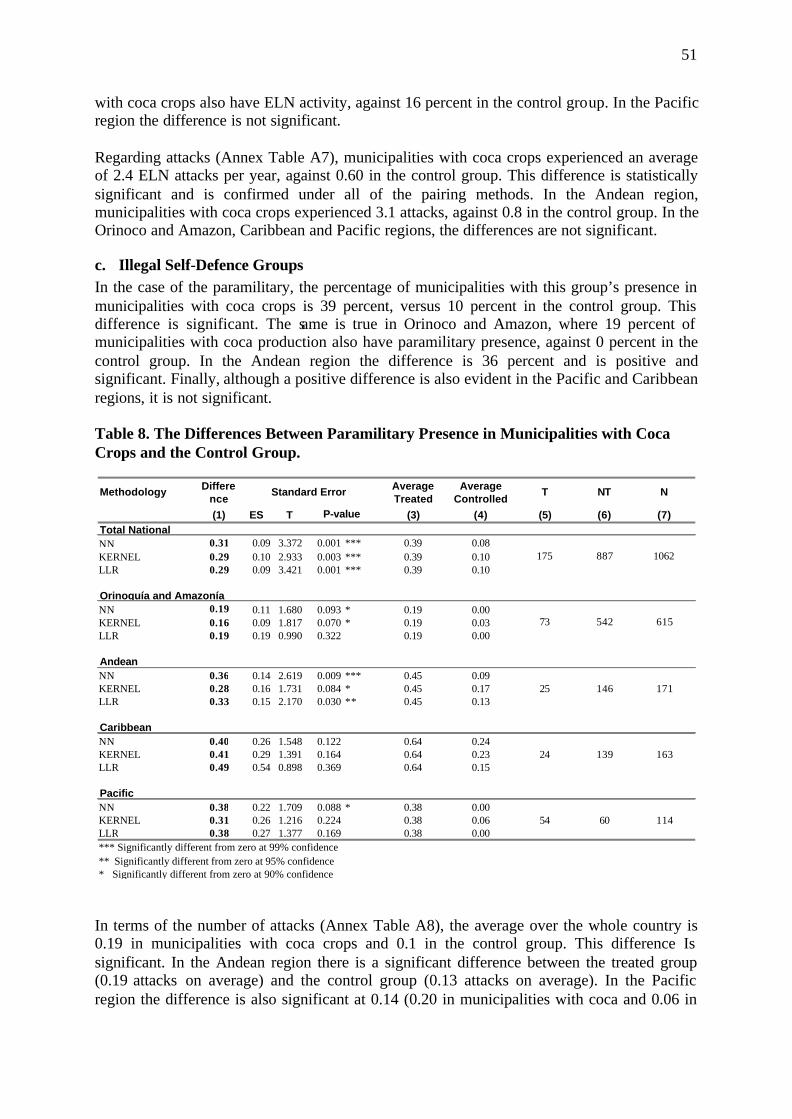
51
with coca crops also have ELN activity, against 16 percent in the control group. In the Pacific region the difference is not significant. Regarding attacks (Annex Table A7), municipalities with coca crops experienced an average of 2.4 ELN attacks per year, against 0.60 in the control group. This difference is statistically significant and is confirmed under all of the pairing methods. In the Andean region, municipalities with coca crops experienced 3.1 attacks, against 0.8 in the control group. In the Orinoco and Amazon, Caribbean and Pacific regions, the differences are not significant.
c. Illegal Self-Defence Groups In the case of the paramilitary, the percentage of municipalities with this group’s presence in municipalities with coca crops is 39 percent, versus 10 percent in the control group. This difference is significant. The same is true in Orinoco and Amazon, where 19 percent of municipalities with coca production also have paramilitary presence, against 0 percent in the control group. In the Andean region the difference is 36 percent and is positive and significant. Finally, although a positive difference is also evident in the Pacific and Caribbean regions, it is not significant. Table 8. The Differences Between Paramilitary Presence in Municipalities with Coca Crops and the Control Group.
Methodology Difference
Average Treated
Average Controlled
T NT N
(1) ES T (3) (4) (5) (6) (7)Total NationalNN 0.31 0.09 3.372 0.001 *** 0.39 0.08KERNEL 0.29 0.10 2.933 0.003 *** 0.39 0.10LLR 0.29 0.09 3.421 0.001 *** 0.39 0.10
Orinoquía and AmazoníaNN 0.19 0.11 1.680 0.093 * 0.19 0.00KERNEL 0.16 0.09 1.817 0.070 * 0.19 0.03LLR 0.19 0.19 0.990 0.322 0.19 0.00
Andean NN 0.36 0.14 2.619 0.009 *** 0.45 0.09KERNEL 0.28 0.16 1.731 0.084 * 0.45 0.17LLR 0.33 0.15 2.170 0.030 ** 0.45 0.13
Caribbean NN 0.40 0.26 1.548 0.122 0.64 0.24KERNEL 0.41 0.29 1.391 0.164 0.64 0.23LLR 0.49 0.54 0.898 0.369 0.64 0.15
PacificNN 0.38 0.22 1.709 0.088 * 0.38 0.00KERNEL 0.31 0.26 1.216 0.224 0.38 0.06LLR 0.38 0.27 1.377 0.169 0.38 0.00*** Significantly different from zero at 99% confidence** Significantly different from zero at 95% confidence* Significantly different from zero at 90% confidence
Standard Error
175
73
25
P-value
146 171
139 163
887 1062
542 615
60 114
24
54
In terms of the number of attacks (Annex Table A8), the average over the whole country is 0.19 in municipalities with coca crops and 0.1 in the control group. This difference Is significant. In the Andean region there is a significant difference between the treated group (0.19 attacks on average) and the control group (0.13 attacks on average). In the Pacific region the difference is also significant at 0.14 (0.20 in municipalities with coca and 0.06 in
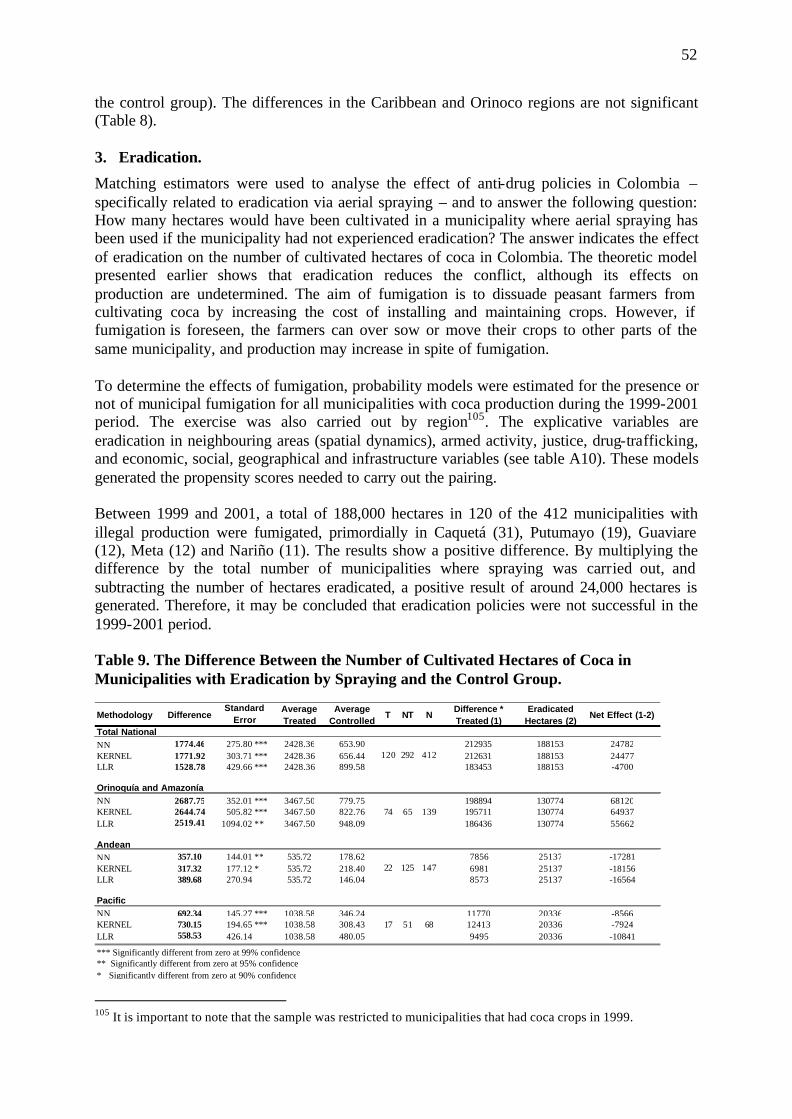
52
the control group). The differences in the Caribbean and Orinoco regions are not significant (Table 8). 3. Eradication.
Matching estimators were used to analyse the effect of anti-drug policies in Colombia – specifically related to eradication via aerial spraying – and to answer the following question: How many hectares would have been cultivated in a municipality where aerial spraying has been used if the municipality had not experienced eradication? The answer indicates the effect of eradication on the number of cultivated hectares of coca in Colombia. The theoretic model presented earlier shows that eradication reduces the conflict, although its effects on production are undetermined. The aim of fumigation is to dissuade peasant farmers from cultivating coca by increasing the cost of installing and maintaining crops. However, if fumigation is foreseen, the farmers can over sow or move their crops to other parts of the same municipality, and production may increase in spite of fumigation. To determine the effects of fumigation, probability models were estimated for the presence or not of municipal fumigation for all municipalities with coca production during the 1999-2001 period. The exercise was also carried out by region105. The explicative variables are eradication in neighbouring areas (spatial dynamics), armed activity, justice, drug-trafficking, and economic, social, geographical and infrastructure variables (see table A10). These models generated the propensity scores needed to carry out the pairing. Between 1999 and 2001, a total of 188,000 hectares in 120 of the 412 municipalities with illegal production were fumigated, primordially in Caquetá (31), Putumayo (19), Guaviare (12), Meta (12) and Nariño (11). The results show a positive difference. By multiplying the difference by the total number of municipalities where spraying was carried out, and subtracting the number of hectares eradicated, a positive result of around 24,000 hectares is generated. Therefore, it may be concluded that eradication policies were not successful in the 1999-2001 period. Table 9. The Difference Between the Number of Cultivated Hectares of Coca in Municipalities with Eradication by Spraying and the Control Group.
Methodology DifferenceAverage Treated
Average Controlled
T NT NDifference * Treated (1)
Eradicated Hectares (2)
Net Effect (1-2)
Total NationalNN 1774.46 275.80 *** 2428.36 653.90 212935 188153 24782KERNEL 1771.92 303.71 *** 2428.36 656.44 212631 188153 24477LLR 1528.78 429.66 *** 2428.36 899.58 183453 188153 -4700
Orinoquía and AmazoníaNN 2687.75 352.01 *** 3467.50 779.75 198894 130774 68120KERNEL 2644.74 505.82 *** 3467.50 822.76 195711 130774 64937LLR 2519.41 1094.02 ** 3467.50 948.09 186436 130774 55662
AndeanNN 357.10 144.01 ** 535.72 178.62 7856 25137 -17281KERNEL 317.32 177.12 * 535.72 218.40 6981 25137 -18156LLR 389.68 270.94 535.72 146.04 8573 25137 -16564
PacificNN 692.34 145.27 *** 1038.58 346.24 11770 20336 -8566KERNEL 730.15 194.65 *** 1038.58 308.43 12413 20336 -7924LLR 558.53 426.14 1038.58 480.05 9495 20336 -10841
*** Significantly different from zero at 99% confidence** Significantly different from zero at 95% confidence* Significantly different from zero at 90% confidence
Standard Error
120 292 412
17 51 68
74 65 139
22 125 147
105 It is important to note that the sample was restricted to municipalities that had coca crops in 1999.
53
However, looking at the results by region it can be observed that this lack of success was due to Orinoco and Amazon, which was the region with the highest level of coca production. In fact, the results show that fumigation in this region lead to an increase of more than 60,000 hectares. Conversely, in the Andean and Pacific regions, although the differences are positive, the net effect on cultivated hectares is negative, and thus eradication by fumigation was successful in these regions (see Table 9). Conclusions
Over the last two decades, Colombia has experienced sustained growth in coca production. From the mid-1980s, this tendency sharpened following a re-composition of cultivated hectares in the Andean region. Colombia thus became the region’s largest producer of coca leaf, ahead of the two biggest coca producers in the world (Peru and Bolivia). Colombia’s rising participation in the world drug market was accompanied by the strengthening of drug-trafficking and the consolidation of the industry – initially by the Medellin, Cali and Costa cartels. However, the cartels were weakened during the 1990s and control of illicit drug production passed into the hands of illegal armed groups; this became one of their main sources of financing and allowed them to scale up their armed activities and increase their troop numbers towards the end of the decade. The analysis of spatial patterns, such as the diffusion of coca production amongst Colombian municipalities and illegal armed activity, shows the existence of a strong spatial relationship between coca production, illegal armed activity and illegal productive activity, both at the local level and in groups of neighbouring municipalities, that is preceded by the activities of the illegal armed groups. In addition, to ascertain the relationship of cause and effect between coca crops and the Colombian armed conflict, a non-parametric methodology known as matching estimators was used. This allowed us to establish the effect of illegal armed activity on coca production, and vice versa, by comparing municipalities with the same characteristics. The results show that the presence of illicit crops is closely linked to the presence of armed activity, as much in the case of the guerrillas as in that of the paramilitary. This definitively shows that one of the driving factors behind the expansion of the coca economy is the Colombian armed conflict. Around 70 percent of coca crops in 2000 were the result of the armed conflict. This shows that coca expansion is, in fact, the result of financial needs that increase pari passu with the spatial scaling up and expansion of the conflict, rather than the other way around. These results are true both at a national and regional level. However, the conclusions are different depending on the armed group. FARC activity is closely linked to the greater part of national and regional coca production, especially in the east of the country. However, although the effect of ELN and paramilitary activity on coca production is positive, it is not significant throughout Colombia. A regional analysis shows that the activity of these groups does lead to higher production of illicit crops. In the case of the ELN, the positive effect is in the Andean region. Paramilitary presence increases production in the Andean, Caribbean and Pacific regions. These are areas in which the illegal armed groups’ activities and territorial control have expanded, and are also strategic points in the armed conflict. When determining if there was double causality between coca production and armed guerrilla activity, we found that coca explains part of the armed groups’ activities. Municipalities with coca crops have the highest presence of illegal armed groups and the highest number of attacks. However, coca only explains between 20 percent and 25 percent of FARC activity,
54
and even less for the other groups, although there are regional differences. This implies that illicit crops only make up part of the ‘gasoline’ of the conflict. These results confirm some of the hypotheses related to the economic theory of conflict, which argue that it is of no importance whether rebels are motivated by greed, a desire for power or discontent;106 what is important, however, is that rebellion be financially viable via illegal activities or depredation. Coca expansion in Colombia is the result of the conflict, in as much as it has made it financially viable. However, in contrast to natural resources or raw materials, where supply is fixed, coca supply depends on the strategic and territorial objectives of the armed groups, the scaling up of the conflict and State policies related to controlling production. In addition, the investigation showed that the strategy of financing the conflict with the proceeds of drug production can be explained by the armed groups’ territorial and strategic objectives. This implies that the economic theory of conflict should be complemented by studies that analyse the dynamics of internal conflicts or civil wars, at a national or regional level, to better understand the financial strategies, economic motivations and objectives of irregular forces. Therefore, the results of the paper are very much in line with the DiJohn’s argument, which states that origin and dynamics of civil conflict depend upon the political or strategic aims of the confronting groups.107 What a particular natural resources does (coca) is to facilitate the prolongation and intensification of the conflict. The war on illicit crops has used a three pronged approach: manual eradication, crop substitution and eradication via chemical spraying (the most used method being aerial spraying, which has intensified in the south of the country since the mid-1990s). To analyse the efficiency of this policy, the same methodology was used as that used to study the effect of armed actors on coca production. We found that rather than reducing coca cultivation, the fumigation policies that were carried out between 1999 and 2001 caused it to rise, especially in the Orinoco and Amazon region. The opposite was true in the Pacific and Andean regions.
106 Collier (2000). 107 DiJohn (2002).
55
References
Betancourt, Darío and García, Martha L., Contrabandistas, marimberos y mafiosos: historia social de la mafia colombiana (1965 – 1992), Bogotá: Tercer Mundo, 1994
Bannon, Ian and Collier, Paul, ‘Natural Resources and Conflict: What We Can do’, in Ian Bannon and Paul Collier (eds), Natural Resources and Violent Conflict, Washington, D.C.: The World Bank, 2003
Bottía, Martha, ‘La presencia y expansión municipal de las FARC: Es avaricia y contagio, más que ausencia estatal’, Documento CEDE, 2003-03, Bogotá: CEDE, 2003
Cohen, Jacqueline and Tita, George, ‘Difussion in Homicide Exploring a General Method for Detecting Spatial Diffusion Processes’, Journal of Quantitative Criminology, 15:4 (1999), pp.451-494
Colombian National Police Force, Antinarcotics Division, at http://www.policia.gov.co/inicio/portal/unidades/diran.nsf/paginas/principal
Collier, Paul, ‘Economic Causes of Civil Conflicts and their Implications for Policy’, World Bank Working Paper (June 2000)
Collier, Paul and Hoeffler, Anne, ‘On Economic Causes of Civil War’, Oxford Economic Papers 50 (1998), pp.563-573
Collier, Paul and Hoeffler, Anne, ‘Greed and Grievance in Civil War’, World Bank Working Paper, CSAE WPS/2002-01 (2001)
De Rementería, Ibán, La guerra de las drogas: Cultivos ilícitos y desarrollo alternativo, Bogotá: Editorial Planeta Colombiana SA, 2001
DiJohn, Jonathan, ‘Mineral Resource Abundance and Violent Political Conflict: A Critical Assesment of the Rentier State Hypothesis’, Crisis State Working Paper, 20, London: London School of Economics, 2002
Dirección Nacional de Estupefacientes (DNE), La Lucha de Colombia contra las Drogas Ilícitas: Acciones y Resultados 2001, Bogotá: Ministerio de Justicia y Derecho, 2001
Echandía, Camilo, El conflicto Armado y las Manifestaciones de Violencia en las Regiones de Colombia, Bogotá: Presidencia de la República de Colombia Oficina del Alto Comisionado para la Paz Observatorio de Violencia, 1999
Gaviria, Alejandro, ‘Rendimientos Crecientes y la Evolución del Crimen Violento: el Caso Colombiano’, in Economía, Crimen y Conflicto, Bogotá, Universidad Nacional de Colombia, 2001
Gonzáles, José E., Perú: Sendero Luminoso en el Valle de la Coca en Coca, Cocaína y Narcotráfico, in Diego García Sayán, Coca, Cocaina y Narcotráfico: Laberinto en los Andes, Lima: Comisión Andina de Juristas, 1989
González, Fernán; Bolívar, Ingrid and Vázquez, Teófilo, Violencia Política en Colombia. De la nación fragmentada a la construcción del Estado, Bogotá: CINEP, 2002
Grossman, Herschel, ‘A General Equilibrium Model of Insurrections’, American Economic Review, 81:4 (1991), pp.912-921
Grossman, Herschel, ‘Kleptocracy and Revolutions’, Oxford Economic Paper, 51 (1994), pp 267-283
56
Gutiérrez, Francisco, ‘Criminal Rebels? A Discussion on War and Criminality from the Colombian Experience’, Crisis States Working Paper, 17, London: London School of Economics, 2003
Heckman, James, ‘Sample Selection Bias as a Specification Error (With an application to the Estimation of Labor Supply Functions)’, NBER Working Paper, w1072, Cambridge, Mass.: National Bureau of Economic Research, 1977
Heckman, James; Ichmura, Hidehiko; Smith, Jeffrey and Todd, Petra, ‘Characterizing Selection Bias Using Experimental Data’, Econometrica, 66:5 (1998), pp.1017-1098
Hirshleifer, Jack, ‘The Technology of Conflict as an Economic Activity’, UCLA Working Paper 491, Los Angeles: UCLA, 1990
La Rotta, Jesús E., Las finanzas de la Subversión Colombiana: una forma de explotar la nación, Bogotá: Alianza Editorial Colombiana, 1996
McClintock, Cynthya, ‘The war on Drugs: the Peruvian Case’, Journal of Interamerican Studies and World Affairs, 30 (1998)
Ministerio de Defensa Nacional, ‘Los Grupos Ilegales de Autodefensa en Colombia’, Documento de Estudio, Bogotá: Ministerio de Defensa Nacional, 2000, at www.mindefensa.gov.co
Molano, Alfredo, Selva adentro: Una historia oral de la colonización del Guaviare, Bogotá: El Ancora Editores, 1987
Mora, Leonidas; Jaramillo, Jaime and Cubides, Fernando, Colonización Coca y Guerilla, Bogotá: Alianza Editores Colombiana, 1986
Moreno, Rosina and Vayá, Esther, Técnicas econométricas para el tratamiento de datos espaciales: La econometría espacial, Barcelona: Edicions de la Universitat de Barcelona, 2000
National Drugs Department, at http://www.dne.gov.co/
Obando, Enrique, ‘El narcotráfico en el Perú: una aproximación histórica’, Análisis Internacional, 2 (April-June 1993)
Ramírez, María Constanza, ‘l Cultivo de Amapola en Colombia’, in Consulta Técnica Internacional sobre el Cultivo Ilícito de Amapola en Latinoamérica, Bogotá: Ministerio de Justicia, UNDCP, 1993
Ramírez, María Clemencia, Entre el Estado y la guerrilla: Identidad y ciudadanía en el movimiento de los camerinos cocaleros del Putumayo, Bogotá: Instituto Colombiano de Antropología e Historia, 2001
Rangel, Alfredo, Colombia: Guerra en el fin de siglo, Bogotá: Editorial Tercer Mundo, 2000
Rangel, Alfredo, Guerra Insurgente: conflicto es Malasia, Perú, Filipina, El Salvador y Colombia, Bogota: Editorial Intermedio, 2001
Restrepo, Jorge Alberto, ‘Análisis económico de conflictos internos’, Documento prepared for Fundación Ideas para la Paz, 2001
Reyes, Alejandro, ‘Compra de tierras por narcotraficantes’, in Drogas ilícitas en Colombia: Su impacto económico, político y social, Bogotá: Planeta Colombia Editorial, 1997
Rocha, Ricardo, ‘Aspectos económicos de las drogas ilegales’, in Drogas ilícitas en Colombia: Su impacto económico, político y social, Bogotá: Planeta Colombia Editorial, 1997
57
Rocha, Ricardo, La economía colombiana tras 25 años de narcotráfico, Bogotá: Siglo del Hombre Editores, 2000
Rocha, Ricardo and Vivas, Alejandro, ‘Crecimiento regional en Colombia: ¿Persiste la desigualdad?’, Revista de economía del Rosario, 1:1 (January 1998), pp.67-108
Rojas, Fernando, La Economía de la Coca, La Paz: Instituto de Investigación Socio-Económicas, Universidad Católica Boliviana, 2002
Ruiz, Hernando, ‘Implicaciones sociales y económicas de la producción de marihuana’, in Marihuana: legalización o represión, Bogotá: ANIF, 1979
Salazar, Boris and Castillo, María del Pilar, La Hora de los Dinosaurios: conflicto y depredación en Colombia, Bogotá: Fondo Editorial CEREC, 2001
Sánchez, Fabio; Díaz, Ana María and Formisano, Michel, ‘Conflicto, violencia y actividad criminal en Colombia: un análisis espacial’, Documentos CEDE 2003-05, Bogotá: CEDE, 2003
Sánchez, Fabio and Nuñez, Jairo, ‘Lageografía y el desarrollo económico en Colombia: una aproximación municipal’, Desarrollo y Sociedad 46 (1999)
Sánchez, Fabio and Nuñez, Jairo, ‘Determinantes del Crimen Violento en un país altamente violento: el caso de Colombia’, in Economía, Crimen y Conflicto, Bogotá: Universidad Nacional de Colombia, 2000
Steiner, Roberto, ‘Los Dólares del Narcotráfico’, Cuadernos de Fedesarrollo, 2, Bogotá: Editorial Tercer Mundo, 1997
Thoumi, Francisco E., Economía política y narcotráfico, Bogotá: Tercer Mundo, 1994
Thoumi, Francisco E., El Imperio de la Droga: Narcotráfico, economía y sociedad en Los Andes, Bogotá, Editorial Planeta Colombiana, 2002
Tovar, Hermes, Colombia: droga, economía, guerra y paz, Bogotá: Planeta Colombiana Editorial, 1999
Todd, Petra, A Practical Guide to Implementing Matching Estimators, mimeo, 1999
Trujillo, Edgar and Badel, Martha, ‘Los costos económicos de la criminalidad y la violencia en Colombia: 1991-1996’, Archivos Macroeconomía, DNP (March 1998)
Uprimmy, Rodrigo, ‘Narcotráfico, régimen político, violencia y derechos humanos en Colombia’, in Ricardo Vargas (ed.), Drogas, poder y región, Bogotá: CINEP, 1995
Uribe, Sergio, ‘Los cultivos ilícitos en Colombia’, in Drogas ilícitas en Colombia: Su impacto económico, político y social, Bogotá: Planeta Colombia Editorial, 1997
US State Department, at http://www.state.gov/documents/organization/18169.pdf
Vargas, Ricardo, ‘La bonanza de la marimba empezó aquí’, in La Verdad del ’93: paz, derechos humanos y violencia, Bogotá: CINEP, 1994
Vargas, Ricardo, Drogas, mascaras y juegos, Bogotá: Editorial Tercer Mundo, 1999a
Vargas, Ricardo, Fumigación y conflicto: Políticas antidrogas y deslegitimación del Estado en Colombia, Bogotá: Editorial Tercer Mundo, 1999b
Vargas, Ricardo, Drogas, Conflicto Armado y Desarrollo Alternativo, Bogotá: Gente Nueva Editorial, 2003
58
Vicepresidencia de la República de Colombia, Colombia, Conflicto Armado, Regiones, Derechos Humanos, DIH 1998-2002, Bogotá: República de Cuba, 2002
Waltes, John, ‘El 60 percent de la heroina que se consume en Estados Unidos proviene de Colombia’, El Tiempo (13 May 2003)
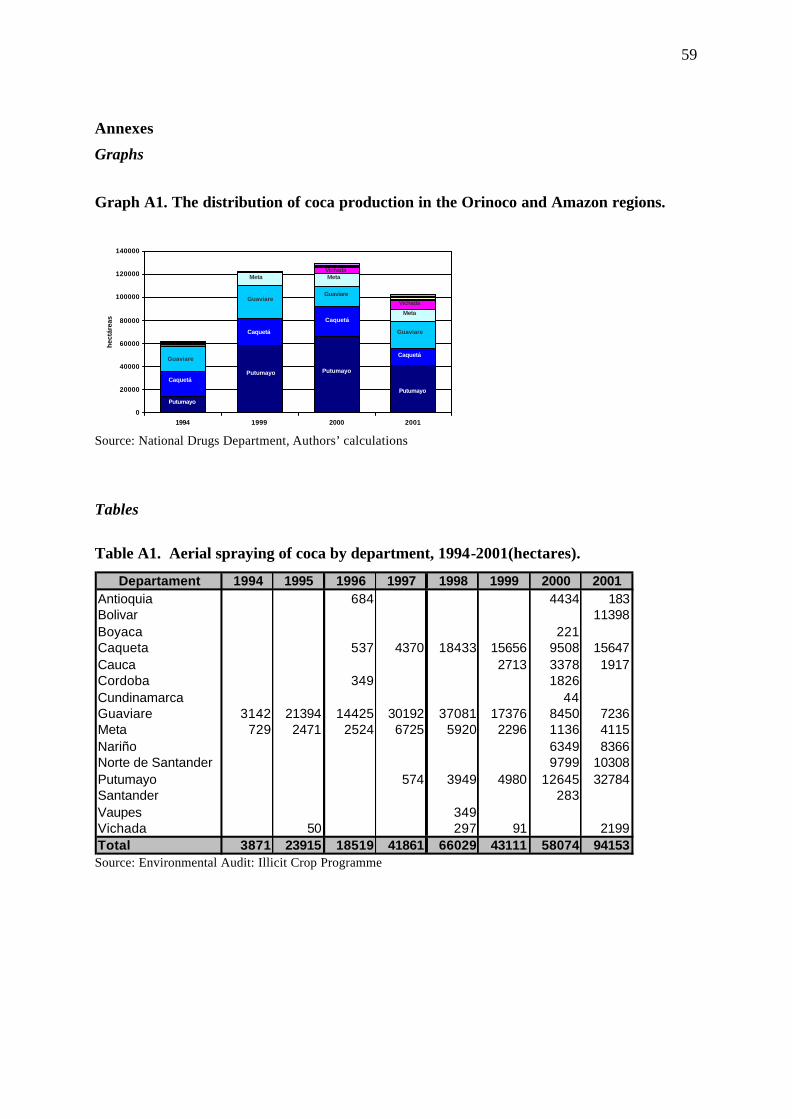
59
Annexes
Graphs
Graph A1. The distribution of coca production in the Orinoco and Amazon regions.
0
20000
40000
60000
80000
100000
120000
140000
1994 1999 2000 2001
hec
táre
as
Putumayo
Putumayo
Putumayo
Putumayo
Caquetá
Caquetá
Caquetá
Caquetá
Meta Meta
Meta
Guaviare
GuaviareGuaviare
Guaviare
Vichada
Vichada
Source: National Drugs Department, Authors’ calculations
Tables
Table A1. Aerial spraying of coca by department, 1994-2001(hectares).
Departament 1994 1995 1996 1997 1998 1999 2000 2001Antioquia 684 4434 183Bolivar 11398Boyaca 221Caqueta 537 4370 18433 15656 9508 15647Cauca 2713 3378 1917Cordoba 349 1826Cundinamarca 44Guaviare 3142 21394 14425 30192 37081 17376 8450 7236Meta 729 2471 2524 6725 5920 2296 1136 4115Nariño 6349 8366Norte de Santander 9799 10308Putumayo 574 3949 4980 12645 32784Santander 283Vaupes 349Vichada 50 297 91 2199Total 3871 23915 18519 41861 66029 43111 58074 94153 Source: Environmental Audit: Illicit Crop Programme
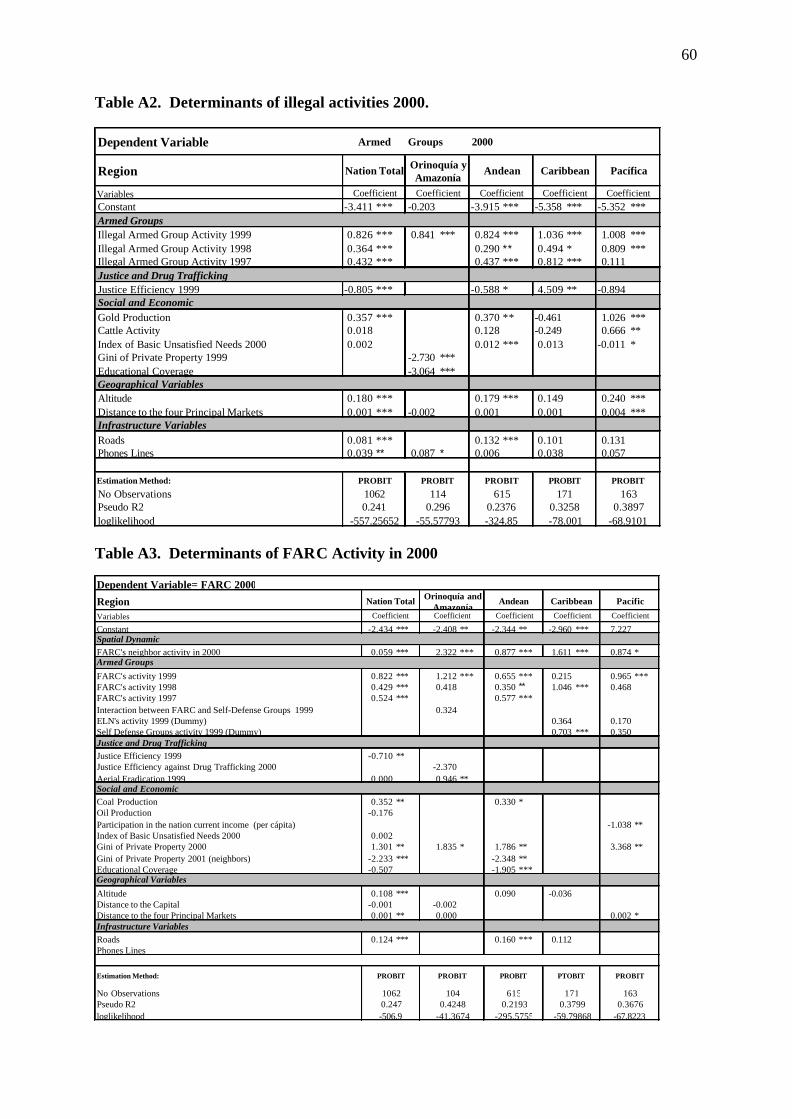
60
Table A2. Determinants of illegal activities 2000.
Dependent Variable
Region
VariablesConstant -3.411 *** -0.203 -3.915 *** -5.358 *** -5.352 ***Armed Groups Illegal Armed Group Activity 1999 0.826 *** 0.841 *** 0.824 *** 1.036 *** 1.008 ***Illegal Armed Group Activity 1998 0.364 *** 0.290 ** 0.494 * 0.809 ***Illegal Armed Group Activity 1997 0.432 *** 0.437 *** 0.812 *** 0.111Justice and Drug Trafficking Justice Efficiency 1999 -0.805 *** -0.588 * 4.509 ** -0.894Social and EconomicGold Production 0.357 *** 0.370 ** -0.461 1.026 ***Cattle Activity 0.018 0.128 -0.249 0.666 **Index of Basic Unsatisfied Needs 2000 0.002 0.012 *** 0.013 -0.011 *Gini of Private Property 1999 -2.730 ***Educational Coverage -3.064 ***Geographical VariablesAltitude 0.180 *** 0.179 *** 0.149 0.240 ***Distance to the four Principal Markets 0.001 *** -0.002 0.001 0.001 0.004 ***Infrastructure VariablesRoads 0.081 *** 0.132 *** 0.101 0.131Phones Lines 0.039 ** 0.087 * 0.006 0.038 0.057
Estimation Method:
No ObservationsPseudo R2loglikelihood
Nation Total Orinoquía y Amazonía
Andean Caribbean Pacífica
Armed Groups 2000
Coefficient
PROBIT PROBIT PROBIT PROBIT PROBIT
Coefficient Coefficient Coefficient Coefficient
0.32581062 114 615 171
0.3897163
0.241-557.25652 -55.57793 -324.85 -78.001 -68.9101
0.296 0.2376
Table A3. Determinants of FARC Activity in 2000
Dependent Variable= FARC 2000
RegionVariables
Constant -2.434 *** -2.408 ** -2.344 ** -2.960 *** 7.227Spatial Dynamic FARC's neighbor activity in 2000 0.059 *** 2.322 *** 0.877 *** 1.611 *** 0.874 *Armed Groups
FARC's activity 1999 0.822 *** 1.212 *** 0.655 *** 0.215 0.965 ***FARC's activity 1998 0.429 *** 0.418 0.350 ** 1.046 *** 0.468FARC's activity 1997 0.524 *** 0.577 ***Interaction between FARC and Self-Defense Groups 1999 0.324ELN's activity 1999 (Dummy) 0.364 0.170Self Defense Groups activity 1999 (Dummy) 0.703 *** 0.350Justice and Drug Trafficking Justice Efficiency 1999 -0.710 **Justice Efficiency against Drug Trafficking 2000 -2.370Aerial Eradication 1999 0.000 0.946 **Social and EconomicCoal Production 0.352 ** 0.330 *Oil Production -0.176Participation in the nation current income (per cápita) -1.038 **Index of Basic Unsatisfied Needs 2000 0.002Gini of Private Property 2000 1.301 ** 1.835 * 1.786 ** 3.368 **Gini of Private Property 2001 (neighbors) -2.233 *** -2.348 **Educational Coverage -0.507 -1.905 ***Geographical Variables
Altitude 0.108 *** 0.090 -0.036Distance to the Capital -0.001 -0.002Distance to the four Principal Markets 0.001 ** 0.000 0.002 *Infrastructure VariablesRoads 0.124 *** 0.160 *** 0.112Phones Lines
Estimation Method:
No ObservationsPseudo R2loglikelihood
PROBIT PROBIT
1062
-506.9 -41.3674
1040.247 0.4248
Coefficient Coefficient
Nation Total Orinoquía and Amazonía
Andean Caribbean
-67.8223
615 171
-295.5755 -59.79868
1630.2193 0.3799 0.3676
Pacífic
Coefficient
PROBIT
Coefficient Coefficient
PROBIT PTOBIT
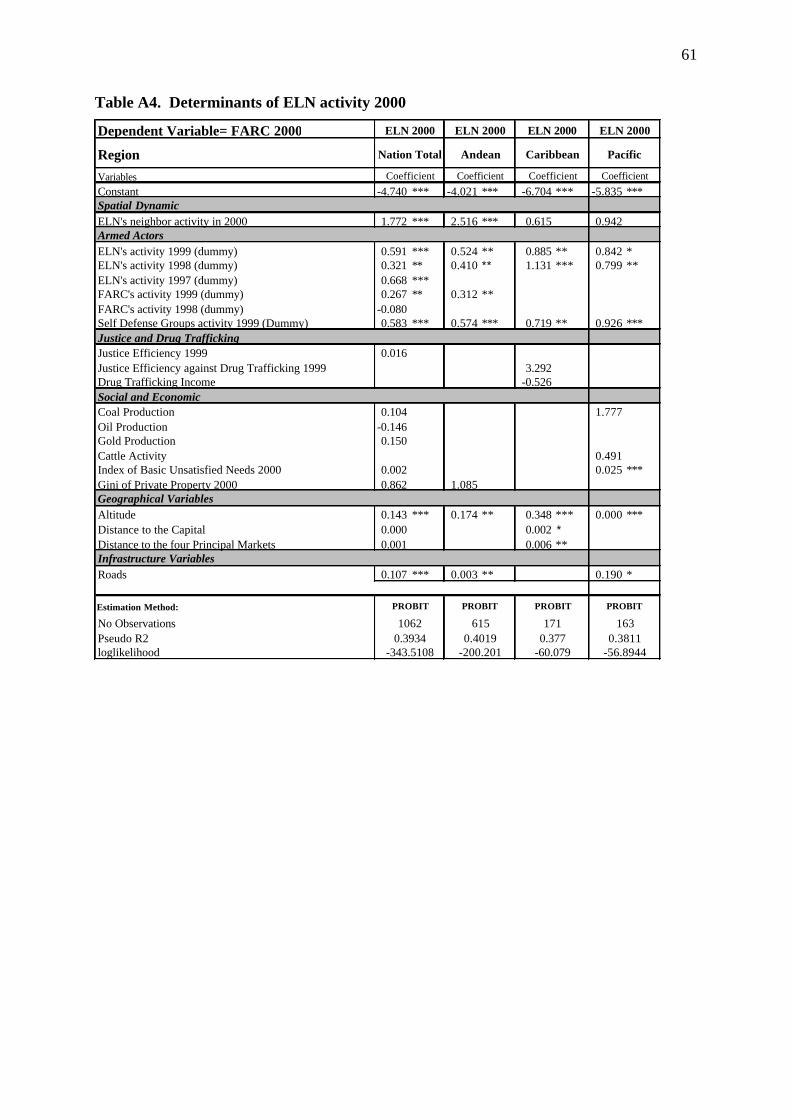
61
Table A4. Determinants of ELN activity 2000
Dependent Variable= FARC 2000
RegionVariablesConstant -4.740 *** -4.021 *** -6.704 *** -5.835 ***Spatial Dynamic ELN's neighbor activity in 2000 1.772 *** 2.516 *** 0.615 0.942Armed ActorsELN's activity 1999 (dummy) 0.591 *** 0.524 ** 0.885 ** 0.842 *ELN's activity 1998 (dummy) 0.321 ** 0.410 ** 1.131 *** 0.799 **ELN's activity 1997 (dummy) 0.668 ***FARC's activity 1999 (dummy) 0.267 ** 0.312 **FARC's activity 1998 (dummy) -0.080Self Defense Groups activity 1999 (Dummy) 0.583 *** 0.574 *** 0.719 ** 0.926 ***Justice and Drug Trafficking Justice Efficiency 1999 0.016Justice Efficiency against Drug Trafficking 1999 3.292Drug Trafficking Income -0.526Social and EconomicCoal Production 0.104 1.777Oil Production -0.146Gold Production 0.150Cattle Activity 0.491Index of Basic Unsatisfied Needs 2000 0.002 0.025 ***Gini of Private Property 2000 0.862 1.085Geographical VariablesAltitude 0.143 *** 0.174 ** 0.348 *** 0.000 ***Distance to the Capital 0.000 0.002 *Distance to the four Principal Markets 0.001 0.006 **Infrastructure VariablesRoads 0.107 *** 0.003 ** 0.190 *
Estimation Method:
No ObservationsPseudo R2loglikelihood
ELN 2000
Nation Total Andean Caribbean Pacífic
ELN 2000 ELN 2000 ELN 2000
615 171
Coefficient
PROBIT PROBIT PROBIT PROBIT
Coefficient Coefficient Coefficient
1630.3934
-343.5108 -200.201 -60.079 -56.89440.4019 0.377 0.3811
1062
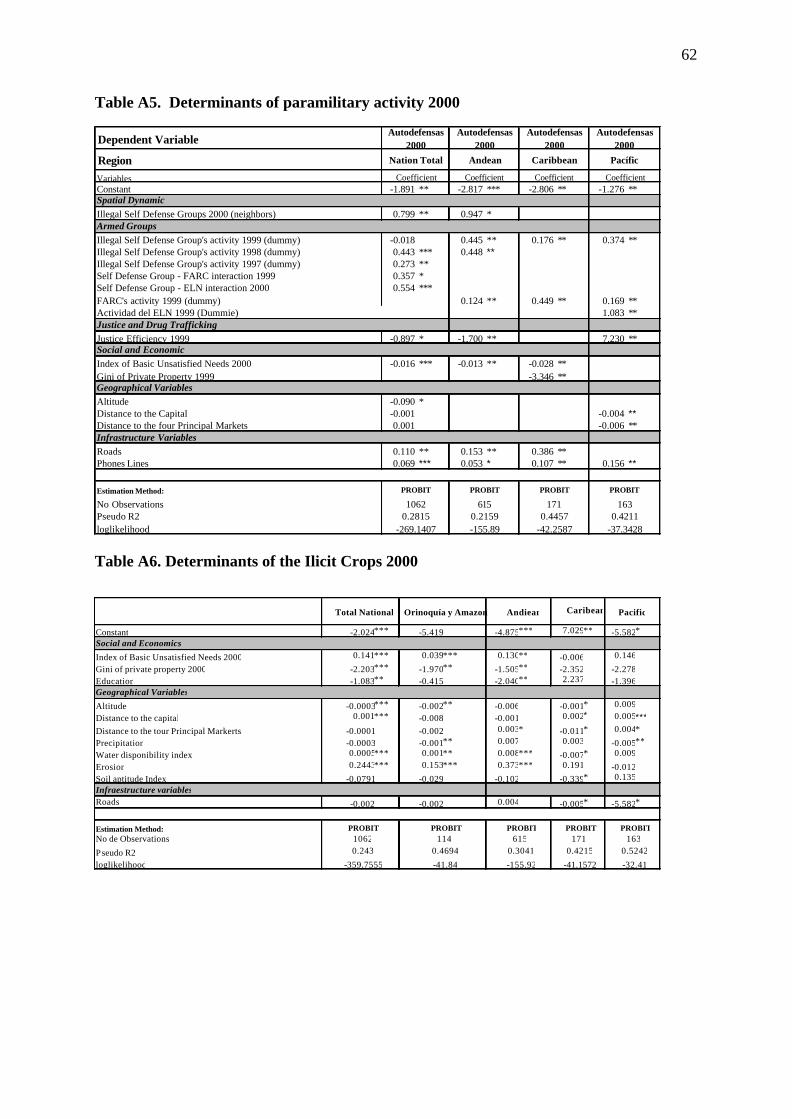
62
Table A5. Determinants of paramilitary activity 2000
Dependent Variable
RegionVariablesConstant -1.891 ** -2.817 *** -2.806 ** -1.276 **Spatial Dynamic Illegal Self Defense Groups 2000 (neighbors) 0.799 ** 0.947 *Armed Groups Illegal Self Defense Group's activity 1999 (dummy) -0.018 0.445 ** 0.176 ** 0.374 **Illegal Self Defense Group's activity 1998 (dummy) 0.443 *** 0.448 **Illegal Self Defense Group's activity 1997 (dummy) 0.273 **Self Defense Group - FARC interaction 1999 0.357 *Self Defense Group - ELN interaction 2000 0.554 ***FARC's activity 1999 (dummy) 0.124 ** 0.449 ** 0.169 **Actividad del ELN 1999 (Dummie) 1.083 **Justice and Drug Trafficking Justice Efficiency 1999 -0.897 * -1.700 ** 7.230 **Social and EconomicIndex of Basic Unsatisfied Needs 2000 -0.016 *** -0.013 ** -0.028 **Gini of Private Property 1999 -3.346 **Geographical VariablesAltitude -0.090 *Distance to the Capital -0.001 -0.004 **Distance to the four Principal Markets 0.001 -0.006 **Infrastructure VariablesRoads 0.110 ** 0.153 ** 0.386 **Phones Lines 0.069 *** 0.053 * 0.107 ** 0.156 **
Estimation Method:
No ObservationsPseudo R2loglikelihood
Autodefensas 2000
Nation Total Andean Caribbean Pacífic
Autodefensas 2000
Autodefensas 2000
Autodefensas 2000
615 171
Coefficient
PROBIT PROBIT PROBIT PROBIT
Coefficient Coefficient Coefficient
1630.2815
-269.1407 -155.89 -42.2587 -37.34280.2159 0.4457 0.4211
1062
Table A6. Determinants of the Ilicit Crops 2000
Constant -2.024*** -5.419 -4.875*** 7.029** -5.582*Social and Economics
Index of Basic Unsatisfied Needs 2000 0.141*** 0.039*** 0.130** -0.006 0.146
Gini of private property 2000 -2.203*** -1.970** -1.505** -2.352 -2.278Education -1.083** -0.415 -2.040** 2.237 -1.396Geographical Variables
Altitude -0.0003*** -0.002** -0.006 -0.001* 0.009
Distance to the capital 0.001*** -0.008 -0.001 0.002* 0.005***
Distance to the tour Principal Markerts -0.0001 -0.002 0.003* -0.011* 0.004*
Precipitation -0.0003 -0.001** 0.007 0.003 -0.005**
Water disponibility index 0.0005*** 0.001** 0.008*** -0.007* 0.009
Erosion 0.2443*** 0.153*** 0.373*** 0.191 -0.012Soil aptitude Index -0.0791 -0.029 -0.102 -0.339* 0.135Infraestructure variablesRoads -0.002 -0.002 0.004 -0.005* -5.582*
Estimation Method: No de Observations
Pseudo R2loglikelihood -32.41-359.7555 -41.84 -155.92 -41.1572
1630.243 0.4694 0.3041 0.4215 0.52421062 114 615 171
PROBIT PROBIT PROBIT PROBIT PROBIT
Total National Orinoquía y Amazon Andiean Caribean Pacific
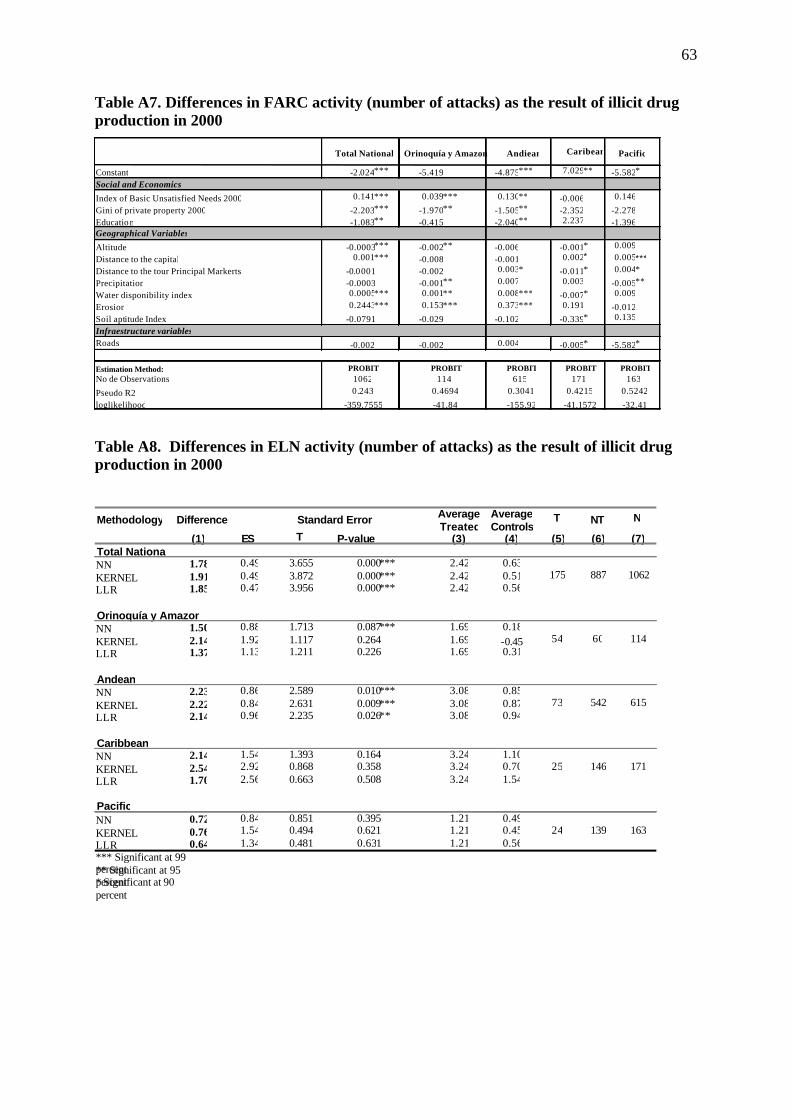
63
Table A7. Differences in FARC activity (number of attacks) as the result of illicit drug production in 2000
Table A8. Differences in ELN activity (number of attacks) as the result of illicit drug production in 2000
Methodology Difference Average Treated
Average Controls
T NT N (1) ES T P-value (3) (4) (5) (6) (7)
Total NationalNN 1.78 0.49 3.655 0.000*** 2.42 0.63KERNEL 1.91 0.49 3.872 0.000*** 2.42 0.51LLR 1.85 0.47 3.956 0.000*** 2.42 0.56
Orinoquía y AmazonNN 1.50 0.88 1.713 0.087*** 1.69 0.18KERNEL 2.14 1.92 1.117 0.264 1.69 -0.45LLR 1.37 1.13 1.211 0.226 1.69 0.31
AndeanNN 2.23 0.86 2.589 0.010*** 3.08 0.85KERNEL 2.22 0.84 2.631 0.009*** 3.08 0.87LLR 2.14 0.96 2.235 0.026** 3.08 0.94
CaribbeanNN 2.14 1.54 1.393 0.164 3.24 1.10KERNEL 2.54 2.92 0.868 0.358 3.24 0.70LLR 1.70 2.56 0.663 0.508 3.24 1.54
PacificNN 0.72 0.84 0.851 0.395 1.21 0.49KERNEL 0.76 1.54 0.494 0.621 1.21 0.45LLR 0.64 1.34 0.481 0.631 1.21 0.56*** Significant at 99 percent ** Significant at 95 percent * Significant at 90 percent
Standard Error
175 887 1062
54 60 114
73 542 615
25 146 171
24 139 163
Constant -2.024*** -5.419 -4.875*** 7.029** -5.582*
Social and Economics
Index of Basic Unsatisfied Needs 2000 0.141*** 0.039*** 0.130** -0.006 0.146
Gini of private property 2000 -2.203*** -1.970** -1.505** -2.352 -2.278Educatio n -1.083** -0.415 -2.040** 2.237 -1.396Geographical Variables
Altitude -0.0003*** -0.002** -0.006 -0.001* 0.009
Distance to the capital 0.001*** -0.008 -0.001 0.002* 0.005***Distance to the tour Principal Markerts -0.0001 -0.002 0.003* -0.011* 0.004*
Precipitation -0.0003 -0.001** 0.007 0.003 -0.005**
Water disponibility index 0.0005*** 0.001** 0.008*** -0.007* 0.009
Erosion 0.2443*** 0.153*** 0.373*** 0.191 -0.012Soil aptitude Index -0.0791 -0.029 -0.102 -0.339* 0.135
Infraestructure variablesRoads -0.002 -0.002 0.004 -0.005* -5.582*
Estimation Method: No de Observations
Pseudo R2loglikelihood -32.41-359.7555 -41.84 -155.92 -41.1572
1630.243 0.4694 0.3041 0.4215 0.52421062 114 615 171
PROBIT PROBIT PROBIT PROBIT PROBIT
Total National Orinoquía y Amazon Andiean Caribean Pacific
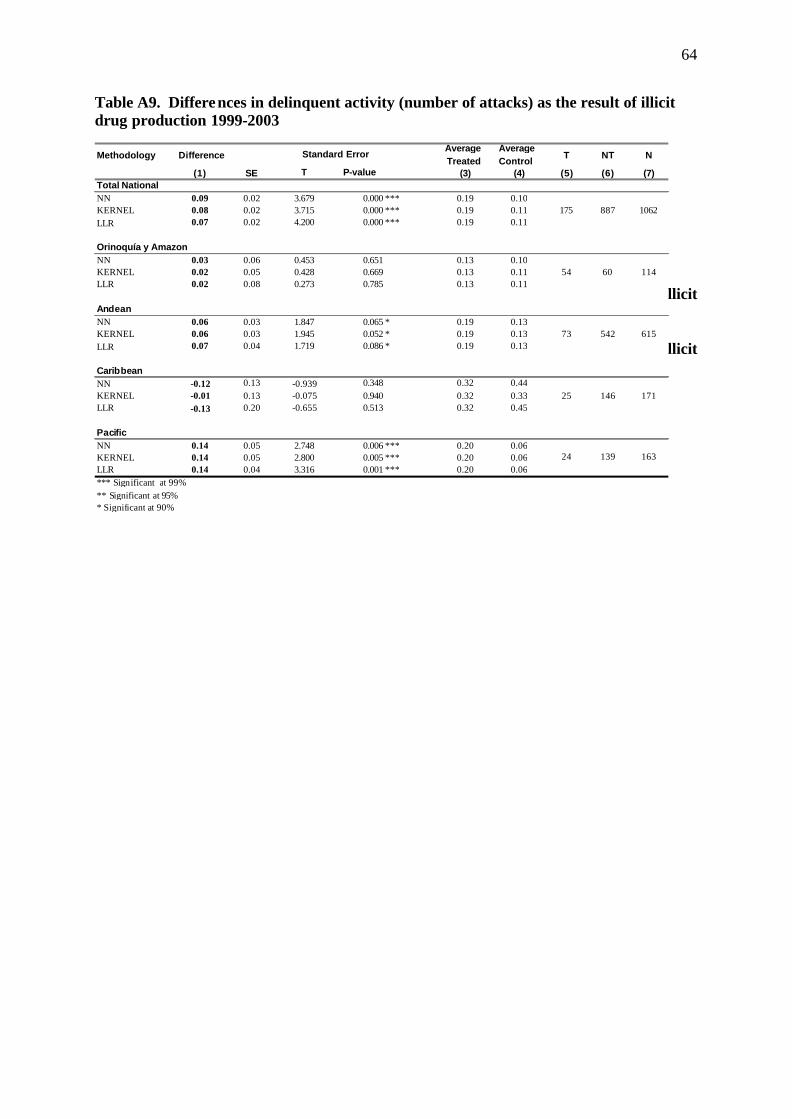
64
Table A9. Differences in delinquent activity (number of attacks) as the result of illicit drug production 1999-2003
Table A9. Determinants of eradication via spraying 2000 Table A8. Differences in delinquent activity (number of attacks) as the result of illicit drug production 1999-2003 Table A8. Differences in delinquent activity (number of attacks) as the result of illicit drug production 1999-2003
Methodology Difference Average
Treated Average Control T NT N
(1) SE T P-value (3) (4) (5) (6) (7) Total National NN 0.09 0.02 3.679 0.000 *** 0.19 0.10 KERNEL 0.08 0.02 3.715 0.000 *** 0.19 0.11 LLR 0.07 0.02 4.200 0.000 *** 0.19 0.11
Orinoquía y Amazon NN 0.03 0.06 0.453 0.651 0.13 0.10 KERNEL 0.02 0.05 0.428 0.669 0.13 0.11 LLR 0.02 0.08 0.273 0.785 0.13 0.11
Andean NN 0.06 0.03 1.847 0.065 * 0.19 0.13 KERNEL 0.06 0.03 1.945 0.052 * 0.19 0.13 LLR 0.07 0.04 1.719 0.086 * 0.19 0.13
Caribbean NN -0.12 0.13 -0.939 0.348 0.32 0.44 KERNEL -0.01 0.13 -0.075 0.940 0.32 0.33 LLR -0.13 0.20 -0.655 0.513 0.32 0.45
Pacific NN 0.14 0.05 2.748 0.006 *** 0.20 0.06 KERNEL 0.14 0.05 2.800 0.005 *** 0.20 0.06 LLR 0.14 0.04 3.316 0.001 *** 0.20 0.06 *** Significant at 99% ** Significant at 95% * Significant at 90%
Standard Error
175 887 1062
54 60 114
73 542 615
25 146 171
24 139 163
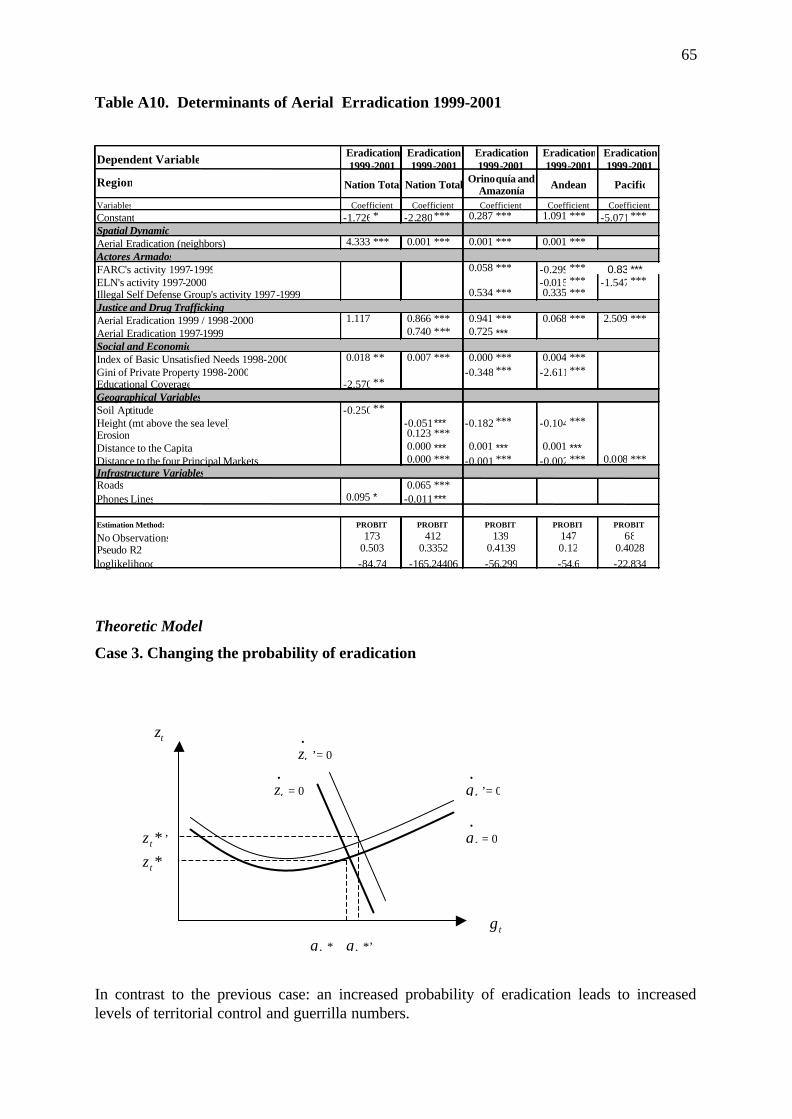
65
Table A10. Determinants of Aerial Erradication 1999-2001
Theoretic Model
Case 3. Changing the probability of eradication
In contrast to the previous case: an increased probability of eradication leads to increased levels of territorial control and guerrilla numbers.
•
tg = 0
tg
tz
*tz
tg *
•
tz = 0
tg *’
*tz ’
•
tz ’= 0
•
tg ’= 0
Dependent Variable
Region
VariablesConstant -1.726* -2.280*** 0.287 *** 1.091 *** -5.071***Spatial Dynamic Aerial Eradication (neighbors) 4.333 *** 0.001 *** 0.001 *** 0.001 ***Actores ArmadosFARC's activity 1997-1999 0.058 *** -0.299*** 0.83 *** ELN's activity 1997-2000 -0.015 *** -1.547***Illegal Self Defense Group's activity 1997-1999 0.534 *** 0.335 ***Justice and Drug Trafficking Aerial Eradication 1999 / 1998-2000 1.117 0.866 *** 0.941 *** 0.068 *** 2.509 ***Aerial Eradication 1997-1999 0.740 *** 0.725 ***Social and EconomicIndex of Basic Unsatisfied Needs 1998-2000 0.018 ** 0.007 *** 0.000 *** 0.004 ***Gini of Private Property 1998-2000 -0.348 *** -2.611***Educational Coverage -2.570**Geographical VariablesSoil Aptitude -0.250**Height (mt above the sea level) -0.051*** -0.182 *** -0.104***Erosion 0.123 ***Distance to the Capital 0.000 *** 0.001 *** 0.001 ***Distance to the four Principal Markets 0.000 *** -0.001 *** -0.002*** 0.008 ***Infrastructure VariablesRoads 0.065 ***Phones Lines 0.095 * -0.011***
Estimation Method:
No ObservationsPseudo R2loglikelihood
Eradication 1999-2001
Nation Total Nation Total Andean Pacific
Eradication 1999-2001
Orinoquía and Amazonía
Eradication 1999-2001
Eradication 1999-2001
Eradication 1999-2001
173 412 147
Coefficient Coefficient Coefficient Coefficient
PROBIT PROBIT PROBIT PROBIT
Coefficient
PROBIT
-22.8340.3352
139
-56.2990.4028
680.503-84.74 -165.24406 -54.6
0.4139 0.12
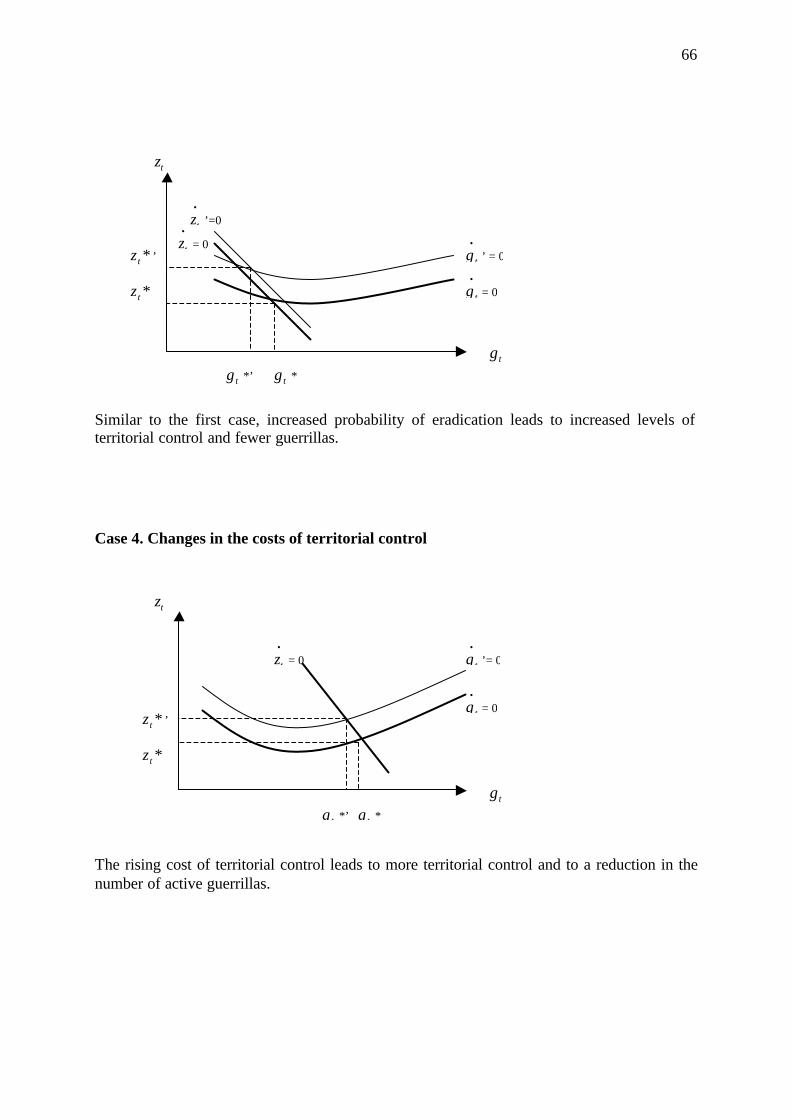
66
Similar to the first case, increased probability of eradication leads to increased levels of territorial control and fewer guerrillas.
Case 4. Changes in the costs of territorial control
The rising cost of territorial control leads to more territorial control and to a reduction in the number of active guerrillas.
•
tg = 0
tg
tz
*tz
tg *
•
tz = 0
tg *’
*tz ’
•
tg ’= 0
tg
tz
*tz
tg *’
•
tz = 0
•
tz ’=0
•
tg = 0
•
tg ’ = 0
tg *
*tz ’
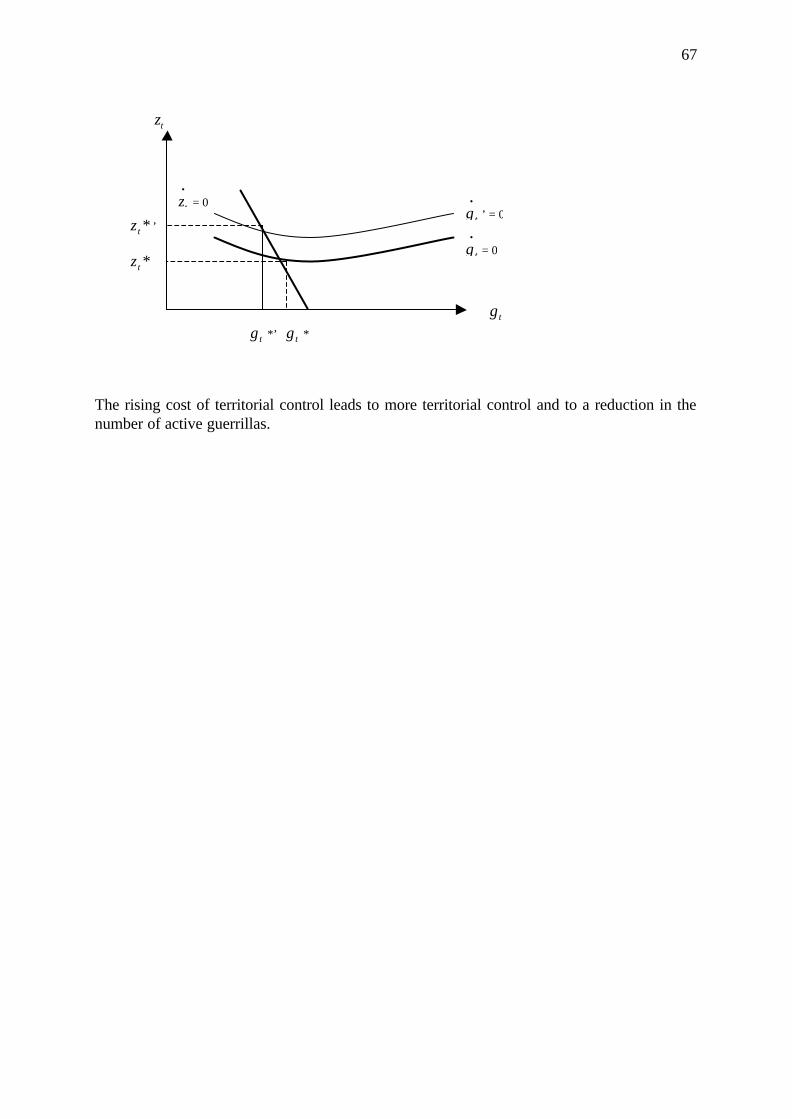
67
The rising cost of territorial control leads to more territorial control and to a reduction in the number of active guerrillas.
tg
tz
*tz
tg *’
•
tz = 0
•
tg = 0
•
tg ’ = 0
tg *
*tz ’
Other Working Papers in Series WP1 Crisis States Programme, ‘Concept and Research Agenda’ (April 2001) – Also available in Spanish WP2 Crisis States Programme, ‘Research Activities’ (April 2001) WP4 Crisis States Programme, ‘Research in Latin America’ (April 2001) – Also available in Spanish WP12 E. A. Brett, ‘Liberal Theory, Uneven Development and Institutional Reform: Responding to the crisis in weak
states’ (July 2002) WP14 David Keen, ‘Since I am a Dog, Beware my Fangs: Beyond a ‘rational violence’ framework in the Sierra
Leonean war’ (August 2002) WP18 James Putzel, ‘Politics, the State and the Impulse for Social Protection: The implications of Karl Polanyi’s
ideas for understanding development and crisis’ (October 2002) WP19 Hugh Roberts, ‘From Segmentarity to Opacity: on Gellner and Bourdieu, or why Algerian politics have eluded
theoretical analysis and vice versa’ (December 2002) – Also available in French WP20 Jonathan DiJohn, ‘Mineral-Resource Abundance and Violent Political Conflict: A critical assessment of the
rentier state model’ (December 2002) WP21 Victoria Brittain, ‘Women in War and Crisis Zones: One key to Africa’s wars of under-development’
(December 2002) WP22 Apurba Baruah, ‘Tribal Traditions and Crises of Governance in North East India, with special reference to
Meghalaya’ (March 2003) WP23 Giovanni M. Carbone, ‘Emerging Pluralist Politics in Mozambique: the Frelimo -Renamo Party System’
(March 2003) WP24 Francisco Gutiérrez Sanín, ‘Fragmentación electoral y política tradicional en Colombia – piezas para un
rompecabezas en muchas dimensiones’ (March 2003) – English version forthcoming WP25 Francisco Gutiérrez Sanín, ‘Los tiempos de las involuciones democráticas’ (March 2003) – English version
forthcoming WP26 Manoj Srivastava, ‘The Dyamics of achieving ‘Power’ and ‘Reform’ as a Positive-Sum Game: A report on the
preliminary ethnographic explorations of the politics-governance nexus in Madhya Pradesh, India’ (March 2003)
WP27 Francisco Gutiérrez Sanín, ‘Criminal Rebels? A discussion of war and criminality from the Colombian experience’ (April 2003)
WP28 Luis Eduardo Fajardo, ‘From the Alliance for Progress to the Plan Colombia: A retrospective look at US aid to Colombia’ (April 2003)
WP29 Jean-Paul Faguet, ‘Decentralisation and local government in Bolivia’ (May 2003) –Also available in Spanish WP30 Maria Emma Wills & Maria Teresa Pinto, ‘Peru’s failed search for political stability (June 2003) WP31 Robert Hunter Wade, ‘What strategies are viable for developing countries today? The World Trade
Organisation and the shrinking of ‘development space’ (June 2003) WP32 Carlos Medina & Hermes Martínez, ‘Violence and drug prohibition in Colombia’ (August 2003) WP33 Antonio Giustozzi, ‘Respectable Warlords? The Politics of State-Building in Post-Taleban Afghanistan’
(September 2003) WP34 Hugh Roberts, ‘North African Islamism in the Blinding Light of 9-11’ (October 2003) WP35 Dennis Rodgers, ‘Dying For It: Gangs, Violence and Social Change in Urban Nicaragua’ (October 2003) WP36 Giovanni M. Carbone, ‘Developing Multi-Party Politics: Stability and Change in Ghana and Mozambique
(November 2003) WP37 David Keen, ‘Demobilising Guatemala’ (November 2003) WP38 Miguel García & Gary Hoskin, ‘Political Participation and War in Colombia: An Analysis of the 2002
Elections’ (November 2003) WP39 Apurba Baruah, ‘Ethnic Conflicts and Traditional Self-governing Institutions: A Study of Laitumkrah Dorbar’
(January 2004) WP40 Ann C. Mason, ‘Constructing Authority Alternatives in Colombia: Globalisation and the Transformation of
Governance’ (February 2004) WP41 Tobias Kelly, ‘The Palestinian Legal System and the Fragmentation of Coercive Power’ (March 2004) WP42 Andrew Martin Fischer, ‘Urban Fault Lines in Shangri-La: Population and Economic Foundations of Inter-
ethnic Conflict in the Tibetan Areas of Western China’ (June 2004) WP43 Jacklyn Cock, ‘Rethinking Militarism in Post-Apartheid South Africa’ (June 2004) WP44 Debby Bonnin, ‘Understanding the Legacies of Political Violence: An Examination of Political Conflict in
Mpumalanga Township, Kwa-Zulu Natal, South Africa’ (June 2004) WP45 Kenneth C. Shadlen, ‘Representation, Participation and Development: Lessons from Small Industry in Latin
America’ (June 2004) WP46 Jonathan DiJohn, ‘The Political Economy of Economic Liberalisation in Venezuela’ (June 2004) It is our intention for all Crisis States Programme working papers eventually to be available in English, Spanish and French. Some in the series have already been translated. For further details, and an up to date list of Working Papers, and other Crisis States publications, please consult our website (www.crisisstates.com).