Brogiolo, G.P. Arqueología estratigráfica y restauración. 1995
Upload
vuongduongCategory
view
214download
0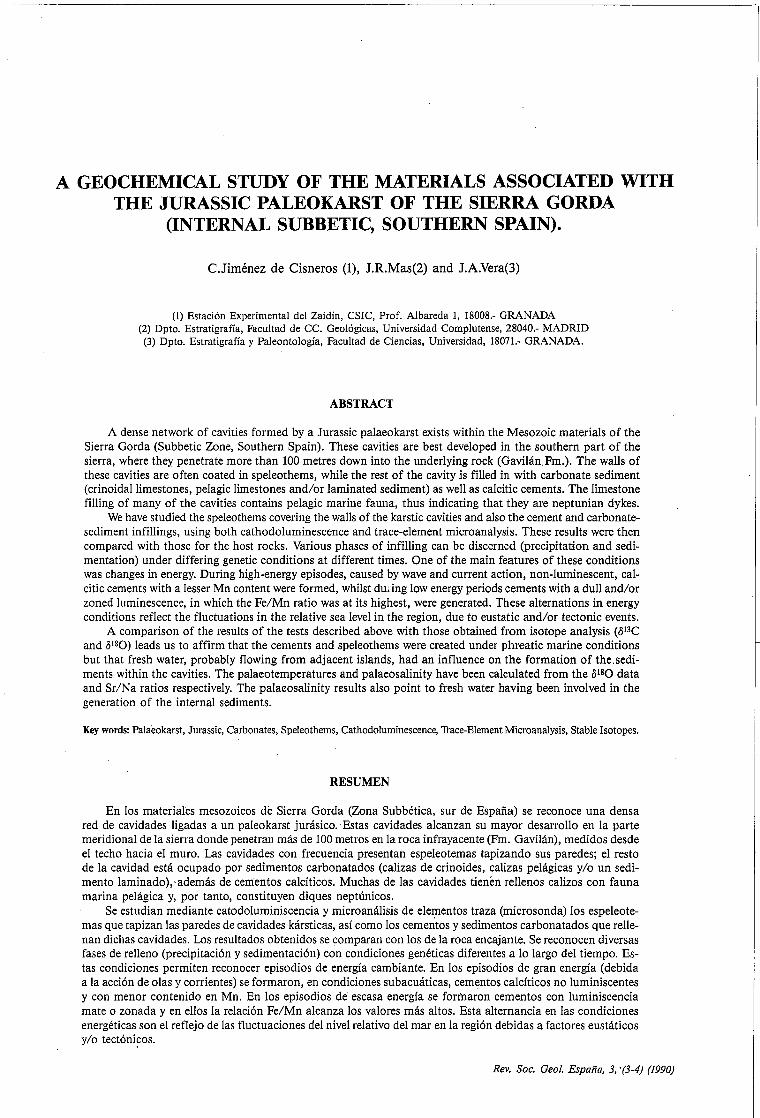
A GEOCHEMICAL STUDY OF THE MATERIALS ASSOCIATED WITH THE JURASSIC PALEOKARST OF THE SIERRA GORDA
(INTERNAL SUBBETIC, SOUTHERN SPAIN).
C.Jiménez de Cisneros (1), J.R.Mas(2) and J.A.Vera(3)
(1) Estación Experimental del Zaidín, CSIC, Prof. Albareda 1, 18008.- GRANADA (2) Dpto. Estratigrafía, Facultad de CC. Geológicas, Universidad Complutense, 28040.- MADRID (3) Dpto. Estratigrafía y Paleontología, Facultad de Ciencias, Universidad, 18071.- GRANADA.
ABSTRACT
A dense network of cavities formed by a Jurassic palaeokarst exists within the Mesozoic materials of the Sierra Gorda (Subbetic Zone, Southern Spain). These cavities are best developed in the southern part of the sierra, where they penetrate more than 100 metres down into the underlying rock (Gavilán.Fm.). The walls of these cavities are often coated in speleothems, while the rest of the cavity is filled in with carbonate sediment (crinoidallimestones, pelagic limes tones and/or laminated sediment) as well as calcitic cements. The limestone filling of many of the cavities contains pelagic marine fauna, thus indicating that they are neptunian dykes.
We have studied the speleothems covering the walls of the karstic cavities and also the cement and carbonatesediment infillings, using both cathodoluminescence and trace-element microanalysis. These results were then compared with those for the host rocks. Various phases of infilling can be discerned (precipitation and sedimentation) under differing genetic conditions at different times. One of the main features of these conditions was changes in energy. During high-energy episodes, caused by wave and current action, non-luminescent, calcitic cements with a lesser Mn content were formed, whilst dudng low energy periods cements with a dull and/or zoned luminescence, in which the Fe/Mn ratio was at its highest, were generated. These alternations in energy conditions reflect the fluctuations in the relative sea level in the region, due to eustatic and/or tectonic events.
A comparison of the results of the tests described aboye with those obtained from isotope analysis (15 13e and 15 180) leads us to affirm that the cements and speleothems were created under phreatic marine conditions but that fresh water, probably flowing from adjacent islands, had an influence on the formation of the.sediments within the cavities. The palaeotemperatures and palaeosalinity have been ca!culated from the 15 180 data and Sr/Na ratios respectively. The palaeosalinity results also point to fresh water having been involved in the generation of the internal sediments.
Key words: Palaeokarst, Jurassic, Carbonates, Speleothems, Cathodoluminescence, Trace-Element Microanalysis, Stable Isotopes.
RESUMEN
En los materiales mesozoicos de Sierra Gorda (Zona Subbética, sur de España) se reconoce una densa red de cavidades ligadas a un paleokarst jurásico .. Estas cavidades alcanzan su mayor desarrollo en la parte meridional de la sierra donde penetran más de 100 metros en la roca infrayacente (Fm. Gavilán), medidos desde el techo hacia el muro. Las cavidades con frecuencia presentan espeleotemas tapizando sus paredes; el resto de la cavidad está ocupado por sedimentos carbonatados (calizas de crinoides, calizas pelágicas y/o un sedimento laminado),-además de cementos calcíticos. Muchas de las cavidades tienen rellenos calizos con fauna marina pelágica y, por tanto, constituyen diques neptúnicos.
Se estudian mediante catodoluminiscencia y microanálisis de elementos traza (microsonda) los espeleotemas que tapizan las paredes de cavidades kársticas, así como los cementos y sedimentos carbonatados que rellenan dichas cavidades. Los resultados obtenidos se comparan con los de la roca encajante. Se reconocen diversas fases de relleno (precipitación y sedimentación) con condiciones genéticas diferentes a lo largo del tiempo. Estas condiciones permiten reconocer episodios de energía cambiante. En los episodios de gran energía (debida a la acción de olas y corrientes) se formaron, en condiciones subacuáticas, cementos calcíticos no luminiscentes y con menor contenido en Mn. En los episodios de· escasa energía se formaron cementos con luminiscencia mate o zonada y en ellos la relación Fe/Mn alcanza los valores más altos. Esta alternancia en las condiciones energéticas son el reflejo de las fluctuaciones del nivel relativo del mar en la región debidas a factores eustáticos y/o tectóni70s.
Rev. Soco Geol. España, 3, '(3-4) (1990)

392 C.JIMÉNEZ DE CISNEROS ET AL.
El estudio comparado de los resultados anteriores con los del análisis isotópico (013e y 0180) permite afirmar que los cementos y espeleotemas se formaron en condiciones freáticas marinas. Sin embargo en el depósito de los sedimentos internos de las cavidades hubo influencia de aguas dulces que se interpretan como procedentes de las islas adyacentes. A partir de los datos del 0180 y de la relación Sr/Na se hacen estimaciones de paleotemperaturas y paleosalinidades, respectivamente. Las paleosalinidades deducidas para los sedimentos de relleno de las cavidades muestran igualmente influencia de aguas dulces.
Palabras clave: Paleokarst, Jurásico, Carbonatos, Espeleotemas, Catodoluminiscencia, Microanálisis de elementos traza, isótopos estables.
Jiménez de Cisneros,C., Mas,lR. and Vera,J.A. (1990): A geochemical study of the material s associated with the jurassic paleokarts of the Sierra Gorda (Internal Subbetic, Southern Spain). Rev. Soco Geol. España, 3: 391-420.
Jiménez de Cisneros,C., Mas,J.R. y Vera,J.A. (1990): Estudio geoquímico de los materiales asociados al paleokarst jurásico de Sierra Gorda (Subbético interno, Sur de España). Rev. Soco Geol. España, 3: 391-420.
1. INTRODUCTION
Vera et al. (1988) have distinguished various stages of palaeokarst formation in the External Zones of the Betic Cordillera, which initially affected the Liassic carbonate platform and afterwards pelagic swells. The recognition of these karstic phases has been based on the existence of karstic surfaces, speleothems, cavity sediments, collapse breccias, diagenetic alterations and palaeosoils. The term "speleothem" is used in the same sense as it is used by Thrailkill (1976), Folk and Assereto (1976) and, Esteban and Kappla (1983) and is equivalent to White's use of it (1978) to denote the carbonate cements formed on cavity walls under both subaerial and submarine conditions.
The different palaeokarst phases are related to stratigraphic unconformities discernible at a regionallevel, and in particular those bearing witness to major brusque falls in the relative sea level [cf. the curve proposed by Vera (1988)]. The palaeokarst, including sizeable cavities (Vera et al., 1986-1987, 1988; García-Hernández et al., 1986-1987a,b; Martín-AIgarra et al., 1989), developed at the highest points of blocks tilted over by listric faults. In the areas closest to sea level kamenitza karsts, characterised by flat-bottomed, decimetre-deep cavities were formed (García-Hernández et al.,
1986-1987a, 1988b; Martín-AIgarra et al., 1989). In the submerged parts ornission surfaces and hardgrounds developed, including features such as cavities, infilling sediments and cements, which may be confused with those of an emerged, subaerial, karstic phase (GarcíaHernández et al., 1989). It is precisely for this reason that a geochemical study of the materials related to the palaeokarst is of such interest, as it introduces the application diagnostic criteria to all the aboye mentioned observations. It is of even greater importance if we bear in mind that a conventional optical study of the speleothems throws little light on their genetic origins, as all that can be seen in general are phases of fibrousradiaxial calcitic cements. With this study our intention has been to distinguish the various genetic conditions under which the speleothems coating the walls of the cavities, the cements filling in the cavities and the different sediments which complete the topping up of the cavities in the Jurassic palaeokarst ofthe Sierra Gorda were formed.
From a theoretical point of view the interest in a study such as this lies in the fact that the solution and recrystallization pro ces ses in carbonate sediments result in a stabilization of the mineralogy, including a stabilization of the carbon and oxygen isotopes and also the distribution and concentration of certain trace elements
Fig. l.-Localización geográfica, geológica y estratigráfica de las secciones estudiadas. A.- Esquema de localización geográfica y geológica en el sur de España. Leyenda: 1 + 2: Cordilleras Béticas (1.- Zonas Externas, 2.- Zonas Internas), 3: Materiales neógenos. 4: Macizo hercínico de la Meseta. B.- Localización de las secciones estratigráficas estudiadas en la unidad de Sierra Gorda. Leyenda: 1.- Materiales de las Zonas Internas. 2.- Triásico subbético. 3.- Jurásico del Subbético medio. 4.- Cretácico del Subbético medio. 5.- Jurásico de la unidad Parapanda-Hacho de Laja (Subbético interno). 6.- Jurásico de la Unidad de Sierra Gorda (Subbético interno). 7.- Cretácico de la Unidad de Sierra Gorda (Subbético interno). 8.- Paleógeno. 9.- Unidades del Complejo del Campo de Gibraltar y afines. 10.- Unidad de Zafarraya. 11.- Neógeno. 12.- Materiales recientes. 13.- Secciones estratigráficas estudiadas (1: Cantera, 2: Cortijo del Cardador, 3 y 4: Cañada de los Cazadores Norte y Sur, respectivamente). C.- Secciones estratigráficas jurásicas y su correlación, según García-Hernández el al. (1986-1987b). Localización en B. Leyenda: 1.- Calizas blancas de medios marinos de plataforma (Fm. Gavilán). 2.- Calizas de crinoides del Carixiense. 3.- Calizas fosilíferas pelágicas del Lias superior. 4.- Calizas pelágicas. 5.- Calizas con silex y filamentos, del Dogger. 6.- Ammonítico rosso calizo. 7.- Ammonítico rosso margoso. 8.- Brechas y conglomerados intraformacionales. 9.- Turbiditas. 10.- Superficie de paleokarst. 11.- Discontinuidades jurásicas (I.- Discontinuidad intracarixiense. II.Discontinuidad de la base del Dogger. III.- Discontinuidad del Bathoniense terminal. IV.- Discontinuidad del Oxfordiense inferior. V.- Discontinuidad intrakimmeridgiense). 12.- Límite Tithónico inferior-Tithónico superior. 13.- Hardground. 14.- Supeficies de omisión. 15.- Dicordancia. 16.- Cantos de calizas blancas. 17.- Cantos de calizas de crinoides. 18.- Cantos de calizas pelágicas del Lias superior.
Rev. Soco Geol. España, 3, (3-4) (1990)
o
A GEOCHEMICAL STUDY ...
if .... ('
.:., ,-.,>
\t~ .. ~ t ~~
if", 1'/
~""r. 1ft ~ tl \ 1 O 50 100 km L
t' Geological location
0lJI]]]1
~6
WW»111
5 10 .2 D3 ~7 ~8
012013
15
~4
[2]9 ~5
~10
J
1525[j
2~ .... e.
3.
4E2}j
5~
6~
7~9j
8~
96 101\
11--
12 ........
13 *" 14 * 15 * breccias
8 16017@ 18~
393
CAÑADA CAZADORES
2.
(~
[m ,3)
Fig. I.-Stratigraphical, geographical and geologicallocations of the studied stratigraphic sections. A.- Geological and geographicallocation map into the southern Spain. Key: l + 2: Betic Cordilleras (1.- External Zones, 2.- Internal Zones), 3: Neogene. 4: Hercynian massif of the Spanish Meseta. B.- Location of the studied stratigraphic sections into of the Sierra Gorda unit. Key: 1.- Betic Internal Zones materials. 2.- Subbetic Triassic. 3.- Median Subbetic Jurassic. 4.- Median Subbetic Cretaceous. 5.- Jurassic of th'e Parapanda-Hacho de Loja unit (lnternal Subbetic). 6.- Jurassic of the Sierra Gorda unit (Internal Subbetic). 7.- Cretaceous of the Sierra Gorda unit (Internal Subbetic). 8.- Paleogene. 9.- Campo de Gibraltar complex units and similar units. 10.- Zafarraya unit. 11.- Neogene. 12.Recent materials. 13.- Studied stratigraphic sectiop.s. (1: Cantera, 2: Cortijo del Cardador, 3 y 4: Northern and southern Cañada de los Cazadores, respectively). C.- Jurassic stratigraphic sections and correlation, from García-Hernández et al. (1986-1987b). Location in B. Key: 1.- Shallow marine platform white 'limestones (Gavilán Fm.). 2.- Crinoidal limestones (Carixian). 3.- Fossiliferous pelagic limes tones (Upper Liassic). 4.- Pelagic limestones. 5.- Cherty and filamentallimestones (Dogger). 6.- Caicareous Ammonitico rosso. 7.- Marly Ammonitico ros so. 8.- Intraforniational rudites. 9.- Turbidites. 10.- Paleokarst surfaces. 11.- Jurassic discoritinuities (1.- Intra-Carixian di~continuity. Il.- Bottom of the Dogger discontinuity. III.- Uppermost Bathonian discontinuity. IV.-Lower Oxfordian discontinuity. V.- Intra-Kimmeridgian discontinuity). 12.- Lower/Upper Tithonian boundary. 13.- Hardground. 14.- Omission surfaces. 15.- Unconformity. 16.- Clasts of the white limestones. 17.- Clasts of the crinoidallimestones. 18.- Clasts of the pelagic limestones (Upper Liassic).
Rev. Soco Geol. España, 3, (3-4) (1990)

394
N
15m
" '.' . . ' ". . ~
C.JIMÉNEZ DE CISNEROS ET AL.
s
.. '.'
...••.••..•••..•..••. ~ .••. ~: .\----1-1
•...... ' ' . .:',' .. ,1 .... :. '.': , .
......
. ···• .. it~ ... ··.·····.~~?,··;.L..-,--L: ~I .' '.
.. ', " ',:',','
~3 [A] 4 I· .. ·:.:.):~J 7
Fig. 2.-Sierra Gorda Jurassic Paleokarst. A.- Stratigraphic section of the Cañada de los Cazadores (section 4 in figs. 2B,C). B.- Collapse breccias with speleotherns on the cavity walls and on the sorne cJasts. C.- Neptunian dyke with two fills: crinoidallirnestones and larninated sediments, and speleotherns bet"Y~en both. D.- Neptunian dyke with pelagic sedirnent fill and sorne cJasts. E.- Neptunian dyke without speleothems and with laminated sediment cJasts. E- Karstic cavity with fill of the breccias and laminated sedimento G.- Neptunian dykes of the Q y S types (after cJassification to Wendt, 1971). H.- Cavities with speleothems and internal pelagic sediments. 1.- Neptunian dykes with speleothems and two internal sedimems (first: laminated silty limestones, and second: pelagic limestones). Key: 1.- Limestones of the Gavilán Fm. (paleokarst host rock). 2.- Crinoidallimestones. 3.- Collapse breccias. 4.- Neptunian dykes. 5.- Speleothems. 6.- Laminated internal sedimento 7.- Pelagic internal sedimento
Rev. Soco Geol. Espafla, 3, (3-4) (1990)

A GEOCHEMICAL STUDY ... 395
such as Sr, Mg, Fe, and Mn. Thus, a study of these trace elements may provide information about the genetic conditions of the different cements and speleothems compared to the host rock and the sediments filling the cavities, whilst cathodoluminescence can accurately identify the growth phases of the cements and their genetic conditions.
In this paper we describe the resuIts of applying both techniques, trace-element microanalysis and cathodoluminescence, to the materials associated with the Sierra Gorda palaeokarst and, taking into account the contribution made by Jiménez de Cisneros' isotope data (1989), we put forward an interpretation of the genetic conditions under which they evolved.
2. GEOWGICAL AND STRATIGRAPHIC SETTING
The geological unit in question, the Sierra Gorda, belongs to the Internal Subbetic, part of the External Zones of the Betic Cordilleras (Fig. 1). The External Zones formed a great carbonate platform at the southern margin of the Iberian plate (Azema et al., 1979; García-Hernández et al., 1980, 1989: Vera, 1981, 1986, 1988; among others). In the middle-Liassic a rifting phase broke up this platform, this forming two major palaeogeographical domains. The most external of these, the Prebetic, is characterized by continental, coastal and shallow-marine facies, whilst the facies in the more internal domain, the Subbetic (including the Intermediate Units and the Penibetic) are predominantly pelagic.
Within the Subbetic (s.l.) several smaller palaeogeographic domains corresponding to swells and troughs can be distinguished. The troughs (Intermediate Unit and Median Subbetic) were the site of marly, radiolarite and turbiditic deposition during the middleand upper~Jurassic. During the same period nodulous limestones and other related carbonate facies developed on the swells (External and Internal Subbetic) (García-Hernández et al., 1988a). On different occasions in the Subbetic from the rifting phase onwards listric fauIting occurred, causing the tilting over of blocks, the highest parts of which became emerged, especially when these movements coincided with relative falls in sea level.
Karstic phenomena are clearly evident both in the platform limestones and the pelagic rocks; these latter were related to islands which temporarilly emerged and
were then fossilized by marine materials (Vera et al., 1986-1987, 1988; García-Hernández et al., 1988b,c, 1989), thus allowing a fairly precise dating of the karstification phases.
2.1. General stratigraphic ieatures ói the Sierra Gorda.
The Sierra Gorda Unit, belonging to the Internal Subbetic (Fig. 1A,B), contains a carbonate Jurassic series and a Cretaceous made up of marly limestones, and pelagic marls (Linares and Vera, 1965; Vera, 1966). According to García-Hernández et al. (1986-1987b). The main stratigraphic characteristics of the Jurassic materials in this unit are:
- an infra-Domerian Liassic formed by a carbonate lithostratigraphic unit more than 500 m thick, dolomitized towards the bottom and typical of a shallowmarine environment (Gavilán Formation).
- a stratigraphic gap leaves the upper-Liassic generally absent. LocalIy (Fig. 1C), upper-Toarcian to Aalenian materials crop out in the form of fossiliferous pelagic limestones up to a thickness of between 20-30 cm (section 2) and 1.5 m (section 3).
- from the middle-Jurassic to the lowermost Cretaceous :there is a pelagic, transgressive megasequence with numerous unconformities and stratigraphic gap s (Ammonitico Rosso Formation).
In fact, the middle- and upper-Jurassic stratigraphic series of the Sierra Gorda varies considerably from the northern to the southern sectors (Fig. 1C). In the north the Dogger-Malm comprises a tabular lithostratigraphic unit of condensed limestone (Ammonitico Rosso Fm.) les s than 20 m thick. To the southern sector the major outstanding characteristic is the considerable development of neptunian dykes and colIapse breccias contained within the infra-Domerian limestones (Fig. 2A), a phenomenon that is only to be found occasionalIy and on a very small scale in the northern areas. The overlying series becomes progressively les s complete southwards. Also in the southern sectors the middle-Jurassic is composed at the bottom of thick banks of limestones that gradually give way upwards to well-stratified limestones containing black, chert nodules, often with a marked fluid-nodular character. Towards the top, there are frequent levels containing breccioid pebblesof infra-Domerian limestone. The upperJurassic begins with intraformational conglomerates (sections 3 and 4 in Fig. 1C), which fill up and seal nep-
Fig. 2.-Esquema del paleokarst de Sierra Gorda. A.- Sección estratigráfica de la Cañada de los Cazadores (sección 4 de las figuras 2B,C). B.- Brechas de colapso con espeleotemas en las paredes de la cavidad y en algunos cantos. C.-Dique neptúnico con dos tipos de relleno: calizas de crinoides y sedimento laminado, y un espeleotema formado entre ambos depósitos. D.- Dique neptúnico relleno de sedimento marino pelágico y algunos cantos. E.- Dique neptúnico sin espeleotemas y con cantos de sedimento laminado. F.-Cavidad kárstica con relleno de brechas y de sedimento laminado. G.- Diques neptúnicos de tipo Q y S (según la clasificación de Wendt, 1971). H.- Cavidades con espeleotemas y sedimentos pelágicos internos. 1.- Dique neptúnico con espeleotemas de dos fases de relleno una inicial laminada y. otra posterior de calizas pelágicas. Leyenda: 1.- Calizas de las Fm. Gavilán (roca encajante del paleokarst). 2.- Calizas de crinoides. 3.- Brechas de colapso. 4.- Diques neptúnicos. 5.- Espeleotemas. 6.- Sedimento interno laminado. 7.- Sedimento interno pelágico.
Rev. Soco Geol. España, 3, (3-4) (1990)
396 C.JIMÉNEZ DE CISNEROS ET AL.
tunian dykes and karst surfaces worn out of the underIying limestones.
Five unconformities can be identified in the Jurassic sediments of the Sierra Gorda (1, 11, I1I, IV, and V in Fig. 1C). The ages of these unconformities, according to García-Hernández et al. (1986-1987b) are: intra-Carixian, lowermost-Dogger, uppermostBathonian, lower-Oxfordian and intra-Kimmeridgian. Karstification is especiaIly evident upon unconformity surface 11 (Iowermost-Dogger) and, to a somewhat lesser extent, unconformity surface 111 (uppermostBathonian) (García-Hernández et al., 1986-1987b; Vera et al., 1988).
2.2. Features 01 the Jurassic palaeokarst.
The karstified rocks that have undergone karstic processes correspond to several different ages but principaIly they are the shaIlow-marine, oolitic or oncolitic facies limestones, with crinoidal limestone levels, and belong to the Gavilán Formation (lower- to middleLiassic). These facies show elemental shaIlowingupward sequences and correspond to a shaIlowing cyele crowned by the palaeokarst. The existence of further karstic phases after the deposition of the condensed, red, pelagic limestones and/or grey, pelagic limestones with Ammonitico Rosso facies mean s that these rocks may 10caIly be the host rock .for karstic structures. This implies that these latter materials were laid down on a peIagic sweIl which later emerged and underwent karstification.
The initial feature is the morphology of the cavities to be seen in the top of the Gavilán Fm. and, more commonly, in sections perpendicular to the stratification (Fig. 2A), both showing great similarity to recent karstic structures. The cavities vary greatly in depth and width. In the northern sector of the Sierra there are onIy smaIl, centimetre- to metre-sized neptunian dykes. In the southern sector, on the other hand, veritable karstic caves are to be found, penetrating down to 100 m below the top of the formation (Fig. 2A). This depth can be taken as a gauge to the extent of the sweIl's emersion. A dense network of fissures (palaeofractures) controls the geometry of the cavities.
The walls of the cavities are frequently coated in speleothems (Figs 2B,C,D,H and 1). They are the product of carbonate precipitation and are formed of fibrous-radiaxial calcitic cements growing towards the interior of the cavity. The thickness of the speleothems is variable, ranging from a few millimetres to sorne centimetres. NormaIly they leave a space (of varying dimensions), which is filled in with Jurassic marine sediments. A splendid example can be seen in Figure 3, where various growth stages can be made out, between which sediments are to be found in places, which indicates that episodes of precipitation alternated with sedimentary phases.
The cements that do not form speleothems are composed of sparry caIcite and their origin is difficult
Rev. SOCo Geol. Espafla, 3, (3-4) (1990)
to ascertain from an optical study alone. It should be remembered that we use the term "speleothem" for the calcite deposits that coat the walls, while "cements" describes the calcites that entirely filI in the cavities. The cements fundamentally filI in the pores between the allochems directly by precipitation or else form geopetal fillings. The different textures discernible in the cements are of little significance from a genetic point of view, as we are dealing almost exelusively with fibrousradiaxial calcitic cements. Just as with the speleothems, various generations of cements are usuaIly present. Sometimes they constitute the final topping up of the cavity and correspond to blocky, calcite cement.
The internal sediments fill the cavities partiaIly or sometimes totaIly. These sediments are laminated, greyish-yeIlowish, silty-calcareous (Figs. 2B, C, F, G and 1) and often contain millimetre-thick calcitic intercalations. The laminations are sometimes deformed due to postdepositional slumping in the interior of the cavity itseIf. Otherwise the cavities may be filled with marine sediments (crinoidal limestones, pelagic fossiliferous limestones, no dular limestones, etc.), constituting neptunian dykes. These are of great interest as both the host rock and the marine filling can be dated and thus the age of the cavity itself can be arrived at.
CoIlapse breccias appear in the context of the karstic cavities in the outcrops of the southern sector (sites 3 and 4 in Fig.1). The breccioid masses vary from 50 cm to 7 m in width. They may líe upon the surface of the palaeokarst, fillirtg topographical irregularities, or else have penetrated i11to the cavities and caves, especiaIly in theirlower extremes (Fig. 2F). The nature, morphology and size of the pebbles is variable. Among the pebbles there may be sorne previously compacted, laminated sediments (Fig. 2E), indicating that there were at least two succesive phases of karstification and filling.
3. METHODOWGY
Diverse methods have been used, depending upon the geochemical technique being employed. '!\vo phases were always involved, however: the preparation of the sample and its experimental treatment, either in the measuring or observation device.
Cathodoluminescence: the device used was a Technosyn 8200 Mk 11 luminoscope mounted on a Nikon Labophot microscope, belonging to the Dept. of Stratigraphy of the Complutense University, Madrid. The experimental conditions required inelude a vacuum of between 0.05 and 0.01 Torr, a voltage of 12 and 15 Kv and an intensity of between 290-380 p.A. Twelve samples were studied from the northern sector and ten from the south of the sierra. Analogous samples from other locations (e.g. the Sierras of Reelot and Priego) were also studied to compare the relevant features. The technique consists in observing the sample under a petrographic microscope attached to a luminoscope. This device

A GEOCHEMICAL STUDY ... 397
Fig. 3.-Thin sectior, of a cavity which we can see the host rock (R), the speleothem covering to wall with several growth cement layers (a, b, c, d), sorne interbedded sediment (s) and a interna) sediment (T) filling of the cavity. Negative photography.
Fig. 3.-Microfacies (reproducción en negativo) de una cavidad en la que se observa la roca encajante (R), el espeleotema que tapiza la pared constituido por diferentes fases de crecimiemto de cementos (a, b, c, d) con algún sedimento intercalado (s) y con un sedimento interno (T) que completa el relleno.
Rev. Soco Ceo/. Espafla, 3, (3-4) (1990)

398 C.JIMÉNEZ DE CISNEROS ET AL.
bombards the polished (uncovered) thin slice with electrons in si de a vacuum chamber (Amieux, 1982; Mas, 1988). As a result the energy absorbed by sorne materials is reemitted as luminous energy, in colours which range from red, through orange, to yellow in the case of cal cite (Mas, 1988). Sorne calcites are luminescent and others not, due fundamentally to their trace element content (Mn, Fe, Co, Ni and rare earths), which in sorne cases behave as activators and in others as inhibitors.
'fiace-element microanalysis: the device used was a CAMECA SX 50 electron microprobe belonging to the Technical Services section of the University of Granada. The experimental conditions were: a voltage of 20Kv, a probe diameter of lO¡,tm and a probe current of 20mA. The method employed was to make sweeps in order to obtain quantitive determinations. To accomplish this the sweeps were selected previously through a line marked on the thin slice. Na, Mg, Sr, Ba, Fe and Mn were analysed with the aim of detecting any differences between the host rocks, the speleothems and the sediments completing the filling. The length of the sweeps was different for each sample and thus the number of points analysed was variable but on all occasions the spacing between the points was 100¡,tm. Five sampIes were studied in all, two from the northern sector and three from the south. The total number of points analysed was 480, which, at 6 values per point, works out at 3,000 results. These results are presented in lots according to their nature (host rock, speleothem phases, internal sediment, ~tc.) and the maximum, minimum and mean values for each lot are given (Thbles 1 to 5).
These results constitute the fundamental part of this study but they have also been combined with the standard geological practices such as the composition of stratigraphic sections and the study of micro facies, textures and so on, and finally, geochemical isotope techniques applied to the carbonate rocks by one of the present authors (Jiménez de Cisneros, 1989), the results of which are analysed in this papero
4. RESULTS
We have applied the geochemical techniques detailed aboye with the aim of finding out more about the growth conditions and pattern of the calcitic cements that go to make up the greater part of the spe-
leothems lining the cavity walls. These speleothems may have been generated either under vadose conditions (stalactites, Kendall and Broughton, 1978) or in a submarine environment (Kendall, 1985) and we hope to clear up this doubt.
4.1. Cathodoluminescence data
These results are of considerable interest as under a normal microscope the cement growths on the cavity walls usually appear to be uniform masses of calcite crystals, which might be interpreted as either belonging to one single generation or to several generations superimposed one upon the other, but formed under analogous genetic conditions. Nevertheless, by applying cathodoluminescence it is possible to distinguish a succession of luminescent and non-luminescent bands, indicating alternating phases of precipitation under oxidizing and reducing conditions. With these data we can then deduce the succession of changes in the genetic conditions.
4.1.1. Results obtained Irom the study 01 the samples
Graphic schemes of the distribution of the cements and sediments of diverse samples of speleothems are set out in Figure 4, where successive phases of luminescent and non-luminescent growth can be seen. The schemes have been drawn from photographs of sorne of the thin slices studied. Below we describe sorne of the most representative samples among those containing luminescent cements.
Samples from the northern sector of the Sierra Gorda
LC-B-2.- The filling of a small cavity. Starting from the wall two successive calcitic cements can be distinguished: the first is fibrous-radiaxial and non-luminescent, whilst the second is bladed and luminescent. On one side of the cavity there is non-luminescent, peloid, marine sediment between the two cement phases (Fig. 4A). The internal sediment that fills up the cavity, however, is luminescent. LC-C-l.- The filling consists of speleothems covering two walls and an internal sedirr'lent. The speleothem begins from both walls with a non-luminescent, fibrousradiaxial calcitic cement followed by a bladed calcitic cement showing zoned luminescence (Fig. 4B). The internal sediment is luminescent and is made up of silty material containing marine bioclasts.
Fig. 4.-Sketchs drawed from thin sections (for explanation see text). Key: LZ.- Zoned luminescent; LM.- Dullluminescent; NL.-Nonluminescent; 1.- Host rock. 2.- Speleothem with caliche and/or travertine features. 3.- Fibrous radiaxial calcitic cement. 4.- Prismatic calcitic
cement. 5.- Micritic cement. 6.- Internal sediment. 7.- Faults. 8.- Growing crystal direction. Bar scale bar is 2 mm in every sketch. Fig. 4.-Esquemas elaborados a partir de fotografías de láminas delgadas. Explicación en el texto. Leyenda: LZ.- Luminiscente zonado; LM.
Luminiscente mate; NL.- No luminiscente; 1.- Roca encajante. 2.- Espeleotema con aspecto de caliche y/o travertino. 3.- Cemento de calcita fibrosa radiaxial. 4.- Cemento de calcita prismática. 5.- Cemento micrítico. 6.- Sedimento interno. 7.- Fallas. 8.- Sentido de crecimiento de los cristales. Escala gráfica en todos los esquemas 2 mm.
Rev. Soco Geol. España, 3, (3-4) (1990)

A GEOCHEMICAL STUDY ... 399
o.,· . . .., .'. . .
.. ··.i.··.··.··.·. L/ ••.••.•.. ·•· •.••••.•
6.·
F.7 --8
Rev. Soco Geol. España, 3, (3-4) (1990)

400 C.JIMÉNEZ DE CISNEROS ET AL.
TYPE 1 of SEQUENCE
r..::....:·\/l ./.·S ... :/7 5 ".-.'.~'.
A
TYPE 2 of SEQUENCE
B TYPE 3 of SEQUENCE
e Fig. 5.-Representative type sequences of the material distributions in the speleothems that are covering the waIls of the neptunian dyke
from Sierra Gorda. Key: LZM.- DuIl zoned luminescent; LM.- DuIl luminescent; L.- Bright luminescent; NL.-NonIuminescent; 1.Host rock. 2.- Speleothems with caliche and/or travertine feature. 3.- Fibrous radiaxiaI calcitic cemento 4.- Prismatic calcitic cement. 5.- Micritic cement. 6.- Internal sediment. CI to Cs: growth different cement layers into the speleothem. El to E4: erosion different surfaces.
Fig. 5.-Secuencias tipo representativas de la distribución de los materiales que forman los espeleotemas que tapizan las cavidades de los diques neptúnicos de Sierra Gorda. Leyenda: LZM.- Luminiscente zonado mate; LM.- Luminiscente mate; L.- Luminiscente; NL.No luminiscente; 1.- Roca encajante. 2.- Espeleotema con aspecto de caliche ~'/o travertino. 3.- Cemento fibroso radiaxial. 4.- Cemento prismático. 5.- Cemento micrítico. 6.- Sedimento interno. CI a Cs: diferentes etapas de cementos que forman el espeleotema. El a E4: diferentes superficies de erosión sucesivas.
LC-E-l.- A speleothern can be seen coating the wall of a large cavity and a calcitic cernent partially fills a srnall cavity within the host rack. Two calcitic cernent phases can be distinguished in the speleothern: the first is nonlurninescent (fibrous-radiaxial in the speleothern and
Rev. Soco Geol. Espalla, 3, (3-4) (1990)
bladed in the cavity) and the second is bladed with dull, zoned lurninescence (Fig. 4C). The internal sedirnent is silty and lurninescent (Fig. 6 A-N). LC-H-l.- There are two calcitic cernent phases frarn the wall towards the centre of the cavity: the first is non-
A GEOCHEMICAL STUDY ... 401
lurninescent, fibrous-radiaxial and the second is bladed with dull/bright, zoned lurninescence. Between these two phases there is a patchy intercalation of lurninescent, micritic, internal sediment (Fig. 4D). The second cement phase ends up in large crystals growing towards the centre of the cavity. The sediment that tops up the filling of the cavity is luminescent.
Samples from the southern sector of the Sierra Gorda
SO-N-3.- Two calcitic cement phases cover the waIl of the cavity: they are both non-luminescent, fibrousradiaxial and between them in patches there is a silty sedimento The rest of the interior is filled with a luminescent, silty sediment (Fig. 4E). ZF-l.- The speleothem is composed of various successive calcitic cement phases: the first three are nonluminescent, fibrous-radiaxial and contain patchy intercalations of silty sediment between them. There follows a layer of luminescent, marine sediment, which in turn is covered by a new coating of non-Iuminescent, fibrous-radiaxial cement, which finishes towards the interior of the cavity in the form of large pointed crystals (Fig. 4F). The cavity is topped up with a luminescent, silty sediment containing crystal fragments from the second cernent generation. SO-75.- The first phase to coat the wall is a nonlurninescent, laminate cement, looking somewhat like travertine and possibly corresponding to a vadose speleothem (Fig. 40). This is followed by a bright luminescent, micritic sediment and then by four more calcÍtic cernent phases, the first and third of which are nonluminescent (Fig. 6 B-B') and the second and fourth' with dull-zoned luminescence. The interna! sediment is luminescent. SO-76.- A cavity similar to that aboye except that only the first phases from the wall inwards are presento
4.1.2. Distribution sequences 01 the cements and sediments.
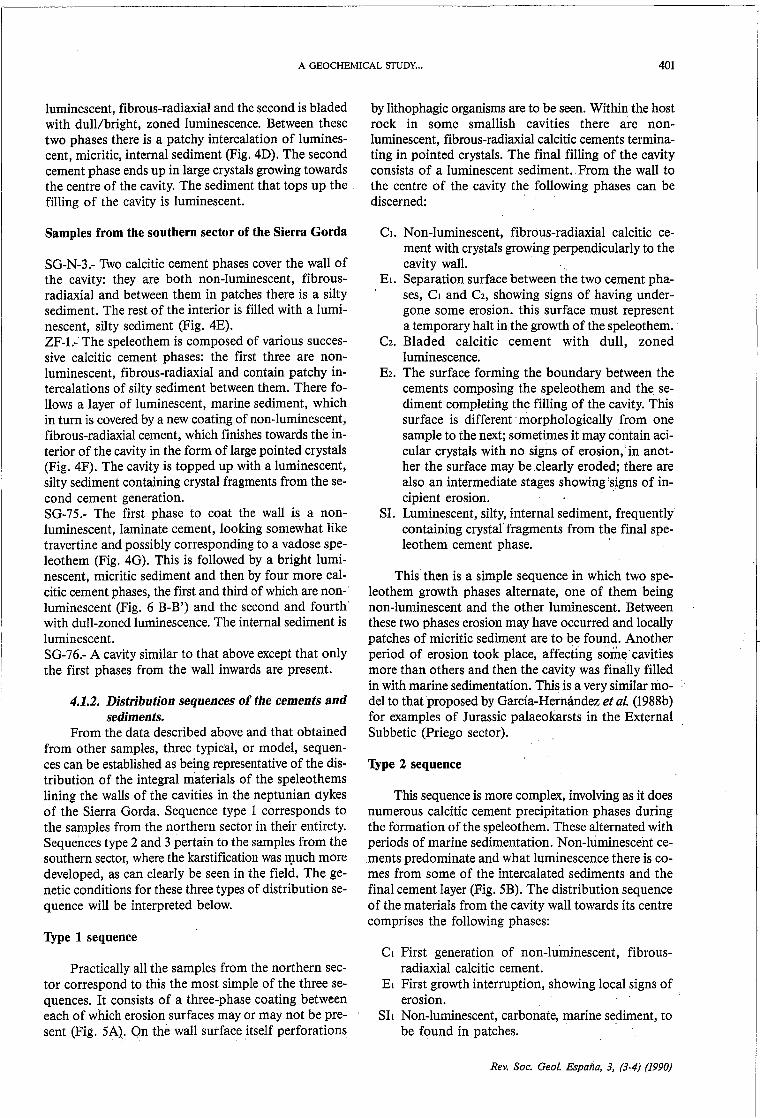
From the data described aboye and that obtained from other samples, three typical, or model, sequences can be established as being representative of the distribution of the integral materials of the speleothems lining the walls of the cavities in the neptunian aykes of the Sierra Gorda. Sequence type 1 corresponds to the samples from the northern sector in their entirety. Sequences type 2 and 3 pertain to the samples from the southern sector, where the karstification was l1luch more developed, as can clearly be seen in the field. The genetic conditions for these three types of distribution sequence will be interpreted below.
Type 1 sequence
Practically all the samples from the northern sector correspond to this the most simple of the three sequences. It consists of a three-phase coating between each of whicherosion sur faces may or may not be present (Fig. 5A)~ On the wall sutface itself perforations
by lithophagic organisms are to be seen. Within the host rock in sorne smallish cavities there are nonluminescent, fibrous-radiaxial calcitic cements termina~ ting in pointed crystals. The final filling of the cavity consists of a luminescent sediment.From the wall to the centre of the cavity the following phases can be discerned:
el. Non-Iuminescent, fibrdus-radiaxial calcitic cement with crystals growing perpendicularly to the cavity wall.
El. Separation surface between the two cement phases, el and e2, showing signs of having undergone sorne erosiono this surface must represent a temporary halt in the growth of the speleotheni ..
e2. Bladed calcitic cement with dull, zoned luminescence.
E2. The surface forming the boundary between the cements composing the speleothem and the sediment completing the filling of the cavity. This surface is different· morphologically from one sample to the next; sometimes it may contain acicular crystals with no signs of erosion, in another the surface may beclearly eroded; there are also an intermediate stages showingsigns of in-cipient erosiono ' .
SI. Luminescent, silty, internal sediment, frequently containing crystal fragments from the'final spe-leothem cement phase. .
This then is a simple sequence in which two speleothem growth phases alternate, one of them being non-Iuminescent and the other luminescent. Between these two phases erosion may have occurred and locally patches of micritic sediment are to be found. Another period of erosion took place, affecting sorne' cavities more than others and then the cavity was finally filled in with marine sedimentation. This is a very similar model to that proposed by Oarcía-Hernández et al. (l988b) for examples of Jurassic palaeokarsts in the External Subbetic (Priego sector).
1Ype 2 sequence
This sequence is more complex, involving as it do es numerous calcitic cement pr~cipitation phases during the formation of the speleothem. These alternated with periods of marine sedimentation. Non-Iúminescent cements predominate and what luminescence there is comes from sorne of the intercalated sediments and the final cement layer (Fig. 5B). The distribution sequence of the materials from the cavity wall towards its centre comprises the following phases:
el First generation of non-Iuminescent, fibrousradiaxial calcitic cemento
El First growth interruption, showing local signs of . erosiono
SIl Non-Iuminescent, carbonate, marine sediment, to be found in patches.
Rev. Soco Geol. Espafla, 3, (3-4) (1990)
402 C.JIMÉNEZ DE CISNEROS ET AL.
C2 Second generation of non-luminescent, fibrousradiaxial, calcitic cemento
E2 Second growth interruption, showing local signs of erosiono
Sh Non-luminescent, carbonate, marine cement, to be found in patches.
C3 Third generation of non-luminescent, fibrousradiaxial, calcitic cemento
E3 Third growth interruption, showing local signs of erosiono
Sh A fairly unbroken cover of luminescent, silty, marine sedimento
C4 Fourth generation of non-luminescent, fibrousradiaxial, calcitic cemento
SI4 An unbroken cover of luminescent, silty, marine cemento
1Ype 3 sequence
This sequence is to sorne extent similar to the one described aboye, although certain notable differences do existo As before, there is a sequence of cements with intercalations of marine sedim,ents between them. The major difference between this and the previous sequence is that the initial cement phase directly covering the wall shows characteristics pertaining to a vadose speleothem (Fig. 5C).
CI First generation of non-luminescent calcitic cement with speleothem texture.
C2 Bright luminescent, micritic cemento C3 Non-luminescent, fibrous-radiaxial calcitic
cemento El A probable interruption in speleothem growth.
Locally there is evidence of erosiono C4 Dull-luminescent, fibrous-radiaxial calcitic
cemento E2 Second growth interruption with local erosiono
SIl Non-luminescent, silty, marine sedimento Cs Bladed cement showing dull, zoned luminescence. E3 Third phase of growth interruptiC'n with local
signs of erosiono Sh Dull-luminescent, silty, marine sediment which
tops up the cavity.
A comparison between the three types of sequence.
A comparison of the three types of sequence (Fig. 5) reveals certain features in common. Sequences types
1 and 2 resemble each other in that they both have an initial phase or phases of non-luminescent, calcitic cement, followed by a luminescent one. The main difference between these two phases is that phase 2 is far more complicated in detail and contains alternating episo des of precipitation and sedimentation. The initial phases qf type 3 are somewhat different, on the other hand, with a first coating that may well correspond to a vadose speleothem, followed by a luminescent, micritic cemento After this initial stage, however, its history is similar to that of the others, with a covering of non-luminescent, fibrous-radiaxial, calcitic cement, followed by lurninescent cements (Fig. 6). In all three types the final filling, topping up the voids left in the cavities, is one of luminescent, marine cemento
4.2. 1hlce-element microanalysis data.
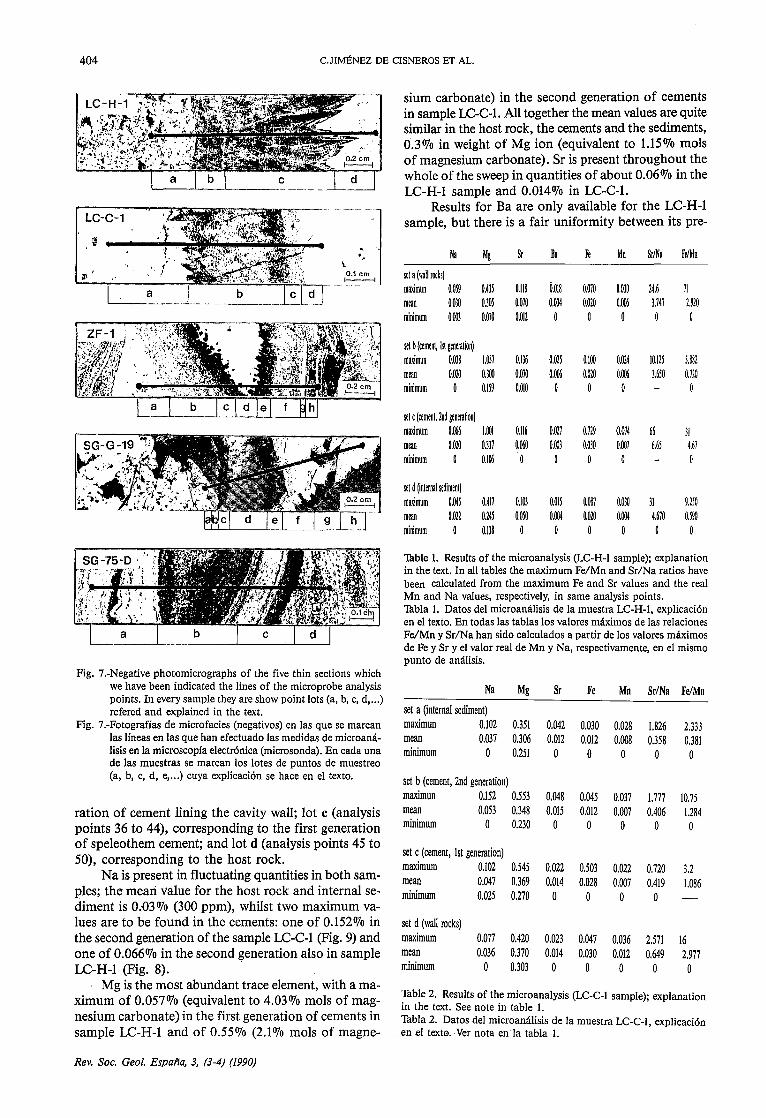
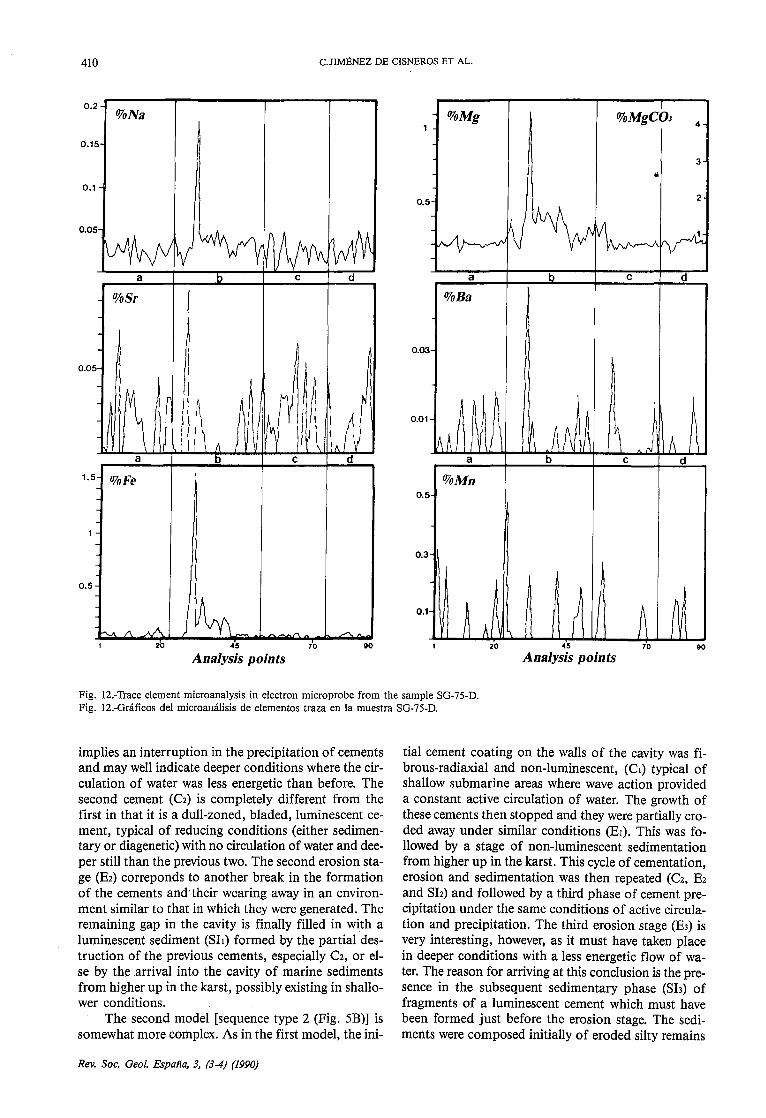
Figure 7 includes photographs of the five thin slices studied, with a line marked on them to denote the area analysed. The sweep was always from left to right and the distance between measurements 100 p.m. To provide a more rational treatment of the results we have divided each of the samples into various lots according to the material that the sweep passed through. The results are set out graphically in Figures 8,9,10,11, and 12, where the rnicroprobe diagrams are reproduced. We have at our disposal the data for 480 points of analysis, which corresponds to 3,000 numerical results. In order to simplify the interpretation of the results we include in Tables 1,2,3,4, and 5 the maximum, minimum and mean values for each element (expressed as a percentage) and for each of the different lots in each sample studied.
4.2.1. Samples lrom the north 01 the Sierra Gorda. These are the samples denoted with the initials LC
H-1 and LC-C-l. Four lots were defined in the thin slice LC-H-1 (Figs 7 and 8, and Table 1): lot a (analysis points 1 to 29), corresponding to the host rock; lot b (analysis points 30 to 49), corresponding to the first generation of cements; lot e (analysis points 50 to 132), corresponding to the second generation of cements; and lot d (analysis points 133 to 160), corresponding to the marine sediment filling up the cavity. Four lots have also been defined in thc slice LC-C-1 (Figs 7 and 9, and Table 2): lot a (analysis points 1 to 15), corresponding to the marine cement topping up the cavity; lot b (analysis points 16 to 35), corresponding to the second gene-
Fig. 6.-Colour photomicrographs of two different thin sections. Every pair (A-N and B-B') are sorne subject (A-A' = sample LC-E-! and B-B'= sample SG-75). The A and B photomicrographs are made with crossed polars and N-B' with cathodoluminescence. In N: C2 is the duIl-zoned-luminescence cement (secont cement growth layer) and S is the bright luminescence internal sedimento In B': C4 is duIl-luminescence cement (fourth cement growth layer) and Cs is duIl-zoned-luminescence cement (fifth cement growth layer). Scale bar = 0.2 mm.
Fig. 6.-Fotografías en color de dos láminas delgadas diferentes en las en cada pareja (A-N y B-B') se representa el mismo campo de visión con luz polarizada en microscopía normal y con luminiscencia. A y N.- Muestra LC-E-!. By B'.- Muestra SG-75. En la fotografía N: C2 es el segundo cemento el cual presenta luminiscencia zonada mate y S es el sedimento interno con luminiscencia brillante. En la fotografía B': C4 es la cuarta generación de cementos caracterizada por una luminiscencia mate y Cs es la quínta generación de cementos la cual muestra una luminiscencia zonada mate. En todas las fotografías la escala gráfica es 0.2 mm.
Rev. Soco Geol. España, 3, (3-4) (1990)
A GEOCHEMICAL STUDY ... 403
.j ...... :? , J:~
. ,
Rev. SOCo Geol. España, 3, (3-4) (1990)
404 C.JIMÉNEZ DE CISNEROS ET AL.
\
. . 0.1 cm I---l
Fig. 7.-Negative photomicrographs of the five thin sections which we have been indicated the Iines of the microprobe analysis points. In every sample they are show point lots (a, b, e, d, ... ) refered and explained in the text.
Fig. 7.-Fotografías de micro facies (negativos) en las que se marcan las líneas en las que han efectuado las medidas de microanálisis en la microscopía electrónica (microsonda). En cada una de las muestras se marcan los lotes de puntos de muestreo (a, b, e, d, e, ... ) cuya explicación se hace en el texto.
ration of cement lining the cavity wall; lot e (analysis points 36 to 44), corresponding to the first generation of speleothem cement; and lot d (analysis points 45 to 50), corresponding to the host rock.
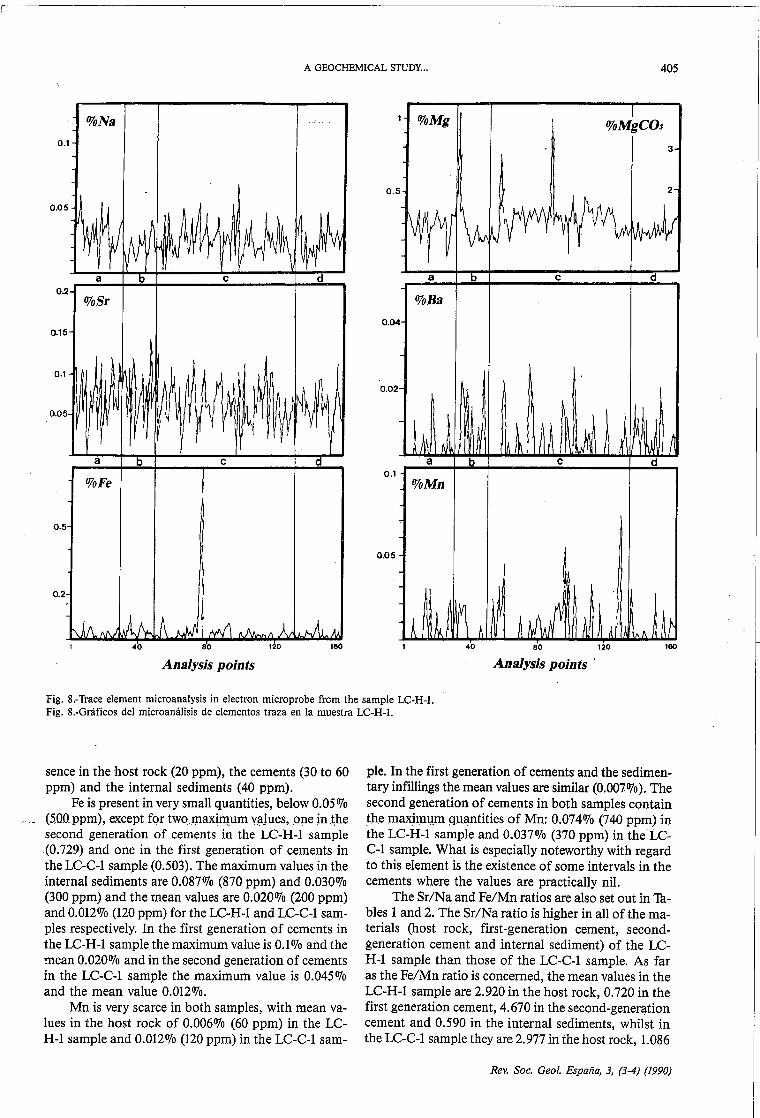
Na is present in fIuctuating quantities in both sampIes; the meari value for the host rock and internal sediment is 0 .. 030/0 (300 ppm), whilst two maximum values are to be found in the cements: one of 0.152% in the second generation ofthe sample LC-C-l (Fig. 9) and one of 0.066% in the second ~eneration also in sample LC-H-l (Fig. 8).
Mg is the most abundant trace element, with a maximum of 0.057% (equivalent to 4.03% mols of magnesium carbonate) in the first generation of cements in sample LC-H-I and of 0.55% (2.10/0 mols of magne-
Rev. Soco Geot. Espafla, 3, (3-4) (1990)
sium carbonate) in the second generation of cements in sample LC-C-l. All together the mean values are quite similar in the host rock, the cements and the sediments, 0.3% in weight of Mg ion (equivalent to 1.15% mols of magnesium carbonate). Sr is present throughout the whole of the sweep in quantities of about 0.06% in the LC-H-I sample and 0.014% in LC-C-l.
Results for Ba are only available for the LC-H-l sample, but there is a fair uniformity between its pre-
Na Mg Sr Ba Fe Mn SrlNa Fe/Mn
sel a (wall rocks) maxirnun 0.019 O.4JI o.m O.OIi 0,070 O.OJO 24.6 71
mean O.OJO OJOI 0,070 0.004 0.020 0,001 J.147 2.920 minimum O,ooJ 0,070 0,012 O O O O O
selb(cemenl,lslgeneralion) maximun O.OJi 1.017 O.ll6 0,021 0.100 0,024 10.121 l.ii2 mean 0,020 OJoo 0,070 0.001 0,020 0,001 l.610 0,720 minimum O 0.119 0,010 O O O O
sel c (cemenl, 2nd generalion) maximum 0,1JíQ 1.001 0,116 0,027 0,729 0,014 66 JI mean 0,020 OJll 0,060 O,OOl O,OlO 0.001 6.61 4.61 mínimum O 0.106 O O O O
seld(inlernalsedimeni) maximum 0,041 0.417 O.lOl 0,011 0,Oi1 O.OlO II 9,210 mean 0,022 0,241 0,010 0,004 0,020 0,004 4.670 0590 minimum O O.lli O O O O O O
Thble 1. Results of the microanalysis (LC-H-l sample); explanation in the texto In aIl tables the maximum Fe/Mn and Sr/Na ratios have been calculated from the maximum Fe and Sr values and the real Mn and Na values, respectively, in same analysis points. Thbla 1. Datos del microanálisis de la muestra LC-H-l, explicación en el texto. En todas las tablas los valores máximos de las relaciones Fe/Mn y Sr/Na han sido calculados a partir de los valores máximos de Fe y Sr y el valor real de Mn y Na, respectivamente, en el mismo punto de análisis.
Na Mg Sr Fe Mn Sr/Na Fe/Mn
set a (internal sediment) maximun 0.102 0.351 0.042 0.030 0,028 1.826 2.333 mean 0,037 0.306 0,012 0,012 0.008 0.358 0.381 minimum O 0,251 O O O O O
set b (cement, 2nd generation) maximun 0.152 0.553 0.048 0.045 0,037 1.777 10.75 mean 0.053 0.348 0.015 0,012 0.007 0.406 1.284 minimum O 0.230 O O O O O
set c (cement, 1st generation) maximum 0.102 0.545 0.022 0.503 0.022 0,720 3.2 mean 0.047 0.369 0.014 0.028 0.007 0.419 1.086 rninimum 0.025 0.270 O O O O
set d (wall rocks) maximum 0,077 0.420 0,023 0.047 0.036 2.571 16 mean 0.036 0.370 0.014 0,030 0.012 0.649 2,977 minimum O 0.303 O O O O O
Table 2. Results of the microanalysis (LC-C-I sample); explanation in the text. See note in table 1. Tabla 2. Datos del microanálisis de la muestra LC-C-I, explicación en .el texto. Ver nota en la tabla 1.
A GEOCHEMICAL STUDY ... 405
%Na %Mg %MgC03 0.1
3
0.5 2
0.05
a e 0.2
%Sr %Ba
0.04 0.15
0.1
~ 0.02
0.05
a b e 0.1
% Fe %Mn
0.5
0.05
0.2
Ana/ysis points Ana/ysis points .
Fig. S.-Trace element microanalysis in electron microprobe from the sample LC-H-!. Fig. S.-Gráficos del micro análisis de elementos traza en la muestra LC-H-!.
sence in the host rack (20 ppm), the cements (30 to 60 ppm) and the internal sediments (40 ppm).
Fe is present in very small quantities, below 0.05070 ",_ (50.0 ppm), except fQr two¡paxiIl1um vaJues,one in the
second generation of cements in the LC-H-l sample (0.729) and one in the first generation of cements in the LC-C-l sample (0.503). The maximum values in the internal sediments are 0.087% (870 ppm) and 0.030% (300 ppm) and the mean values are 0.020% (200 ppm) and 0.012% (120 ppm) for the LC-H-l and LC-C-l sampIes respectively. In the first generation of cements in the LC-H-l sample the maximumvalue is 0.1 % and the mean 0.020% and in the second generation of cements in the LC-C-l sample the maximum value is 0.045% and the mean value 0.012%.
Mn is very scarce in both samples, with mean values in the host rock of 0.006% (60 ppm) in the LCH-l sample and 0.012% (120 ppm) in the LC-C-l sam-
pIe. In the first generation of cements and the sedimentary infillings the mean values are similar (0.007%). The second generation of cements in both samples contain the maxinlllm q:uantities of Mn: 0.074% (740 ppm) in the LC-H-l sample and 0.037% (370 ppm) iti theLCC-l sample. What is especially noteworthy with regard to this element is the existence of sorne intervals in the cements where the values are practically nil.
The Sr/Na and Fe/Mn ratios are also set out in TabIes 1 and 2. The Sr/Na ratio is higher in all of the materials (host rack, first-generation cement, secondgeneration cement and internal sediment) of the LCH-l sample than those of the LC-C-l sample. As far as the Fe/Mn ratio is concerned, the mean values in the LC-H-l sample are 2.920 in the host rock, 0.720 in the first generation cement, 4.670 in the second-gener~tion cement and 0.590 in the internal sediments, whilst in the LC-C-l sample they are 2.977 in the host rack, 1.086
Rev. SOCo Geol. España, 3, (3-4) (1990)

406 C.JIMÉNEZ DE CISNEROS ET AL.
%Na 0.1
d
%Sr
0.04
0.02
0.01
%Fe
0.4
0.3
0.2
0.1
10 20 30 40
Analysis points
0.5
0.4
0.3
0.2
0.1
0.03
0.02
0.01
%Mg
%Mn
Sr 400 cts Ca 40000 cts
, % MgCOJ 2
d 50
c~ ____ ~ __ ~ __ ~ __ ~~ 226 4 582
Analysis points
Fig. 9.-Trace element microanalysis in electron microprobe from the sample LC-C-l. C.- Qualitative data in a line from same sample. Fig. 9.-Gráficos del micro análisis de elementos traza en la muestra LC-C-l. C.- Corresponde a una parte de un barrido cualitativo efectuado
en la misma muestra.
in the first-generation cement, 1.284 in the second cement samp1e and 0.381 in the interna1 sediments.
4.2.2.- Samples irom the south oi the Sierra Gorda. These sarnp1es are those denoted by the initia1s
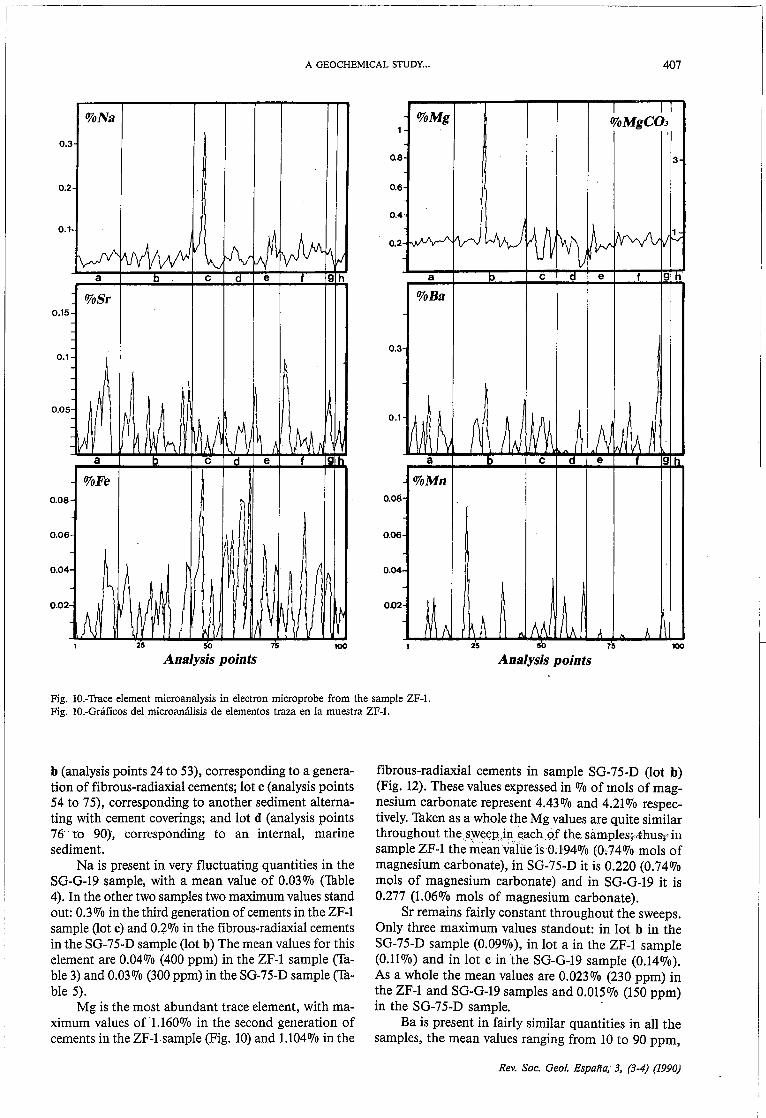
ZF-l, 80-0-19 and 80-75-D. Eight 10ts have been defined for samp1e ZF-l (Figs 7 and 10, and Tab1e 3): 10t a (ana1ysis points 1 to 16), corresponding to marine sediment; 10t b (ana1ysis points 17 to 42), corresponding to the second generation of cements; 10t e (ana1ysis points 43 to 53), corresponding to the third generation of cements; 10t d (ana1ysis points 54 to 64), corresponding to silty sediments filling in the cavity; 10t e (ana1ysis points 65 to 74), corresponding to the third generation of cements; 10t f (ana1ysis points 75 to 91), 'corresponding to the second generation of cements; 10t g (ana1ysis points 92 to 94), corresponding to a silty sediment; and 10t h (ana1ysis points 95 to 100), corresponding to
Rev. Soco Geol. Espafla, 3, (3-4) (1990)
the first generation of cements. We have a1so assigned eight 10ts to the 80-0-19 samp1e (Figs 7 and 11, and Jable 4): 10t a (ana1ysis points 1 and 2), corresponding to the host rock; 10t b (ana1ysis points 3 to 5), corresponding to the first generation of cements; 10t e (ana1ysis points 6 to 10), corresponding to the second generation of cements; 10t d (ana1ysis points 11 to 31), corresponding to the first generation of cements; 10t e (ana1ysis points 32 to 38), corresponding to the second generation of cements; 10t f (ana1ysis points 39 to 58), corresponding to an interna1, 1aminated cement filling in the cavity; 10t g (ana1ysis points 59 to 71), corresponding to the second generation of cements; and 10t h (ana1ysis points 72 to 80), corresponding to another interna1 (un1aminated) cemento Four 10ts have been distinguished in the 80-75-D samp1e (Figs 7 and 12, and Jable 5): 10t a (analysis points 1 to 23), corresponding to a sediment that alternates with coats of cement; 10t
A GEOCHEMICAL STUDYooo 407
%Na %Mg I I I %MgC03
00 3
I Q8 ,
3 ,
002 006
004
1
WA ~~tI ~ ~ 1I Vv "'v
00 ~ ~WVJ M ~ ~ l(vvVv v~ 002
a e d e f 9h a -º- e -º- e f 9 h
%Sr %Ba 0.15
0.3 0.1 I
,
A
I~ VI M ~ h ~ ,~I ~ ~ ~A IJ
0005
I~~ ~ ~ Jm fIlA b }) ~ lA! 0.1
a b e d e f ]j a b e -º- e i 9Lh
%Fe %Mn 0.08 0.08
0.06 0006
Il ~
t
M \~~ \ ~ V ~ r rJ lA
0.04
0002
j f, hl -.n M L1 ..A -.A. 11 ~
0.04
0.Q2
25 50 75 25 50 75
AnaJysis points AnaJysis points
Figo lOo-Trace element microanalysis in electron microprobe from the sample ZF-l. Figo lOo-Gráficos del microanálisis de elementos traza en la muestra ZF-l.
b (analysis points 24 to 53), corresponding to a generation of fibrous-radiaxial cements; lot e (analysis points 54 to 75), corresponding to another sediment alternating with cement coverings; and lot d (analysis points 76 'lo 90), corresponding to an internal, marine sedimento
Na is present in very fluctuating quantities in the SG-G-19 sample, with a mean value of 0.030/0 (Thble 4). In the other two samples two maximum values stand out: 0.3% in the third generation of cements in the ZF-l sample (1ot e) and 0.2% in the fibrous-radiaxial cements in the SG-75-D sample (1ot b) The mean values for this element are 0.04% (400 ppm) in the ZF-l sample (Table 3) and 0.03% (300 ppm) in the SG-75-D sample (Table 5).
Mg is the most abundant trace element, with maximum values of 01.160% in the second generation of cements in the ZF-lsample (Fig. 10) and 1.104% in the
fibrous-radiaxial cements in sample SG-75-D (1ot b) (Fig. 12). These values expressed in % of rnols of magnesium carbonate represent 4.43 % and 4.21 % respectively. Taken as a whole the Mg values are quite similar throughout the,s\Ve~p,.in eoachof the. samplesHhusr in sample ZF-l the ÍneanvalueisO;194% (O~74% mols of magnesium carbonate), in SG-75-D it is 0.220 (0.74% mol s of magnesium carbonate) and in SG-G-19 it is 0.277 (1.06% mols of magnesium carbonate).
Sr remains fairly constant throughout the sweeps. Only three maximum values standout: in lot b in the SG-75-D sample (0.09%), in lot a in the ZF-l sample (0.11%) and in lot e in the SG-G-19 sample (0.14%). As a whole the mean values are 0.023% (230 ppm) in the ZF-l and SG-G-19 samples and 0.015% (150 ppm) in the SG-75-D sample.
Ba is present in fairly similar quantities in all the samples, the mean values ranging from 10 to 90 ppm,
Rev. SoCo Geot. España; 3, (3-4) (1990)
408 C.JIMÉNEZ DE CISNEROS ET AL.
Ni Mg Sr Ha Fe Mn Sr/Na Fe/Mn
sel a (inlernal sedimen!) maximun 0,011 0.241 0,112 0.011 0.011 0,014 1.6 31
mean 0.036 o.m 0,0ll 0.004 0.013 0.003 0.9 1.111
minimum 0.011 0.111 O O O O O O
sel b (cemenl, 2ndgeneralion) maximun O.&il 1.160 0.091 O.olO 0.044 0.071 I.J 11
mean 0,031 0.140 0.014 O,OOJ 0.011 0.001 1.109 o,m minimum 0,001 0.111 O O O O O O
selc (cemenl, 3rdgeneralion) maximum 0.J29 0.J72 0.042 0.011 0.097 0.03l l.l 11
mean 0,061 0.191 0.011 0.006 0.013 0.004 0.109 1.911
minimum 0.012 0.014 O O O O O O
sel d (inlernal silly sedimenl) maximum 0.&i1 0.116 O.OlO 0.013 0.091 0.01l 1.1 11
mean O.OJl 0.111 0,011 0.001 0.041 0.001 051 1.91
minimum 0~11 0.038 O O O O
sele (cemenl,3rdgeneralion) maximun 0.098 0.J21 0.011 0,009 0.013 0.006 4.01 8.8
mean 0.041 0.143 0.011 0.003 0.011 O 0.61 0.883
minimum 0.009 0.062 O O O O O O
sel f(cemenl, 2ndgeneralion) maximum 0.1190 0.211 0.101 0.034 0.012 0.l1li8 4.4 43
mean 0.041 0.190 0.019 0.004 0.011 O 0.634 2.m
minimum 0.018 0.011 O O O O O O
selg(inlernalsillysedimenl) maximum 0.011 o.m 0.014 0.031 0,019 1.l1l 1.14
mean 0.044 0.190 0.044 0.024 0.006 0.942 0.61
minimum 0.031 0.142 0.023 O O 0.6l1 O
sel h (cemem, ISI generalion) maximum 0.049 0.134 0.031 0.010 0.023 4
mean 0.031 0.20l 0.019 0.002 0,014 1.226
rninimum 0.001 0.111 O O 0,002 O
Table 3. Results of the microanalysis (ZF-l sample); explanation in the texto See note in table 1. Tabla 3. Datos del microanálisis de la muestra ZF-l, explicación en el texto. Ver nota en la tabla 1.
although at many points it exists in insufficient quantities to be detected by the microprobe.
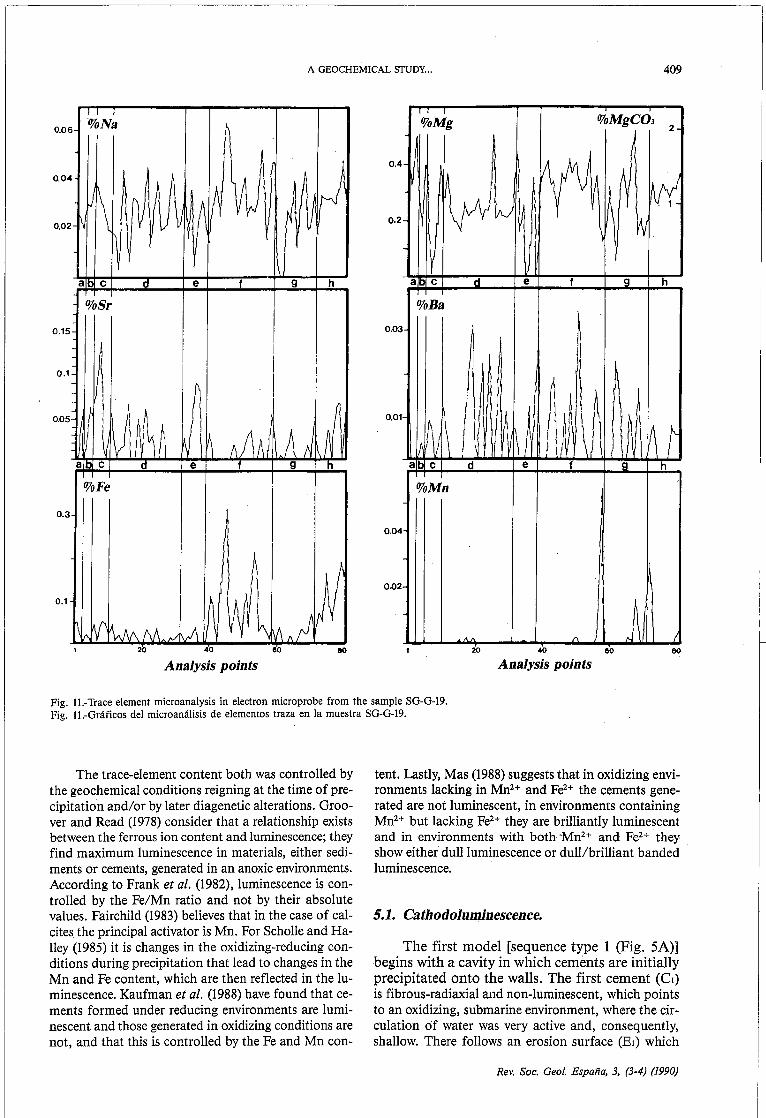
Fe is present in quantities of les s than 0.050/0 except for a maximum of 1.525% detected in lot b in the sample SO-75-D (Fig. 12 and Table 8). There are also three lesser maxima in the sediments filling the cavities: 0.31% and 0.12% in SG-G-19 (Fig. 11 and Table 4) and 0.1 % in ZF-l (Fig. 10 and Th.ble 3). Mn is very scarce in aH of the samples, very often with ni! values, aboye aH in the cements.
The maximum values for the Sr/Na ratio are 22 in lot e in the SO-0-19 sample (Thble 4), 10 in lot e in the SO-75-D sample (Table 5) and 8 in lot b in the ZF-l sample (Table 3). The average values for this ratio for each sample and each lot are set out in Tables 3, 4 and 5. The maximum values for the Fe/Mn ratio are 172
Rev. SoCo Geol. Espafla, 3, (3-4) (1990)
Na Mg Sr Ha Fe Mn Sr/Na Fe/Mn
sel a (wall roás) maximun 0.016 0.411 0,011 0.041 mean 0.011 0.J11 0.009 0.042 minimum 0.02l 0.J13 O 0.036
sel b(cemenl, ISlgeneralion) maximun 0,030 0.490 0,060 0,004 0.019 l.1l mean 0.016 0.J21 0.031 0,001 0.014 1.606 minimum O.olO 0.113 O O 0.001 O
sel e (cemenl, 2nd generallon) maximum 0.039 0.403 0.138 0.009 0.041 4.6 mean 0.030 0.210 o.ol1 0.003 0.019 1.133
rninimum 0.019 0.016 O O O,ool O
sel d (cemenl, Isl generalion) maximum 0.044 0501 0.&i3 0.031 0.042 0,001 10.1 12 mean 0,024 0.246 0,011 0.001 0,013 O 1.Il4 2.142 minimum 0.003 0.111 O O O O O O
sele (cemenl,2ndgeneralion) maximun 0.040 0,448 0.011 0,011 0,036 0,001 22 10 mean 0.014 0.119 0,032 0.006 0.011 O J.i91 1.421 minimum 0.004 0,001 O O O O O O
self(inlern~sillysedimen!)
maximum 0.063 0,441 0.Ol3 0.034 0.J09 0.013 2.142 18.1 mean 0.031 0.J20 0,011 0.006 0,081 0.002 0.J61 1.133 minimum 0.014 0.126 O O O O O O
selg(cemenl,2ndgeneralion) maximum 0.043 o,m 0.010 0,022 0.011 0,018 1.l41 2.4 mean 0.021 0.266 0,010 0,001 0,011 0.004 0.J94 0.181 minimum O 0.013 O O O O O O
selh(inlernalsedimenl) maximum 0,041 0.J61 0.064 0,008 0,206 0.004 2.0J4 2.4 mean 0,031 O.JOI 0,023 0,003 0.121 O 0.114 0.111 rninimum 0,029 0.214 O O 0.013 O O
Thble 4. Results of the microanalysis (SG-G.-19 sample); explanation in the texto See note in table 1. Thbla 4. Datos del micro análisis de la muestra SG-G-19, explicación en el texto. Ver nota en tabla 1.
in lot b in the SO-75-D sample, 78 in lot d in the ZF-l sample and 58 in lot fin the SO-G-19 sample. The mean values also appear in Tables 3, 4 and 5.
S. INTERPRETATION OF THE RESULTS
In the interpretation of the resuIts we have taken into account the values obtained for each lot in each sample by aH the various experimental techniques employed. In this section we intend to formulate a global genetic model, integrating aH of our resuIts and those of the previous isotope study carried out by Jiménez de Cisneros (1989). We the view this genetic model within the framework of the palaeogeography and general evolution of the Jurassic Subbetic basin.
A GEOCHEMICAL STUDY ... 409
. " , %Na 0.06
%Mg %MgCOJ 2
O.O~
0.02 0.2
a e d e 9 h a e d e 9 h
%Sr %Ba
I
\ I
t I~ H r V1y¡ I~~ N \~ A/lA! .A!1
0.15
0.1
0.05
0.03
0.01
a e e 9 a e d e h
%Fe %Mn
0.3
0.04
0.02
0.1
/\ I 20 40 eo 110 20 eo 80
Ana/ysis points Ana/ysis points
Fig. ll.-Trace element microanalysis in electron microprobe from the sample 8G-G-19. Fig. ll.-Gráficos del micro análisis de elementos traza en la muestra 8G-G-19.
The trace-element content both was controlled by the geochemical conditions reigning at the time of precipitation and/or by later diagenetic alterations. Oroover and Read (1978) consider that a relationship exists between the ferrous ion content and luminescence; they find maximum luminescence in materials, either sediments or cements, generated in an anoxic environments. According to Frank et al. (1982), luminescence is controlled by the Fe/Mn ratio and not by their absolute values. Fairchild (1983) believes that in the case of calcites. the principal activator is Mn. For Scholle and HaIley (1985) it is changes in the oxidizing-reducing conditions during precipitation that lead to changes in the Mn and Fe content, which are then reflected in the luminescence. Kaufman et al. (1988) have found that cements formed under reducing environments are luminescent and those generated in oxidizing conditions are not, and that this is controIled by the Fe and Mn con-
tent. Lastly, Mas (1988) suggests that in oxidizing environments lacking in Mn2+ and Fe2+ the cements generated are not luminescent, in environments containing Mn2+ but lacking Fe2+ they are brilliantly luminescent and in environments with both "Mn2+ and Fe2+ they show either dullluminescence or dull/brilliant banded luminescence.
5.1. Cathodoluminescence.
The first model [sequence type 1 (Fig. 5A)] begins with a cavity in which cements are initially precipitated onto the walls. The first cement (el) is fibrous-radiaxial and non-Iuminescent, which points to an oxidizing, submarine environment, where the circulation df water was very active and, consequently, shallow. There follows an erosion surface (El) which
Rev. Sac. Geat. España, 3, (3-4) (1990)
410 C.JlMÉNEZ DE CISNEROS ET AL.
0.2 %Na %Mg
0.15
0.1
0.05
a
%Sr %Ba
0.03
0.05
~AI Al
0.01 1\
V \! a
1.5 %Fe %Mn 0.5
0.3
0.5
0.1
20 45 70 90 20
Analysis points
J;l_
I %MgCOJ
e
~ .Af\J J J'j A b e
i lJ 45 70
Analysis points
4
3
d
\ d
90
Fig. 12.-Trace element microanalysis in electron microprobe from the sample SG-75-D. Fig. 12.-Gráficos del microauálisis de elementos traza en la muestra SG-75-D.
implies an interruption in the precipitation of cements and may well indica te deeper conditions where the circulation of water was less energetic than before. The second cement (e2) is completely different from the first in that it is a dull-zoned, bladed, luminescent cement, typical of reducing conditions (either sedimentary or diagenetic) with no circulation of water and deeper still than the previous two. The second erosion stage (E2) correponds to another break in the formation of the cements and·their wearing away in an environment similar to that in which they were generated. The remaining gap in the cavity is finally filled in with a luminescent sediment (SIl) formed by the partial destruction of the previous cements, especially e2, or else by the .arrival into the cavity of marine sediments from higher up in the karst, possibly existing in shallower conditions.
The second model [sequence type 2 (Fig. 5B)] is somewhat more complexo As in the first model, the ini-
Rev. SOCo Geol. Espafla, 3, (3-4) (1990)
tial cement coating on the walls of the cavity was fibrous-radiaxial and non-Iuminescent, (el) typical of shallow submarine areas where wave action provided a constant active circulation of water. The growth of these cements then stopped and they were partially eroded away under similar conditions (El). This was followed by a stage of non-Iuminescent sedimentation from higher up in the karst. This cycle of cementation, erosion and sedimentation was then repeated (e2, E2 and Sh) and followed by a third phase of cement precipitation under the same conditions of active circulation and precipitation. The third erosion stage (E3) is very interesting, however, as it must have taken place in deeper conditions with a les s energetic flow of water. The reason for arriving at this conclusion is the presence in the subsequent sedimentary phase (SI3) of fragments of a luminescent cement which must have been formed just before the erosion stage. The sediments were composed initially of eroded silty remains

A GEOCHEMICAL STUDY ... 411
Na Mg Sr Ba Fe Mn Sr/Na FelMn
sela(eemenls) maximun 0,041 0,148 0,076 0,018 0,097 O,Oll 1,777 4,9 mean o.Oll 0.191 0,016 0,004 O.1l O,OOl 0,694 0.J7l minimum 0,007 O.llO O O O O O O
selb(eemenls) maximun 0.176 1.104 0,094 0,048 1.11l O,all 4.476 171 mean O,Oll 0.J14 0,011 0,004 0.114 O,OOl 0.J97 minimum 0,1107 O.l4l O O O O O
selc(sedimenlandcemenl) maximum 0,046 0.J44 0,064 0,028 O,O4l 0,017 10 1.1l9 mean 0,011 0.191 0,019 O,OOl 0,014 O,lIOl 1.189 minimum O 0.141 O O O O O
seld(eemenl,lslgenernlion) maximum 0,048 O,lll 0,061 0,017 0,048 0,018 1611 1,8l7 mean 0,016 0.194 O,OIJ 0,1101 0,018 O,lIOl 0,6ll 0.416 minimum 0,1108 O.l1l O O O O O O
Table 5. Results of the microanalysis (SG-75-D sample); explanation in the text. See note in table 1. Tabla 5. Datos del microanálisis de la muestra SG-75-D, explicación en el texto. Ver nota en tabla 1.
of this luminescent cement and then a non-luminescent cement generated higher up in the karst in shallower, more energetic, marine conditions. The fourth cement coating (C4) was generated once more under shallow, oxidizing, marine conditions with considerable wave action, but the following erosion-sedimentation cyeIe (E4 and SI4) bears witness to yet another deepening of the marine conditions, with fragments of a pre-erosion, luminescent cement included in the final sedimentary filling, composed of the detritus from the destruction of the previous cements.
The third and final model [sequence type 3 (Fig. 5C)] began in a very different way from the first two; the first cement (Cl) is calicheform in aspect, similar to a speleothem generated under vadose conditions, and indeed in sorne places morphologies proper to stalacLÍtes are to be found. This first cement may well then have been formed in very oxidizing, aerial or subaerial conditions. The second stage of cement precipitatiou {C2) also differs from the others. It is a micritic cement, induced possibly by organic activity and generated in very shallow marine conditions; its luminescence, due to the incorporation of Mn, was probably enhanced by organic fixation. From this stage onwards the filling of the cavity took a similar course to those previously described with the precipitation of a third cement (C3) under shallow marine conditions with adequate wave action. The first erosion phase (El) occurred at greater depths and was followed by a dull~luminescent, fibrousradiaxial cement, which must have precipitated in a reducing enviroment with virtualIy no circulation of water. This cement was interrupted by a second erosion stage (E2), folIQwed. by a non~luminescent, marine sediment (SIl), which may have been carried by currents into the cavity from shallower reaches. At this time con-
ditions became· deeper still and a bladed cement coa-ting with dull-zoned luminescence (Cs), typical of completely calm, reducing conditions, was deposited on the erosion surface (Fig. 6). When subsaturation was reached cement growth was interrupted once again and a new erosion phase began (E3). The remaining gap in the cavity was finally topped up by a sediment (S12) composed mainly of the detritus of Cs, probably un-der the same conditions in which it was generated.
The proposed models share one very interesting feature: they all bear witness to fIuctuations in the re-lative sea level, varying as they do from episodes of pre-cipiÜttion in very shallow, oxidizing, conditions with wa-ve arid current activity, to periods of deeper, reducing conditions with little or no circulation of the sea wa-ter. The several changes in sea level postulated in the models for sequences 2 and 3 can be readily explained with reference to their regional geological context. While in the northern part of the Sierra Gorda (sequence 1) the cavities were filled up in a relatively short time (upper-Liassic), in the southern area (types 2 and 3) they took much longer to fill [from the upper-Liassic to the Kimmeridgian, according to García-Hernández et al. (1986-1987b)].
5.2. Trnce-element microanalysis.
There is a clear difference between the Mg, Mn, FI;;, Sr, Na and Ba contents of the host rocks and those of the speleothems and cements coating the walls of the cavities and the internal sediments. Here we analyse the relationships between several of these elements (Fe/Mn, Fe/Mg/Mn and Sr/Na) to check the accuracy of our interpretation of events.
Magnesium.- In all the samples we are dealing fundamentally with a calcite in which the major trace element is Mg, at a maximum of 1.057070 in the north of the sierra, in lot b (first generation cements) ofthe LC-C-l sample and two maxima in the south of the sierra, 1.104% in lot b ofthe SG-75-D sample and 1.160% in lot b of the ZF-l sample. These maximals values are equivalent to 4.03%,4.21% and 4.43% mols of magnesium carbonate respectively. They correspond then to low-magnesian calcites (LMC sensu Winland, 1969). It can be seen that both the maximum values and the greatest variations are to be found in the cements. This might be put down to the changes in the chemistry of the wa¿er with the passing of time or to a vadose infIuence, pointed to by the presence of radiaxial cements (Prezbindowski, 1985). James and Klappa (1983) in dicate that fibrous, calcitic cements have around 2 % mols of magnesium carbonate, whilst the bladed and blocky ones range between 0.2% and 2.2% molso Nevertheless, several authors (Benson and Mattews, 1971; Benson, 1974) have reported that in areas subject to vadose influence the cements have magnesium carbonate values of between 2% and 6% mols, with an average of 4% mols, while those in the phreatic zone have much 10-
Rev. Soco Geol. España, 3, (3-4) (1990)

412 C.JIMÉNEZ DE CISNEROS ET AL.
wer proportions (between 0.50/0 and 2.0% mols). Our results, both for the host rock and the cements, give mean values ofO.3% weight ofmagnesiumion (1.15% mols of magnesium-carbonate), which is more proper to the phreatic zone than the vadose one. Furthermore, the variations in the Mg content can be put down to alterations in the chemistry of the water due to eustatic changes (Renard, 1985, 1987).
Manganese.- The Mn content in all the samples is very low. There is a manifest difference in the content of this mineral in the cements, the sediments and the host rocks; the highest values occur in the luminescent cements and the lowest in the sediments and host rock, apart from sorne intervals of non-Iuminescent cement where there is no Mn whatsoever. Our results also show a clear difference between the samples from the north and south of the sierra. The mean values range between 0.002% and 0.006% (20 to 60 ppm) in the south (including the phases where Mn is completely absent), while to the north they are higher, 0.024%, 0.037% and 0.074% (240, 370 and 740 ppm). These resuIts are very similar to those found by Flügel (1982) in the carbonates of the Permian platform to the south of the Alps. This author relates the Mn content to the insolubleresidue fraction and suggests that it is transported with the siliceous clastic particles and incorporated at a later date into the carbonate phase. Thus, a low Mn content might reveal the degree of continental influence and would be reflected in the nil or almost nil values in sorne of the cements, indicating the possible intervention of fresh water in the sedimentation process. The absence of Mn from the non-Iuminescent cements in the sampIes from the southern sector may well be explained by the fact that the emersion were greater, more sustained and more repetitive in this area than to the north (Vera et al., 1988).
Iron.- Fe is present in fairly constant quantities throughout the sierra, with mean values of between 0.01 and 0.03 (100 and 300 ppm). Nevertheless it can be said that this mineral reaches maximum values in the cements forming the speleothems in both sectors. Thus in certain specific surfaces of the LC-C-1 and LC-H-1 sampIes the maxima are 0.729% and 0.503% respectively, whilst in the SG-75-D sample a maximum of 1.525% is to be found, also in one specific cement surface. This higher Fe content may well be due to the circulation of the interstitial water richer in iron than the normal sea water. James and Klappa (1983) believe that superficial water may contain higher levels of Fe than deeper waters. It is also possible that the alternations between oxidizing and reducing conditions were responsible for the variations in iron content in the cements. Whatever the truth of the matter these data are difficult to interpret on their own as both the ferric and ferrous values are lumped together, making it impossible to distinguish oxidizing from reducing episodes. Furthermore, the frequent interruption surfaces in the cement growths might provide anomalous values and so distort the final results.
Rev. Soco Geol. Espafla, 3, (3-4) (1990)
Fe/Mn ratio.- The Fe/Mn ratio is one of the geochemical factors that influences the luminescence of the carbonates (Frank et al., 1982; Hemming et al., 1989; Sun, 1990) and is itself controlled by the oxidizing/reducing conditions of the environment (Lohmann, 1988; Barnaby and Rimstidt, 1989). Sorne authors also use this ratio as a criterion when deciding the extent oí any possible continental influence on the sediments (Grover and Read, 1983), a1though others deny its validity in this respect (Miller, 1986; Sun, 1990). In this study the values of this ratio are of special interest with regard to the two generations of calcitic cements that form the speleothems in the samples from the northern sector of the sierra, where the values in the non-Iuminescent, first-generation cements are much lower (0.72-1.086) than those in the luminescent, second-generation (1.284-4.67).
Frank et al. (1989) established that: 1) it is the Fe/Mn ratio and not the absolute quantities of Fe2+
and Mn2+ that controls the intensity of the luminescence (this is not quite true, as Hemming et al. showed in 1989); 2) calcites with Fe/Mn ratios of less than 1.0 show brilliant or very brilliant luminescence, while those with ratios of more than 1.0 are generally weakly luminescent, that is to say, just the opposite to what we have found in the samples from the northern sector of the Sierra Gorda (LC-C-1 and LC-H-1).
Hemming et al. (1989), in a valuable study in which theycollate previous data from other authors and provide new information of their own, state that: 1) the intensity of cathodoluminescence has a good positive correlation with the concentrations of Mn, and a negative correlation with the quantities of Fe present and the Fe/Mn ratio, as Kaufman et al. (1988) and Mas (1988), among others, had already established. Neither is this interpretation in accord with the cathodoluminescence evidence of the LC-C-1 and LC-H-1 samples from the Sierra Gorda; 2) the cathodoluminescence intensities show an excellent correlation with the concentrations of Mn at approximately constant Fe/Mn ratios within a narrow range of Fe contents (0.76-0.97) and they are a function not only of the Fe/Mn ratio but also of the absolute quantities of Fe and Mn present; 3) even with a constant Fe/Mn ratio the cathodoluminescence intensities can vary considerably, especially at low values. In fact, the Fe/Mn ratio controls the maximum intensity luminescence, while below this maximum, at constant Fe/Mn values, it is the maximum quantities of Mn and Fe that control the luminescence.
Given this discrepancy between Hemming's findings and the results provided by our LC-C-1 and LCH-1 samples, we have made a more detailed study (Jiménez de Cisneros et al., in preparation) to try and find a coherent interpretation. We have plotted the data from Thbles 1 and 2 for the LC-C-1 and LC-H-1 samples in the diagram for luminescent calcite fields proposed by Hemming et al. (1989). If we compare of the microanalysis graphs for Fe and Mn (Figs. 8 and 9) of the LCH-1 and LC-C-1 samples it can be seen that in the second generation cement (zone c), although the Fe values corresponding to those for maximum Mn are
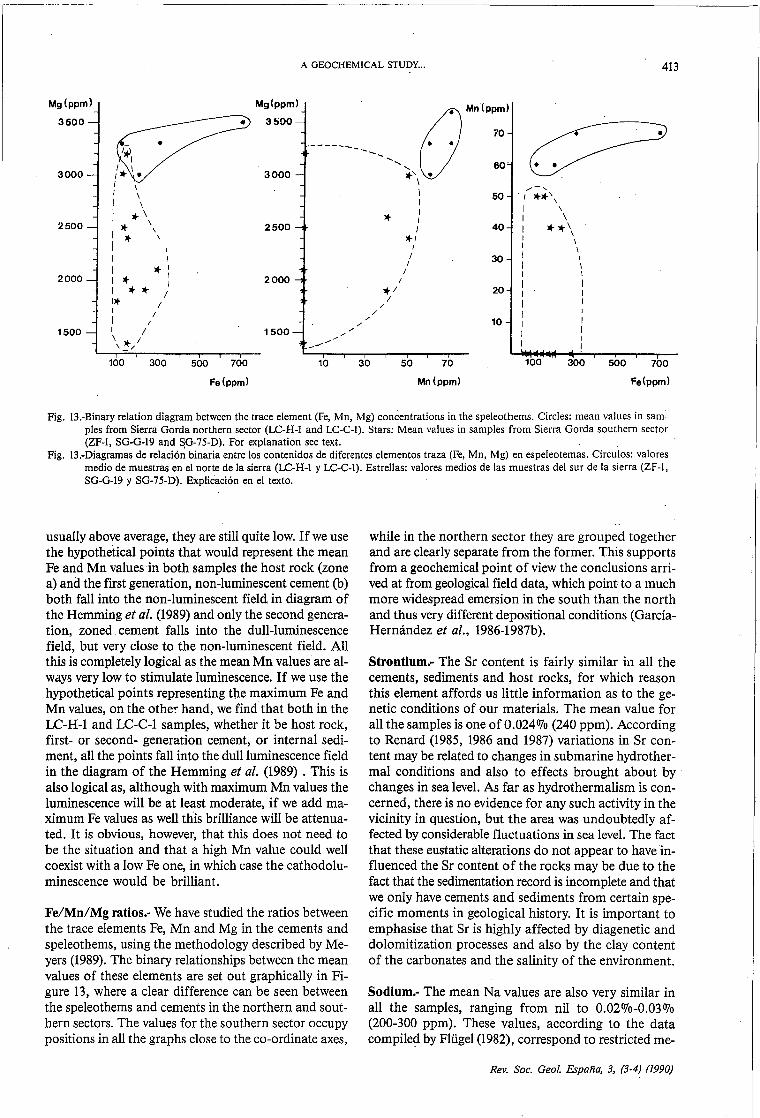
A GEOCHEMICAL STUDY ... 413
Mg (ppm) Mg(ppm)
3500 ., 3bOO, 70 •
o Mn'ppml
-------._-- .. .... ,
50' • • , 3000 3000 *' •
\ \ 1
/-,
\ 50 . , **\ \ 1 *' 1 1 \
* , \ 2500 * \ , 2500 , 40 **\
* \ *, \ \
, \
\ I 30 \
*\ I , \
/ \ 2000 * 1 2000 I 1
i * * / */ 20 1 1* / 1 / /
/ /
I " 10 " 1500 I / 1500 ..- " \ * I _/ ~
'-/ -100 300 500 700 10 30 50 70 100 300 500 700
Fe (ppm) Mn(ppm) Fe(ppm)
Fig. l3.-Binary relation diagram between the trace element (Fe, Mn, Mg) concentrations in the speleothems. Circles: mean values in sampIes from Sierra Gorda northern sector (LC-H-I and LC-C-I). Stars: Mean values in samples from Sierra Gorda southern sector (ZF-I, SG-G-19 and SG-75~D). For explanation see text.
Fig. l3.-Diagramas de relació~ binaria entre los contenidos de diferentes elementos traza (Fe, Mn, Mg) en espeleotemas. Círculos: valores medio de muestras en el norte de la sierra (LC-H-I y LC-C-I). Estrellas: valores medios' de las muestras del sur de la sierra (ZF-I, SG-G-19 y SG-75-D). Explicación en el texto.
usually aboye average, they are still quite low. If we use the hypothetical points that would represent the mean Fe and Mn values in both samples the host rock (zone a) and the first generation, non-Iuminescent cement (b) both fall into the non-Iuminescent field in diagram of the Hemming et al. (1989) and only the second generation, zoned cement falls into the dull-Iuminescence field, but very close to the non-Iuminescent field. All this is completely logical as the mean Mn values are always very low to stimulate luminescence. If we use the hypothetical points representing tl1e maximum Fe and Mn values, on the othe~ hand, we findthat both in the LC-H-1 and LC-C-1 samples, whether it be host rock, first- or second- generation cement, or internal sediment, all the points fall into the dullluminescence field in the diagram of the Hemming et al. (1989) . This is also logical as, although with maximum Mn values the luminescence will be at least moderate, if we add maximum Fe values as well this brilliance will be attenuated. It is obvious, however, that this does not need to be the situation and that a high Mn value could well coexist wíth a low Fe one, in which case the cathodoluminescence would be brilliant.
Fe/Mn/Mg ratios.- We have studied the ratios between the trace elements Fe, Mn and Mg in the cements and speleothems, using the methodology described by Meyers (1989). The binary relationships between the mean values of these elements are set out graphically in Figure 13, where a clear difference can be seen between the speleothems and cements in the northern and southern sectors. The values for the southern sector occupy posítions in all the graphs close to the co-ordinate axes,
while in the northern sector they are grouped together and are clearly separate from the former. This supports from a geochemical point of view the conclusions arrived at from geological field data, which pointto a much more widespread emersion in the south than the north and thus very different depositional condítions (GarcíaHernández et al., 1986-1987b).
Strontium.- The Sr content is fairly similar in all the cements, sediments and host rocks, for which reason this element affords us Httle information as to the genetic condítions of our materials. The mean value for all the samples is one of 0.0240/0 (240 ppm). According to Renard (1985, 1986 and 1987) variations in Sr content may be related to changes in submarine hydrothermal condítions and also to effects brought about by changes in sea level. As far as hydrothermalism is concerned, there is no evidence for any such activity in the vicinity in question, but the area was undoubtedly affected by considerable fluctuations in sea level. The fact that these eustatic alterations do not appear to have influenced the Sr content of the rocks may be due to the fact that the sedimentation record is incomplete and that we only have cements and sediments from certain specific moments in geological history. It is important to emphasise that Sr is highly affected by diagenetic and dolomitization pro ces ses and also by the clay content of the carbonates and the salinity of the environment.
Sodium.- The mean Na values are also very similar in all the samples, ranging from nil to 0.02%-0.03% (200-300 ppm). These values, according to the data compiled by Flügel (1982), correspond to restricted me-
Rev. SoCo Geol. España, 3, (3-4) (1990)
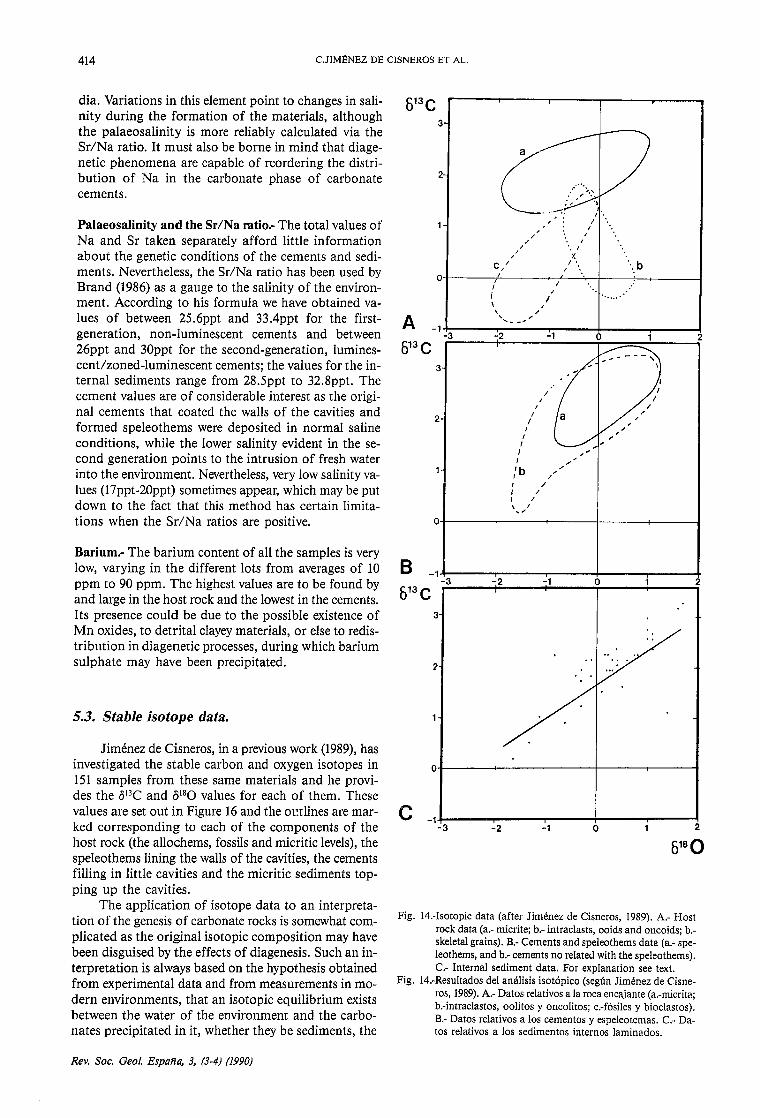
414 C.JIMÉNEZ DE CISNEROS ET AL.
dia. Variations in this element point to changes in sali-nity during the formation of the materials, although the palaeosalinity is more reliably calculated via the Sr/Na ratio. It must also be borne in mind that diage-netic phenomena are capable of reordering the distri-bution of Na in the carbonate phase of carbonate cements.
Palaeosalinity and the Sr/Na ratio.- The total values of Na and Sr taken separately afford little information about the genetic conditions of the cements and sedi-ments. Nevertheless, the Sr/Na ratio has been used by Brand (1986) as a gauge to the salinity of the environ-mento According to his formula we have obtained va-lues of between 25.6ppt and 33.4ppt for the first-generation, non-Iuminescent cements and between 26ppt and 30ppt for the second-generation, lumines-cent/zoned-Iuminescent cements; the values for the in-ternal sediments range from 28.5ppt to 32.8ppt. The cement values are of considerable interest as the origi-nal cements that coated the walls of the cavities and formed speleothems were deposited in normal saline conditions, while the lower salinity evident in the se-cond generation points to the intrusion of fresh water into the environment. Nevertheless, very low salinity va-lues (17ppt-20ppt) sometimes appear, which may be put down to the fact that this method has certain limita-tions when the Sr/Na ratios are positive.
Barium.- The barium content of aH the samples is very low, varying in the different lots from averages of 10 ppm to 90 ppm. The highest values are to be found by and large in the host rock and the lowest in the cements. Its presence could be due to the possible existence of Mn oxides, to detrital clayey materials, or else to redis-tribntion in diagenetic processes, during which barium sulphate may have been precipitated.
5.3. Stable isotope data.
Jiménez de Cisneros, in a previous work (1989), has investigated the stable carbon and oxygen isotopes in 151 samples from these same materials and he provides the (l13C and 8180 values for each of them. These values are set out in Figure 16 and the oetlines are marked corresponding to each of the components of the host rock (the aHochems, fossils and micritic levels), the speleothems lining the walls of the cavities, the cements filling in little cavities and the micritic sediments topping up the cavities.
The application of isotope data to an interpretation of the genesis of carbonate rocks is somewhat complicated as the original isotopic composition may have been disguised by the effects of diagenesis. Such an interpretation is always based on the hypothesis obtained from experimental data and from measurements in modern environments, that an isotopic equilibrium exists between the water of the environment and the carbonates precipitated in it, whether they be sediments, the
Rev. Soco Geol. España, 3, (3-4) (1990)
613 C 3
e v 2 .... :" " ...... '
·-."h ' . I , I
/ / I ,
'. I , 1-,
e I I • ··.b I I
o I
I
I I
I \ -'
A ,
..... -.. '" "' -1
-3 -2 -1 o 2
Ó13 C 3
/
I I
2 I I
I I
I I
"' ,
I .- ,
:b ,. ,. I
/ /
/ \ -"'
I
o
8 -1 -3 -2 -1 o 2
Ó13 C 3
"
'}
o+-----~------------+_-----r-----i
e -1+---"'""'1"---"""'--+--"'""'1"---12 -3 -2 -1 o
Fig. 14.-Isotopic data (after Jiménez de Cisneros, 1989). A.- Host rock data (a.- micrite; b.- intrac1asts, ooids and oncoids; b.skeletal grains). B.- Cements and speleothems data (a.- speleothems, and b.- cements no relateu with the speleothems). C.- Internal sediment data. For explanation see text.
Fig. 14.-Resultados del análisis isotópico (según Jiménez de Cisnero~, 1989). A.- Datos relativos a la roca encajante (a.-rnicrita; b.-intrac1astos, oolitos y oncolitos; c.-fósiles y bioc1astos). B.- Datos relativos a los cementos y espeleotemas. C.- Datos relativos a los sedimentos internos laminados.

A GEOCHEMICAL STUDY ... 415
shells of organisms or cements. The OIJC and alBO values for the allochems, the
fossils and the micritic levels in the host rocks are relatively concentrated (Fig. 14A) and fall cIearly within the range of typical marine sediments, in accordance with Hudson and Coleman's findings in Jurassic materials from the Alps (1978), the general scheme of Margaritz (1983) and Milliman's values for marine carbonate rocks as a whole (1974). The relatively linear distribution of the results for the allochems, according to a linear positive covariance, would appear to indicate that the diagenetic alteration took place close to the mixing zone of marine and fresh water, just as Allen and Mathews (1982) suggest in their study into modern diagenetic environments in the Barbados. The possibility of diagenesis having taken place under a vadose or phreatic fresh-water environment can be safely ruled out because this would have involved a substantial decrease in 013C, as has been pointed out by Hudson (1977), Dickson and Coleman (1980) and AI-Aasm and Veizer (1986b), among others. On the whole the values for the three types of material studied in the host rocks are fairly uniform, indicating that the genesis of all three occurred in a shallow, marine environment, within which, whilst the energy and depth may have varied, the chemistry of the water remained constant. The small variations to be found between them can be put down to differences in the extent of diagenetic alteration caused by changes in porosity. Nevertheless, the great degree of conformity in the values points cIearly to the fact that the diagenetic alterations were minimal, as tends to happen in pelagic sediments (Renard, 1985), and that it took place in very similar chemical conditions to those of the original sedimentation, with occasional phreatic episodes which caused the modifications mentioned aboye.
We have paid special attention to the speleothems that coat the walls of the cavities in the host rock and· the sparry cements that fill in these same cavities (Fig. 14B), with the intention of determining whether there may have been any phases of vadose or phreatic, freshwater cementation. Dealing as we are with 71 samples, the results are sufficiently concIusive; the OBC/01BO ratios show only minimal dispersion and thus pertain to cements from shallow or phreatic marine environments. The results for vadose or phreatic fresh-water environments, widely reported in the literature, wouldbe considerably different (AI-Aasm and Veizer, 1986; Allan and Matthews, 1982; Dickson and Coleman, 1980, among others), mainly in that the isotopic ratios under either of these environments would be negative. Our results also diffe':" substantially from those of the false agates which fill in fractures in this same area (Jiménez de Cisneros et al., 1988) and from other data reporter in the literature concerning calcite fracture fillings. Neither do our results coincide with the d,ata published on modern stalactites and stalagmites (Fantidis and Ehhalt, 1970; Hendy, 1971; Harmon et al., 1978a,b; Henning et al., 1983, Schwarcz, 1986) or travertines (Gonfiantini et al., 1968; Henning et al., 1983; Turi, 1986), which are genetically cIose to vadose speleothems. It can sa-
fely be concluded, therefore, that the speleothems in question were precipitated onto the walls of karstic cavities and grew inwards towards the centre of the voids and that they were generated under phreatic, marine conditions. This is supported by the absence of stalactite and stalagmite structures.
Finally, the 013C/01BO ratios for the internal cements (Fig. 14C) are fairly similar to those of the rest of the materhl.ls. All the ratios are fairly uniform (in absolute values) and correspond to sedimentation in a normal-saline, marine environment, such as those depicted by Milliman (1974) and Hudson (1977). Nevertheless, there is one aspect to these results which is of special interest and that is their linear distribution in linear positive covariance, which is even more marked than that of the allochems. According to Allan and Mathews (1982), this linear distribution is very characteristic of the mixing zone between fresh and salt water and thus OUl:" sediments may have been deposited in this type of environment or perhaps have undergone diagenetic transformation in such a zone after being deposited in a marine environment. Allan and Mathews (1982) also describe micritic sediments filling in cavities in the mixing zone similar to those studied here the same sort of isotopic ratios. This possibility fits in well with models of the palaeogeography of the Jurassic karst systems in the Subbetic (Vera et al., 1988), according to which there were temporarily emerged areas, which would have been responsible for the supply of fresh water to the shallow-marine deposition zones.
Palaeotemperatures.- The palaeotemperatures can be calculated from the isotopic ratio 0180 and the application of the formulas presented by various authors (Epstein et al., 1951, 1953; Craig, 1965; Shackleton and Kennett, 1975). Jiménez de Cisneros (1989) arrives at the following temperatures: the allochems in the host rock, 16.3°C; the micritc limes tone in the host rock, 13.5°C; the fossils and biocIasts in the host rock, 11.35°C; the sparry cements, 12.1 oC; the speleothems, 1l.5°C; and the internal micritic sediments, 1O.5°C. It is not easy to interpret these results. The almost three degrees that separate the values for the components of the host rock (lower-Liassic) may be due to diagenetit alterations and thc vital effect. lf this be the case then the most representative value may be taken as being that for the micritic limestone (B.8°C), which is also the closest to themean of the three results. Hallam (1975) gives temperatures for the Alpine Jurassic of 13°C, Hudson and Coleman (1978) give 12.2°C for the Ammonítico Rosso during the Jurassic in Austria, Marshall (1981) gives mean temperatures of 12.5°C for the Liassic in Sicilly and Brand (1986) reports a mean of 12.5°C for the mid-Jurassic in Poland, ali of which are sufficiently close to ours. The temperatures indicated in the cements, the speleothems and the internal sediments (12.1 oC, 1l.5°C and 1O.5°C, respectively) are not far off those of the host rock, although a little lower. Plausible explanations for these results incIude: a) postdepositional modifications in the isotopic ratio; b) chan-
Rev. Soco Geol. España, 3, (3-4) (1990)
416 C.JIMÉNEZ DE CISNE ROS ET AL.
ges in the salinity of the seawater, whieh may well have been different inside the cavities from the open sea; c) deposition in temporarily colder periods during the Jurassie.
6. GENETIC MODEL
The partial interpretations afforded by each of the geochemieal techniques employed, together with the concIusions arrived at from a detailed geological, sedimentologieal and stratigraphieal study, can all be integrated into a single mode!. From all the available evidence we are cIearIy dealing with a Jurassie karstie system with a very complex history, during whieh various different stages of emersion have alternated with phases of deposition and infming by marine sediments from the mid-Liassie until the end of the Jurassie (cf. GarcíaHernández el al., 1986-1987b).
The model is based essentially on the interpretation of the genesis of the cements that coat the walls of the cavities (speleothems) or fm in voids, and the marine sediments that complete this infilling. The model envisages several different successive genetie phases. The first phase is one of sedimentation in a shallowmarine-platform environment (Gavilán Fm.) previous to the first karstifieation process (Fig. 15A). This was followed by a partial emersion of the sea bed caused by the tilting of blocks during a period of listrie faulting that affected this margin (Fig. 15B). During the third phase these emerged areas were karstified (Fig; 15C). The karstic cavities penetrated into the host rocks to a depth similar to the height of their emersion, so that the depths of the cavities were at about sea leve!. There are no identifiable vadose deposits belonging to this !)hase, according to the isotope studies, although it it is always possible that their existence has been disguised by later diagenetie alterations; this is probably the case with the calieheform cements with the appearance of stalactites (sequence type 2 in Section 5.1), the iso tope values of whieh indieate a marine environment.
The first deposits to form in the karstic cavities after the submersion of the relief were generaIly crinoidal caIcarenites, whieh occupied the lowest parts (lf the of the karsts before the generation of the speleothems on the walls. These deposits, similar to those of the Gavilán Formation, were shallow marine (Fig. 15D).
The speleothems coating the walls of the cavities were generated under marine conditions very similar to those in whieh the host rocks were laid down and also these in whieh the cements that fill in the cavities were deposited. According to the evidence provided by cathodoluminescence studies and trace-element microanalysis various genetie phases succeeded one another in two different types of environment: one phase (the first) too k place in a very shallow environment with vigorous wave action (Fig. 15E) whilst the other occurred in deeper, calm waters (Fig. 15F). In sorne speleothems these phases were repeated several times, bearing witness to successive fluctuations in sea leve!. One interes-
Rev. Soco Geol. España, 3, (3-4) (1990)
ting piece of data deriving from a study of the trace elements serves to complement all this information; we refer to the possible changes in salinity which took place from time to time, indieating that sorne of the deposition phases were influenced by the intrusion of fresh water into the environment. In many of the samples studied it can be seen that on several occasions the precipitation of the cement was interrupted, the speleothems were partially eroded and marine sediments were deposited, which then became trapped within renewed phases of the speleothem (Fig. 15G).
The first sediment to begin the infilling of the cavities lined with speleothems was a laminated calcitie silt, very similar in its external aspect to a vadose silt. The available data (stable isotopes and cathodoluminescence) suggest a marine origin for this sediments. Nevertheless, the linear distribution of the data (Fig. 15C) point to their having ~een deposited in the mixing zone between fresh and marine water (Fig. 15H). A study of the insoluble residue (Jiménez de Cisneros, 1989) also reveals that soils in neighbouring emerged areas were being eroded at the time that these sediments were deposited.
The final sedimentation stage (Fig. 151), which tops up the the cavities, is a micritic sediment and cIearIy marine in origin, as evidenced by the accompanying microfossils (radiolarites, foraminifers, crinoids etc.). This sediment, as well as completing the filling of the cavities, usually fossilizes the external surface of the unconformity. A detailed study of these sediments lead sto a precise dating of the different phases of emersion and karstification that affected the region.
A variation on this genetic model is that whieh results from the repetition several times of aIl the stages, with complex alternations of precipitation, erosion ar.d sedimentation. The exact number of phases and their duration changed from sector to sector within the Sierra Gorda, a phenomenon that can be explained by the fact that the emersion of the southern part of this unit was greater, longer lasting and more repetitive than in the northern part.
This integrated genetic model agrees well with· the simplified model proposed by Vera el al. (1988) for the Jurassic palaeokarst in the Subbetie Zone, and like Vera's model can also be considered within its palaeogeographieal context.
The main interest in an investigation into the palaeogeography of this Subbetie basin lies, as with any such study, Hes in the possibility it provides of accurately identifying the emersion phases that affected its shallower zones. These emersions carne about through a combination of tectonic activity and eustatie effects. They are most evident at the external zones of the basin along the extensive platforms adjacent to the continent, where sh~I1owing sequences are crowned by subaerial erosion surfaces, which in turn are frequently fossilized by continental deposits. When the emerged rocks upon which the subsequent palaeorelief was developed were carbonate rocks a karstic system was formed, which was later buried in pelagie sediments. In recent
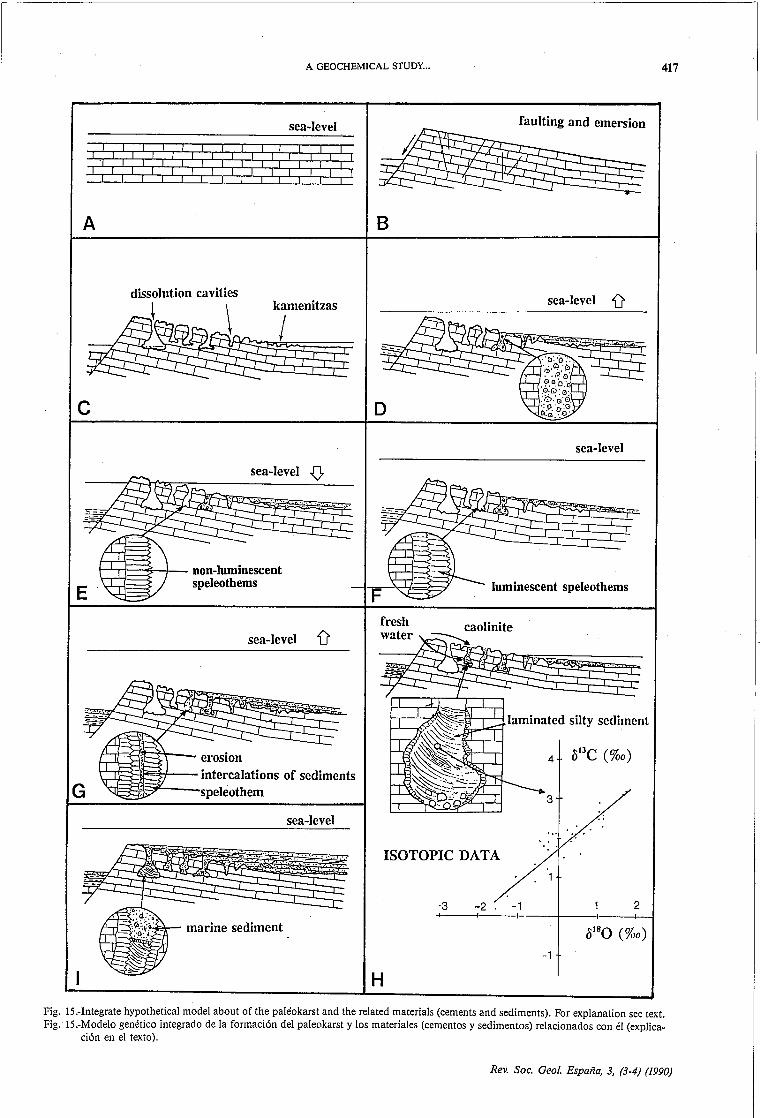
A GEOCHEMICAL STUDY ... 417
sea-level
:.: : : : : : : : : : : : : : : : : :: : : : : : : : A
dissolution cavities t \ kamenitzas
~;:::2 e
E
G
sea-level o-
I-'-rl-~-I-_ non-Iuminescent speleothems
sea-Ievel Ú
f-Lri:::=at-'Pr-__ erosion
~~~~t=:intercalations of sediments '\ speleothem
sea-level
marine sediment
fauIting and emersion
8
sea-Ievel Ú
sea-Ievel
luminescent speleothems
·¡:¡L...---'-llaminated siIty sediment
4
3
ISOTOPIC DATA
·3 -2 -1 2 +1----4----~1 ----+-___ I-----+~
-1
H
Fig. I5.-Integrate hypothetical model about of the paleokarst and the related materials (cements and sediments). For explanation see text. Fig. I5.-Modelo genético integrado de la formación del paleokarst y 105 materiales (cementos y sedimentos) relacionados con él (explica
ción en el texto).
Rev. Soco Geol. España, 3, (3-4) (1990)
418 C.JIMÉNEZ DE CISNEROS ET AL.
years sorne authors have been suggesting the possibilit y of the local, sporadic emersion of pelagic swells in the more internal zones of the basin (García-Hernández el al., 1988a,b; Vera el al., 1988; and references therein). These would have been related to fault movements and eustatic changes. A study of the mineralogy of the elay fraction of the pelagic sediments (Vera el al., 1989) is also a useful support in this respect, giving as it does elear evidence about contemporary soil erosiono
Both in the context of platforms and pelagic swells, the karstic sur faces are very often well developed and extensive enough to observe easily, with elear characteristics such as caves, stalactites, collapse breccias, palaeosoils etc. Nevertheless, cases do exist where the morphological as caves, stalactites, collapse breccias, palaeosoils etc. Nevertheless, cases do exist where the morphological aspects of the palaeokarst are not sufficiently elear and where even the emersion stage itself may be left open to doubt. It is quite obvious that in such cases indisputable arguments to resolve this important question are required.
7. CONCLUSIONS
Geochemical studies provide valuable information about the genesis of the materials in the marine basin, pointing to the existence of areas which emerged from time to time. The data obtained from each individual technique applied to the study do not by themselves afford undeniable proofs for any one mode!. The isotope composition, for example, elearIy indicates genesis in a subaerial vadose medium, similar to that of stalactites and stalagmites in present day caves, but this is not supported by the rest of the evidence. Nevertheless, a joint interpretation of all the results allows us to formulate a coherent model, which involves phases of emersion and karstification of the carbonate rocks between phases of resubmersion and deposition. Significant features of the depositional processes inelude: 1.- Evidence that either deposition itself or a later di agenetic phase took place in the mixing zone between fresh and salt water. 2.- Evidence of changes in salinity due to the intrusion of fresh water during the speleothem-precipitation stages. 3.- Evidence of changes in the depth of the sea, with periods of very shallow marine conditions and strong wave action.
REFERENCES
AI-Aasm,I.S. and Veizer,J. (1986): Diagenetic stabilization of aragonite and low-Mg calcite. 11.- Stable isotopic in rudists. Jour. Sed. Petrol., 56: 763-770.
Allan,J. R. and Matthews,R.K. (1982): Isotopes signatures associated with earIy meteoric diagenesis. Sedimentology, 29: 797- 817.
Amieux,P. (1982): La cathodoluminiscence: méthode d'étude
Rev. SOCo Geol. España, 3, (3-4) (1990)
All these data, together with evidence for the influence of soils in the deposition of sorne of the internal sediments, and field observations the morphology of the cavities, collapse breccias etc., provide sufficient proof of emergence and karstification phases in the sorne sector of the sedimentary basin. The datd" deriving from such a study of the palaeokarst are of great interest when applied to the drawing of curves to represent the fluctuations in sea level within the basin. Of no lesser interest are studies comparing the karstification of the continental platform at the edge of the basin and that of the pelagic swells to see whether they took place at the same time and thus were connected with the same geological evento
In the many examples described in the literature (see the references in Vera el al., 1988 and Jiménez de Cisneros, 1989) the emersion and karstification phases are always connected to relative falls in sea level, which in turn are related to tectonic activity affecting the basin as a whole. In fact, the emersion phases of the pelagic swells corresponding to the Sierra Gorda in the Internal Subbetic were indeed elosely related to both tectonic and eustatic events affecting the entire basin. They also coincide with periods of low sea levels on the eustatic curve constructed by Vera (1988). Thus the first phase occurred in the mid-Liassic on the break up of the great carbonate platform that occupied the whole of the External Zones of the Betic Cordilleras. The other phases, which only affected the southern sector, took place at the Liassic-Dogger boundary, the end of the Bathonian and during the Kimmeridgian. These phases concur with similar ones that have been recognised in other sectors of this basin at considerable distan ces one from another. This leads us to the conelusion that very elosely related tectonic and eustatic events affecting the whole basin were responsible for the emergence and consequent karstification úf these areas.
ACKNOWLEDGEMENTS
This study has been carried 01.!lt under the auspices of the CICYT (Project PB87-Q971) and the Junta de Andalucía (Research Group into "Stratigraphic Unconformities"). We thank our colleage Dr. J. Trout for the English texto
sédimentologique des carbonates. Bull. Centre Rech. Explot. Prod. Elf-Aquitaine, 6: 437-484:
Azema,J., Foucault,A., Fourcade,E., García-Hernández,M., González-Donoso,J.M., Linares,A., ·Linares,D., LópezGarrido,A. e., Rivas,P. and Vera,J.A. (1979): Las microfacies del Jurásico y Cretácico de las Zonas Externas de las Cordilleras Béticas. Secr. Publico Univ., Granada, 83 p.
Barnaby,R. and Rimstidt,D. (1989): Redox conditions of caIcite cementation interpreted from Mn and Fe contents of
A GEOCHEMICAL STUDY ... 419
authigenic calcites. Geol. SOCo Amer. Bull., 101: 795-804. Benson, L.V. (1974): Transformation of a polyphase sedimen
tary assemblage into a single phase rack: a chemical approach. Jour. Sed. Petrol., 44: 123-136.
Benson,L.V. and Matthews,R.K. (1971): Electron microprobe studies of magnesium distribution in carbonate cements and recrystallized skeletal grainstones from the Pleistocene of Barbados. West Indies. Jour. Sed. Petrol., 41: 1018-1025.
Brand,U. (1986): Paleoenvironmental analysis of Middle Jurassic (Callovian) ammonoids from Poland: Trace elements and stable isotopes. Jour. Paleontol., 60: 293-301.
Craig,H. (1965): The measurement of oxigen isotope paleotemperatures. In: Stable iso topes in oceanographic studies and paleotemperatures (E.Tongiorgi, Ed.), Spoleto 1965, Consiglio Nazionale delle Ricerche, Laboratorio di Geologia Nucleare, Pisa, 161-182.
Dickson,J.AD. and Coleman,M.L. (1980): Changes in carbon and oxygen isotope composition during limestone diagenesis. Sedimentology, 27: 107-118.
Epstein,S., Buchsbaun,R., Lowenstam;H.A. and Urey,H.C.B. (1951): Carbonate-water isotopic temperature scale. Geol. SOCo Amer. Bull., 62: 417-426.
Epstein,S., Buchsbaun,R., Lowenstam,H.A. and Urey,H.C.B. (1953): Revised carbonate-water isotopic temperature scale. Geol. Soco Amer. Bull., 64: 1315-1365.
Esteban,M. and Klappa,C.F. (1983): Subaerial exposure environment. In: P.A Scholle, D.G.Bobout and C.H.Moore (Eds.): Carbonate depositional environments. Amer. Assoco Petral. Geo!., Mem. 33, 1-54.
Fairchild,I.J. (1983): Chemical controls of cathodoluminescence of natural dolo mi tes and calcites: new data and review. Sedimentology, 30: 579-583.
Fantidis,l and Ehhalt,D.H. (1970): Variations of the carbon and oxygen composition in stalagmites and·stalactites: evidence of non-equilibrium isotopic fracturation. Earth Planeto Sci. Letters, 10: 136-144.
Flügel,E. (1982): Microfacies analysis of limestones (2th edition) Springer-Verlag, Berlin, 633 p.
Folk,R.L. and Assereto,R. (1976): Comparative fabrics of . length-slow and length-fast calcite and calcitized arago
nite in a Holocene speleothem, Carlsbard caverns, New Mexico; Jour. Sed. Petrol. 46: 486-496.
Frank,J.R., Carpenter,AB. and Oglesby,T.W. (1982): Cathodoluminescence and composition of ca1cite cement in the Tum Sauk Limestones (Upper Cambrian) Southeast Mifsouri. Jour. Sed. Petrol., 52: 631-638.
García-Hernández,M., LÓpez-Garrido,A.C.,MartínAIgarra,A., Molina,J.M., Ruiz-Ortiz,P.A. and Vera.J.A. (1989): Las discontinuidades mayores del Jurásico de las Zonas Externas de las Cordilleras Béticas: Análisis e interpretación de los ciclos sedimentarios. C;¡ad. Geol. Ibérica, 13: 35-52.
García-Hernández,M., López-Garrido,AC., Rivas,P., Sanz de Galdeano,C. and Vera,lA (1980): Mesozoic paleogeographic evolution of the External Zones of the Betic Cordillera. Geol. Mijnb., 59: 155-168.
García-Hernández,M., Lupiani,E. and Vera,lA (1986-1987a): La sedimentación liásica en el sector central del Subbético Medio: Registro de la evolución de un rift continental. Acta Geol. Hisp., 21-22: 327-337.
García-Hernández,M., Lupiani,E. and Vera,lA. (1986-1987b): Discontinuidades estratigráficas del Jurásico de SierraGorda (Subbético interno, prov. Granada). Acta Geol. Hisp., 21-22: 339-349.
García-Hernández,M., Martín-Algarra,A, Molina,J.M., RuizOrtiz, P.A and Vera,lA (1988a): Umbrales pelágicos: Me-
todología de estudio y significado de las facies. II Congr. Geol. España, SGE, Granada, Simposios, 231-240.
García-Hernández,M., Mas,J.R., Molina,J.M., RuizOrtiz,P.A. and Vera,J.A. (1988b): Episodios de karstificación litorales insulares en el Jurásico superior, Fm. Ammonítico Rosso, Sub bético externo, Provincia de Córdoba. 11 Coloq. Estratigr. Paleogeogr. Jurásico de España, Logroño, Resúmenes, 32.-35.
Given,R.K. and Lohmann,K.C. (1986): Isotopic evidence for the early meteoric diagenesis of the reef facies, Permian reef Complex of West Texas and New Mexico. Jour. Sed. Petrol., 56: 183-193.
Gonfiantini,R., Panichi,C. and Tongiorgi,E. (1968): Isotopic disequilibrium in travertine deposition. Earth Planet. Sci. Letters, 5: 55-58.
Grover,G. Jr and Read,J.F. (1983): Paleoaquifer and deep burial related cements defined by regional cathodoluminescent patterns, Middle Ordovician carbonates, Virginia. Amer. Assoc. Petrol. Geol. Bull., 67:.1275-1303.
Hallam,A. (1975): Jurassic Environments, Cambridge University Press, Cambridge, 269 p.
Hallam,A (1988): A reevaluation of Jurassic Eustasy in the light of New Data and the revised sea-Ievel EXXON curve. In: C.K.Wilgus, B.S.Hastings,· C.G.St.C.Kendall, H.W.Posamentier, C.ARoss and lC. vanWagonner (Eds.): . Sea-level changes: an integrated approach, So~. Econ. Paleont. Mineral., Spec. publ. 42: 261-273.
Haq,B., Hardenbol,J. and Vail,P. (1987): Chronology of fluctuating sea levels since the Triassic. Science, 235: 1156-1167.
Haq,B., Hardenbol,l and Vail,P.(1988): Mesozoic and Cenozoic Chronoestratigraphy. and Eustatic cyc1es. In: C.K.Wilgus, B.S.Hastings, C.G.St.C.Kendall, H.W.Posamentier, C.ARoss and J.C. van Wagonner (eds): Sea-level changes: an integrated approach, Soco Econ. Paleont. Mineral., Spec. publ. 42: 71-108.
Harmon,R.S., Schwarcz,H.P. ap.d Aley,T. (1978a): Isotopic studies of speleothems from a cave in Southern Missouri, USA. In: R.E. Zartman (ed): Short papers of the fourth international conference,' geochronology, cosmochronclogy, isotope geology,Geological Survey Open-File Report 78-701, 165-167.
Harmon,R.S., Schwarcz,H.P. and Ford,D.C. (1978b): Stable isotope geochemistry of speleothems and cave waters from the flint ridge- mammoth cáve system, Kentucky: Implications for terrestrial climate change during the period 230,000 to 100,000 years B.P. Jour. Geol., 86: 373-384.
Hemming,N.G., Meyers,W.J. and Grams,J.C. (1989): Cathodoluminescence in diagenetic calcites: The roles of Fe and Mn as deduced from electron probe and spectrophotometric measurements. Jour. Sed. Petrol., 59: 404-411.
Hendy,C.H. (1971): The isotopic geochernistry of speleothems. 1.- The calculation.,9f.th~,~t<.ffects of differents mqdes, of . formation on the isotopic compositioñ'6f speleothems ~md their applicability as palecic1imatic indicators. Geochim. Cosmochim. Acta, 35: 801-824.
Henning,G.J., Grun,R. and Brunnacker,K. (1983): Speleothems, Travertines, and Paleoclimates. Quat. Res., 9: 1-29.
Hudson,J.D. (1977): Stable isotopes and limestone lithification. Jour. Geol. Soco London, 133: 637-660.
Hudson,J.D. and Coleman,M.L. (1978): Submarine cementation of the Scheck Limestone Conglomerate (Jurassic, Austria): isotopic evidence. N. Jb. Geol. Palaont, M, 1978: 534-544.
James,N.P. and Klappa,C.F. (1983): Cambrian reef limestones, Labrador, Canada. Jour. 'Sed. Petrol., 53: 1051-1096.
Jiménez de Cisneros,C. (1989): Estudio geoquímico de los sedimentos y cementos relacionados con el paleokarst Me-
Rev. SOCo GeoL Espaíla, 3, (3-4) (1990)
420 C.JIMÉNEZ DE CISNEROS ET AL.
sozoico de Sierra Gorda (Subbético Interno). Tesis licenc., Univ. Granada, 138 p.
Jiménez de Cisneros,C., Linares,J., Reyes,E. and Vera,J.A. (1988): Isótopos estables de carbono y oxígeno de los rellenos de calcita (falsa ágata) y su interés paleo ambienta!. Geogaceta, 4: 17-20.
Kaufman,l, Cander,H.S., Daniels,L.D and Meyers,W.J. (1988): Calcite cement stratigraphy and cementation history of the Burlington- Keokuk Formation (Mississipian), Illinois and Missouri. Jour. Sed. Petrol., 58: 312-326.
Kendall,A.C. (1985): Radiaxial fibrous calcite: A reappraisa!. In: Carbonate cements (N.Schneidermann and HM. Ha
rris, Eds.), Soco Econ. Paleont. Mineral. Spec. pub!. 36: 59-77.
Kendall,A.C. and Broughton,P.L. (1978): Origin of fabrics in speleothems composed of columnar calcite crystals. Jour. Sed. Petrol., 48: 519-538.
Linares,A. and Vera,lA. (1965): Precisiones estratigráficas sobre la serie mesozoica de Sierra Gorda. Estudios Geol., 22: 65-69.
Lohmann,K.C. (1988): Oeochemical Patterns of Meteoric Diagenesis Systems and their Application to Studies of Paleokarst. In: N.P.James and P.W.Choquette (Eds.): Paleokarst, Springer-Verlag, New York, 58-80.
Magaritz,M. (1983): Carbon and oxygen isotope composition of Recent and Ancient Coated Grains. In: T.M.Peryt (Ed.): Coated Grains, Springer-Verlag, Heidelberg, 27-37.
Marshall,J.D. (1981): Stable isotope evidence for the enviro nment of lithification of sorne Tethyan limestones, N. Jb. Geol. Palaont. M., 1981: 211-224.
Martín-AIgarra,A., Soria,EJ. and Vera,lA. (1989): Paleokarst mesozoico y terciario en la Cordillera Bética. In: El karst en España (llDurán and J.López-Martínez, Eds.), SEG, Madrid, Monografía 4: 299-309.
Mas,J.R. (1988): La catodoluminiscencia en Sedimentología: su aplicación a los carbonatos. Geogaceta, 4: 34-36.
Meyers,W.J. (1989): Trace element and isotope geochemistry of zoned cal cite cements, lake Valley Formation (Mississippian, New México): insights from water-rock interaction modelling. Sedim. Geol., 65: 355-370.
Milliman,lD. (1974): Marine carbonates, Springer-Verlag, Berlin, 375 p.
Miller,J. (1986): Facies relationship and diagenesis in Waulsortion mudmounds from the lower Carboniferous of Ireland and N. England. In: Reel Diagenesis (J.H.Schroeder and B.H.Purser, Eds.), Springer-Verlarg, Berlin, 311-335.
Prezbindowski,D.R. (1985): Burial cem'entation -It is important? A case study, Stuart City Trend, South Central Texas. In: P.M.Harris and N.Schneidermann (Eds.): Carbonate Cements, SOCo Econ. Paleon. Min. Spec. pub!. 36: 241-264.
Renard,M. (1985): Géochimie des carbonates pélagiques. Mise en évidence des fluctuations de la composition des eaux oceaniques depuis 140 ma. Essai de chimiostratigraphie. Documents du BRGM, 85: 650 p.
Renard,M. (1986): Pelagic carbonate chemostratigraphy (Sr, Mg, 0-18, C-13). Mar. Micropaleontol., 10: 117-164.
Renard,M. (1987): Chimiostratigraphie. In: C.H.Pomerol et al. (Eds.): Stratigraphie' Principes, methodes, applications, Ed. Doin, Paris, 140-190.
Scholle,P.A. and Halley,R.B. (1985): Burial diagenesis: out of sight, out of mind!. In: Carbonate cements (N .Schneider-
Rev. Soco Geol. España, 3, (3-4) (1990)
mann and P.M.Harris, Eds.), Soco Econ. Paleont. Mineral., Spec. Pub!., 346: 309-334.
Schwarcz,H.P. (1986): Geochronology and isotopic geochemistry of speleothems. In: Handbook 01 Environment Isotope Geochemistry (P.Fritz and J.Ch.Fontes, Eds.), Vo!. 2: The terrestrial Environment, B, Elsevier, Amsterdam, 271-303.
Shackleton,N.J. and Kennett,J.P. (1975): Paleotemperature history of the Cenozoic and the initiation Antarctic glaciation: oxygen- and carbon- isotope analysis in DSDP Sites 277. 279 and 281. In: lP.Kennett, R.E.Houtz et al. (Eds.): Init. Rpts. D.S.D.P., 29: 801-807, U.S. Govt. Print. of. Washington, DC.
Sun,S.Q. (1990): Facies-related diagenesis in a cyclic shallow marine sequence the corallian group (Upper Jurassic) of the Dorset Coast, Southern England). Jour. Sed. Petral., 60: 42-52.
Thrailkill,J. (1976): Speleothems. In: M.R.Walther (Ed.): Stromatolites, Developments in Sedimentology, 20, EIsevier, Amsterdam, 73-86.
Thri,B. (1986): Stable isotope geochemistry of travertines. In: Handbook 01 Environment Isotope Geochemistry (p.Fritz and J.Ch.Fontes, Eds.), Vol. 2: The terrestrial Environ
ment, B, Elsevier, Amsterdam, 207-238. Vera,lA. (1966): Estudio geológico de la Zona Sub bética en
la transversal de Laja y sectores adyacentes. Thsis Univ. Granada (Publ. Mem. Inst. Geol. Min. España, 72, 192 p., 1969).
Vera,lA. (1981): Correlación entre las cordilleras Béticas y otras cordilleras alpinas durante el Mesozoico. In: Programa Internacional de Correlación Geológica, P.LC.G., Real Acad. Cienc. Exact. Pis. Nat., Madrid, 2, 125-160.
Vera,J.A. (1986): Las Zonas Externas de las Cordilleras Béticas. In: Libro Jubilar J.M.Ríos: Geología de España, LO.M.E., Madrid, 2, 218-251.
Vera,lA. (1988): Evolución de los sistemas de depósito en el margen ibérico de las Cordilleras Béticas. Rev. SOCo Geol. España, 1, 373-391.
Vera,lA., Molina,J.M., Molina-Diaz,A. and Ruiz-Ortiz,P.A. (1986-1987): Bauxitas kársticas jurásicas en la Zona Subbética (Zarzadilla de Totana, provincia de Murcia, Sureste de España), Acta Geol. Hisp. 21-22: 351-360.
Vera,J.A., Palomo,L and Ortega-Huertas,M. (1989): Influencia del paleokarst en la mineralogía de arcillas del Lias superior de AIgarinejo (Subbético medio). Geogaceta, 6: 16-19.
Vera,J.A., Ruiz-Ortiz,P.A., García-Hernández,M. and Molina,lM. (1988): Paleokarst and related pelagic sediments in the Jurassic of the Subbetic Zone, Southern Spain. In: N.P.James and J.Choquette (Eds): Paleokarst, SpringerVerlag, New York, 364-384.
Wendt,J. (1971): Genese und fauna submariner sedimentarer SpaltenfüIlungen im Mediterranean Jura. Paleontographica, A. 136, 122-192.
White,W.B. (1978): Speleal sediments. In: R.W.Faibridge and J.Bourgois (Eds): Encyclopedia 01 Sedimentology, P.A.Dowden, Hutchison and Ross, Strudsburg, 754-759.
Winland,H.D. (1969): Stability of calcium carbonate polymorphs in warm seawater. Jour. Sed. Petrol., 39: 1579-1587.
Recibido 28 de julio de 1990 Aceptado 27 de octubre de 1990