A fuzzy decision model for color reproduction
7
* Corresponding author. Tel.: #1 512 245 3189; fax: #1 512 245 3089; e-mail: ct01@swt.edu. Int. J. Production Economics 58 (1999) 31 — 37 A fuzzy decision model for color reproduction Cecilia Temponi!,*, Farid Derisavi Fard", H.W. Corley# ! Southwest Texas State University, San Marcos, TX 78666, USA " Xerox Corporation, Dallas, TX, USA # The University of Texas at Arlington, Arlington, TX, USA Received 4 June 1997; accepted 29 December 1997 Abstract Color quality appraisal refers to a visual evaluation of an original color image and an assessment of the degree to which that image is matched in photomechanical or electronic reproduction. The evaluation of reproduction quality is quite subjective since it relies on the individual judgments of color technicians who have different perceptions of color and its component qualities. To reduce the amount of rework due to subjective evaluation of color reproduction, an objective model is proposed here. In this model, a fuzzy set of quality factors is introduced and a numerical quality value calculated. This measure is then compared with an acceptable quality value experimentally established for particular customers and printing processes. Finally, the installed model is tested in actual production, and compared with the conventional evaluation method in a cost analysis. ( 1999 Elsevier Science B.V. All rights reserved. Keywords: Printing process; Color appraisal; Production; Fuzzy model; Cost analysis 1. Introduction In color quality appraisal, the original color image (color transparency, color print, or other reflection copy [1]) and the color reproduction are compared for hue, lightness, and saturation. They are also appraised in terms of tonal range, contrast, and texture, which affect the overall appearance of the color image. However, such analysis is subjec- tive and varies from one technician to another. This fact is the primary cause of production rework in the prepress industry today when the color repro- duction does not meet the customer’s expectation. Quantitative decision techniques have not been heretofore used, but the situation seems a natural application of fuzzy logic. In this paper we construct a model for the nu- merical evaluation of the quality level of a color reproduction by introducing a set of factors for a color technician to use in their evaluation and a measure of their respective importance. This ap- proach enables the technician to judge the degree of color match acceptable to a particular customer for a specified printing process. 0925-5273/99/$ — see front matter ( 1999 Elsevier Science B.V. All rights reserved PII: S 0 9 2 5 - 5 2 7 3 ( 9 8 ) 0 0 0 7 8 - 4
-
Upload
cecilia-temponi -
Category
Documents
-
view
217 -
download
2
Transcript of A fuzzy decision model for color reproduction

*Corresponding author. Tel.: #1 512 245 3189; fax:#1 512 245 3089; e-mail: [email protected].
Int. J. Production Economics 58 (1999) 31—37
A fuzzy decision model for color reproduction
Cecilia Temponi!,*, Farid Derisavi Fard", H.W. Corley#
! Southwest Texas State University, San Marcos, TX 78666, USA" Xerox Corporation, Dallas, TX, USA
# The University of Texas at Arlington, Arlington, TX, USA
Received 4 June 1997; accepted 29 December 1997
Abstract
Color quality appraisal refers to a visual evaluation of an original color image and an assessment of the degree towhich that image is matched in photomechanical or electronic reproduction. The evaluation of reproduction quality isquite subjective since it relies on the individual judgments of color technicians who have different perceptions of colorand its component qualities. To reduce the amount of rework due to subjective evaluation of color reproduction, anobjective model is proposed here. In this model, a fuzzy set of quality factors is introduced and a numerical quality valuecalculated. This measure is then compared with an acceptable quality value experimentally established for particularcustomers and printing processes. Finally, the installed model is tested in actual production, and compared with theconventional evaluation method in a cost analysis. ( 1999 Elsevier Science B.V. All rights reserved.
Keywords: Printing process; Color appraisal; Production; Fuzzy model; Cost analysis
1. Introduction
In color quality appraisal, the original colorimage (color transparency, color print, or otherreflection copy [1]) and the color reproduction arecompared for hue, lightness, and saturation. Theyare also appraised in terms of tonal range, contrast,and texture, which affect the overall appearance ofthe color image. However, such analysis is subjec-
tive and varies from one technician to another. Thisfact is the primary cause of production rework inthe prepress industry today when the color repro-duction does not meet the customer’s expectation.Quantitative decision techniques have not beenheretofore used, but the situation seems a naturalapplication of fuzzy logic.
In this paper we construct a model for the nu-merical evaluation of the quality level of a colorreproduction by introducing a set of factors fora color technician to use in their evaluation anda measure of their respective importance. This ap-proach enables the technician to judge the degree ofcolor match acceptable to a particular customer fora specified printing process.
0925-5273/99/$ — see front matter ( 1999 Elsevier Science B.V. All rights reservedPII: S 0 9 2 5 - 5 2 7 3 ( 9 8 ) 0 0 0 7 8 - 4
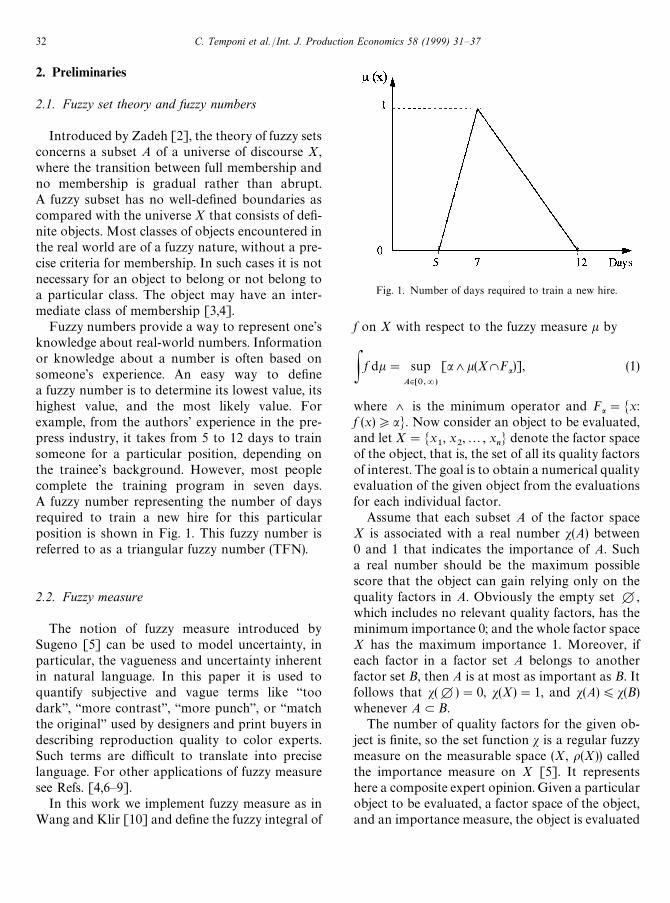
Fig. 1. Number of days required to train a new hire.
2. Preliminaries
2.1. Fuzzy set theory and fuzzy numbers
Introduced by Zadeh [2], the theory of fuzzy setsconcerns a subset A of a universe of discourse X,where the transition between full membership andno membership is gradual rather than abrupt.A fuzzy subset has no well-defined boundaries ascompared with the universe X that consists of defi-nite objects. Most classes of objects encountered inthe real world are of a fuzzy nature, without a pre-cise criteria for membership. In such cases it is notnecessary for an object to belong or not belong toa particular class. The object may have an inter-mediate class of membership [3,4].
Fuzzy numbers provide a way to represent one’sknowledge about real-world numbers. Informationor knowledge about a number is often based onsomeone’s experience. An easy way to definea fuzzy number is to determine its lowest value, itshighest value, and the most likely value. Forexample, from the authors’ experience in the pre-press industry, it takes from 5 to 12 days to trainsomeone for a particular position, depending onthe trainee’s background. However, most peoplecomplete the training program in seven days.A fuzzy number representing the number of daysrequired to train a new hire for this particularposition is shown in Fig. 1. This fuzzy number isreferred to as a triangular fuzzy number (TFN).
2.2. Fuzzy measure
The notion of fuzzy measure introduced bySugeno [5] can be used to model uncertainty, inparticular, the vagueness and uncertainty inherentin natural language. In this paper it is used toquantify subjective and vague terms like “toodark”, “more contrast”, “more punch”, or “matchthe original” used by designers and print buyers indescribing reproduction quality to color experts.Such terms are difficult to translate into preciselanguage. For other applications of fuzzy measuresee Refs. [4,6—9].
In this work we implement fuzzy measure as inWang and Klir [10] and define the fuzzy integral of
f on X with respect to the fuzzy measure k by
P f dk" sup
A|*0,=)
[a'k(XWFa)], (1)
where ' is the minimum operator and Fa"Mx:f (x)*aN. Now consider an object to be evaluated,and let X"Mx
1, x
2,2, x
nN denote the factor space
of the object, that is, the set of all its quality factorsof interest. The goal is to obtain a numerical qualityevaluation of the given object from the evaluationsfor each individual factor.
Assume that each subset A of the factor spaceX is associated with a real number s(A) between0 and 1 that indicates the importance of A. Sucha real number should be the maximum possiblescore that the object can gain relying only on thequality factors in A. Obviously the empty set H,which includes no relevant quality factors, has theminimum importance 0; and the whole factor spaceX has the maximum importance 1. Moreover, ifeach factor in a factor set A belongs to anotherfactor set B, then A is at most as important as B. Itfollows that s(H)"0, s(X)"1, and s(A))s(B)whenever ALB.
The number of quality factors for the given ob-ject is finite, so the set function s is a regular fuzzymeasure on the measurable space (X, o(X)) calledthe importance measure on X [5]. It representshere a composite expert opinion. Given a particularobject to be evaluated, a factor space of the object,and an importance measure, the object is evaluated
32 C. Temponi et al. /Int. J. Production Economics 58 (1999) 31—37

Table 1
Importance measure
s(A)"0.569s(¹)"0.342s(G)"0.397s(¹, A)"0.819s(G, A)"0.908s(G, ¹)"0.673
by experts for each individual quality factor x1,
x2, 2 , x
n. Their subjective opinions are aggreg-
ated into a composite quality evaluation functionf to yield the scores f (x
1), f (x
2), 2 , f (x
/), where
f may be regarded as a measurable function on(X, o(X)) for which f (x
i)3 [0, 1] for each x
i3X.
As noted by Wang and Klir [10] and Zhong [7],the fuzzy integral : fds on X of the scores f (x
i) with
respect to the importance measure s yields a singlenumerical quality evaluation of the given object.The term synthetic evaluation [11] refers to thisprocess of reducing sets of scores assigned to factorsinfluencing a judgment to a single number. It gener-alizes the weighted average approach to evaluationsince interactions between sets of factors can bemodeled using a non-additive fuzzy measure. X, s,and f will next be defined for a color reproductionprocess.
3. The model
Color reproduction is classified as either offset orflexo because these two printing processes are com-pletely different and require different color qualityconsideration. Furthermore, the offset market isfurther divided into the three separate categories:good-enough color (GE), mid-range color (MR),and high-end color (HE). We limit our presentationhere to mid-range offset color reproduction. Sim-ilar results have been obtained for the other cases.
3.1. Quality factors
Acceptance or rejection of a color reproductionis presently based on subjective evaluation bya color technician. A trained color technician candistinguish about 10 million colors. However, ver-bal systems can describe only a few hundred colors,physical sample systems a few thousand, and in-strumental systems hundreds of thousands [12].Color technicians monitor the color quality-con-trol process. They accept or reject a reproductionbased on the degree of color match between theoriginal and its color reproduction, as well as theirperception of its meeting the customer’s standards.
The degree of color match between an originaland a reproduction can vary due to numerousfactors or steps involved in the color reproductionprocess. In our experience the three major factorsaffecting a color technician’s decision are gray bal-ance (G), tone reproduction (¹), and overall ap-pearance (A). Therefore, let x
1be the quality factor
G, x2
be ¹, x3
be A, and X"Mx1, x
2, x
3N.
3.2. Importance measure
The importance measure s of a color reproduc-tion gives the contribution of each separate qualityfactor and combination of factors to the total qual-ity level. To establish s, target transparencies wereselected and reproduced as mid-range offset colorreproductions. Fifteen color technicians weretrained to rate the importance to color reproduc-tion quality of the individual quality factors andcombination of factors as triangular fuzzy number.Next they were asked to evaluate each reproduc-tion for the quality factors of gray balance (G),appearance (A), tone reproduction (¹), and then topresent the results in the form of a triangular fuzzynumber between 1 and 10 by specifying its lowest,highest, and most likely value. The decision to usetriangular fuzzy numbers between 1 and 10 wasbased on experience in the printing field and theauthors’ belief that color technicians best relate tothis scale.
The data collection forms for the 15 experts wereanalyzed using a fuzzy spread sheet applicationpackage called FuzzyCalcTM for WindowsTM toyield a composite importance measure for mid-range offset color reproduction. The resultingvalues of s are presented below in Table 1.
C. Temponi et al. /Int. J. Production Economics 58 (1999) 31—37 33

3.3. Quality evaluation functions
For a particular color reproduction a similarapproach can be used to obtain values for f (x
1),
f (x2), f (x
3). Each expert evaluates the reproduction
for gray balance, tonal reproduction, and overallappearance in terms of a triangular fuzzy number.These are then defuzzified and averaged usingFuzzyCalcTM to yield a crisp value for f (x
i). Accord-
ing to Wang and Klir [10], this average is veryclose to the true quality level if the number of colorexperts evaluating the color is large enough.
3.4. Example
Given a color reproduction, technicians evaluatethe individual quality factors G, ¹, A to yield thecomposite scores f (G), f (¹), f (A). The numericalsynthetic evaluation E of the quality of the colorreproduction is then obtained from the fuzzy inte-gral : f ds of the scores f (x
i) with respect to import-
ance measure s.Let f (G)"0.6, f (¹)"0.8, f (A)"0.9 for the
mid-range offset importance measure given inTable 1. For this color reproduction the numericalsynthetic evaluation E is then calculated as follows,where s is the maximum operator.
E"P f ds
"[0.6's(XWF0.6
)]s[0.8's(XWF0.8
)]
s[0.9's(XWF0.9
)]
"[0.6's(X)]s[0.8's(¹, A)]s[0.9's(A)]
"[0.6'1]s[0.8'0.819]s[0.9'0.569]
"0.6s0.8s0.569
"0.8.
3.5. Quantifying customer quality expectation
Once the importance measure is established,a decision (accept or reject) on a particular colorreproduction requires that the customer’s qualityexpectation be quantified. For nine months threecolor technicians were instructed to grade the qual-
ity level of factors G, ¹, A with triangular fuzzynumbers between 1 and 10 for any reproductiondeemed acceptable for customer review. Thesenumbers were then entered on a quality factorevaluation log form. When a customer accepteda color reproduction, FuzzyCalcTM averaged thethree fuzzy numbers using fuzzy set theory and thendefuzzified the result. In this manner, the minimumquality value required for acceptance by a particu-lar customer could be obtained. For example,magazine DM required a synthetic quality level of0.75 for acceptance.
4. Results
Twenty-five mid-range offset color reproduc-tions were selected to test the performance of themodel in a color reproduction environment. Eachreproduction was reviewed by three color expertsand evaluated for the quality factors of G, ¹, A. Thescores are shown in Table 2. For each reproductionthe synthetic quality value was calculated. The jobswere then rejected or accepted after their syntheticquality value was compared with the acceptablequality values in Table 3, which shows that 20 jobswere accepted and five rejected.
To compare these results with the conventionalsubjective method, a fourth color expert evaluatedthe 25 reproductions and rejected eight. Regardlessof a job’s acceptance or rejection using either ap-proach, each job was sent to the customer.
An evaluation of the model’s performance re-quires that costs be associated with the four pos-sible combinations of rejecting or accepting a jobby color expert and customer. A job here is definedas an 8.5A by 11A color reproduction, and everyround of color modification involves the followingsteps (1—6) and factors (7—10):
1. locating the digital file,2. loading the file on the color workstation,3. performing the color modification,4. archiving the new image,5. manufacturing a set of film,6. manufacturing a prepress color proof,7. disrupting the production schedule,8. increase in overtime on misplaced jobs,
34 C. Temponi et al. /Int. J. Production Economics 58 (1999) 31—37
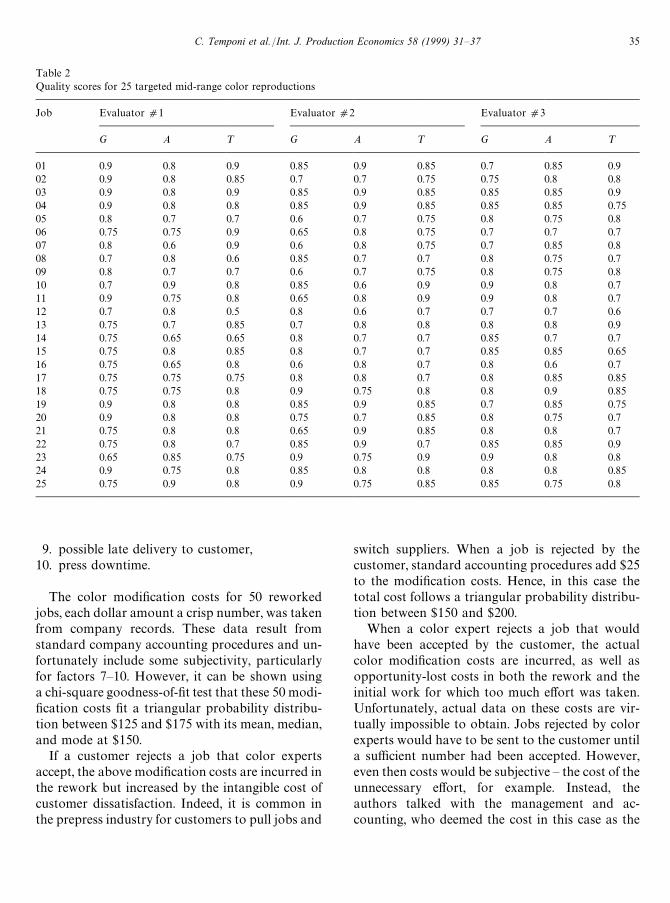
Table 2Quality scores for 25 targeted mid-range color reproductions
Job Evaluator d1 Evaluator d2 Evaluator d3
G A ¹ G A ¹ G A ¹
01 0.9 0.8 0.9 0.85 0.9 0.85 0.7 0.85 0.902 0.9 0.8 0.85 0.7 0.7 0.75 0.75 0.8 0.803 0.9 0.8 0.9 0.85 0.9 0.85 0.85 0.85 0.904 0.9 0.8 0.8 0.85 0.9 0.85 0.85 0.85 0.7505 0.8 0.7 0.7 0.6 0.7 0.75 0.8 0.75 0.806 0.75 0.75 0.9 0.65 0.8 0.75 0.7 0.7 0.707 0.8 0.6 0.9 0.6 0.8 0.75 0.7 0.85 0.808 0.7 0.8 0.6 0.85 0.7 0.7 0.8 0.75 0.709 0.8 0.7 0.7 0.6 0.7 0.75 0.8 0.75 0.810 0.7 0.9 0.8 0.85 0.6 0.9 0.9 0.8 0.711 0.9 0.75 0.8 0.65 0.8 0.9 0.9 0.8 0.712 0.7 0.8 0.5 0.8 0.6 0.7 0.7 0.7 0.613 0.75 0.7 0.85 0.7 0.8 0.8 0.8 0.8 0.914 0.75 0.65 0.65 0.8 0.7 0.7 0.85 0.7 0.715 0.75 0.8 0.85 0.8 0.7 0.7 0.85 0.85 0.6516 0.75 0.65 0.8 0.6 0.8 0.7 0.8 0.6 0.717 0.75 0.75 0.75 0.8 0.8 0.7 0.8 0.85 0.8518 0.75 0.75 0.8 0.9 0.75 0.8 0.8 0.9 0.8519 0.9 0.8 0.8 0.85 0.9 0.85 0.7 0.85 0.7520 0.9 0.8 0.8 0.75 0.7 0.85 0.8 0.75 0.721 0.75 0.8 0.8 0.65 0.9 0.85 0.8 0.8 0.722 0.75 0.8 0.7 0.85 0.9 0.7 0.85 0.85 0.923 0.65 0.85 0.75 0.9 0.75 0.9 0.9 0.8 0.824 0.9 0.75 0.8 0.85 0.8 0.8 0.8 0.8 0.8525 0.75 0.9 0.8 0.9 0.75 0.85 0.85 0.75 0.8
9. possible late delivery to customer,10. press downtime.
The color modification costs for 50 reworkedjobs, each dollar amount a crisp number, was takenfrom company records. These data result fromstandard company accounting procedures and un-fortunately include some subjectivity, particularlyfor factors 7—10. However, it can be shown usinga chi-square goodness-of-fit test that these 50 modi-fication costs fit a triangular probability distribu-tion between $125 and $175 with its mean, median,and mode at $150.
If a customer rejects a job that color expertsaccept, the above modification costs are incurred inthe rework but increased by the intangible cost ofcustomer dissatisfaction. Indeed, it is common inthe prepress industry for customers to pull jobs and
switch suppliers. When a job is rejected by thecustomer, standard accounting procedures add $25to the modification costs. Hence, in this case thetotal cost follows a triangular probability distribu-tion between $150 and $200.
When a color expert rejects a job that wouldhave been accepted by the customer, the actualcolor modification costs are incurred, as well asopportunity-lost costs in both the rework and theinitial work for which too much effort was taken.Unfortunately, actual data on these costs are vir-tually impossible to obtain. Jobs rejected by colorexperts would have to be sent to the customer untila sufficient number had been accepted. However,even then costs would be subjective — the cost of theunnecessary effort, for example. Instead, theauthors talked with the management and ac-counting, who deemed the cost in this case as the
C. Temponi et al. /Int. J. Production Economics 58 (1999) 31—37 35

Table 3Accepted or rejected targeted mid-range color reproductions
Job Quality value Result
01 0.818595 A02 0.766667 A03 0.85 A04 0.85 A05 0.716667 R06 0.75 A07 0.75 A08 0.75 A09 0.716667 R10 0.766667 A11 0.783333 A12 0.7 R13 0.766667 A14 0.7 R15 0.783333 A16 0.683333 R17 0.783333 A18 0.8 A19 0.8 A20 0.75 A21 0.783333 A22 0.816667 A23 0.8 A24 0.783333 A25 0.8 A
Table 4Crisp cost matrix C
Cust(A) Cust(R)
CX(A) $0 $175CX(R) $350 $150
critical one in the industry. Being too good is ex-pensive in color reproduction. From such dis-cussions we concluded that a reasonable costmodel was a triangular probability distribution be-tween $300 and $400 with a mean, median, andmode being $350.
Since there is no cost associated with acceptanceof a job by both the color expert and the customer,the previous information suggests the followingmatrix C of mean costs (also the median and modalcosts). In Table 4, CX(A) and CX(R) denote thecolor expert accepting and rejecting a job, respec-tively, while C(A) and C(R) refer to the customer’sacceptance and rejection.
Recall that all 25 jobs were sent to the customer.Of the 20 accepted by the model, two were rejectedby the customer, who also accepted one of five thatthe model rejected. Of the 17 accepted by the colorexpert using the usual approach, one was rejectedby the customer, who also accepted two of eight
that the expert rejected. These results may be repre-sented by the matrices
C(A) C(R)
CX(A)
CX(R) C18 2
1 4D and
C(A) C(R)
CX(A)
CX(R) C16 1
2 6D.
The cost CM
associated with the model is then givenby
CM"C
18 2
1 4D?C$0 $175
$350 $150D"$1300,
where ? denotes the matrix multiplication(18)(0)#(2)(175)#(1)(350)#(4)(150). Similarly C
Sfor the standard or conventional approach is
CS"C
16 1
2 6D?C$0 $175
$350 $150D"$1775.
These numbers show a performance by themodel superior to that for the usual approach. Themain reason is that the model rejected fewer accept-able jobs than the usual approach. Based on thissmall sample and cost estimates, our model seemswell-suited to make decisions for mid-range colorreproduction.
5. Conclusion
The fuzzy approach to color quality evaluationproposed here produced better acceptance/rejec-tion results on a small sample of mid-range colorreproductions than the conventional method. Thelimitations of the work are the cost estimates, whichare difficult to obtain, and the size of the sample.Unfortunately, both are difficult to obtain, and one
36 C. Temponi et al. /Int. J. Production Economics 58 (1999) 31—37

of the authors has recently change industry so thatdata is no longer available. Further research shouldaddress these points. In addition, such additionalfactors as the quality of the original and a measureof the customer’s standards might be considered.
References
[1] ANSI, Color Print,Transparencies, and PhotomechanicalReproductions Viewing Conditions, PH2.3, 1989.
[2] L.A. Zadeh, Fuzzy sets, Information and Control 8 (1965)338—353.
[3] A. Kandel, Fuzzy statistics and forecast evaluation, IEEETransactions in Systems, Man and Cybernetics 8 (1978)396—401.
[4] M.T. Lamata, S. Moral, Classification of fuzzy measures,Fuzzy Sets and System 33 (1989) 243—253.
[5] M. Sugeno, Theory of Fuzzy Integral and Its Application,Ph.D. Dissertation, Tokyo Institute of Technology, 1974.
[6] G. Banon, Distinction between several subsets of fuzzymeasure, Fuzzy Sets and Systems 5 (1981) 291—305.
[7] Q. Zhong, On fuzzy measure and fuzzy integral on fuzzyset, Fuzzy Sets and Systems 37 (1990) 77—92.
[8] P. Wakker, A behavioral foundation for fuzzy measures,Fuzzy Sets and Systems 37 (1990) 327—350.
[9] H. Suzuki, On fuzzy measures defined by fuzzy integrals,Journal of Mathematical Analysis and Applications 132(1985) 87—101.
[10] Z. Wang, G.J. Klir, Fuzzy Measure Theory, Plenum Press,New York, 1992.
[11] J.R. Sims, Z. Wang, Fuzzy measures and fuzzy integrals: anoverview, International Journal of General Systems 17(1990) 157—189.
[12] G.G. Field, Color scanning and imaging systems, ResearchProject Report No. 1431, Graphic Arts Technical Founda-tion, Pittsburgh, PA, 1990.
C. Temponi et al. /Int. J. Production Economics 58 (1999) 31—37 37