A Framework for Segmentation Using Edge Guided Region segmentation and edge detection are standard...
9
Abstract—Region segmentation and edge detection are standard image processing operations. Clustering can be used for region segmentation. However, often clustering results depend on the selection of various parameters, such as the number of clusters, or the clustering algorithm used. The framework presented here employs the result of edge detection on the original image, as well as on the clustering results of the same image, to automatically select (according to some agreement measure) the optimal number of clusters, and the corresponding (best) segmentation. The framework supports an extended pixel representation in which other information, such as texture, can be incorporated in addition to edge and region information. To illustrate this framework, the edge guided clustering algorithm presented here, uses the Canny edge detection approach to guide region identification through fuzzy k-means clustering. Experimental results on benchmark images for which manual segmentation is available as reference illustrate the effectiveness of this approach. Index Terms—Image segmentation, fuzzy k-means clustering, canny edge. I. INTRODUCTION The goal of image segmentation is to partition an image into meaningful regions, i.e. regions corresponding to individual objects, or natural parts of objects. Segmentation could be used for tasks such as object recognition, occlusion boundary estimation within motion, image compression, image editing, or content-based image retrieval from large databases [1]. A. Background and Related Work Several review papers point out that there are many segmentation approaches using various features extracted from the image, such as gray scale values, texture, and gradient [2], [3], [4], [5]. At an algorithmic level, the main approaches to segmentation are classified as non-contextual and contextual techniques [6]. The first category groups pixels together based on some similarity in features (e.g. similar gray scale value), whereas the second approach uses also relationships among features (such as closeness between S. Visa is assistant professor in the Department of Mathematics and Computer Science at The College of Wooster, Wooster, OH 44691, USA (email: [email protected]). A. L. Ralescu is the director of the Machine Learning and Computational Intelligence Laboratory and professor in the School of Computing Sciences and Informatics at the University of Cincinnati, Cincinnati, OH 45221, USA (email: [email protected]). M. Ionescu is computer vision scientist at the Charles River Laboratories (SPC), Seattle, WA 98104, USA (email: [email protected]). pixels and boundary-based techniques). The approach proposed here combines both techniques. It starts from the observation that boundary information and region information are, to some extent, complementary in nature. The boundary analysis relies on dissimilarity of neighboring pixels, whereas region detection techniques take advantage of certain similarities between pixels. Therefore, it is expected that, due to their complementarity, when combined these techniques will produce segmentation results which are better than those obtained by each of these techniques separately [3]. Considering the stage when the techniques are used, two main approaches are distinguished for segmentation methods integrating region and boundary information [3]: • Embedded integration – when the edge information is used during the region finding step; • Post-processing integration – when the two sets of information are developed in parallel and then are fused together. Examples of post-processing integration include edge and region data [7], region growing guided by an evaluation function [8], constraint clustering approaches [9]. B. Current Approach The framework presented here and illustrated in Fig. 1 is also a post-processing integration approach with the following features. Mainly, this approach uses the fuzzy k-means clustering for region detection, and edge detection to infer k, the (optimal) number of clusters. Optionally, it supports texture information and can isolate the foreground for better segmentation. To select k, the approach makes use of an evaluation component between edge detection from the original and clustered images. This component is implemented as a measure of goodness. Several such measures are considered here. Fig. 1. Segmentation using edge guided image clustering framework. The particular problem addressed in this research is automatic detection of various components within an image A Framework for Segmentation Using Edge Guided Image Clustering Sofia Visa, Anca L. Ralescu, and Mircea Ionescu International Journal of Information and Electronics Engineering, Vol. 2, No. 1, January 2012 29 Manuscript received July 25, 2011; revised August 28, 2011. This work was partially supported by the NSF under Grant IOS 0922661 (2009) and by the College of Wooster Faculty Start-up Fund (2008).
Transcript of A Framework for Segmentation Using Edge Guided Region segmentation and edge detection are standard...
Abstract—Region segmentation and edge detection are
standard image processing operations. Clustering can be used for region segmentation. However, often clustering results depend on the selection of various parameters, such as the number of clusters, or the clustering algorithm used. The framework presented here employs the result of edge detection on the original image, as well as on the clustering results of the same image, to automatically select (according to some agreement measure) the optimal number of clusters, and the corresponding (best) segmentation. The framework supports an extended pixel representation in which other information, such as texture, can be incorporated in addition to edge and region information. To illustrate this framework, the edge guided clustering algorithm presented here, uses the Canny edge detection approach to guide region identification through fuzzy k-means clustering. Experimental results on benchmark images for which manual segmentation is available as reference illustrate the effectiveness of this approach.
Index Terms—Image segmentation, fuzzy k-means clustering,
canny edge.
I. INTRODUCTION The goal of image segmentation is to partition an image
into meaningful regions, i.e. regions corresponding to individual objects, or natural parts of objects. Segmentation could be used for tasks such as object recognition, occlusion boundary estimation within motion, image compression, image editing, or content-based image retrieval from large databases [1].
A. Background and Related Work Several review papers point out that there are many
segmentation approaches using various features extracted from the image, such as gray scale values, texture, and gradient [2], [3], [4], [5]. At an algorithmic level, the main approaches to segmentation are classified as non-contextual and contextual techniques [6]. The first category groups pixels together based on some similarity in features (e.g. similar gray scale value), whereas the second approach uses also relationships among features (such as closeness between
S. Visa is assistant professor in the Department of Mathematics and Computer Science at The College of Wooster, Wooster, OH 44691, USA (email: [email protected]).
A. L. Ralescu is the director of the Machine Learning and Computational Intelligence Laboratory and professor in the School of Computing Sciences and Informatics at the University of Cincinnati, Cincinnati, OH 45221, USA (email: [email protected]).
M. Ionescu is computer vision scientist at the Charles River Laboratories (SPC), Seattle, WA 98104, USA (email: [email protected]).
pixels and boundary-based techniques). The approach proposed here combines both techniques.
It starts from the observation that boundary information and region information are, to some extent, complementary in nature. The boundary analysis relies on dissimilarity of neighboring pixels, whereas region detection techniques take advantage of certain similarities between pixels. Therefore, it is expected that, due to their complementarity, when combined these techniques will produce segmentation results which are better than those obtained by each of these techniques separately [3].
Considering the stage when the techniques are used, two main approaches are distinguished for segmentation methods integrating region and boundary information [3]:
• Embedded integration – when the edge information is used during the region finding step;
• Post-processing integration – when the two sets of information are developed in parallel and then are fused together.
Examples of post-processing integration include edge and region data [7], region growing guided by an evaluation function [8], constraint clustering approaches [9].
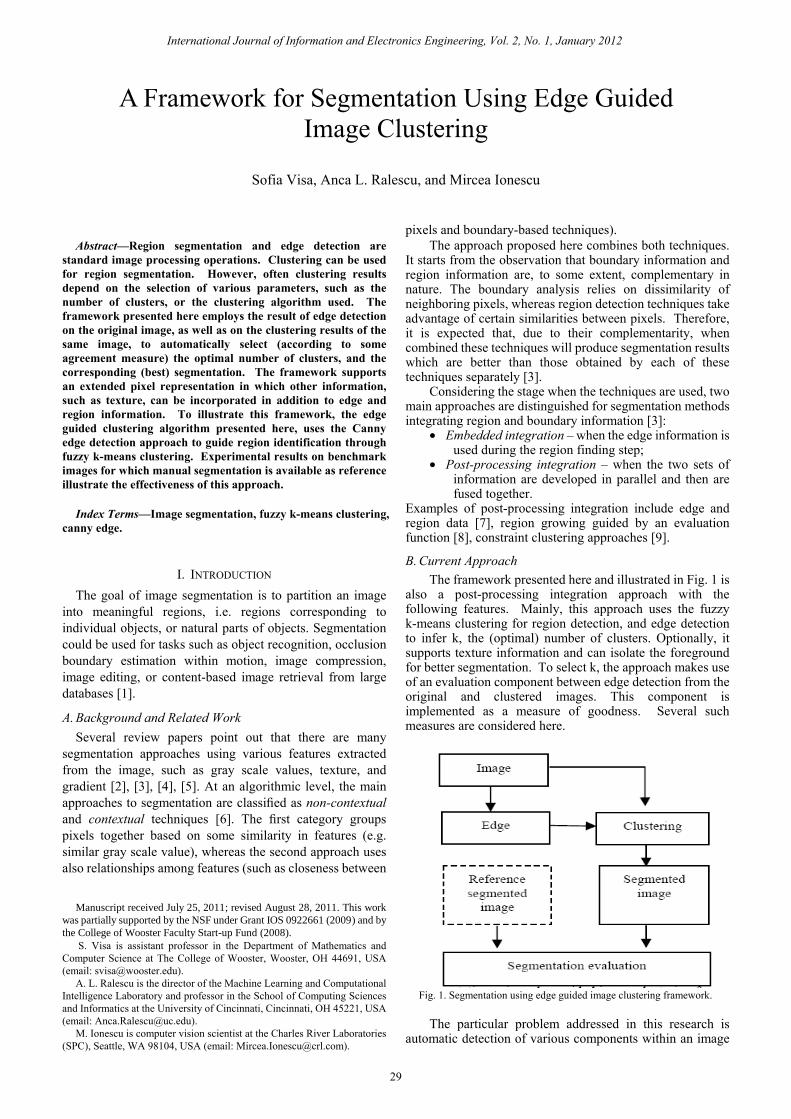
B. Current Approach The framework presented here and illustrated in Fig. 1 is
also a post-processing integration approach with the following features. Mainly, this approach uses the fuzzy k-means clustering for region detection, and edge detection to infer k, the (optimal) number of clusters. Optionally, it supports texture information and can isolate the foreground for better segmentation. To select k, the approach makes use of an evaluation component between edge detection from the original and clustered images. This component is implemented as a measure of goodness. Several such measures are considered here.
Fig. 1. Segmentation using edge guided image clustering framework.
The particular problem addressed in this research is
automatic detection of various components within an image
A Framework for Segmentation Using Edge Guided Image Clustering
Sofia Visa, Anca L. Ralescu, and Mircea Ionescu
International Journal of Information and Electronics Engineering, Vol. 2, No. 1, January 2012
29
Manuscript received July 25, 2011; revised August 28, 2011. This work
was partially supported by the NSF under Grant IOS 0922661 (2009) and by
the College of Wooster Faculty Start-up Fund (2008).

based on color information. Images are represented in the CIELUV color space [10], from which L, the luminosity space is used for edge detection. In this space the Euclidean distance is consistent with that perceived by the human eye.
C. Organization of this Paper From this point on the paper is organized as follows:
section II exemplifies a possible implementation of the framework illustrated in Fig. 1, namely the edge guided clustering algorithm (EGC), section III shows experimental results of the EGC algorithm, and section IV concludes this research and points out possible extensions.
II. THE EDGE GUIDED CLUSTERING ALGORITHM (EGC) One of the main difficulties in using clustering in
automatic image segmentation is the selection of number of clusters. In the current framework the number of clusters that maximizes the agreement between segmentation and the output of an edge detection operator is selected. For illustration purposes the work presented here uses the fuzzy k-means clustering algorithm [11], [12] and the Canny edge detection method [13]. The resulting EGC algorithm is described in Fig. 2. It is important to point out from the start that any other choices of clustering and/or edge detection approaches fit into this framework.
As shown in Fig. 2, the EGC algorithm consists of three major stages, as follows.
Fig. 2. Flowchart of the edge guided clustering algorithm (EGC).
EGC-Tex version incorporates the texture filter as well (illustrated here by the path of single line arrows).
A. Stage I: Preprocessing First, the RGB image data is mapped into CIELUV space.
Optionally at this stage, the foreground is isolated from the background and the corresponding image is passed on to the subsequent stages of the algorithm. Foreground isolation works well for images where the background is connected to the margins of the image (e.g. nature images). However, this operation may not be needed for images with no background. Initial results (see section III) show great improvement on segmentation when the background is isolated. In particular on images from nature, where the background might consist of many shades of same color (such as blue sky or green grass), eliminating the background improves the chances of the clustering algorithm to find meaningful clusters that correspond to objects in the image.
The background segmentation approach used here selects as background that portion of the image with the smallest average minimum distance to the image margins. Fuzzy k-means algorithm, with various values of k∊K⊆{1, 2, 3, …}, is used to generate background candidates. More precisely, background segmentation is obtained as follows:
For every pixel x in the image the distance dm to the image margin is defined by
}4,3,2,1),,(min{)( == imxdxdm i
where mi, i=1,2,3,4 denote the four margins of the image.
For fixed k∊K denote by Ck,j, j=1,…,k the cluster j obtained from the corresponding fuzzy k-means algorithm with Euclidean distance between the pixels. For each cluster Ck,j denote by dk,j the cluster average distance to the margin defined as:
,
,,
( ), 1, ,k jx C
k jk j
dm xd j k
C∈= =∑
…
where |Ck,j| is the size (number of pixels) of Ck,j.
The image background is selected as the cluster Ck0,j0, where
0
0
00
,0
,0
}min{arg
},,1min{arg
k
jk
jkk
jj
Kkdk
kjdj
k
=
∈=
== …
In other words the background corresponds to the j0 cluster
generated by the fuzy k-means with k=k0. In the experiments carried here K={2,3,4}.
B. Stage II: Edge Detection and Segmentation In this step the boundary and region information are
extracted. For boundary, the Canny method [13] finds edges by looking for local maxima of the gradient in a gray scale image. The gradient is calculated using the derivative of a Gaussian filter. The method uses two thresholds, to detect strong and weak edges, and includes the weak edges in the output only if they are connected to strong edges. This
International Journal of Information and Electronics Engineering, Vol. 2, No. 1, January 2012
30
method is therefore less likely to be affected by noise, while at the same time more likely to generate meaningful true weak edges.
The fuzzy k-means algorithm [11] is used to compute the regional information, but other unsupervised clustering methods, or even other region detection techniques can be used at this stage. The fuzzy k-means algorithm has the advantage that clusters are more robust to variations of pixel values reflecting variations within the same color. Moreover, because each pixel belongs to more than one of the k clusters (with various degrees in [0, 1]), the membership values can be further used to generate different region areas.
Boundary information, the set of edges resulted from the Canny method denoted by CEL in Fig. 1, guides the fuzzy k-means using a measure to evaluate the agreement between CEL and CEC
k, the result of Canny edge detection on clusters. Measures to evaluate the agreement between different segmentations have been extensively studied. Many of these measures are based on the Rand index [14] and its various extensions [15], or measures of errors [15]. The current work uses measures of overlap between CEL and CEC
k, relative to CEC
k, CEL or their union, for various values of k. For a binary image I (the result of the edge detection), the overlap O(A,B) of subsets A and B of I is defined as
{ }∑∈
∩×=Ix
BA xIIBAO )(),( 1
That is, O(A,B) counts the common pixels of A and B. Next, for various values of k the following measures are
defined:
{ }
{ }
{ }∑
∑
∑
∈∪
∈
∈
×=
×=
×=
IxCECE
kCLk
IxCE
kCLk
IxCE
kCLk
xIICECEOM
xIICECEOM
xIICECEOM
kCL
L
kC
)(),(
)(),(
)(),(
13
12
11
In the experiments carried out here K={2,…,20}. M1
k and M2
k measure the degree of inclusion between CEL and CECk,
respectively, while M3k quantifies the degree of their
intersection relative to their union. Since M1k and M2
k are not symmetric, a symmetric version, M4
k is obtained by applying a symmetric binary operator to them. Here they are multiplied. That is,
kkk MMM 214 ×=
C. Stage III: Segmentation Selection Any measure Mi
k, i=1,…,4 can be used to determine the optimal value for k, the parameter of the fuzzy-k algorithm. More precisely,
}20,,2max{arg0 …== kMk k
ii
where i=1,…,4. That is, for each measure of agreement the optimal k is considered to be that for which the edge sets produced by Canny edge detector from the original image and from the clustered image agree the most.
D. Incorporating Texture into the EGC Framework For some types of images (e.g. natural scene images)
texture information can aid the segmentation process. The framework presented here can easily support the additional texture information, as shown in Fig. 1. While there are many texture operators, here the standard deviation calculated for each pixel within a vicinity of 11x11 and 3x3 pixels is used. Pixel representation is extended by adding texture information as another (4th) dimension. The EGC algorithm with texture is referred here as EGC-Tex.
III. EXPERIMENTAL RESULTS Experiments with the framework described above were
carried out on 40 images from The Berkeley Segmentation Dataset and Benchmark [16]. However, due to space limitation, the results included in this section illustrate a subset of representative (with various degrees of difficulty) images.
How good are these results? As it is well known, and often pointed in the literature, there are no unified evaluation methods for image segmentation algorithms [16] and [17]. This is due to the fact that segmentation evaluation is usually application dependent (e.g. context-based image retrieval, medical field, etc.). Yet, here, the objective is to obtain an approach which is as much as possible application independent. The segmentation results are evaluated relative to the manually segmented images obtained from [16] using the corresponding measures of edge agreement from the previous section.
In the results discussed next, the EGC segmentation algorithm with background/foreground segmentation step using M1 measure is used by default, unless it is otherwise specified. Also it must be mentioned that after segmentation, each pixel is colored with the color obtained by averaging the colors of all pixels in its cluster. Note that here a cluster can consist of several spatially disjoint regions within the image (e.g. the yellow cluster in the Two flowers image consists of three regions visible in Fig. 5).
A. Canny Edge, Clustering Edge, and the Manual Segmentation
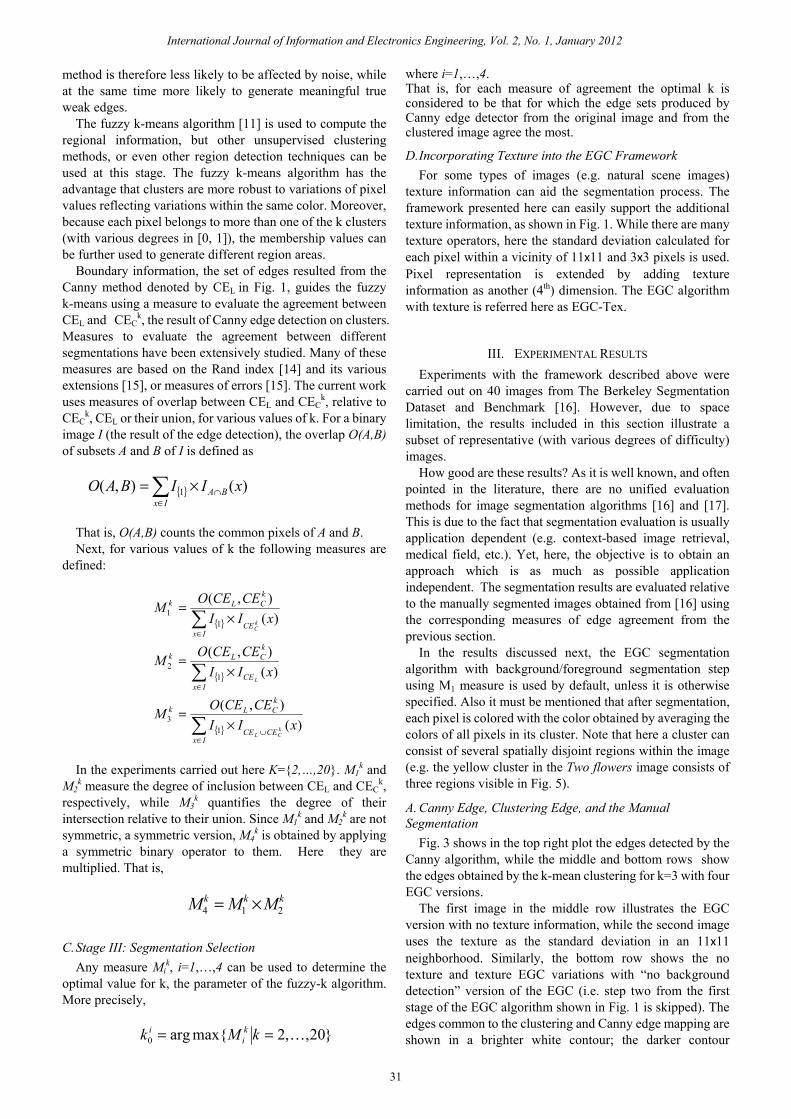
Fig. 3 shows in the top right plot the edges detected by the Canny algorithm, while the middle and bottom rows show the edges obtained by the k-mean clustering for k=3 with four EGC versions.
The first image in the middle row illustrates the EGC version with no texture information, while the second image uses the texture as the standard deviation in an 11x11 neighborhood. Similarly, the bottom row shows the no texture and texture EGC variations with “no background detection” version of the EGC (i.e. step two from the first stage of the EGC algorithm shown in Fig. 1 is skipped). The edges common to the clustering and Canny edge mapping are shown in a brighter white contour; the darker contour
International Journal of Information and Electronics Engineering, Vol. 2, No. 1, January 2012
31
corresponds to cluster edges not matched by the Canny edge mapping. As it can be seen in this figure, the Canny and k-means edges do not fully overlap, hence the necessity to compute the agreement between the two sets of edges, and further to maximize this agreement over all clusters within an image. Also, these figures illustrate how different EGC versions lead to different clustering and hence, to different final segmentations. As it will be illustrated later, the EGC with background selection (and sometimes with texture information) leads to better segmentation.
Fig. 4 shows the original seven images selected to illustrate the EGC segmentation algorithm, their corresponding manual segmentations [16], and the best segmentation found by the EGC algorithm.
B. EGC and Goodness Evaluation Fig. 5 shows the segmentation results produced by the EGC in conjunction with the four measures defined in section II B. The authors’ more are less subjective evaluation declares M1 and M3 as better measures to guide the “best” segmentation (i.e. clustering). They rank the goodness of these measures as M1, M3, M4, and M2. A less subjective analysis of the four evaluation methods uses similarity (as number of clusters) between the clustering obtained from EGC with Canny edge (CE) and the clustering obtained from EGC with Canny applied to manually segmented edge (referred here as ground truth, GT). This analysis is based on the data from Table I where, the optimal (according to the four measures) values for k in the fuzzy k-means clustering for CE and GT are listed. The table also shows, for each of the four measures, the mean and the standard deviation of the difference between the number of clusters k inferred from each category of images (GT and CE). The instances where the k values are the same for a given measure are shown in bold.
Intuitively, a smaller mean and standard deviation correspond to a better evaluation measure. For example, when all k values for GT and CE coincide, the mean and standard deviation of their difference will be zero. This observation, in conjunction with the data from Table I, leads to the following ranking of evaluation measures: M1, M3, M4, and M2. This is an interesting result which agrees with the human perception and interpretation of the segmentations from Fig. 5.
C. Variations of the EGC Algorithm Fig. 6 contrasts four variants of the basic EGC algorithm: EGC with background segmentation step (second row), EGC with no background segmentation (third row), EGC-Tex with background segmentation (fourth row), and EGC-Tex with no background segmentation (bottom row). Overall, the EGC variant in which the background segmentation step is performed leads to better final segmentations. For example, the segmentations in row two are more alike to the original images (shown in the first row of Fig. 6), in particular the Two Asian faces, Rhinoceros, and Acropolis pictures. The Two Asian faces image is also better segmented in the EGC-Tex with background segmentation (fourth image in row four) than in the EGC-Tex with no background segmentation (fourth image, bottom row), where part of the red blouse is wrongly clustered with the hair.
The EGC algorithm with background segmentation consistently gives better results in all the images tested (recall that not all results are included here). This is partially due to the fact that variations within the background influence (and change) too much similar (color-wise) clusters in foreground. So this step is almost always useful, however, the background/foreground segmentation can be tricky. That is, one must be sure that the true background is selected; otherwise all the subsequent steps are meaningless. The background selection method proposed in section II A works for all the images tested here.
The texture addition used here, i.e. the standard deviation within a neighborhood, does not improve the segmentation as much as the background/foreground selection step. However, other textures may boost more clearly the segmentation. For example, a pixel’s closeness to one or more edges might be more meaningful. An example of a (possibly) better segmentation due to texture information is the horse image (third image in the fourth row), where the shades on the horse are visible; in the other segmentations of this image those shades are not captured. This is deemed a “possibly better” segmentation, because the evaluation in image segmentation is always context-dependent: for some applications the detection of the horse is sufficient, whereas other applications may require a finer reconstruction of the original image.
IV. CONCLUSION The edge guided clustering framework for segmentation
proposed here leads to an automatic segmentation approach which uses boundary detection for segmentation selection. The approach is automated in the sense that it does not depend on a threshold selection as many segmentation algorithms do [5]. Rather, boundary information serves to automatically select the clustering that gives the best segmentation, according to some agreement measure between the boundary and the clustering information. The framework also supports texture information and various evaluations of goodness of segmentation relative to manual segmentation.
This approach is illustrated on several images through the edge guided clustering algorithm. The experimental results show that separating the background and continuing the analysis on the foreground only gives, in general, better segmentations.
Investigating different color spaces (e.g. HSV or RGB), various texture information, and different distances within the fuzzy k-means clustering (here the Euclidean distance was used) are considered for future work. Also, further use of pixel membership degrees obtained with fuzzy k-means clustering may lead to better segmentations of some images. For instance, only the pixels with a membership degree larger than 0.5 should be labeled as belonging to a given class; the remaining of the “weaker” pixels could be used for another round of processing that may use spatial information. Finally, comparing the EGC algorithm with other segmentation approaches and a more formal evaluation for assessing the segmentation quality are also important directions for future study.
International Journal of Information and Electronics Engineering, Vol. 2, No. 1, January 2012
32

TABLE I: COMPARISON BETWEEN THE NUMBER OF CLUSTERS OBTAINED THROUGH EGC GUIDED BY MANUAL SEGMENTATION (GT) AND CANNY OPERATOR (CE) THE SHADED COLUMN, CORRESPONDING TO MEASURE M1CONTAINS THE BEST RESULTS, IN THE SENSE OF HIGHEST AGREEMENT BETWEEN THE CANNY
EDGES FROM THE MANUALLY SEGMENTED IMAGE AND THE CLUSTERED IMAGE.
Number of clusters, k, determined by each evaluation measure guided by the manual segmentation (GT) and Canny operator (CE)
M1 M2 M3 M1xM2 GT CE GT CE GT CE GT CE
Orig
inal
Imag
es Starfish 3 3 4 8 3 3 3 3
Acropolis 8 3 3 4 8 3 3 4 Rhinoceros 3 4 5 5 3 6 3 8 Horses 10 3 3 3 10 3 10 3 Two red flowers 3 4 6 15 3 4 3 7 Two Asian faces 3 3 8 6 3 3 5 4 Building 3 3 6 6 3 3 7 6
Difference between GT and CE guided clustering
Mean 14/7=2 16/7=2.28 16/7=2.28 19/7=2.71
Standard Deviation 2.83 3.30 2.81 2.43
Mean x Standard Deviation
5.66 7.52 6.40 6.58
Original image Canny edge
EGC k=3
EGC-Tex std 11x11 k=3
EGC-No Background k=3
EGC-Tex std 11x11 No Background k=3
Fig. 3. Illustration of canny edges (top right figure) and clustering edges using EGC with background selection (first figure, second line), EGC-Tex with background selection (second figure, second line), EGC with no background selection (first figure, bottom line), and EGC-Tex with no background
selection.The edges common to the clustering and Canny edge are shown in a brighter white contour; the darker contour corresponds to cluster edges not matched by Canny edge.
International Journal of Information and Electronics Engineering, Vol. 2, No. 1, January 2012
33
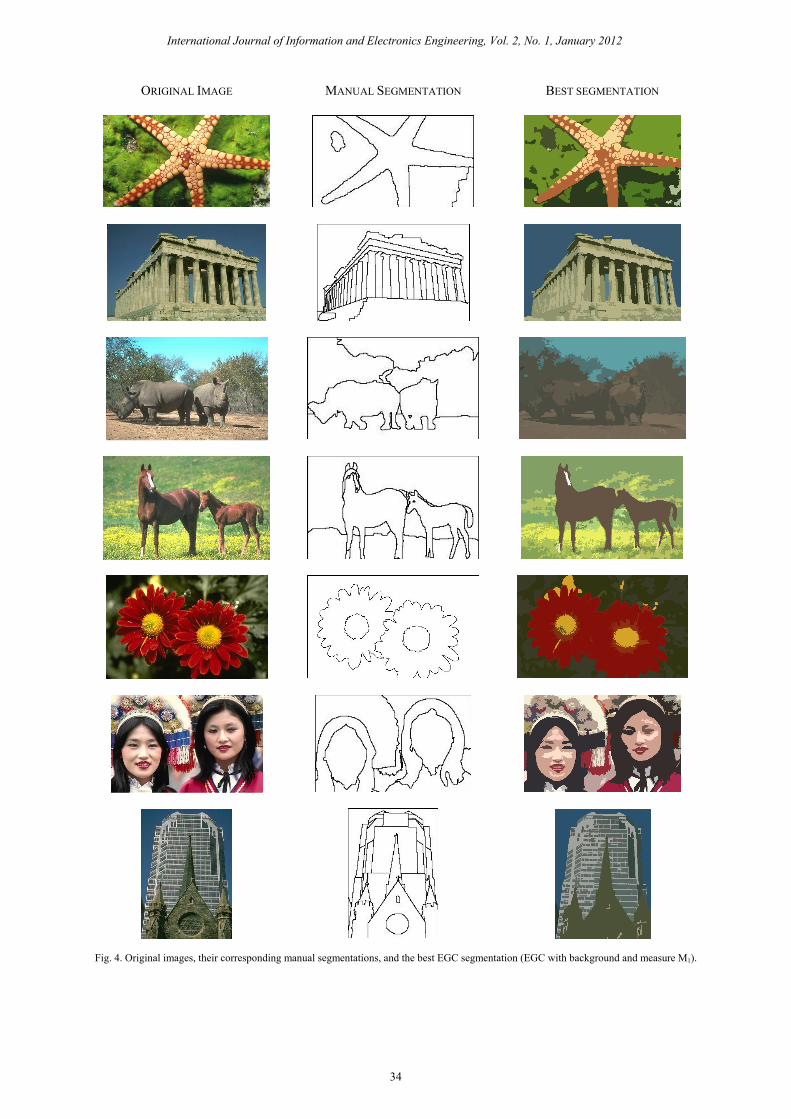
ORIGINAL IMAGE MANUAL SEGMENTATION BEST SEGMENTATION
Fig. 4. Original images, their corresponding manual segmentations, and the best EGC segmentation (EGC with background and measure M1).
International Journal of Information and Electronics Engineering, Vol. 2, No. 1, January 2012
34
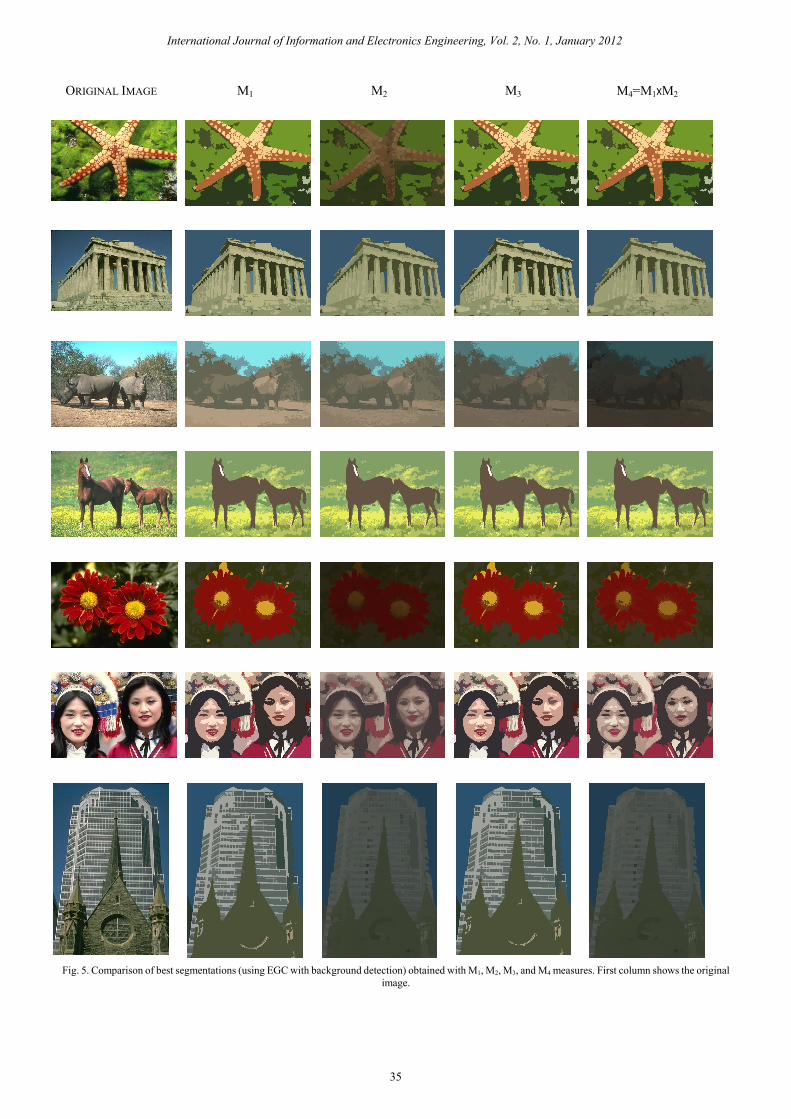
ORIGINAL IMAGE M1 M2 M3 M4=M1XM2
Fig. 5. Comparison of best segmentations (using EGC with background detection) obtained with M1, M2, M3, and M4 measures. First column shows the original
image.
International Journal of Information and Electronics Engineering, Vol. 2, No. 1, January 2012
35

ORIGINAL IMAGE
EGC WITH BACKGR.
SEGMENT.
EGC WITH NO
BACKGR. SEGMENT.
EGC-TEX WITH
BACKGR. SEGMENT.
(STD 11X11)
EGC-TEX WITH NO BACKGR.
SEGMENT. (STD
11X11)
Fig. 6. Segmentation results contrasting EGC with background detection (second row) vs. EGC with no background detection (third row) vs. EGC-Tex with background detection (fourth row) vs. EGC-Tex with no background detection (bottom row).
REFERENCES [1] G.A. Baxes, Digital Image Processing: Principles and Applications,
John Wiley, 1994. [2] N.R. Pal and S.K. Pal, “A review on image segmentation techniques,”
Pattern Recognition, vol. 26, no. 9, pp. 1277-1294, 1993. [3] X. Muñoz, J. Freixenet, X. Cufı́, and J. Martı́, “Strategies for image
segmentation combining region and boundary information,” Pattern Recognition Letters, vol. 24, no. 1-3, pp. 375-392, 2005.
[4] O. Tsang, A. Gholipour, N. Kehtarnavaz, K. Gopinath, R. Briggs, and I. Panahi, “Comparison of tissue segmentation algorithms in neuroimage analysis software tools,” Proceedings of the 30th Annual International Conference of the IEEE Engineering in Medicine and Biology Society, pp. 3924 -3928, 2008.
[5] Y.J. Zhang, “Evaluation and comparison of different segmentation algorithms,” Pattern Recognition Letters, vol. 18, no. 10, pp. 963-974, 1997.
[6] G. Dougherty, Digital Image Processing for Medical Applications, Cambridge University Press, 2009.
International Journal of Information and Electronics Engineering, Vol. 2, No. 1, January 2012
36
[7] J. Lemoigne and J.C. Tilton, “Refining image segmentation by integration of edge and region data”, IEEE Transactions on Geosciences and Remote Sensing, vol. 33, no. 3, pp. 605-615, 1995.
[8] C. Revol-Muller, F. Peyrin, C. Odet, and Y. Carillon, “Automated 3D region growing algorithm governed by an evaluation function,” Int. Conference on Image Processing, pp. 440-443, 2000.
[9] M. Luo, Y.F. Ma, and H.J. Zhang, “A spatial constrained K-means approach to image segmentation,” Proceedings of the 2003 Joint Conference of the Fourth International Conference on Information, Communications and Signal Processing, and the Fourth Pacific Rim Conference on Multimedia, vol. 2, pp. 738-742, 2003.
[10] J. Schanda, Colorimetry: Understanding the CIE System, Wiley Interscience, Epub 2007.
[11] J.C. Bezdek, Pattern Recognition with Fuzzy Objective Function Algorithms, Plenum, NY, 1981.
[12] J. C. Dunn. A Fuzzy Relative of the ISODATA Process and its Use in Detecting Compact, Well Separated Clusters, J. Cyber., vol. 3, pp. 32-57, 1974.
[13] J. Canny, “A Computational Approach to Edge Detection”, IEEE Trans. on Pattern Analysis and Machine Intelligence, vol. 8, no. 6, pp. 679-698, 1986.
[14] R. Unnikrishnan, C. Pantofaru, and M. Hebert, “Toward Objective Evaluation of Image Segmentation Algorithms,” IEEE Transactions on Pattern Analysis and Machine Intelligence, vol. 29, no. 6, 2007.
[15] L. Yang., R. Jin, C. Pantofaru, and R. Sukthankar, “Discriminative Cluster Refinement: Improving Object Category Recognition Given Limited Training Data,” in Proc. of the IEEE Conference on Computer Vision and Pattern Recognition, 2007.
[16] The Berkeley Segmentation Dataset and Benchmark, Accessed in 2011, http://www.eecs.berkeley.edu/Research/Projects/CS/vision/bsds/
[17] Y.J. Zhang, “A review of recent evaluation methods for image segmentation,” In the Sixth International Symposium on Signal Processing and its Applications, vol. 1, pp. 148-151, 2001.
Sofia Visa was born in Romania and received her BS in Mathematics and Computer Science from L. Blaga University, Sibiu, Romania in 1998, and her MS and PhD in Computer Science from the Electrical & Computer Engineering and Computer Science Department (ECECS), University of Cincinnati in 2002 and 2007, respectively. She is an Assistant Professor in the Mathematics and Computer Science Department at the College of
Wooster, Wooster, OH. Before coming to Wooster, she was an Assistant Professor in the Computer Science Department at Saint Anselm College. Her research interests are in the area of machine learning including issues related to data classification, learning from imbalanced data sets, applications of learning algorithms in real world problems, and bioinformatics. Dr. Visa co-organized the 23rd Midwest Artificial Intelligence and Cognitive Science Conference, Cincinnati, OH, 2011. She has published over 30 reviewed papers. She is reviewer for many journals and conferences including IEEE Transactions on Neural Networks, International Journal of Computers, Communications & Control, the Midwest Artificial Intelligence and Cognitive Science Conference, and the North American Fuzzy Information Processing Society Annual Conference. She is member of the
Association for Computing Machinery and of Home Ohio Celebration of Women in Computing Organization. She is a co-PI in an NSF Grant (2009-2013) in bioinformatics. She received the Ralston Endowment Fund Award (2009) and the HHMI Summer Research Award (2009-2011), College of Wooster. She also received the Rindsberg Fellowship award (2006) and the Best Master of Science Thesis Award (2003), ECECS, University of Cincinnati. In 2002 she received the NTT-BRL Summer Camp Grant for “Quantum Information”, Hakone, Japan, and in 2001 the NATO Advance Studies Institute Grant for "Artificial Intelligence and Heuristic Methods for Bioinformatics", San Miniato, Italy.
Anca L. Ralescu was born in Romania and received her MS in mathematics from University of Bucharest, Romania, MA and PhD in mathematics from Indiana University, Bloomington, Indiana, in 1972, 1980, and 1983 respectively. Her interests include intelligent systems, reasoning under uncertainty (probabilistic, evidential and fuzzy approaches), image understanding, knowledge representation, complex networks, and brain computer interaction.
Dr. Ralescu joined University of Cincinnati in 1983 where she is currently a full professor of computer science. Her visiting positions include University of Bristol, UK, Tokyo Institute of Technology, Laboratory for International Fuzzy Engineering, Yokohama (where she led the image understanding research group), the Brain Science Institute, RIKEN, Saitama, Kyoto and University, Kyoto Japan, and University of Paris VI, France. She held various fellowships, including the NASA-Stanford ASEE Summer Fellowship, and in Japan JSPS and STA Senior Research Fellowships. She has published over 130 reviewed papers, has edited or co-edited five volumes of Springer Verlag LNAI series, dedicated to Fuzzy Logic in AI, and edited the volume Applied Research in Fuzzy Technology, Kluwer Academic Publishers, 1994. Professor Ralescu is a Senior Member IEEE.
Mircea Ionescu was born in Romania and received his BS and MS in Electrical Engineering, Polytechnic University of Bucharest in 1996 and 1997, respectively. In 2006 he completed his PhD in Computer Science from the Electrical & Computer Engineering and Computer Science Department (ECECS), University of Cincinnati. He is a senior Computer Vision Scientist at Charles River Laboratories, Seattle, WA. Prior to this,
he worked as Software Developer Engineer at several companies in Romania and Germany. He also had teaching appointments as Adjunct Faculty member in the Mathematics Department at University of Cincinnati and as part time Lecturer at the College of Wooster. His areas of expertise are machine learning and computer vision. His main focus is on developing computer vision algorithms for biological images.
International Journal of Information and Electronics Engineering, Vol. 2, No. 1, January 2012
37