A Framework for High-Throughput Flow Cytometry Data ...
50
Flow Cytometry QA and Normalization Clustering and Labeling Cells Analysis Example Conclusions Acknowledgements A Framework for High-Throughput Flow Cytometry Data Analysis and its Application to Diagnosis and Discovery Ryan Brinkman, Medical Genetics, UBC Terry Fox Laboratory BC Cancer Agency, Vancouver, BC, Canada 10-Sep-2009
Transcript of A Framework for High-Throughput Flow Cytometry Data ...

Flow Cytometry QA and Normalization Clustering and Labeling Cells Analysis Example Conclusions Acknowledgements
A Framework for High-Throughput FlowCytometry Data Analysis and its Application to
Diagnosis and Discovery
Ryan Brinkman, Medical Genetics, UBC
Terry Fox LaboratoryBC Cancer Agency, Vancouver, BC, Canada
10-Sep-2009

Flow Cytometry QA and Normalization Clustering and Labeling Cells Analysis Example Conclusions Acknowledgements
Why Flow Cytometry ?
• Technique for counting and examining microscopic particlessuspended in a stream of fluid
• Widely used in clinical medicine and basic research fordiagnosis and discovery
• cancer, immunity, stem cells
• Ideally suited for high throughput assays of cells in solution(e.g., blood)
• 50,000 cells/second, for a million cells per sample

Flow Cytometry QA and Normalization Clustering and Labeling Cells Analysis Example Conclusions Acknowledgements
Flow Cytometer Schematic

Flow Cytometry QA and Normalization Clustering and Labeling Cells Analysis Example Conclusions Acknowledgements
Fluorescence Intensity Per Cell Corresponds to ProteinsDetected by Conjugated Antibodies

Flow Cytometry QA and Normalization Clustering and Labeling Cells Analysis Example Conclusions Acknowledgements
Data Analysis Can Be Complicated
collaborator: De Rosa et al. Nature 2001

Flow Cytometry QA and Normalization Clustering and Labeling Cells Analysis Example Conclusions Acknowledgements
High Throughput Flow Experiments
• 96-well plates
• Automated• 1,000+ samples/day• 300,000+ cells/sample• 6+ parameters (dimensions)/event
• The ability to produce data is outstripping the ability toanalyze both the amount and complexity of data generated
• Bioinformatics to the rescue!• But first we need to develop some tools ...

Flow Cytometry QA and Normalization Clustering and Labeling Cells Analysis Example Conclusions Acknowledgements
Data Analysis Pipeline
Raw DataQuality
AssessmentNormalized
Data
OutlierRemoval
PopulationIdentification
[Gating]
PopulationsLabelled
PopulationStatistics
SampleClassification
Diagnosis &Discovery
flowQ & plateCore
flowUtils & flowCore
fdaNorm
guassNorm
flowClust/Merge
SamSPECTRAL
mclust
randomForest
e1071
flowViz

Flow Cytometry QA and Normalization Clustering and Labeling Cells Analysis Example Conclusions Acknowledgements
Automated Analysis of Flow Cytometry Data
• R is an open source (free as in beer & free as in speech)robuststatistical programming environment for Windows, Mac &Linux which offers a wide range of statistical and visualizationmethods
• Bioconductor provides R software modules for biological andclinical data analysis
• A scripted approach to high throughput data analysis
www.r-project.org
www.bioconductor.org

Flow Cytometry QA and Normalization Clustering and Labeling Cells Analysis Example Conclusions Acknowledgements
Getting Started:Coercing Data & Assessing Quality
Raw DataQuality
Assessment
flowQ & plateCore
flowUtils & flowCore
Le Meur et al. Cytometry A 2007Hahne et al. BMC Bioinformatics 2009
Strain et al. Advances in Bioinformatics 2009

Flow Cytometry QA and Normalization Clustering and Labeling Cells Analysis Example Conclusions Acknowledgements
plateCore: High throughput screening
> pbmcFP <- compensate(pbmcFP,compensation.matrix)
Import raw FCS files
Per well compensation
Select population(s) of interest
Set control gates
Score test samples
Per plate quality control
Annotation and analysis
> pbmcFP <- flowPlate(pbmcPlate,wellAnnotation,plateName="PBMC.001")
> pbmcFP <- Subset(pbmcFP, rectangleGate("FSC-H"=c(300,700),"SSC-H"=c(50,400)))
> pbmcFP <- setControlGates(pbmcFP,gateType="Negative.Control")
> pbmcFP <- applyControlGates(pbmcFP)
> pbmcFP <- summaryStats(pbmcFP)
> ecdfplot(~`FSC-H`|as.factor(Row.Id),plateSet(pbmcFP))
ManualAnalysis
plateCore Workflow
Strain et al.Advances in Bioinformatics 2009

Flow Cytometry QA and Normalization Clustering and Labeling Cells Analysis Example Conclusions Acknowledgements
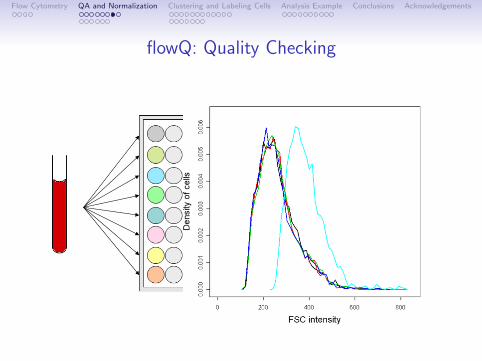
Why Assess Quality?
• Detect systematic and stochastic effects that are not likely tobe biologically motivated
• Systematic errors often indicate the need for adjustments insample handling or processing
• Aberrant samples should be identified & potentially removedfrom downstream analyses to avoid spurious results
We developed a variety of Exploratory Data Analytic (EDA) tools(graphical methods) for exploring ungated FCM data in a time andcost effective manner
Flow Cytometry QA and Normalization Clustering and Labeling Cells Analysis Example Conclusions Acknowledgements
flowQ: Quality Checking

Flow Cytometry QA and Normalization Clustering and Labeling Cells Analysis Example Conclusions Acknowledgements
flowQ: Summary web page

Flow Cytometry QA and Normalization Clustering and Labeling Cells Analysis Example Conclusions Acknowledgements
Data Normalization
QualityAssessment
NormalizedData
fdaNorm
guassNorm
Hahne et al. Cytometry A 2009

Flow Cytometry QA and Normalization Clustering and Labeling Cells Analysis Example Conclusions Acknowledgements
Data Normalization
• Between-sample variation poses a significant challenge foranalysis of large scale data sets
• Hard to match biologically relevant cell populations acrosssamples (technical variation in sample acquisition,instrumentation differences)
• Therefore, remove technical between-sample variation byaligning prominent features (landmarks) in the raw data on aper-channel basis.

Flow Cytometry QA and Normalization Clustering and Labeling Cells Analysis Example Conclusions Acknowledgements
Data Normalization Schematic
1 2
1 2
1
12
iden%fica%on classifica%on alignment
sample1
sample2
sample3
sample4 1
1
1
1 2
2
2

Flow Cytometry QA and Normalization Clustering and Labeling Cells Analysis Example Conclusions Acknowledgements
Data Normalization
raw data
0 200 400 600 800 1000
CD3
gaussNorm
0 200 400 600 800 1000
CD3
fdaNorm
0 200 400 600 8001000
CD3
0 200 400 600 800
0.00
00.
002
0.00
40.
006
0.00
8
raw data
●
●
●
●
●
●●
●
●
●
●
●
●
●
●
●
●
●
●
●
●
●
●
●
●
●
●
●
●
●
●
●
●
●
●
●
●
● ●
●
●
●
●
●
●
●
●
●
0 200 400 600 800
0.00
00.
002
0.00
40.
006
0.00
8
gaussNorm
●
●
●
●
●
●
●
●
●
●
●
●
●
●
●
●
●
●
●
●
●
●
●
●
●
●
●
●
●
●
●
●
●
●
●
●
●
●
●
●
●
●
●
●
●
●
●
●
●
●
●
●
●
●
●
0 200 400 600 800
0.00
00.
002
0.00
40.
006
0.00
80.
010
fdaNorm
●
●
●
●
●
●●
●
●
●
●
●
●
●
●
●
●●
●
●
●
●
●
●
●
●
●
●
●
●
●
●
●
●
●
●
●
●
●
●
●● ●
●
●
●
●
●
●
●
●●
●
●

Flow Cytometry QA and Normalization Clustering and Labeling Cells Analysis Example Conclusions Acknowledgements
Data Normalization

Flow Cytometry QA and Normalization Clustering and Labeling Cells Analysis Example Conclusions Acknowledgements
Data Normalization
over
lap
0.2
0.4
0.6
0.8
1.0
raw d
ata
gaus
sNor
m
fdaN
orm
●● ●
●● ●●
p = 0.99
CD3−SS
raw d
ata
gaus
sNor
m
fdaN
orm
●
● ●
●
●
●
●
●
●●
p = 0.99
CD3+SS
raw d
ata
gaus
sNor
m
fdaN
orm
●
● ●
●●
●
●●
●
p = 0.99
CD5−CD3−
● ● ●
●
●●
●
●
●
●
●
●
p = 0.95
CD5−SS
● ●●
●
●
p = 0.96
CD5+CD3+
0.2
0.4
0.6
0.8
1.0
● ●●
●●●●
●
p = 0.97
CD5+SS

Flow Cytometry QA and Normalization Clustering and Labeling Cells Analysis Example Conclusions Acknowledgements
Automated Gating
OutlierRemoval
PopulationIdentification
[Gating]
flowClust/Merge
SamSPECTRAL
Lo et al. Cytometry A 2008Finak et al. Advances in Bioinformatics 2009
Shooshtari et al. ? 2009

Flow Cytometry QA and Normalization Clustering and Labeling Cells Analysis Example Conclusions Acknowledgements
Data Analysis: Different Analysis Problems RequireDifferent Solutions
Two fundamentally different problems in automated flow analysis:
Diagnosis vs. Discovery
How we develop automated approaches to analyze data dependson the what the underlying goal is:
Find the same subset of populations in every sample
vs.
Find “every” population in every sample

Flow Cytometry QA and Normalization Clustering and Labeling Cells Analysis Example Conclusions Acknowledgements
Automated Gating (Take I): flowClust
Finding cohesive groups (cell sub-populations) in data in anautomated fashion can be addressed through a methodologytermed clustering.
Several problems need to be overcome:
• Multiple dimensions are hard to think in
• Difficult to visualize
• Computationally challenging

Flow Cytometry QA and Normalization Clustering and Labeling Cells Analysis Example Conclusions Acknowledgements
Automated Gating (Take I): flowClust
We developed a model based clustering approach that automatesthe process of:
• Identifying how many sub-populations• Use the Bayesian Information Criterium (BIC)
• Dealing with outliers
• Gaussian distributions for cell populations fail due to outliers• Therefore, replace Gaussian distribution with a t-mixture
model using BoxCox transformation

Flow Cytometry QA and Normalization Clustering and Labeling Cells Analysis Example Conclusions Acknowledgements
Manual Analysis vs flowClust

Flow Cytometry QA and Normalization Clustering and Labeling Cells Analysis Example Conclusions Acknowledgements
Automated Gating (Take 2): flowMerge
• Estimating the number of clusters is hard
• BIC and AIC tend to overestimate the number of clusters
• Integrated Complete Likelihood (ICL) is an entropy penalizedBIC criterion (models with overlapping components arepenalized by a larger entropy due to the overlap)
• But - ICL tends to underestimate number of clusters
Combine BIC and ICL!

Flow Cytometry QA and Normalization Clustering and Labeling Cells Analysis Example Conclusions Acknowledgements
flowMerge vs flowClust

Flow Cytometry QA and Normalization Clustering and Labeling Cells Analysis Example Conclusions Acknowledgements
Automated Gating (Take 3): SamSPECTRAL
• Stop modeling populations by their supposed(!) shape
• Instead, model connections between cells based on closeness(connectivity)
• Stop trying to guestimate the number of clusters
• Instead, cut populations where there are few connections
• But, spectral clustering computationally impractical for flowcytometry data (>3,000 points)
Combine spectral clustering with density based sampling approachto preserve rare populations

Flow Cytometry QA and Normalization Clustering and Labeling Cells Analysis Example Conclusions Acknowledgements
SamSPECTRAL Algorithm
1. Set neighborhood threshold h;
2. Label all the data points as unregistered;
3. Pick a random unregistered point p and find all unregistereddata points within distance h from p;
4. Put all of these points in a set called community p, and labelthem as registered;
5. Repeat above 2 steps until no unregistered points;
6. Compute similarity between communities;
7. Build graph with communities as vertices, edges weighted bysimilarity;
8. Run classical spectral clustering;
9. Combine clusters if (connectivity between clusters)÷(connectivity within cluster) ≥ separation factor .

Flow Cytometry QA and Normalization Clustering and Labeling Cells Analysis Example Conclusions Acknowledgements
flowMerge vs. SamSPECTRAL

Flow Cytometry QA and Normalization Clustering and Labeling Cells Analysis Example Conclusions Acknowledgements
Estimating Clusters: Intersecting Lines the Best Way?
BIC and ICL Eigenvalues and y=1

Flow Cytometry QA and Normalization Clustering and Labeling Cells Analysis Example Conclusions Acknowledgements
Estimating Clusters: Recursive Kernal Density Estimates

Flow Cytometry QA and Normalization Clustering and Labeling Cells Analysis Example Conclusions Acknowledgements
Population Labeling
PopulationIdentification
[Gating]
PopulationsLabelled
mclust

Flow Cytometry QA and Normalization Clustering and Labeling Cells Analysis Example Conclusions Acknowledgements
Population Labeling

Flow Cytometry QA and Normalization Clustering and Labeling Cells Analysis Example Conclusions Acknowledgements
Population Labeling

Flow Cytometry QA and Normalization Clustering and Labeling Cells Analysis Example Conclusions Acknowledgements
Population Labeling

Flow Cytometry QA and Normalization Clustering and Labeling Cells Analysis Example Conclusions Acknowledgements
Population Labeling

Flow Cytometry QA and Normalization Clustering and Labeling Cells Analysis Example Conclusions Acknowledgements
Data Analysis Pipeline
Raw DataQuality
AssessmentNormalized
Data
OutlierRemoval
PopulationIdentification
[Gating]
PopulationsLabelled
PopulationStatistics
SampleClassification
Diagnosis &Discovery
flowQ & plateCore
flowUtils & flowCore
fdaNorm
guassNorm
flowClust/Merge
SamPECTRAL
mclust
randomForest
e1071
flowViz

Flow Cytometry QA and Normalization Clustering and Labeling Cells Analysis Example Conclusions Acknowledgements
All available in High Throughput in GenePattern*
*(soon!)

Flow Cytometry QA and Normalization Clustering and Labeling Cells Analysis Example Conclusions Acknowledgements
Diffuse Large B-Cell Lymphoma
Biology:
• Most common type of lymphoma
• Outcome (survival) is highly variable• Half of the patients survive less than 5 years (why?)
Hypothesis:
• Automated clustering of flow data will identify novel cellpopulations that correlate with outcomes (e.g., survival)
• This will lead to better understanding of DLBCL, its diagnosisand treatment
Data 252 patients assessed over a 6 year period

Flow Cytometry QA and Normalization Clustering and Labeling Cells Analysis Example Conclusions Acknowledgements
Successful Identification of DLBCL Patient Subgroups

Flow Cytometry QA and Normalization Clustering and Labeling Cells Analysis Example Conclusions Acknowledgements
Accurate Retrospective Prediction of Date of Biopsy

Flow Cytometry QA and Normalization Clustering and Labeling Cells Analysis Example Conclusions Acknowledgements
We Need a Data Normalization Method!

Flow Cytometry QA and Normalization Clustering and Labeling Cells Analysis Example Conclusions Acknowledgements
Heat Map of Flow Data

Flow Cytometry QA and Normalization Clustering and Labeling Cells Analysis Example Conclusions Acknowledgements
Significant Difference in Survival

Flow Cytometry QA and Normalization Clustering and Labeling Cells Analysis Example Conclusions Acknowledgements
Significance Not Threshold Specific

Flow Cytometry QA and Normalization Clustering and Labeling Cells Analysis Example Conclusions Acknowledgements
P-values vs. Threshold vs. Number of Patients

Flow Cytometry QA and Normalization Clustering and Labeling Cells Analysis Example Conclusions Acknowledgements
Population of Interest

Flow Cytometry QA and Normalization Clustering and Labeling Cells Analysis Example Conclusions Acknowledgements
Next Steps
Clinically important and significant biomarker identified andverified by manual analysis, not correlated with treatment(CHOP/CHOP+R), or other prognostic indicators (e.g., IPI)
• Compare microarray data across DLBCL patient groups
• Microarrays already done, this analysis points to new way tosegregate groups
• Identify pathways up or down regulated in each group
Apply framework to HIV, Leukemia and cancer stem cell datasetsApply framework to build automated diagnosis tool

Flow Cytometry QA and Normalization Clustering and Labeling Cells Analysis Example Conclusions Acknowledgements
Conclusions
• Automated, unsupervised flow cytometry analysis can be:• As accurate as manual analysis• Potentially more informative when datasets get too large for
manual analysis

Flow Cytometry QA and Normalization Clustering and Labeling Cells Analysis Example Conclusions Acknowledgements
Acknowledgements
• Brinkman lab
Josef Spidlen, Ali Bashashati, Alireza Khodabakhshi, Melanie Courtot, Parisa Shooshtari, Adrian Cortes,Aaron Barsky, Kieran O’Neill, Habil Zare, Maik Hassel
• flow* Software
IRCM Kenneth Lo, Greg Finak, Raphael Gottardo
FCCC Florian Hahne, Nolwenn Le Meur, Nishant Gopalakrishnan, Byron Ellis, Deepayan Sarkar, RobertGentleman
BD Errol Strain Jim Walking, Michael Goldberg, Christopher Wolf, Perry Haaland, John Dunne
• Lymphoma
BCCA Andrew Weng, Randy Gascoyne, Nathalie Johnson
NIH/NIBIB, CIHR, HeRRO, MSFHR, Genome [BC/Canada]