"A Framework for Developing Trading Models Based on Machine Learning" by Kris Longmore, Founder of...
69
A FRAMEWORK FOR DEVELOPING TRADING ALGORITHMS BASED ON MACHINE LEARNING KRIS LONGMORE ROBOTWEALTH.COM | QUANTIFY PARTNERS
-
Upload
quantopian -
Category
Economy & Finance
-
view
1.213 -
download
2
Transcript of "A Framework for Developing Trading Models Based on Machine Learning" by Kris Longmore, Founder of...

A FRAMEWORK FOR DEVELOPING TRADING ALGORITHMS BASED ON MACHINE LEARNING
KRIS LONGMORE
ROBOTWEALTH.COM | QUANTIFY PARTNERS

OUTLINE
• Introduction to ML concepts
• ML for trading – pitfalls, where can we go
wrong, why is it so hard – how to not waste
your time!
• One possible framework.
• Some tips to help you make it work.

INTRODUCTION
• I’m a futures and FX guy, so my examples will reflect that
• Most of this stuff can be applied to other asset classes
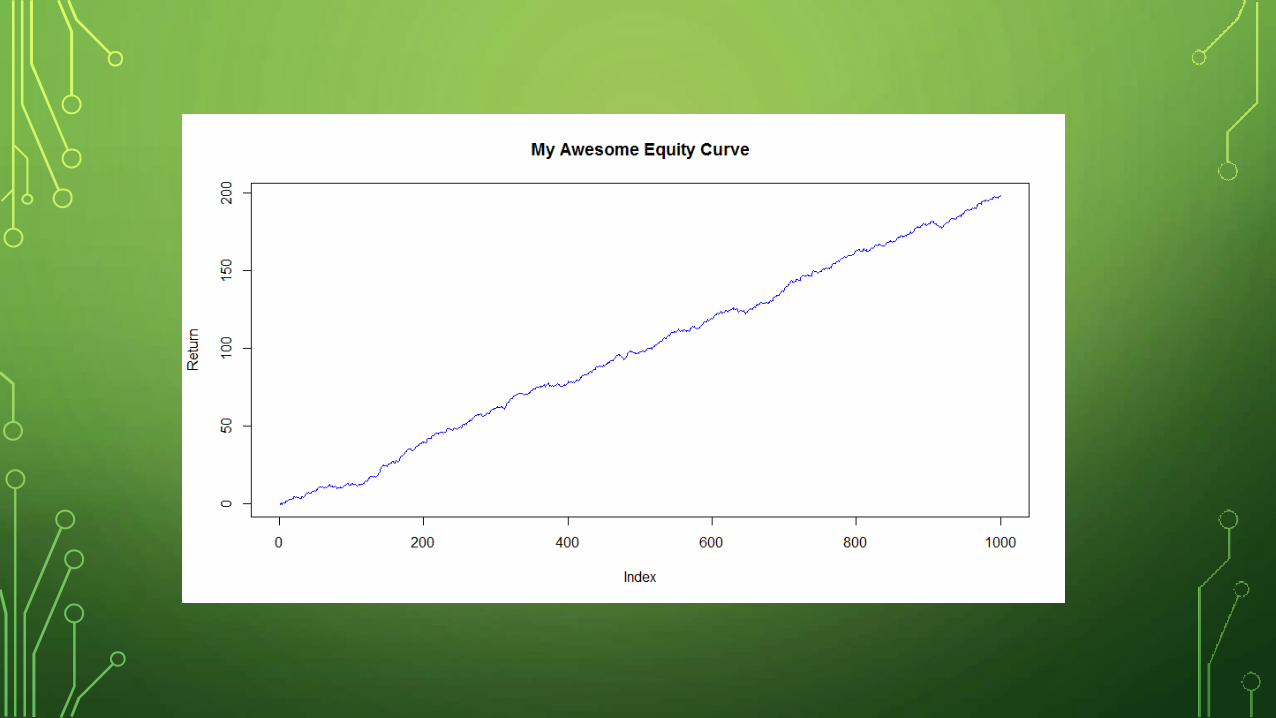
• Equity curves - for illustrative purposes only. I’ve tried not to cherry
pick (too much), but didn’t include transaction costs.
• I’ve tried not to do too much of this:

INTRODUCTION TO MACHINE LEARNING
CONCEPTSWHAT IS IT AND HOW IT WORKS, IN A NUTSHELL
INTRODUCTION TO MACHINE LEARNING CONCEPTS
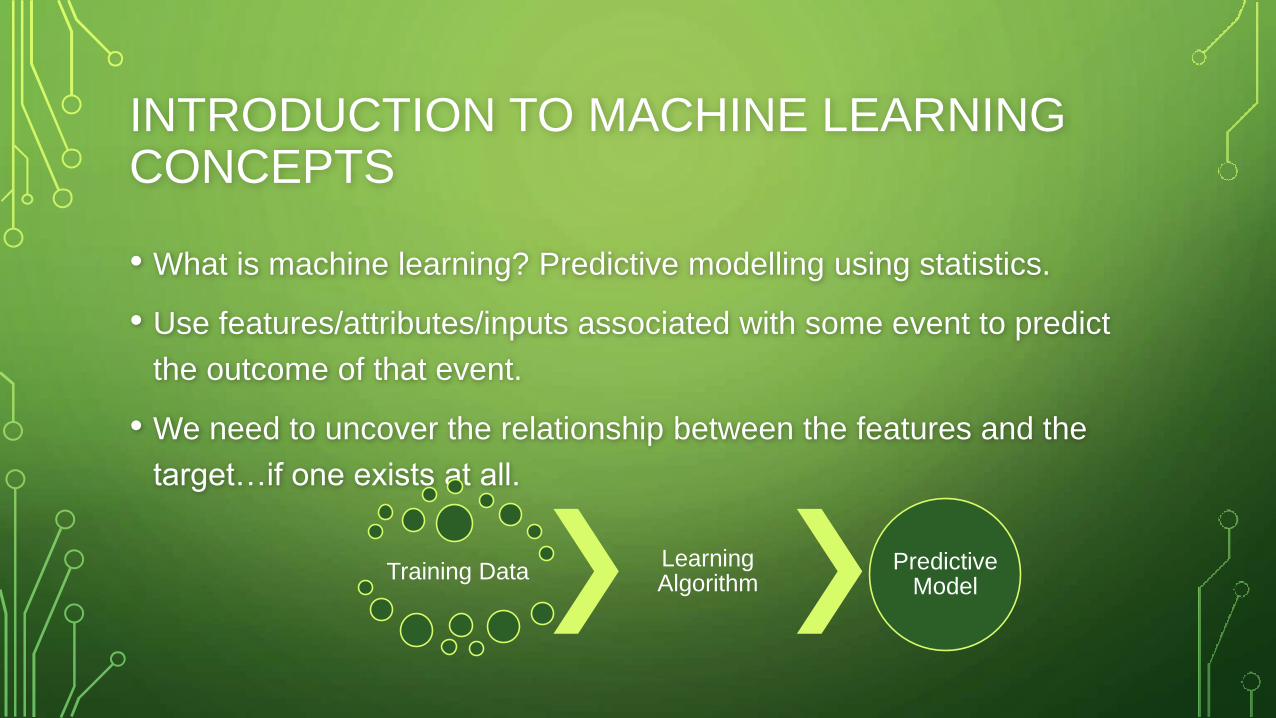
• What is machine learning? Predictive modelling using statistics.
• Use features/attributes/inputs associated with some event to predict
the outcome of that event.
• We need to uncover the relationship between the features and the
target…if one exists at all.
Training DataLearning Algorithm
Predictive Model
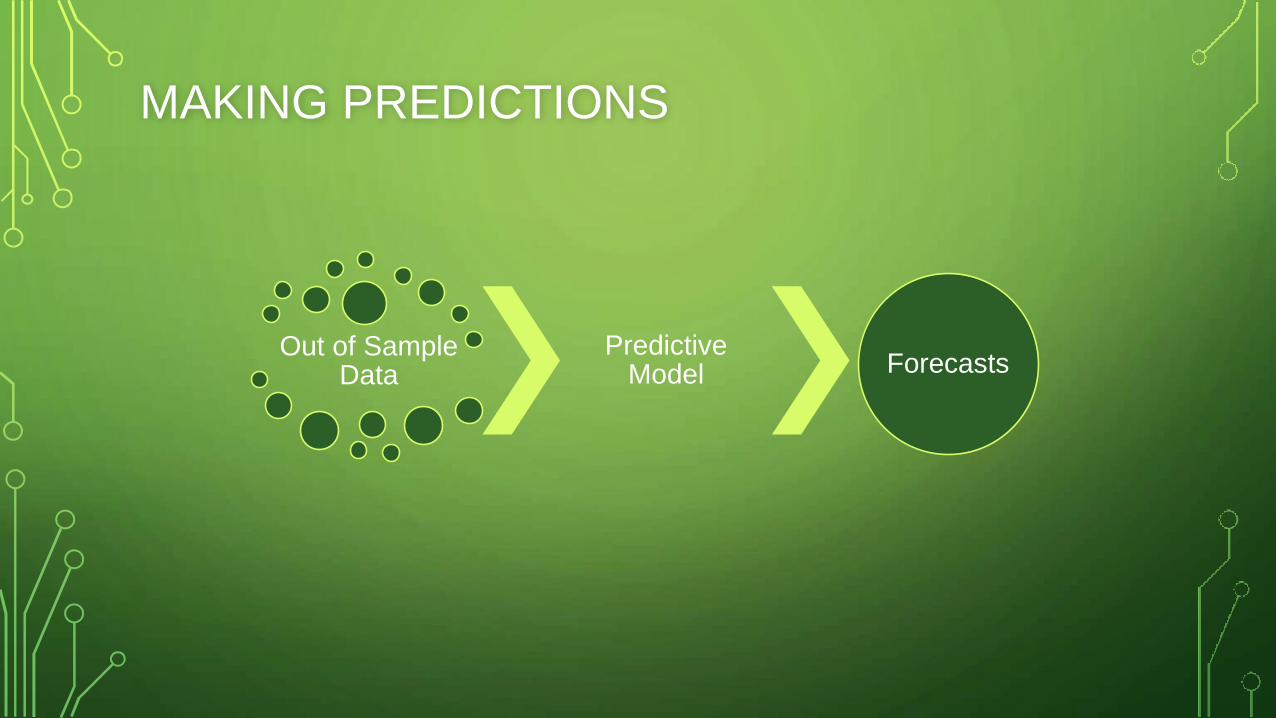
MAKING PREDICTIONS
Out of Sample Data
Predictive Model Forecasts
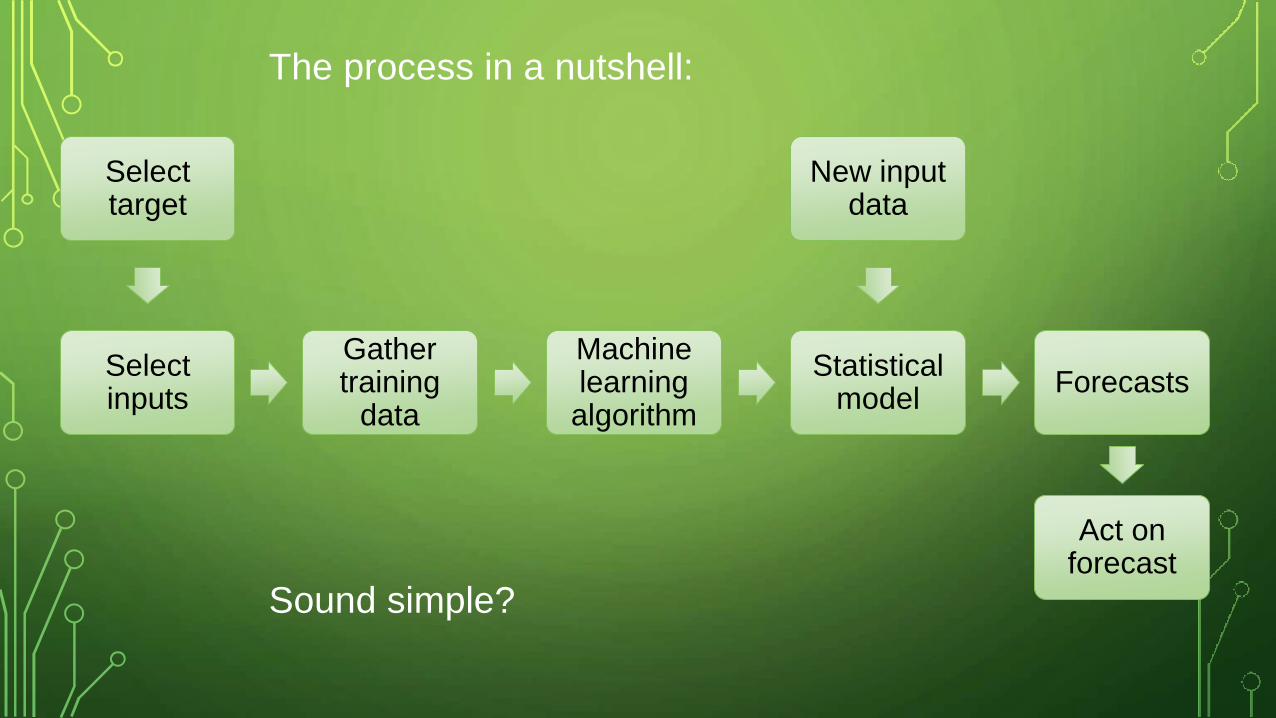
The process in a nutshell:
Gather training
data
Machine learning algorithm
Statistical model
Forecasts
New input data
Act on forecast
Select inputs
Select target
Sound simple?
SO WHAT CAN ML DO FOR TRADERS?
• Predicting returns is challenging
• Neural networks as universal function approximators – a
non-linear GARCH model?
• Proxies for price movement from alternative data.
• Improving existing systems – insights into what affects
results.
• Train a model to learn your personal preferences for
selecting trading systems (credit: Dr Tom Starke)
• ML for portfolio construction – combine alphas in an optimal
manner
• This presentation is going to showcase a framework for
forecasting returns of a trading system
PRIC
ES

COMMON PITFALLSWHAT CAN GO WRONG, AND WHAT CAN WE DO
ABOUT IT?
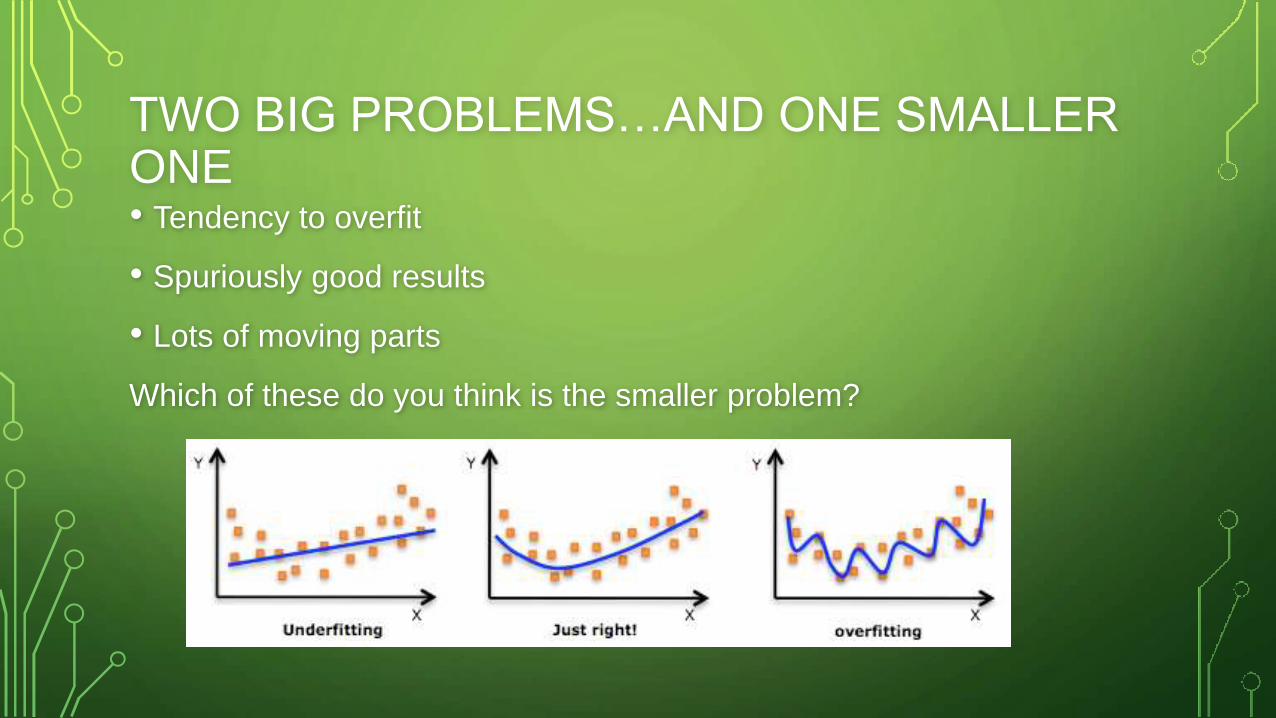
TWO BIG PROBLEMS…AND ONE SMALLER ONE• Tendency to overfit
• Spuriously good results
• Lots of moving parts
Which of these do you think is the smaller problem?
TWO BIG PROBLEMS…AND ONE SMALLER ONE
• Curve fitting bias – we can overcome this with good practice
• Data mining bias – more onerous to account for. Computationally
expensive, not really intuitive. But absolutely critical.
• Lots of moving parts
CURVE FITTING BIAS – SOME PRACTICAL TIPS
• Select parsimonious models
• It may seem counter-intuitive, but reduce the number of features (or
use SAE)
• Regularization
• Cross-validate … but consider stationarity and autocorrelation
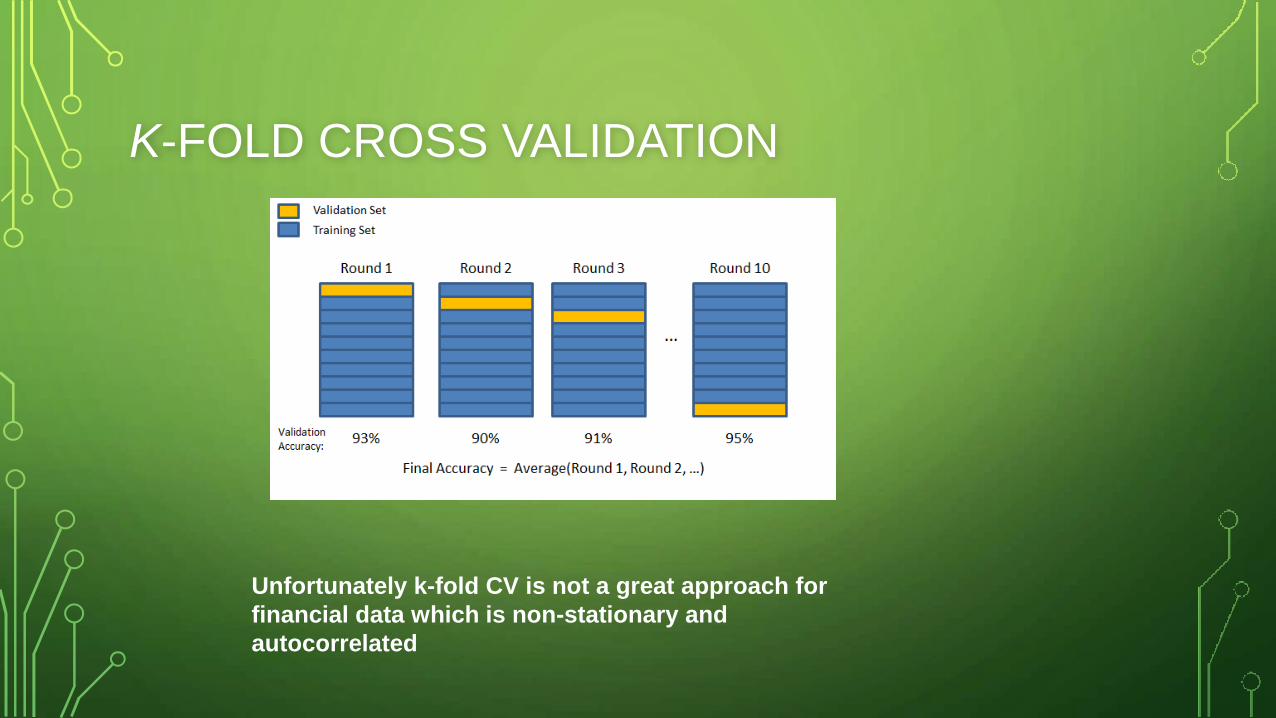
K-FOLD CROSS VALIDATION
Unfortunately k-fold CV is not a great approach for
financial data which is non-stationary and
autocorrelated
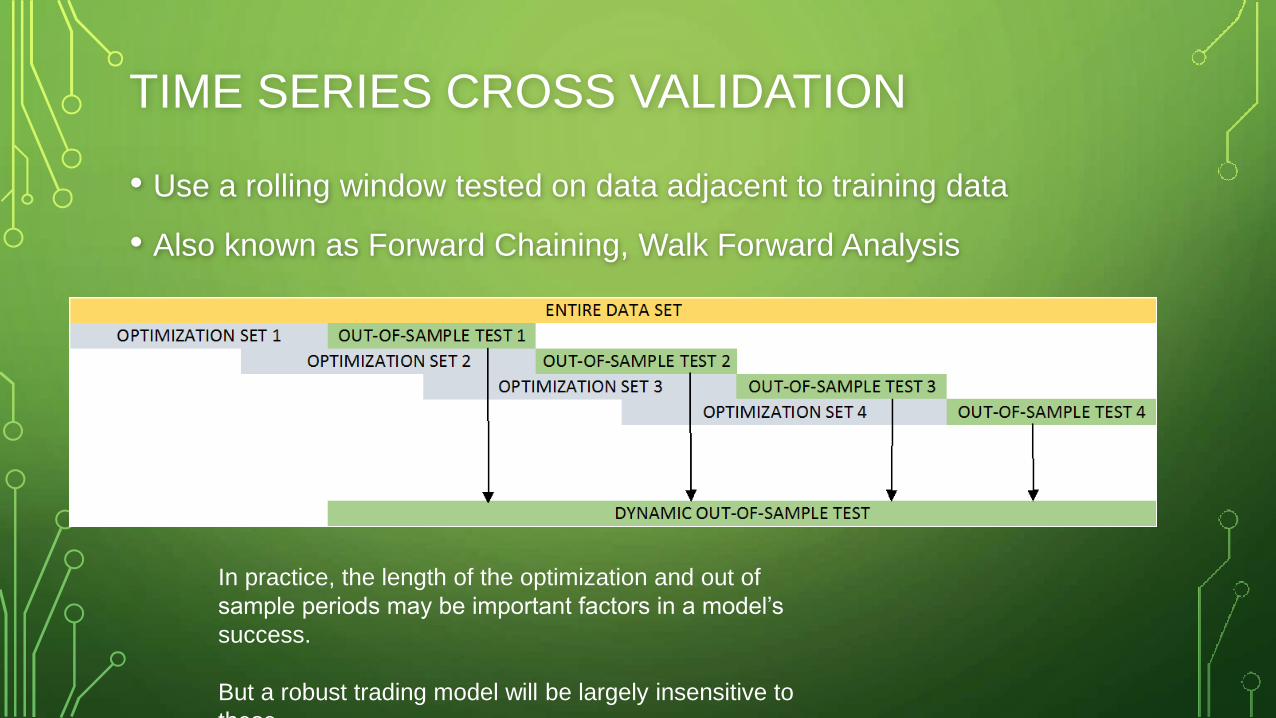
TIME SERIES CROSS VALIDATION
• Use a rolling window tested on data adjacent to training data
• Also known as Forward Chaining, Walk Forward Analysis
In practice, the length of the optimization and out of
sample periods may be important factors in a model’s
success.
But a robust trading model will be largely insensitive to
these.
TIME SERIES CV IS ALSO NOT A PANACEA
• Even if your model passes a TS CV test, there is no guarantee that it
won’t just stop working if and when the underlying modelled
relationship changes.
• Particularly true for data-mining or black-box systems.
• At least with model-based systems, you have insight into when it is
likely to break down.
• If you test enough models even with TS-CV, you will eventually land
on something that looks really good…but was just lucky

DMB – WHAT IS IT?
• Essentially, the probability that back-test results
are due to chance.
• Isn’t a good out-of-sample result enough?
• The problem of a finite sample size
• Consider a coin toss. The expectancy of getting
heads is 0.5. But it is not uncommon to have a
streak of 2, 3, 4, 5, or more heads in a row. If we
only tossed the coin 5 times and got 4 heads, we
might conclude that our coin throws heads 80%
of the time.
• If we throw the coin enough times, the sample
mean tends to the population mean.

DMB – WHY IS IT IMPORTANT?
• If we test enough models, we will eventually find something that
passes any out of sample test.
• With machine learning, we can test thousands of models and will
certainly find something that looks good.
• Personally, I think DMB makes ALL the difference in developing
machine-learning based trading systems.

DMB – HOW TO ACCOUNT FOR IT
• There are several approaches
• I will focus on White’s Reality Check (WRC) as it is the one I use most
in my work-flow.
• We will step through the process later.

TIME FOR SOME FUN: A MACHINE LEARNING
TRADING MODEL
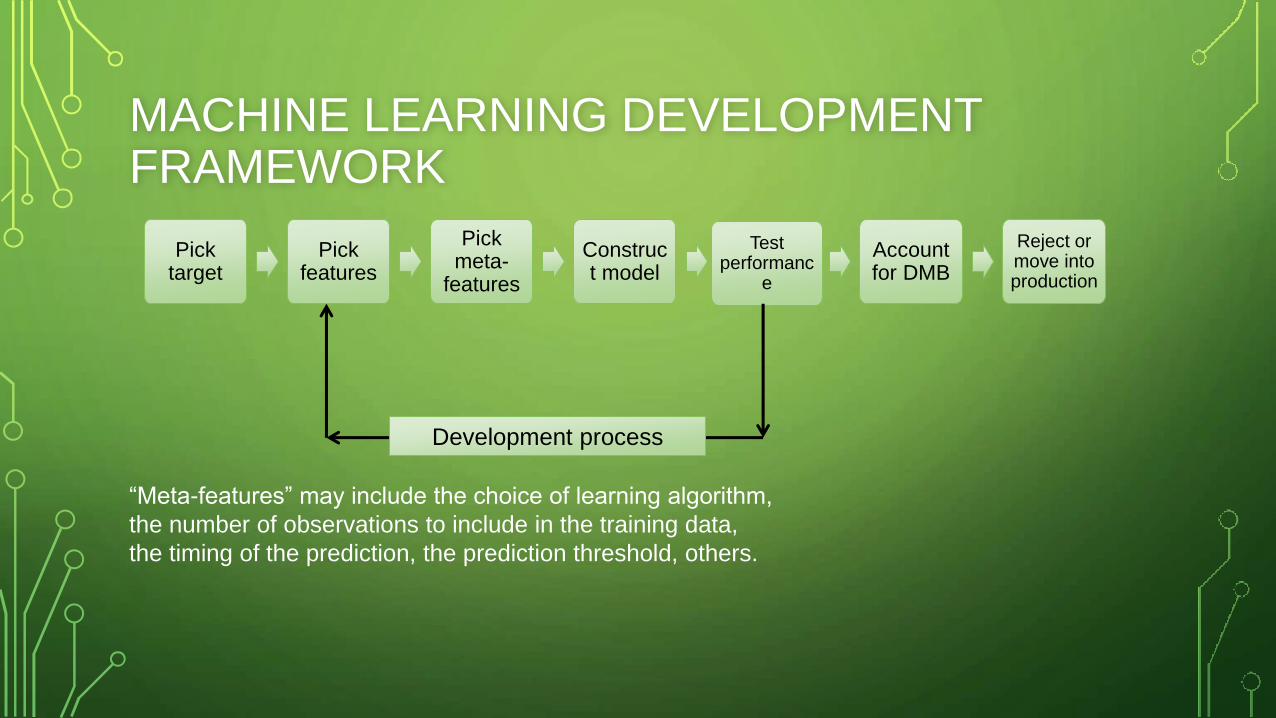
MACHINE LEARNING DEVELOPMENT FRAMEWORK
“Meta-features” may include the choice of learning algorithm,
the number of observations to include in the training data,
the timing of the prediction, the prediction threshold, others.
Pick target
Pick features
Pick meta-
features
Construct model
Test performanc
e
Account for DMB
Reject or move into production
Development process

ANOTHER NUTSHELL
The crux of the process is:
• Which inputs?
• Which outputs?
• How to construct the model? (Which meta-features?)
• Account for DMB
WHAT TO PREDICT?
• My experience is that I get better results when I don’t try to predict
returns.
• Better to predict whether a defined positive or negative excursion is hit
first – use a stop and take profit
• Another option is to predict whether an unspecified favourable
excursion occurs – use an initial and trailing stop
• For these examples, I’ll use the initial and trailing stop set up. More
aligned with practical trading.

DIGRESSION…REGRESSION VS CLASSIFICATION
• Regression: predict a numerical value (eg result of a trade)
• Classification: predict a binary or multi-class output (eg if the market
direction is up or down next week)
• My personal experience is that I get better results when I choose a
regression approach. But many problems can be framed either way
and experimentation is encouraged.
TRADE LOGIC SETUP
• Daily time frame
• Build new long/short models every X days using N previous observations
• Use the model to predict each out-of-sample day’s target – NO IN-SAMPLE
PREDICTIONS IN BACKTESTS!!!
• Go long when
LongPrediction > Threshold && LongPrediction > ShortPrediction
• Vice versa for shorts
• Stop and trail mechanisms are volatility-based
• If there is a position open in the same direction then reset the SL as if the position
had just been opened
• Reverse when opposite signal received
• No position sizing - just minimum lots/contracts (not ideal but OK for testing)
SIMPLE EXAMPLE – K-NN APPLIED TO EUR/USD• For each trading day, predict favourable excursion of long and short trades entered at
market
• Model parameters:
• Inputs: last 3 days’ returns
• Learning algorithm: k-Nearest Neighbours with k = 10
• No. observations: 75
• Stop: 50% of ATR(20)
• Trail: 50% of ATR(20)
• We hope to be able to build a relationship where the returns of the last 3 days yields
some predictive power for a trade with our stop/trail mechanism.
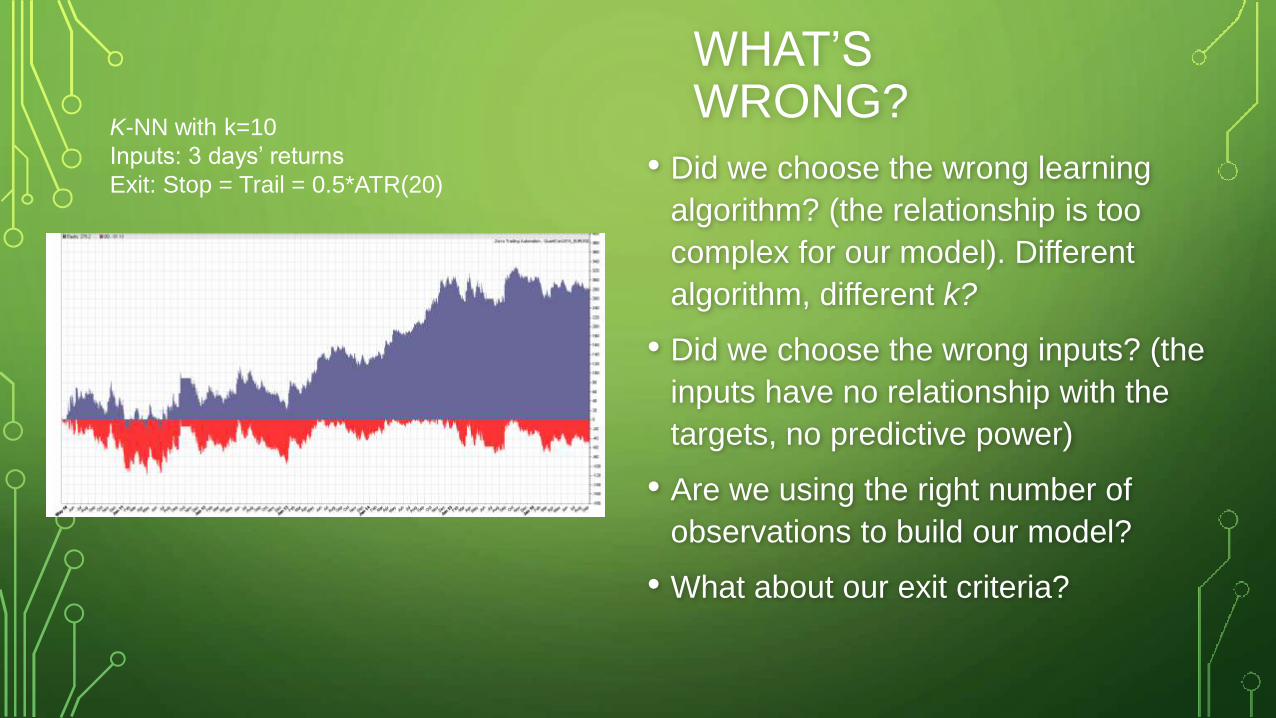
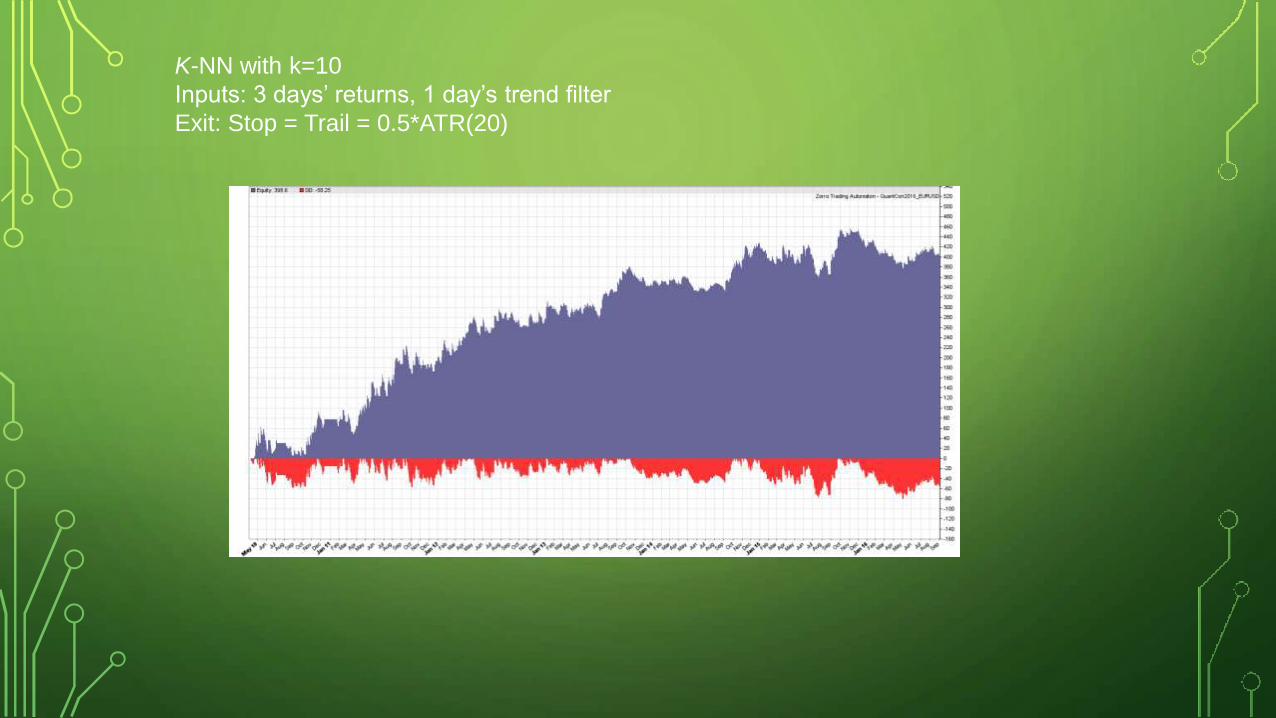
K-NN with k=10
Inputs: 3 days’ returns
Exit: Stop = Trail = 0.5*ATR(20)• Did we choose the wrong learning
algorithm? (the relationship is too
complex for our model). Different
algorithm, different k?
• Did we choose the wrong inputs? (the
inputs have no relationship with the
targets, no predictive power)
• Are we using the right number of
observations to build our model?
• What about our exit criteria?
WHAT’S WRONG?
EXTENDING THE K-NN EXAMPLE
• Add simple trend filter as input: Close – MA(200)
• Irrelevant inputs only add noise or redundancy – be careful
• Does this additional input improve the model? If not, discard.
K-NN with k=10
Inputs: 3 days’ returns, 1 day’s trend filter
Exit: Stop = Trail = 0.5*ATR(20)

EXTENDING THE K-NN EXAMPLE• Try using more returns per observation (keeping the trend filter)
5
Returns
15
Returns
10 Returns
20
Returns
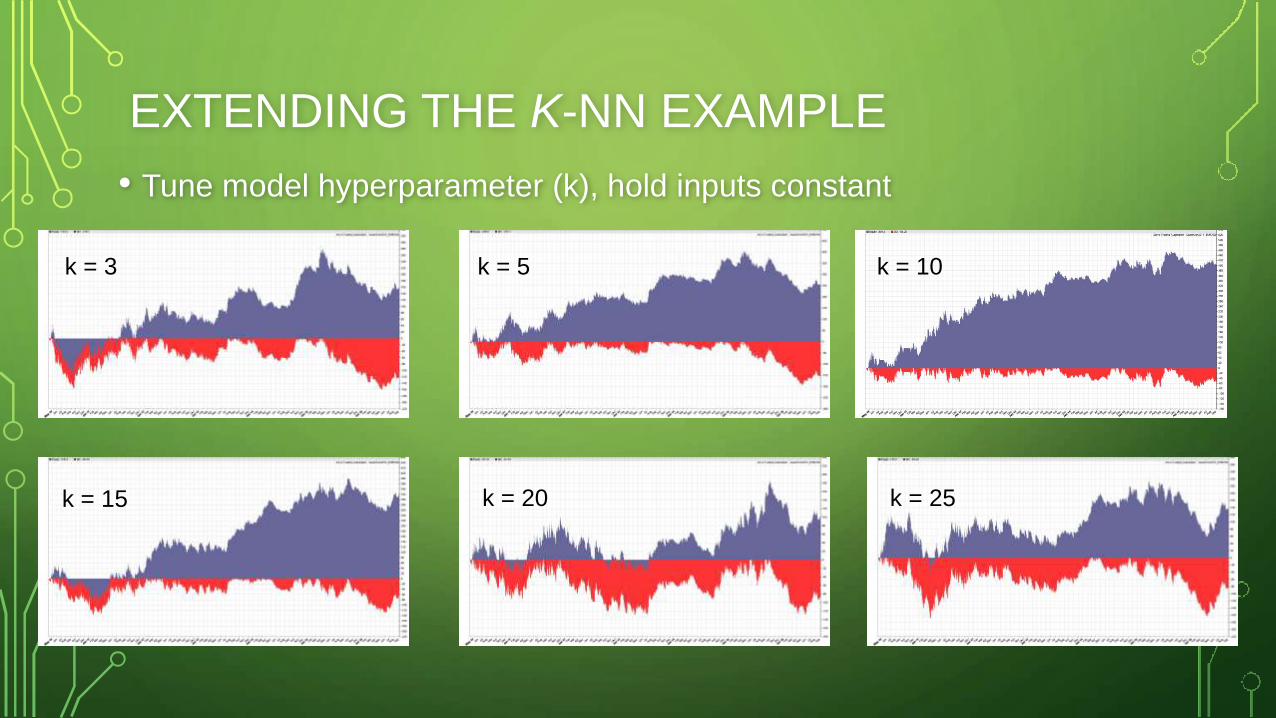
EXTENDING THE K-NN EXAMPLE
• Tune model hyperparameter (k), hold inputs constant
k = 5
k = 15
k = 10
k = 20
k = 3
k = 25

EXTENDING THE K-NN EXAMPLE
• How many observations? Vary N holding inputs, k, constant
N = 50
N = 150
N = 75
N = 250N = 200
N = 100
WHAT HAVE WE DISCOVERED?
• Adding complexity is not always a good thing
• There will often be a relationship between the optimal hyperparameter
settings and the number of observations used
• We have already explored 16 different models – be wary of DMB
• Are there examples of different models that might be accurate under
different market conditions, and therefore can be used in a portfolio?
• What about other methods for combining the predictions of multiple models?
• I don’t have time to delve into ensembles, but you definitely should.
LETS TRY A MORE COMPLEX MODEL - SVM
• Mostly a classification tool, but can be configured for regression
• The parameter "C" relates to the cost function (it gives weight to the
data) and σ to the mapping of the input space.
• C is like 1/λ if you are familiar with regularization.
• High C overfit
• Low σ overfit
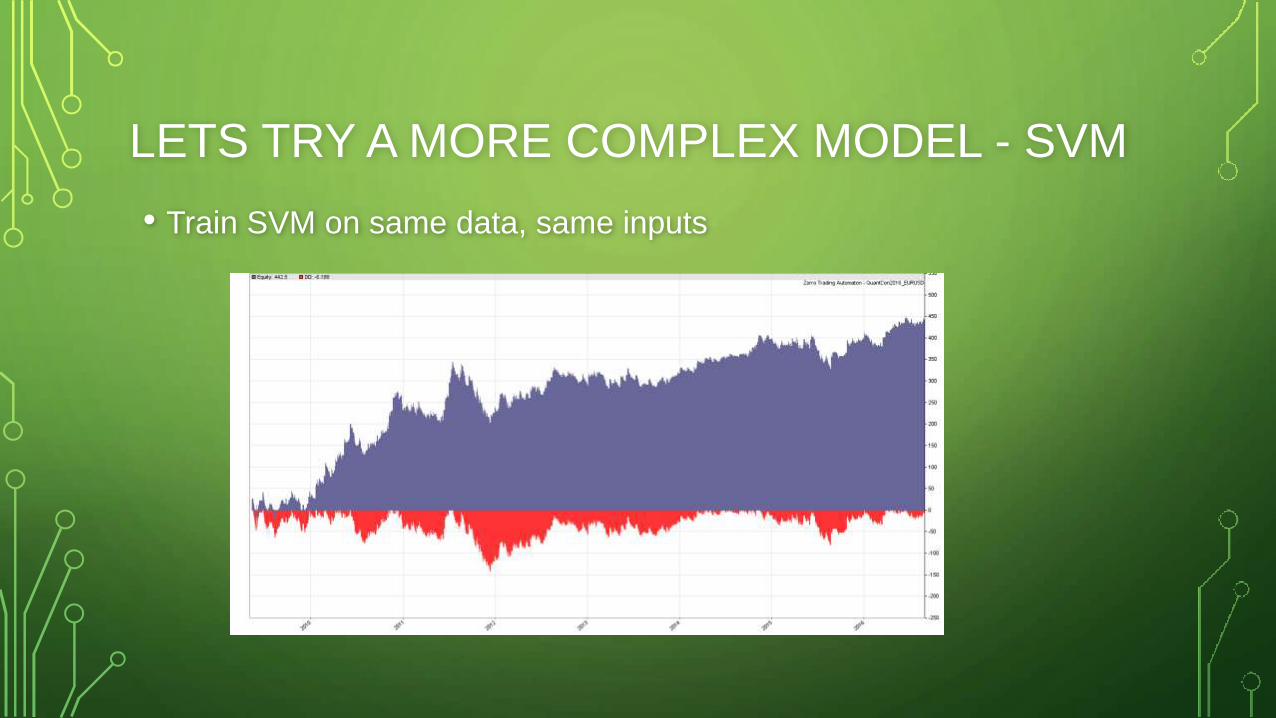
LETS TRY A MORE COMPLEX MODEL - SVM
• Train SVM on same data, same inputs
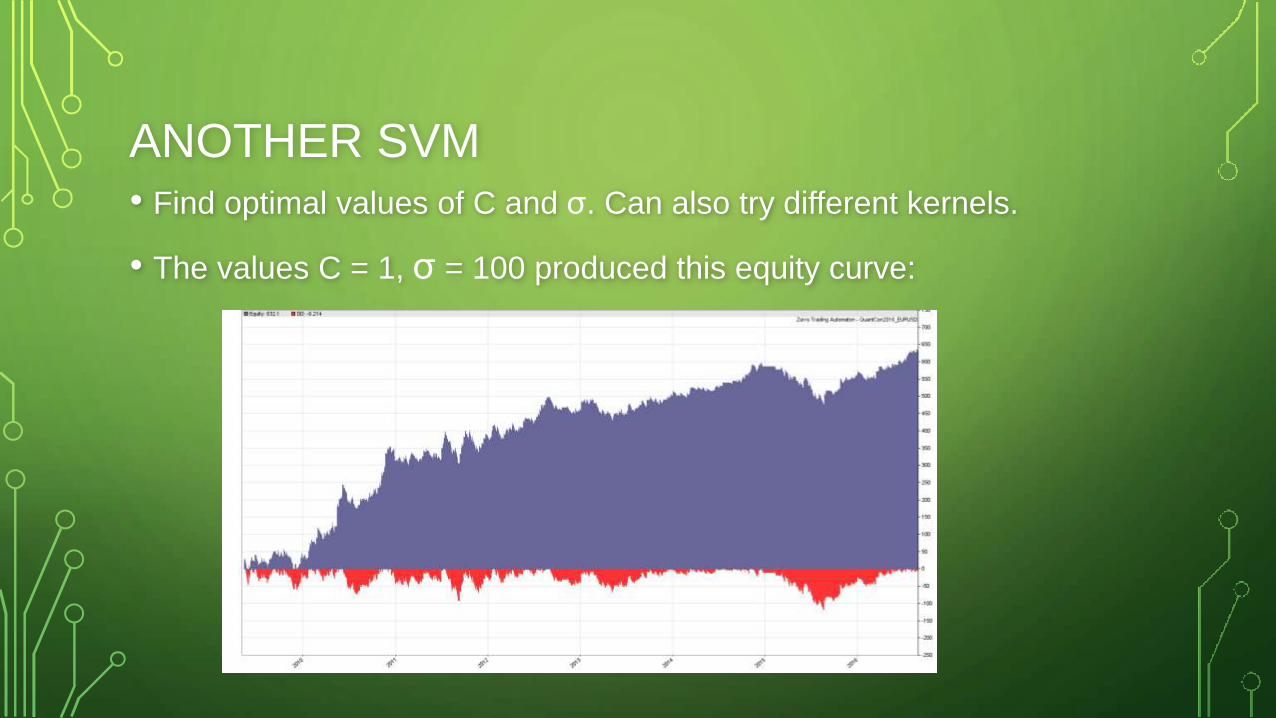
ANOTHER SVM
• Find optimal values of C and σ. Can also try different kernels.
• The values C = 1, σ = 100 produced this equity curve:
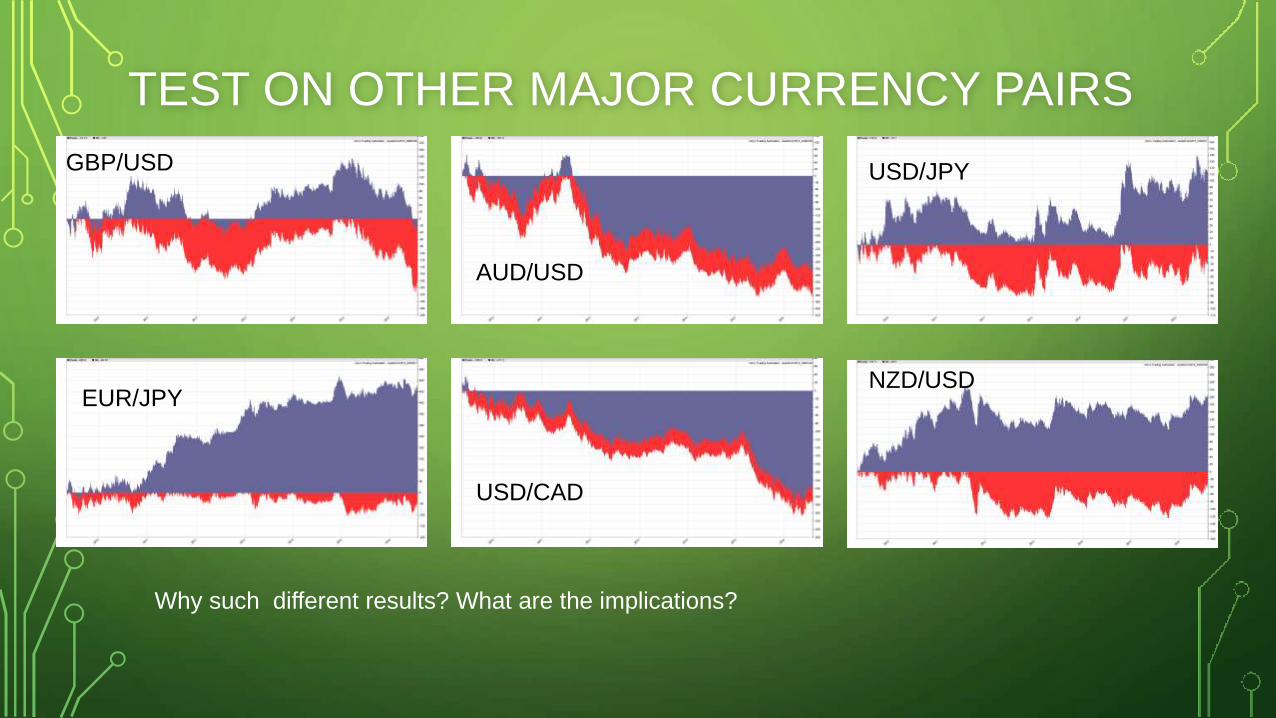
TEST ON OTHER MAJOR CURRENCY PAIRS
GBP/USD
EUR/JPY
USD/JPY
AUD/USD
USD/CAD
NZD/USD
Why such different results? What are the implications?
THE EFFECT OF SAMPLING TIME
• So far our models are built using daily closing prices.
• FX is a 24-hour market, so the choice of closing time is somewhat
arbitrary.
• Train same model using same inputs but construct daily time series at
different GMT offsets. Be cognizant of DST.
• Do results randomly fluctuate with GMT offset, or do they deteriorate
systematically as you move away from the best offset?
• This effect is also present in futures markets.

THE EFFECT OF SAMPLING TIME
USD/JPY @ 0100 GMT
GBP/USD @ 1700 GMT
USD/CAD @ 1000 GMT
AUD/USD @ 2000 GMT

FILTER ON MAGNITUDE OF PREDICTION
• Only enter trades when prediction is greater than some threshold
• Rather than remain constant, threshold should vary with underlying
volatility
• If performance degrades, we unlikely have an edge in terms of
predicting the magnitude of the next trade…but we may have an edge
in predicting the directional accuracy and the distribution of these
predictions.

FILTER ON MAGNITUDE OF PREDICTION
Previous GBP/USD SVM
model, but filter small
predictions.
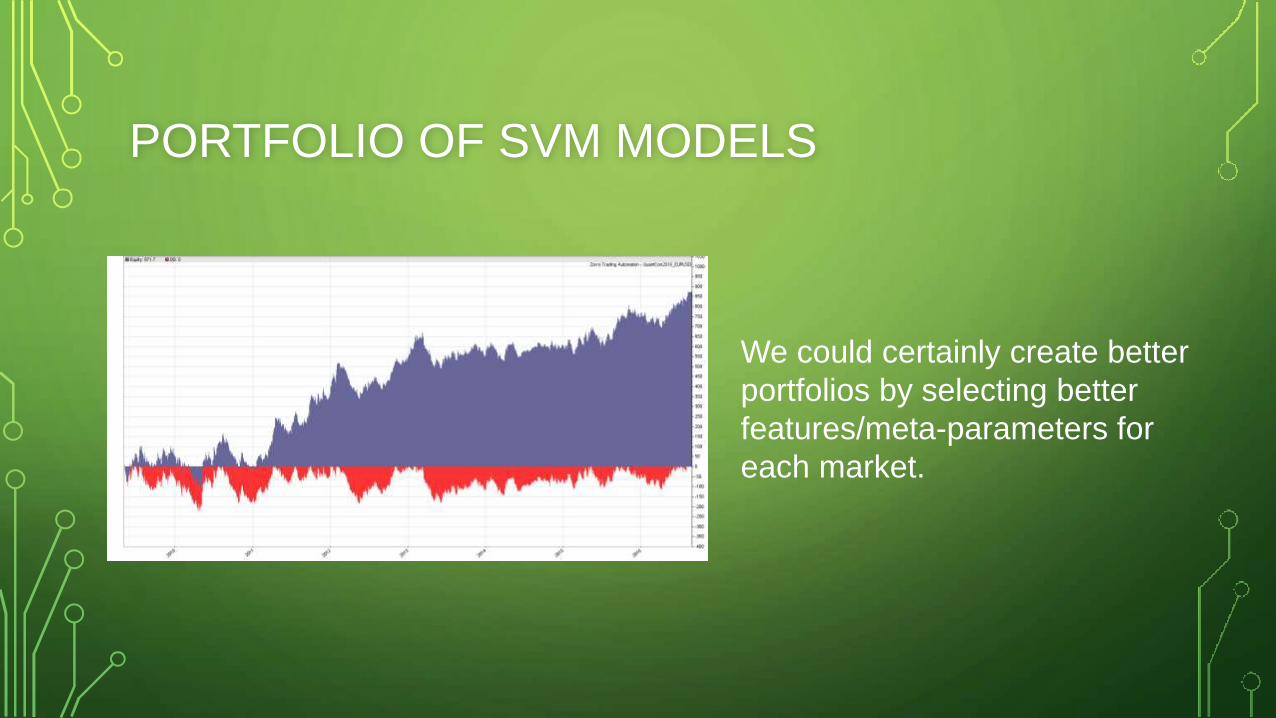
PORTFOLIO OF SVM MODELS
We could certainly create better
portfolios by selecting better
features/meta-parameters for
each market.
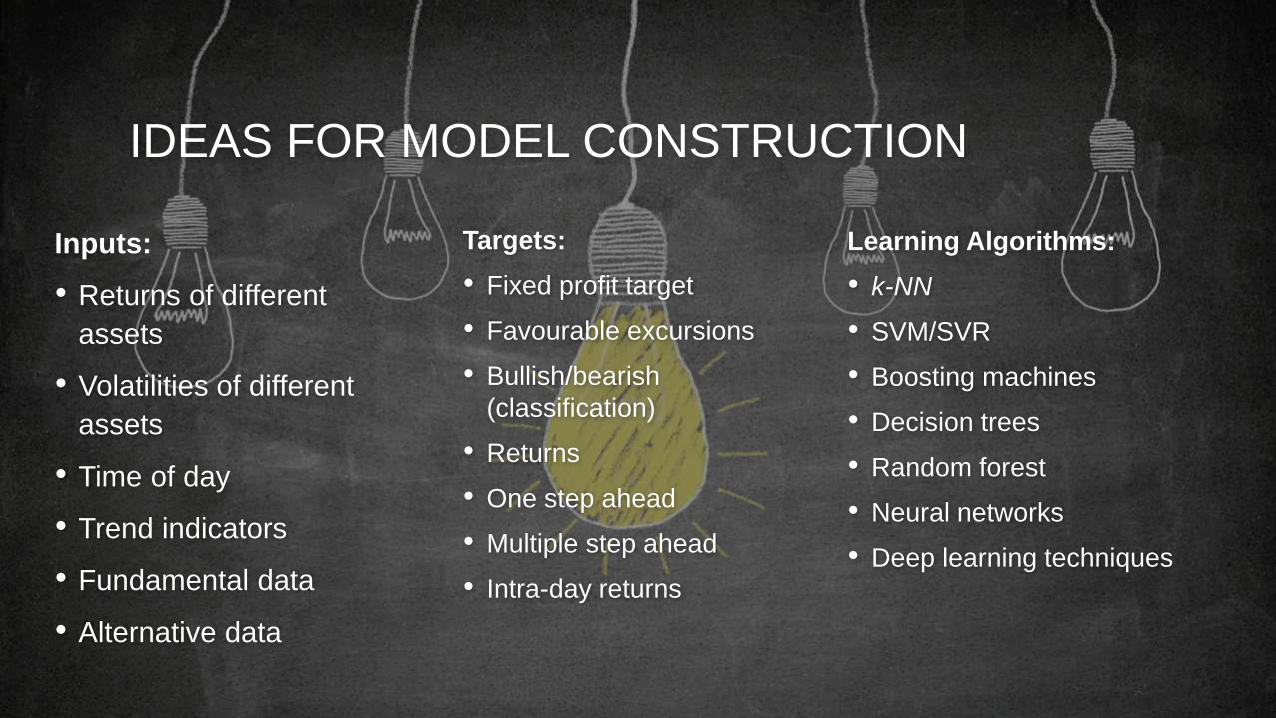
IDEAS FOR MODEL CONSTRUCTION
Inputs:
• Returns of different
assets
• Volatilities of different
assets
• Time of day
• Trend indicators
• Fundamental data
• Alternative data
Targets:
• Fixed profit target
• Favourable excursions
• Bullish/bearish
(classification)
• Returns
• One step ahead
• Multiple step ahead
• Intra-day returns
Learning Algorithms:
• k-NN
• SVM/SVR
• Boosting machines
• Decision trees
• Random forest
• Neural networks
• Deep learning techniques

BEWARE THE TEMPTATION TO TEST EVERYTHING
Between the choice of target, features and meta-features, there are almost unlimited possible
models to choose from. Hence why DMB can be so insidious with this approach.
If you try to test everything, you will thwart yourself with data mining bias and the limits of
practical computational power.
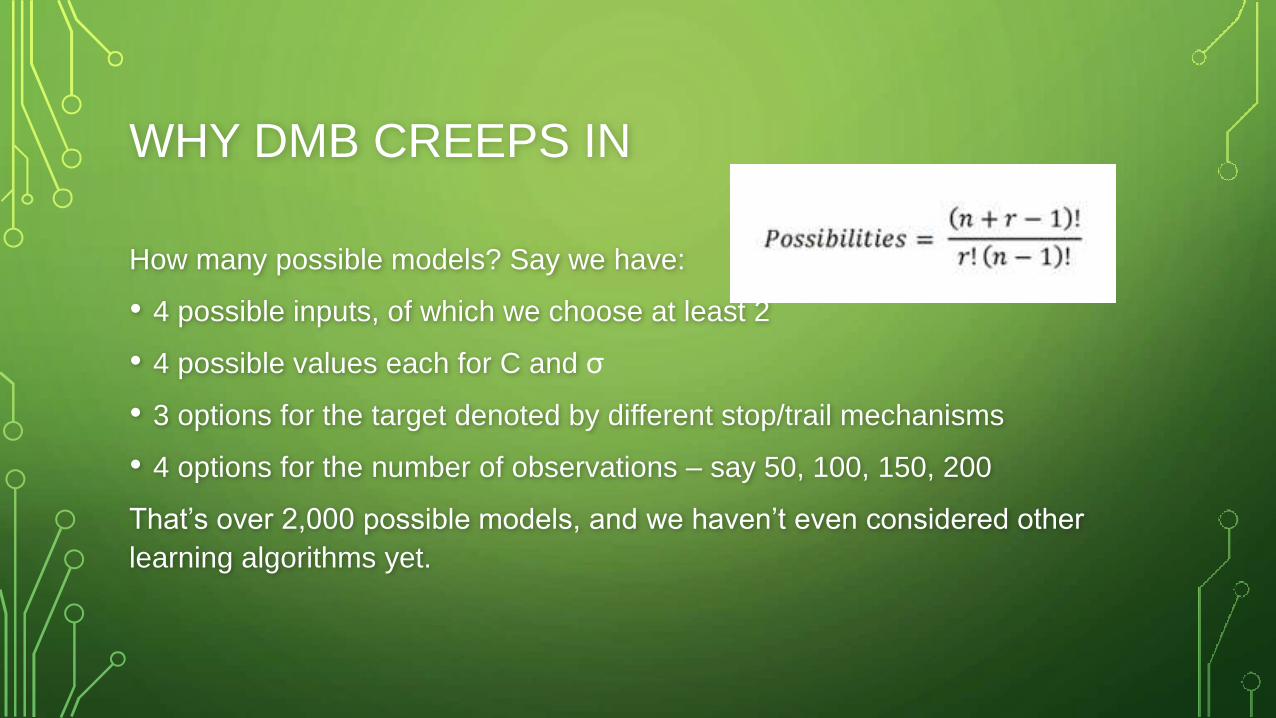
WHY DMB CREEPS IN
How many possible models? Say we have:
• 4 possible inputs, of which we choose at least 2
• 4 possible values each for C and σ
• 3 options for the target denoted by different stop/trail mechanisms
• 4 options for the number of observations – say 50, 100, 150, 200
That’s over 2,000 possible models, and we haven’t even considered other
learning algorithms yet.
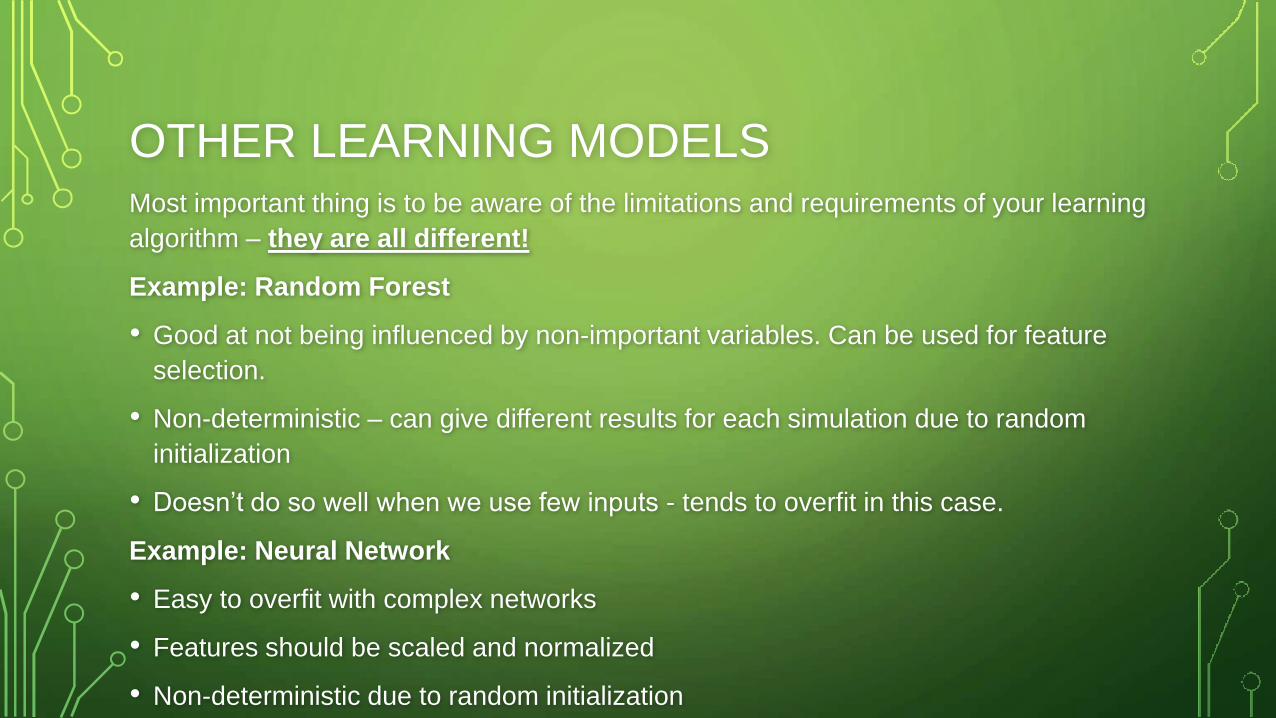
OTHER LEARNING MODELSMost important thing is to be aware of the limitations and requirements of your learning
algorithm – they are all different!
Example: Random Forest
• Good at not being influenced by non-important variables. Can be used for feature
selection.
• Non-deterministic – can give different results for each simulation due to random
initialization
• Doesn’t do so well when we use few inputs - tends to overfit in this case.
Example: Neural Network
• Easy to overfit with complex networks
• Features should be scaled and normalized
• Non-deterministic due to random initialization
ADAPTING MODEL PARAMETERS
• The model ideas presented so far seem quite arbitrary in their choice
of parameters
• The parameters are also static
• What if we adapted these parameters throughout the life of the
strategy?
• What does that set up look like?
ADAPTING MODEL PARAMETERS
• At regular intervals, say weekly, build N different models and simulate
their performance over the previous 100 (say) days. Select the best
model for trading in the next period.
• Computationally expensive
• Test the performance of N models during the past 100 days
• Each individual model is also retrained (say, weekly) during those 100 days
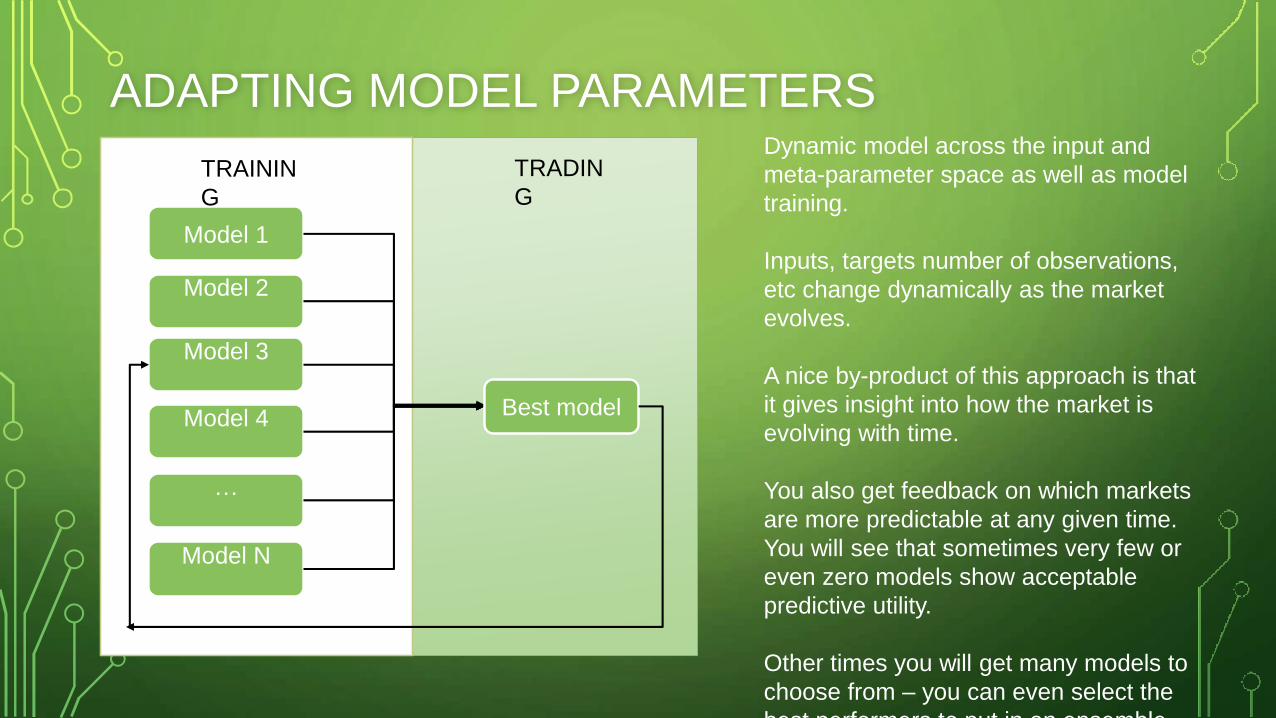
Model 2
Model 3
Model 1
Model N
Model 4
…
Best model
TRAININ
G
TRADIN
G
Dynamic model across the input and
meta-parameter space as well as model
training.
Inputs, targets number of observations,
etc change dynamically as the market
evolves.
A nice by-product of this approach is that
it gives insight into how the market is
evolving with time.
You also get feedback on which markets
are more predictable at any given time.
You will see that sometimes very few or
even zero models show acceptable
predictive utility.
Other times you will get many models to
choose from – you can even select the
best performers to put in an ensemble.
ADAPTING MODEL PARAMETERS
ACCOUNTING FOR DATA MINING BIAS
• How do we distinguish profitable results from the results our machine
learning model can give due to random chance? (how to measure
data mining bias?)

WHITE’S REALITY CHECK
• White, H. 2000. A Reality Check for Data Snooping, Econometrica, Vol.68, No.5
• A good description in Aronson, 2006. Evidence Based Technical Analysis
• Further improvements proposed by Hansen (2005), Romano and Wolf (2005), and
Corradi and Swanson (2011).
• All available online for free (except Aronson).
• Reference list available at http://robotwealth.com/recommended-reading/
• We’ll step through the actual process using the backtests I ran in creating this
presentation.
WRC – WHAT IS IT?
Definition:
A process for creating the distribution of the best variants of the
systems tested during the development process, under the null
hypothesis that all tested systems have an expectation of zero.
• What does that actually mean?

WRC – WHAT IS IT?
• WRC allows us to see where our model’s performance lies in relation
to the randomly good, bad or indifferent results that could have been
created through our particular development process, if they had zero
expectancy.
• We want our model to beat the vast majority of these systems.
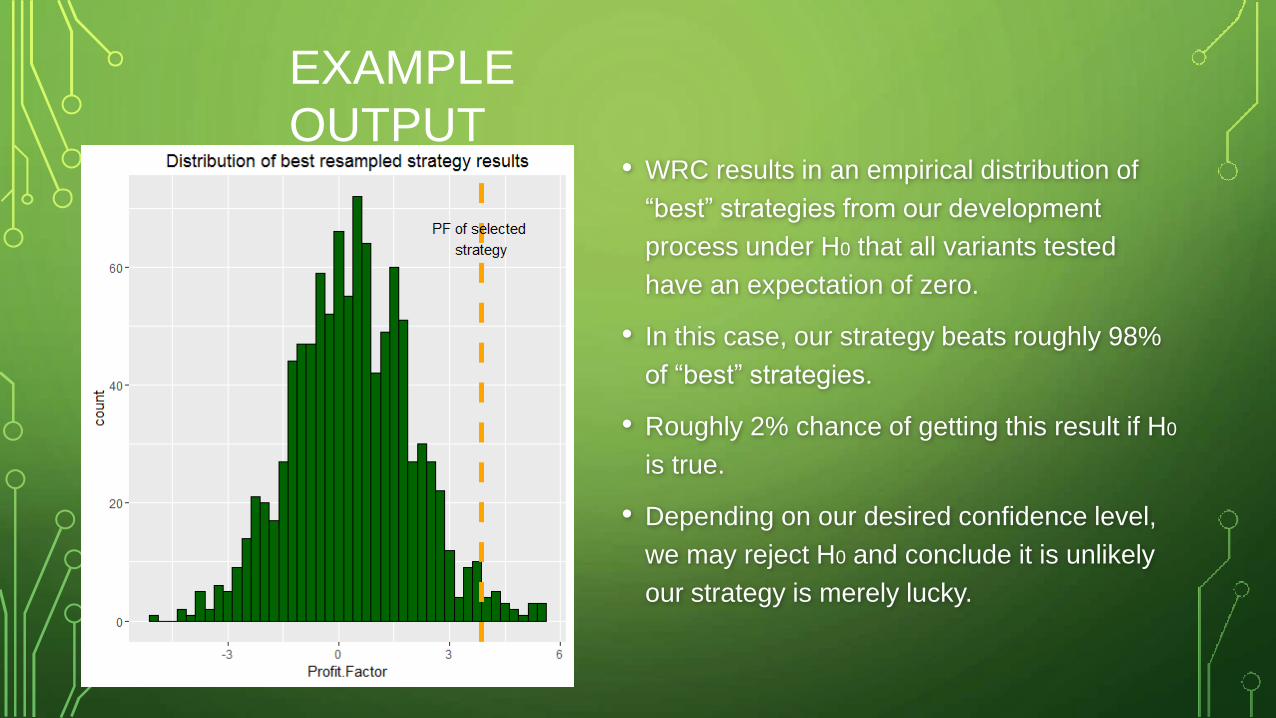
• WRC results in an empirical distribution of
“best” strategies from our development
process under H0 that all variants tested
have an expectation of zero.
• In this case, our strategy beats roughly 98%
of “best” strategies.
• Roughly 2% chance of getting this result if H0
is true.
• Depending on our desired confidence level,
we may reject H0 and conclude it is unlikely
our strategy is merely lucky.
EXAMPLE
OUTPUT

CONFUSED?
• If this sounds confusing, showing you the process might clarify things.

DIGRESSION - BOOTSTRAP
• The empirical distribution is constructed via bootstrapping (with
replacement) the returns series of each variant tested in the
development process.
• Bootstrapping is sampling with replacement. This means that one
observation can appear more than once in the bootstrapped sample.Original 0.24 2.23 0.19 -0.09 0.45 -0.58
Bootstrap 2.23 2.23 2.23 0.45 -0.09 -0.09
Randomized 0.19 -0.09 0.24 2.23 -0.58 0.45
WRC – STEP 1
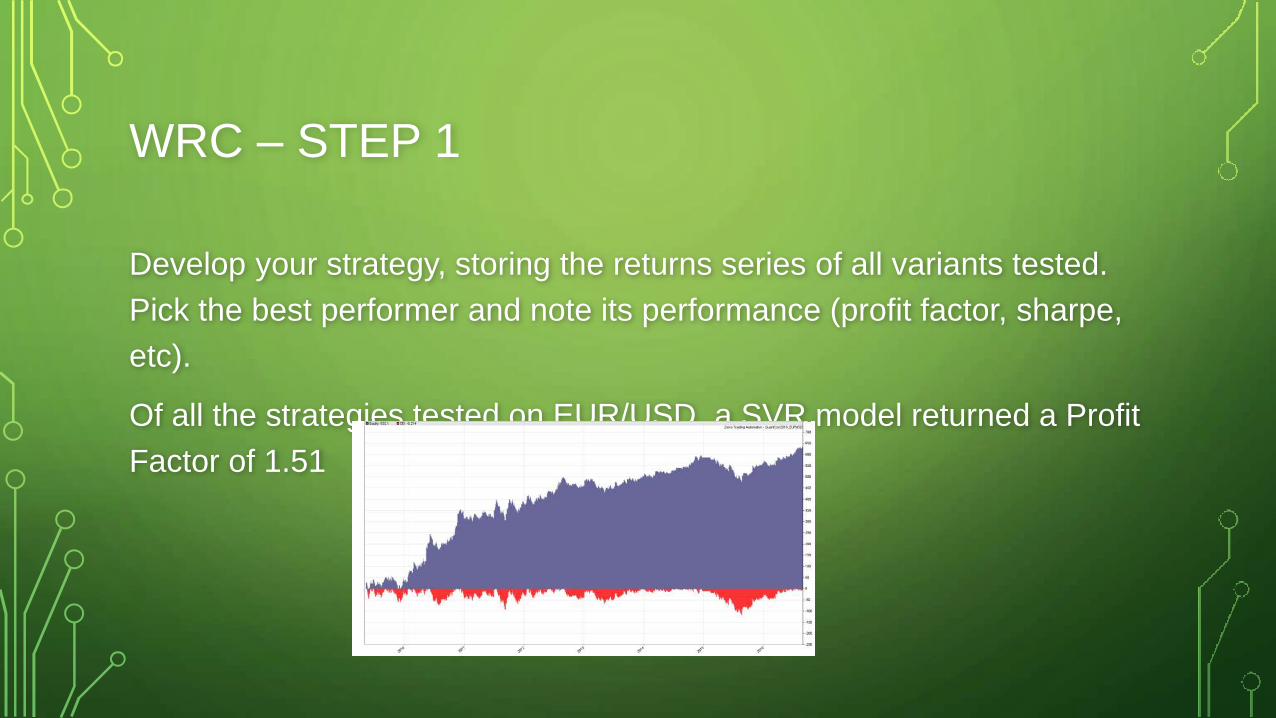
Develop your strategy, storing the returns series of all variants tested.
Pick the best performer and note its performance (profit factor, sharpe,
etc).
Of all the strategies tested on EUR/USD, a SVR model returned a Profit
Factor of 1.51

WRC – STEP 2
Create a zero-expectancy returns series from each of the stored returns
series.
Simply subtract the mean return of each variant from each day’s return.

WRC – STEP 2
Returns Returns –
mean(Returns)
This results in a series of balance curves with the same
characteristics as the tested variants, but with zero expectancy.
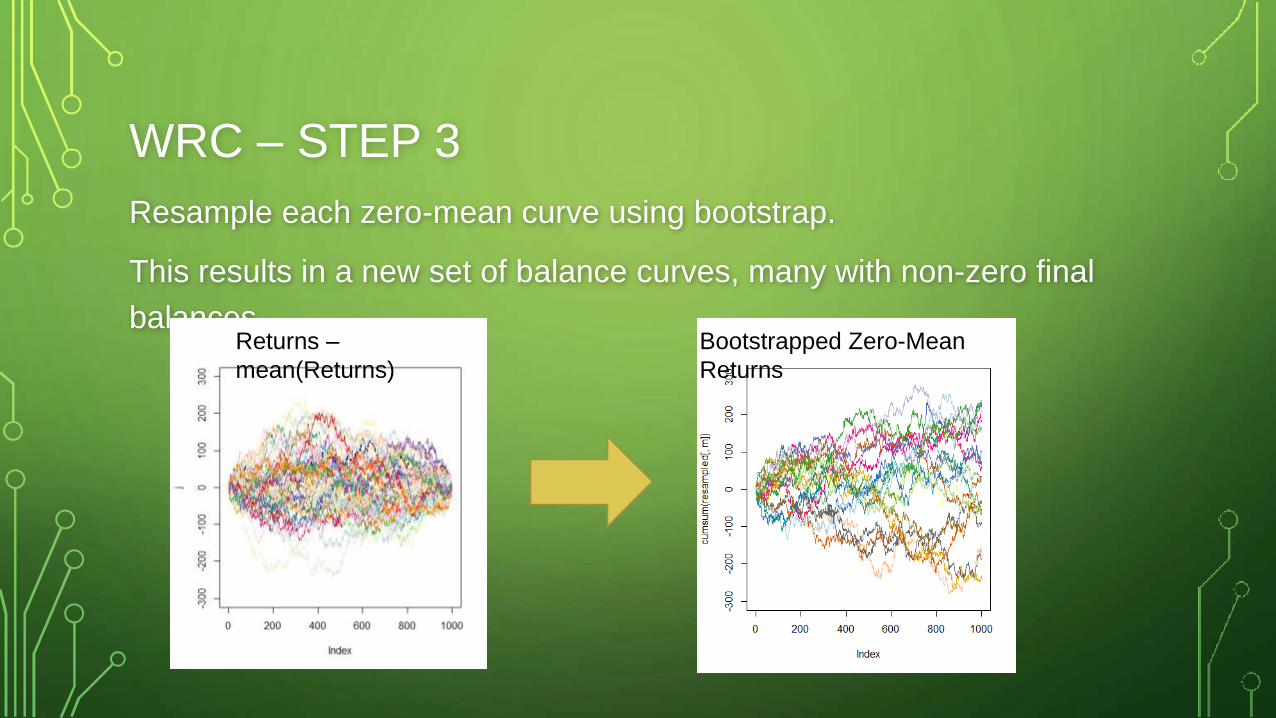
WRC – STEP 3
Resample each zero-mean curve using bootstrap.
This results in a new set of balance curves, many with non-zero final
balances.Bootstrapped Zero-Mean
Returns
Returns –
mean(Returns)
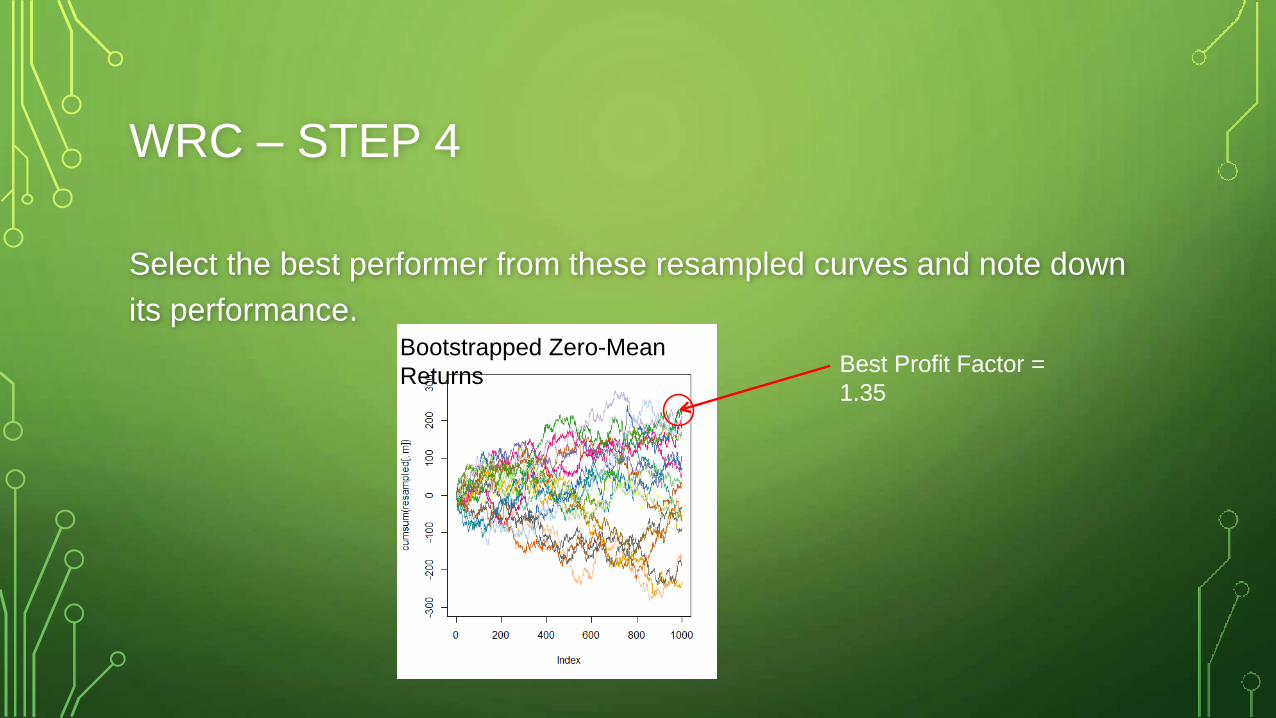
WRC – STEP 4
Select the best performer from these resampled curves and note down
its performance.Bootstrapped Zero-Mean
ReturnsBest Profit Factor =
1.35

WRC – STEP 5
Repeat steps 3 and 4 a few thousand times.
…
Bootstrap 1:
Best PF =
1.7
Bootstrap 2:
Best PF =
1.2
Bootstrap 3:
Best PF =
1.3
Bootstrap 4:
Best PF =
1.2
Bootstrap
5000:
Best PF = 1.5

WRC – STEP 6
Construct a frequency histogram from the several thousand values for
the best performer in each iteration of the bootstrap exercise.
Median ~ 1.2
Long right tail out to ~ 1.7

WRC – STEP 7
Work out where your selected strategy’s performance sits on that
distribution.
The percentage of bootstrapped values greater than your strategy’s
value is the p-value for the statistical test for H0. If 1-p > confidence
level, reject H0.
Benchmark PF = 1.51, which beats 98% of bootstrapped performance
curves
p = 0.02, so we reject H0
WRC – SOME PRACTICALITIES
• Set up step 1 at the outset – saving all the returns series throughout
the development process.
• Easy solution: include a function in your back-test code that appends
the daily returns series of any back-test as an array to a file with the
same name as the strategy.

WRC – SOME PRACTICALITIES
• WRC tends to Type II errors.
• That is, tends to reject good strategies, particularly when many
variants are tested.
• Intuitively that makes sense – the more variants we test, the more
likely we are to get lucky.
• An improvement proposed by Romano and Wolf (2005) may help.
WRC – SOME PRACTICALITIES
• When variants have a negative expectancy, WRC tends to further
over-estimate data mining bias.
• An improvement proposed by Hanson (2005) may help.

FULL DISCLOSURE
Looks like a really nice result, but in reality I
kind of knew where to look because of the
large body of research I’ve previously
undertaken in this area.
Can we therefore have confidence in this data
mining bias accounting procedure?
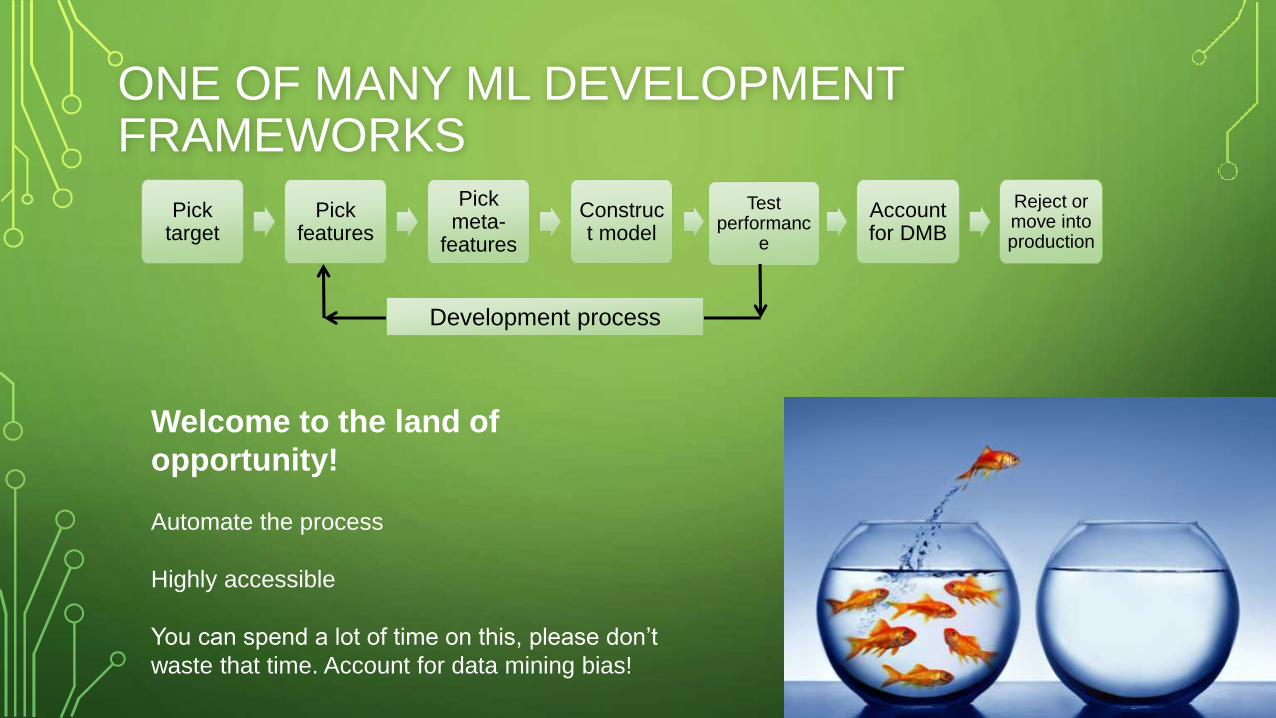
ONE OF MANY ML DEVELOPMENT FRAMEWORKS
Welcome to the land of
opportunity!
Automate the process
Highly accessible
You can spend a lot of time on this, please don’t
waste that time. Account for data mining bias!
Pick target
Pick features
Pick meta-
features
Construct model
Test performanc
e
Account for DMB
Reject or move into production
Development process