A Focused Look at Those Caring for Someone Age … · A Focused Look at Those Caring for Someone...
18
Caregivers of Younger Adults: A Focused Look at Those Caring for Someone Age 18 to 49 Conducted by RESEARCH REPORT: CAREGIVING IN THE U.S. 2015 – A FOCUSED LOOK AT CAREGIVERS OF YOUNGER ADULTS JUNE 2015
-
Upload
vuonghuong -
Category
Documents
-
view
219 -
download
0
Transcript of A Focused Look at Those Caring for Someone Age … · A Focused Look at Those Caring for Someone...

RESEARCH REPORT
Caregivers of Younger Adults:
A Focused Look at Those Caring for Someone Age 18 to 49
Conducted by
RESEARCH REPORT: CAREGIVING IN THE U.S. 2015 – A FOCUSED LOOK AT CAREGIVERS OF YOUNGER ADULTS JUNE 2015
i
C a r e g i v i n g i n t h e U . S . 2 0 1 5
i
Acknowledgments The National Alliance for Caregiving (NAC) and the AARP Public Policy Institute are proud to present Caregiving in the U.S. 2015 – A Focused Look at Caregivers of Younger Adults.
Co-Directors Gail Gibson Hunt National Alliance for Caregiving
Susan Reinhard, PhD AARP Public Policy Institute
Many people played important roles throughout the research process, including: Rick Greene, MSW C. Grace Whiting, JD National Alliance for Caregiving
Lynn Friss Feinberg, MSW Rita Choula Jordan Green, MS Ari Houser, PhD AARP Public Policy Institute
NAC Advisory Panel Donna Benton, PhD, Family Caregiver Support Program, University of Southern California Thomas Dudley, MS, RN, Centers for Medicare & Medicaid Services Marty Ford, JD, the Arc Cindy Hounsell, JD, WISER Jed Johnson, Easter Seals Carol Levine, PhD, United Hospital Fund of New York City Katie Maslow, MSW, Institute of Medicine Ruth Stein, MD, Albert Einstein College of Medicine Catherine Thurston, LCSW, Services and Advocacy for GLBT Elders Nancy Vuckovic, PhD, Intel Donna Wagner, PhD, New Mexico State University Jennifer Wolff, PhD, Johns Hopkins University
This research was made possible through generous sponsorship from: • AARP • Archstone Foundation • Eli Lilly • Home Instead Senior Care • MetLife Foundation
• Family Support Research and Training Center (FSRTC), University of Illinois-Chicago1
• Pfizer • UnitedHealthcare
The research was conducted for NAC and the AARP Public Policy Institute by Greenwald & Associates, with study direction by Lisa Weber-Raley and Erin Smith.
(c) 2015 NAC and AARP Public Policy Institute Reprinting with permission
Cover photography provided by the Family Caregiver Alliance. 1 With respect to funding received from FSRTC, this work was performed under a subcontract with the University of Illinois at Chicago and made possible by grant number H113B140046 from the U.S. Department of Education/NIDRR. Its contents are solely the responsibility of the authors and do not necessarily represent the official views of the U.S. Department of Education/NIDRR.
RESEARCH REPORT: CAREGIVING IN THE U.S. 2015 – A FOCUSED LOOK AT CAREGIVERS OF YOUNGER ADULTS JUNE 2015

1
C a r e g i v i n g i n t h e U . S . 2 0 1 5 – A F o c u s e d L o o k a t C a r e g i v e r s o f Y o u n g e r A d u l t s
3
A Focused Look at Caregivers of Younger Adults This is the first of two companion reports to the full report of the study entitled Caregiving in the U.S. 2015. This companion report focuses on 159 unpaid family caregivers who provide care to an adult age 18 to 49 – we call them “caregivers of younger adults” – and includes a comparison to 1,087 caregivers of older adults, when significantly different. The other companion report provides detail on caregivers of older adults (ages 50+). All family caregivers were interviewed using GfK’s web-enabled KnowledgePanel®, a probability-based panel designed to be representative of the U.S. population, between September 11 and November 5, 2014. To see complete study results, or for more information about the questionnaires or the methodology, please reference the full report and Appendices A and B.
Reading this Report
All figures have been weighted and rounded. In addition, “don’t know” or “refused” responses are not always presented in charts and tables. For these reasons, some charts and tables will not add to 100%. The results for multiple- response questions may also add to greater than 100%.
The n sizes shown in each table or graphic represent the unweighted number of respondents who answered each question. All demographic information about the caregiver is in reference to their current situation if currently caregiving, or their situation at the time they last provided care if not a current caregiver.
2
C a r e g i v i n g i n t h e U . S . 2 0 1 5 – A F o c u s e d L o o k a t C a r e g i v e r s o f Y o u n g e r A d u l t s
4
A. Prevalence of Caregiving We estimate at least 5.6 million adults in the United States have provided unpaid care to an adult family member or friend who is 18 to 49 years of age in the prior 12 months.2
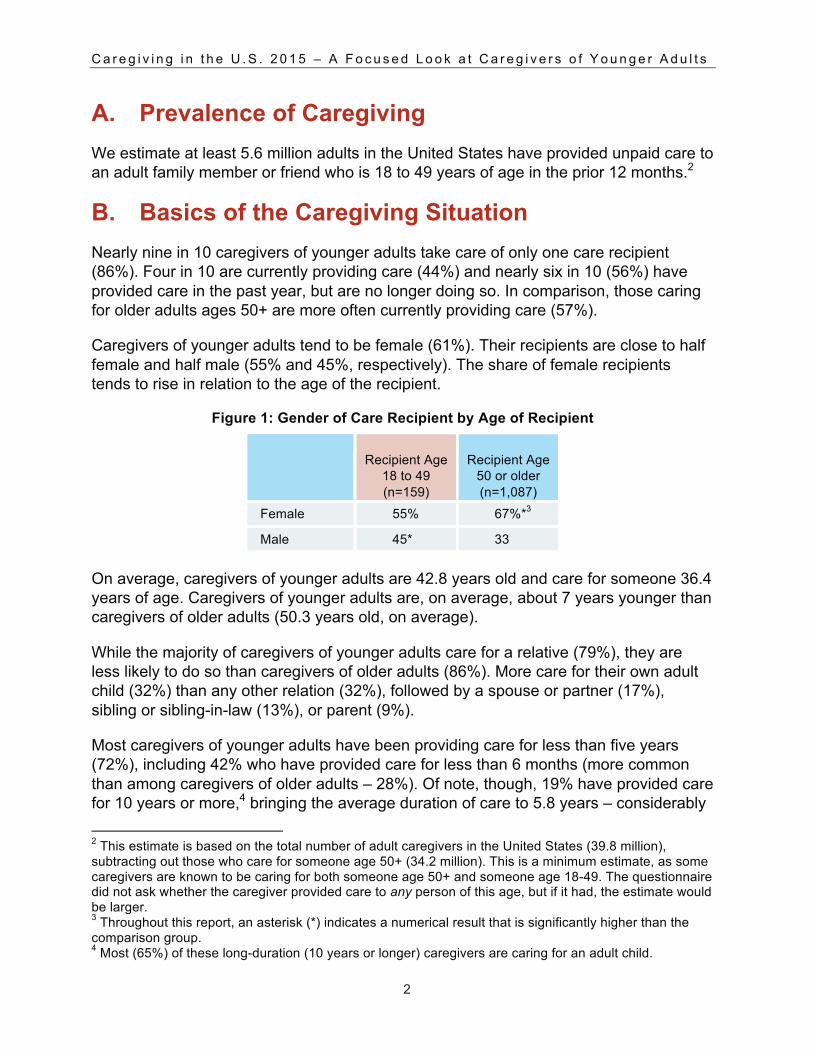
B. Basics of the Caregiving Situation Nearly nine in 10 caregivers of younger adults take care of only one care recipient (86%). Four in 10 are currently providing care (44%) and nearly six in 10 (56%) have provided care in the past year, but are no longer doing so. In comparison, those caring for older adults ages 50+ are more often currently providing care (57%).
Caregivers of younger adults tend to be female (61%). Their recipients are close to half female and half male (55% and 45%, respectively). The share of female recipients tends to rise in relation to the age of the recipient.
Figure 1: Gender of Care Recipient by Age of Recipient
Recipient Age 18 to 49 (n=159)
Recipient Age 50 or older (n=1,087)
Female 55% 67%*3
Male 45* 33
On average, caregivers of younger adults are 42.8 years old and care for someone 36.4 years of age. Caregivers of younger adults are, on average, about 7 years younger than caregivers of older adults (50.3 years old, on average).
While the majority of caregivers of younger adults care for a relative (79%), they are less likely to do so than caregivers of older adults (86%). More care for their own adult child (32%) than any other relation (32%), followed by a spouse or partner (17%), sibling or sibling-in-law (13%), or parent (9%).
Most caregivers of younger adults have been providing care for less than five years (72%), including 42% who have provided care for less than 6 months (more common than among caregivers of older adults – 28%). Of note, though, 19% have provided care for 10 years or more,4 bringing the average duration of care to 5.8 years – considerably 2 This estimate is based on the total number of adult caregivers in the United States (39.8 million), subtracting out those who care for someone age 50+ (34.2 million). This is a minimum estimate, as some caregivers are known to be caring for both someone age 50+ and someone age 18-49. The questionnaire did not ask whether the caregiver provided care to any person of this age, but if it had, the estimate would be larger. 3 Throughout this report, an asterisk (*) indicates a numerical result that is significantly higher than the comparison group. 4 Most (65%) of these long-duration (10 years or longer) caregivers are caring for an adult child.

3
C a r e g i v i n g i n t h e U . S . 2 0 1 5 – A F o c u s e d L o o k a t C a r e g i v e r s o f Y o u n g e r A d u l t s
5
longer than caregivers of older adults (3.7 years). By contrast, the typical caregiver of a younger adult has given 0.8 years of care (as measured by the median), similar to caregivers of older adults (1.0 years).
When asked if they felt they had a choice in taking on their caregiving responsibility, half (50%) say they had no choice. Those caring for a nuclear family member, such as a spouse (64%) or adult child (57%), are more likely to feel they had an obligation to provide care for their loved one, more so than those caring for a nonrelative (29%).
C. Living Situation Most caregivers of a younger adult report their loved one does not live alone (84%), more so than caregivers of older adults (66%).
Half of caregivers of younger adults live with their care recipient (49%), while three in 10 say their loved one lives in his or her own home (31%). Caregivers of an older adult are less likely to report they reside with their care recipient (32%) and more likely to report that their recipient lives in his or her own home (51%).
Figure 2: Where Care Recipient Lives by Age of Recipient
Recipient Age
18 to 49 (n=156)
Recipient Age 50 or older (n=1,078)
In caregiver’s household 49%* 32%
In his or her own home 31 51*
In someone else’s home 14* 5
Among the 49% of caregivers who share their household with their younger adult recipient, most (66%) are taking care of their own adult child or their spouse. Of caregivers of younger adults who do not live with their care recipient, 73% visit their loved one at least once a week.
D. Care Recipient Condition Types of Care Recipient Conditions
Caregivers of younger adults most commonly say their recipient has a short-term physical condition (43%), emotional or mental health problem (36%), or a long-term physical condition (32%). Many care recipients have more than one ongoing problem or illness (37%). These conditions or reasons for care differ greatly by the age of the recipient.

4
C a r e g i v i n g i n t h e U . S . 2 0 1 5 – A F o c u s e d L o o k a t C a r e g i v e r s o f Y o u n g e r A d u l t s
6
Figure 3: Types of Care Recipient Conditions by Age of Recipient
Recipient Age 18 to 49 (n=159)
Recipient Age 50 or older (n=1,087)
Any physical condition(s) 71% 87%*
Short-term physical condition(s) 43%* 34%
Long-term physical condition(s) 32% 63%*
Emotional or Mental health problems 36%* 19%
Behavioral issues 17%* 5%
Developmental/Intellectual Disorder, Mental Retardation 11%* 3%
Memory problems 11% 29%*
Average Number of Conditions 1.5 1.5
Care Recipient’s Main Problem or Illness
When caregivers are asked what they perceive to be the main problem or illness for which their younger adult care recipient needs care, the top three named are mental or emotional illness (18%), surgery/wounds (12%), and cancer (6%). This is quite different from the top three mentions among caregivers of older adults, which are: “old age”/aging issues (16%), Alzheimer’s or dementia (9%), and mobility issues (8%).
One in four (23%) caregivers of younger adults feels it is somewhat or very difficult to coordinate the various health care and service providers who give care or treatment to their loved one.
E. Caregiving Activities and Burden of Care Hours of Care Provided
On average, caregivers of younger adults spend 26.9 hours a week providing care to their loved one.5 Four in 10 are in situations where their time commitment is modest, no more than eight hours each week (42%). On the other end of the scale, 27% provide more than 40 hours of care per week.
Help with Activities of Daily Living (ADLs)
How is caregivers’ time spent? Just over half of caregivers of younger adults help their loved one with at least one Activity of Daily Living (ADL, 54%); most commonly helping 5 Any caregiver who typed in hours of care in excess of 98 hours per week is capped at this level, equivalent to 14 hours per day. Caregivers who selected constant care were capped at 77 hours per week, the mean hours of care derived from an imputation model predicting hours of care provided. For more details on the imputation model, see Appendix B: Detailed Methodology.
5
C a r e g i v i n g i n t h e U . S . 2 0 1 5 – A F o c u s e d L o o k a t C a r e g i v e r s o f Y o u n g e r A d u l t s
7
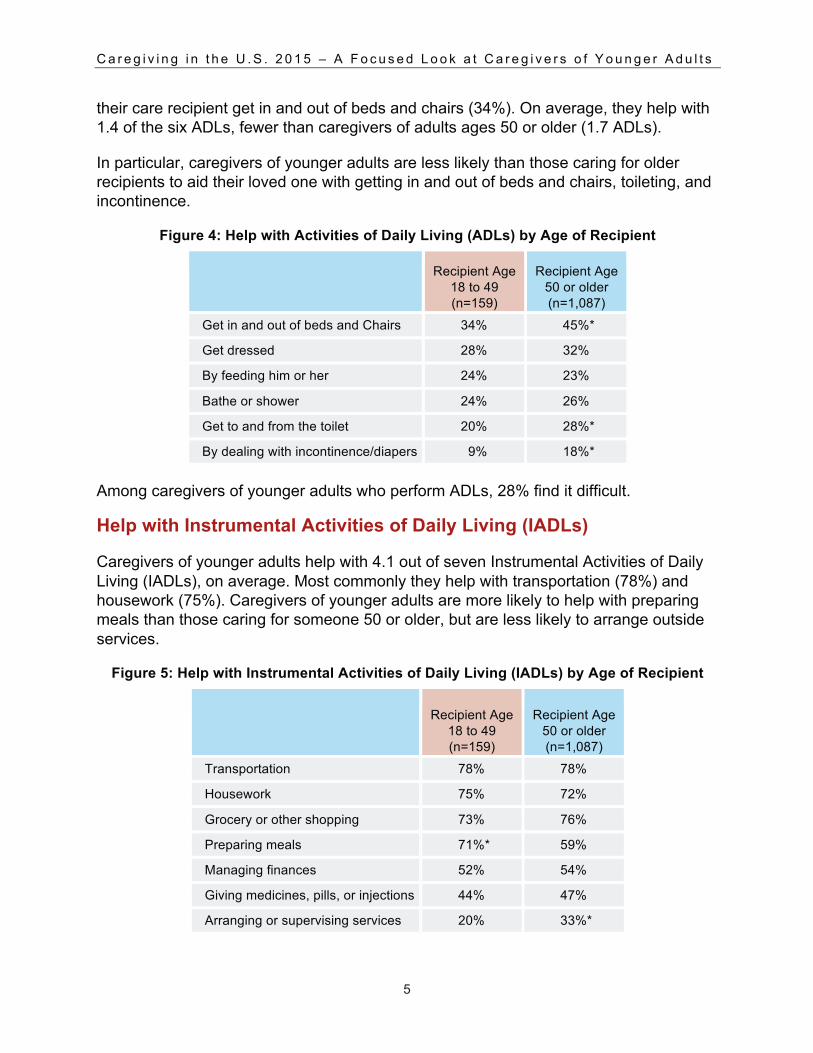
their care recipient get in and out of beds and chairs (34%). On average, they help with 1.4 of the six ADLs, fewer than caregivers of adults ages 50 or older (1.7 ADLs).
In particular, caregivers of younger adults are less likely than those caring for older recipients to aid their loved one with getting in and out of beds and chairs, toileting, and incontinence.
Figure 4: Help with Activities of Daily Living (ADLs) by Age of Recipient
Recipient Age
18 to 49 (n=159)
Recipient Age 50 or older (n=1,087)
Get in and out of beds and Chairs 34% 45%*
Get dressed 28% 32%
By feeding him or her 24% 23%
Bathe or shower 24% 26%
Get to and from the toilet 20% 28%*
By dealing with incontinence/diapers 9% 18%*
Among caregivers of younger adults who perform ADLs, 28% find it difficult.
Help with Instrumental Activities of Daily Living (IADLs)
Caregivers of younger adults help with 4.1 out of seven Instrumental Activities of Daily Living (IADLs), on average. Most commonly they help with transportation (78%) and housework (75%). Caregivers of younger adults are more likely to help with preparing meals than those caring for someone 50 or older, but are less likely to arrange outside services.
Figure 5: Help with Instrumental Activities of Daily Living (IADLs) by Age of Recipient
Recipient Age
18 to 49 (n=159)
Recipient Age 50 or older (n=1,087)
Transportation 78% 78%
Housework 75% 72%
Grocery or other shopping 73% 76%
Preparing meals 71%* 59%
Managing finances 52% 54%
Giving medicines, pills, or injections 44% 47%
Arranging or supervising services 20% 33%*
Grace
Sticky Note
Marked set by Grace
6
C a r e g i v i n g i n t h e U . S . 2 0 1 5 – A F o c u s e d L o o k a t C a r e g i v e r s o f Y o u n g e r A d u l t s
8
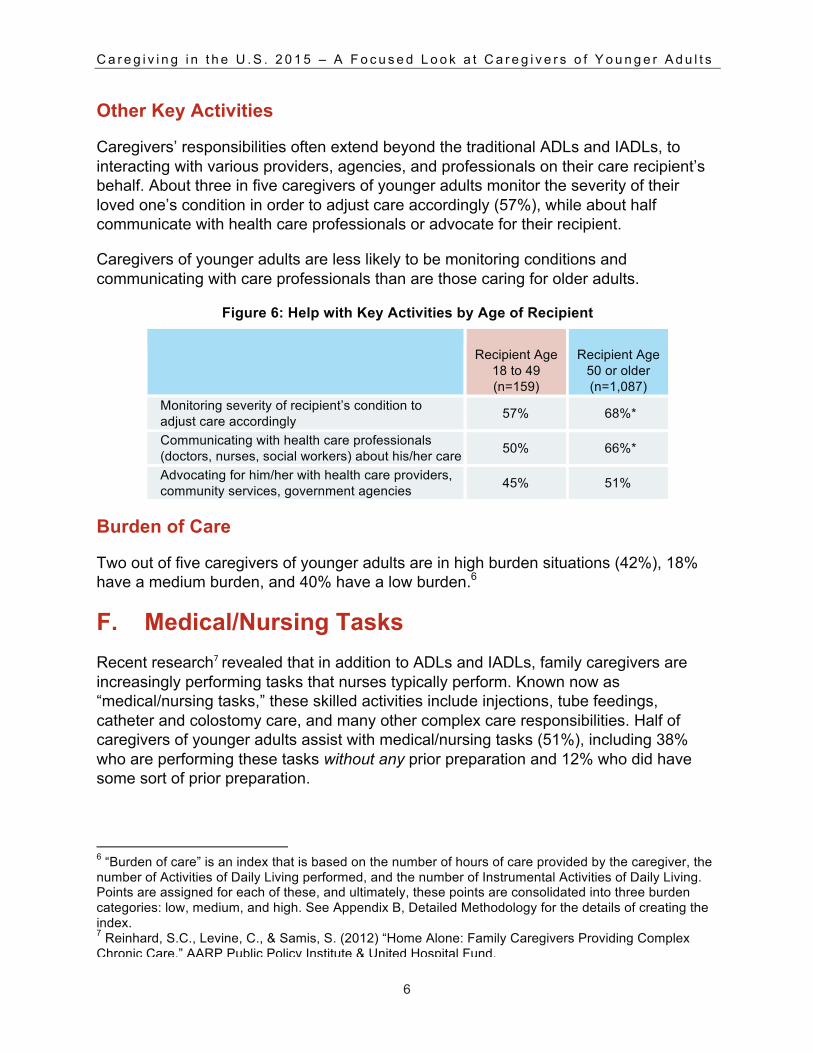
Other Key Activities
Caregivers’ responsibilities often extend beyond the traditional ADLs and IADLs, to interacting with various providers, agencies, and professionals on their care recipient’s behalf. About three in five caregivers of younger adults monitor the severity of their loved one’s condition in order to adjust care accordingly (57%), while about half communicate with health care professionals or advocate for their recipient.
Caregivers of younger adults are less likely to be monitoring conditions and communicating with care professionals than are those caring for older adults.
Figure 6: Help with Key Activities by Age of Recipient
Recipient Age
18 to 49 (n=159)
Recipient Age 50 or older (n=1,087)
Monitoring severity of recipient’s condition to adjust care accordingly 57% 68%*
Communicating with health care professionals (doctors, nurses, social workers) about his/her care 50% 66%*
Advocating for him/her with health care providers, community services, government agencies 45% 51%
Burden of Care
Two out of five caregivers of younger adults are in high burden situations (42%), 18% have a medium burden, and 40% have a low burden.6
F. Medical/Nursing Tasks Recent research7 revealed that in addition to ADLs and IADLs, family caregivers are increasingly performing tasks that nurses typically perform. Known now as “medical/nursing tasks,” these skilled activities include injections, tube feedings, catheter and colostomy care, and many other complex care responsibilities. Half of caregivers of younger adults assist with medical/nursing tasks (51%), including 38% who are performing these tasks without any prior preparation and 12% who did have some sort of prior preparation.
6 “Burden of care” is an index that is based on the number of hours of care provided by the caregiver, the number of Activities of Daily Living performed, and the number of Instrumental Activities of Daily Living. Points are assigned for each of these, and ultimately, these points are consolidated into three burden categories: low, medium, and high. See Appendix B, Detailed Methodology for the details of creating the index. 7 Reinhard, S.C., Levine, C., & Samis, S. (2012) “Home Alone: Family Caregivers Providing Complex Chronic Care,” AARP Public Policy Institute & United Hospital Fund.

7
C a r e g i v i n g i n t h e U . S . 2 0 1 5 – A F o c u s e d L o o k a t C a r e g i v e r s o f Y o u n g e r A d u l t s
9
Among caregivers of younger adults who provide medical/nursing tasks, 14% find it difficult to do so (rated 4 or 5 on 5-point scale).
When caregivers of younger adults are asked to select the ways in which they would prefer to learn how to perform medical/nursing tasks, should they be needed, the most-preferred learning methods are to have a qualified person show them how to perform it (53%) and to perform it themselves while a qualified person watches (hands-on, 48%).
G. Hospitalization Only about two out of five caregivers of younger adults report their loved one had been hospitalized at least once in the past year (44%), significantly less common than among caregivers of older adults (55%).
Caregivers of younger adults are five times more likely (10%, compared with 2% among caregivers of older adults) to report that they were not included by health care workers in discussions about their loved one’s care when they should have been.
H. Presence of Other Caregivers Just four in 10 caregivers of younger adults say someone else has also provided unpaid care to their loved one within the past 12 months (39%). Three out of four (76%) caregivers of younger adults consider themselves to be the primary unpaid caregiver, including 60% who are sole caregivers and 16% who report that there are other caregivers but that they provide most of the unpaid care. Caregivers of older adults are less likely to be the primary caregiver (61%).
Figure 7: Primary Caregiver Status by Age of Recipient
Recipient Age 18 to 49 (n=159)
Recipient Age 50 or older (n=1,087)
Primary caregiver (Sole or provides most unpaid care) 76%* 61%
Sole caregiver 60%* 44%
Provides most of unpaid care 16% 16%
Not primary caregiver 23% 39%*
Among caregivers of younger adults, those caring for a spouse/partner (86%) and those caring for an adult child (83%) are especially likely to be the primary caregiver.
In addition, just one in five (19%) reports their younger adult care recipient had paid help in the past 12 months, from any aides, housekeepers, or other paid helpers.
8
C a r e g i v i n g i n t h e U . S . 2 0 1 5 – A F o c u s e d L o o k a t C a r e g i v e r s o f Y o u n g e r A d u l t s
10
Caregivers of older adults are more likely to report their loved one receives paid help (34%).
I. Stress and Strain of Caregiving Caregiver Health
Half of caregivers of young adults consider their health to be excellent or very good (51%), 31% evaluate their health as good, and 17% say it is fair or poor. By comparison, 10% of the U.S. adult population describes their health as fair or poor.8 Nearly one in four feel caregiving has made their health worse (24%), although 66% say their health has not been affected, and 9% claim it has improved as a result of caregiving.
Strain and Stress
Six in 10 caregivers of younger adults report that they experience little to no physical strain in caring for their loved one (59% rating it 1 to 2 on a 5-point scale), 19% experience moderate strain (a rating of 3), and 22% report the level of physical strain is high (a rating of 4 or 5).
Emotional stress is more common among caregivers of young adults. Fewer than four in 10 say there is little to no emotional stress (38% rating it 1 or 2), while slightly more feel a high level of emotional stress (40% rating 4 or 5 on 5-point scale). Caregivers of an adult age 18 to 49 with an emotional or mental health issue are more likely to report feeling emotional stress (57%) than are those caring for someone without such problems (30%).
One in five caregivers of a younger adult experiences financial strain (22% rating 4 or 5 on a 5-point scale). Caregivers of older adults are more likely to report little to no financial strain (63% vs. 53% among caregivers of younger adults).
J. Impact of Caregiving on Work Concurrence of Work and Caregiving
A majority (65%) of caregivers of younger adults were employed at some point in the past year while caregiving. Among them, half work full time (49%) and on average, they work 34.7 hours a week. One in six is self-employed or owns a business (18%). In comparison, 9.4% of U.S. workers are self-employed.9
8 CDC/NCHS, National Health Interview Survey, January–June 2014, Family Core component. 9 Current Population Survey, Annual Social and Economic Supplement, 2012 data, presented in Bureau of Labor Statistics Monthly Labor Review article “Female self-employment in the United States: An update to 2012” (October 2014).
9
C a r e g i v i n g i n t h e U . S . 2 0 1 5 – A F o c u s e d L o o k a t C a r e g i v e r s o f Y o u n g e r A d u l t s
11
Employer Support
What are employers doing to support caregivers? Six in 10 working caregivers of younger adults say their supervisor knows they provide care (61%). In terms of the benefits and support that their employer provides, 49% have flexible work hours, and 21% report having programs like information, referrals, counseling, or an employee assistance program to help caregivers.
Just 12% of working caregivers of younger adults say they are able to telecommute or work from home, fewer than caregivers of older adults (24%).
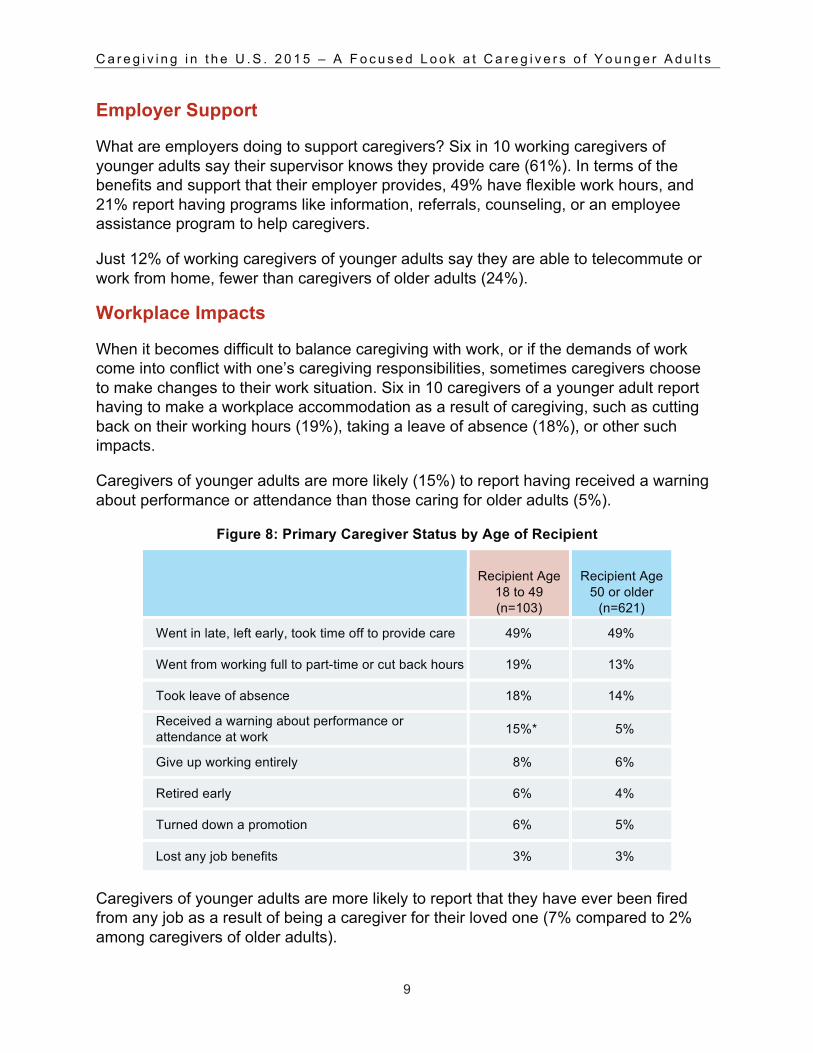
Workplace Impacts
When it becomes difficult to balance caregiving with work, or if the demands of work come into conflict with one’s caregiving responsibilities, sometimes caregivers choose to make changes to their work situation. Six in 10 caregivers of a younger adult report having to make a workplace accommodation as a result of caregiving, such as cutting back on their working hours (19%), taking a leave of absence (18%), or other such impacts.
Caregivers of younger adults are more likely (15%) to report having received a warning about performance or attendance than those caring for older adults (5%).
Figure 8: Primary Caregiver Status by Age of Recipient
Recipient Age 18 to 49 (n=103)
Recipient Age 50 or older
(n=621)
Went in late, left early, took time off to provide care 49% 49%
Went from working full to part-time or cut back hours 19% 13%
Took leave of absence 18% 14%
Received a warning about performance or attendance at work 15%* 5%
Give up working entirely 8% 6%
Retired early 6% 4%
Turned down a promotion 6% 5%
Lost any job benefits 3% 3%
Caregivers of younger adults are more likely to report that they have ever been fired from any job as a result of being a caregiver for their loved one (7% compared to 2% among caregivers of older adults).

10
C a r e g i v i n g i n t h e U . S . 2 0 1 5 – A F o c u s e d L o o k a t C a r e g i v e r s o f Y o u n g e r A d u l t s
12
K. Information Needs and Caregiving Support Information Needs
A large majority (78%) of caregivers of younger adults feel they need more help or information about at least one topic related to caregiving. Most commonly, caregivers of younger adults would like assistance with managing their own emotional and physical stress (45%). One in three would like help or information about keeping their loved one safe at home (32%)—less than the demand for this assistance among caregivers of older adults (43%). Caregivers of younger adults are less likely to want help or information about making end-of-life decisions (12% vs. 24% among caregivers of adults age 50+).
Figure 9: Help and Information Needs by Age of Recipient
Recipient Age 18 to 49 (n=159)
Recipient Age 50 or older (n=1,087)
Managing your emotional and physical stress 45% 42%
Keeping your loved one safe at home 32% 43%*
Making end-of-life decisions 12% 24%*
Managing his/her challenging behaviors 11% 13%
Managing his/her incontinence or toileting problems 7% 11%
Finding non-English language educational materials 4% 5%
Conversations about Recipient and Self-Care
Only a small proportion of caregivers of younger adults report having had conversations with health care provides—like doctors, nurses, or social workers—about what is needed to provide care to their care recipient (23%) or for their own care (16%). Caregivers of younger adults are less likely to have had conversations about what is needed to care for their recipient than caregivers of older adults (33%).
When asked if these kinds of conversations with health care providers would be helpful, one in three (33%) caregivers of younger adults think conversations about needs for recipient care would be helpful, while 24% say conversations about self-care needs would be helpful.
Services Used
Just half of caregivers of younger adults report having done at least one support service or request, including things like requesting information about financial help for their loved one (31%), making modifications to their loved one’s home (20%), using outside
11
C a r e g i v i n g i n t h e U . S . 2 0 1 5 – A F o c u s e d L o o k a t C a r e g i v e r s o f Y o u n g e r A d u l t s
13
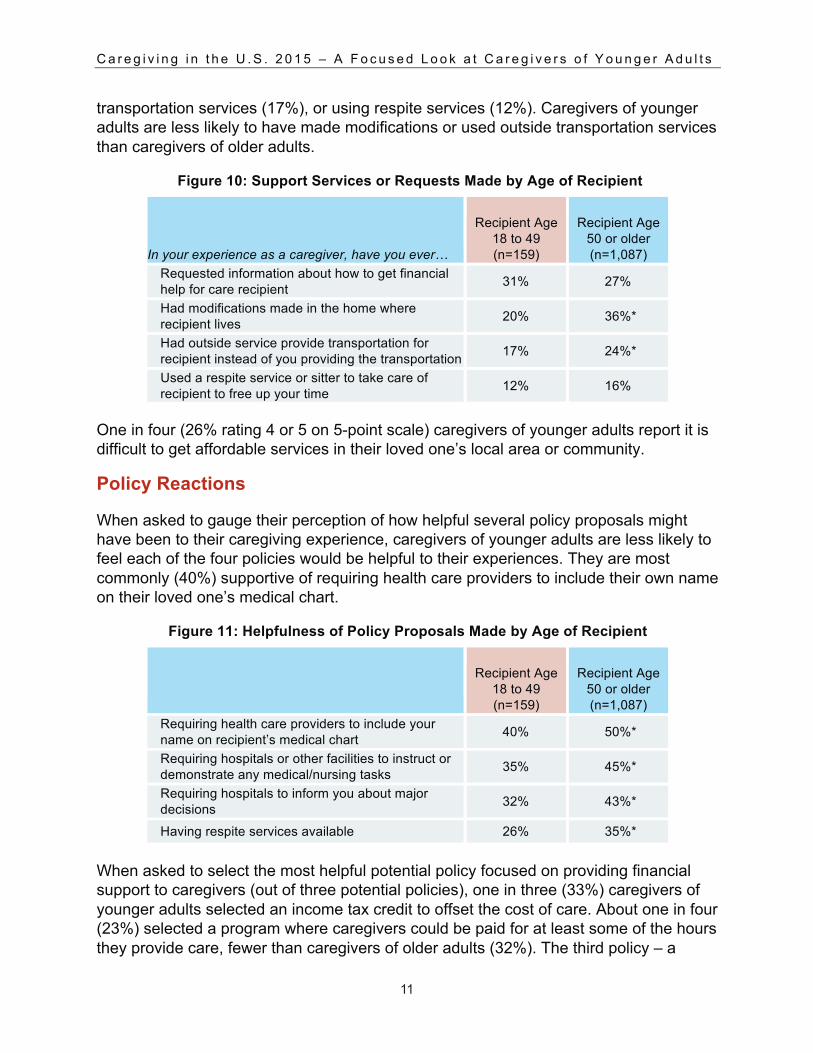
transportation services (17%), or using respite services (12%). Caregivers of younger adults are less likely to have made modifications or used outside transportation services than caregivers of older adults.
Figure 10: Support Services or Requests Made by Age of Recipient
In your experience as a caregiver, have you ever…
Recipient Age 18 to 49 (n=159)
Recipient Age 50 or older (n=1,087)
Requested information about how to get financial help for care recipient 31% 27%
Had modifications made in the home where recipient lives 20% 36%*
Had outside service provide transportation for recipient instead of you providing the transportation 17% 24%*
Used a respite service or sitter to take care of recipient to free up your time 12% 16%
One in four (26% rating 4 or 5 on 5-point scale) caregivers of younger adults report it is difficult to get affordable services in their loved one’s local area or community.
Policy Reactions
When asked to gauge their perception of how helpful several policy proposals might have been to their caregiving experience, caregivers of younger adults are less likely to feel each of the four policies would be helpful to their experiences. They are most commonly (40%) supportive of requiring health care providers to include their own name on their loved one’s medical chart.
Figure 11: Helpfulness of Policy Proposals Made by Age of Recipient
Recipient Age 18 to 49 (n=159)
Recipient Age 50 or older (n=1,087)
Requiring health care providers to include your name on recipient’s medical chart 40% 50%*
Requiring hospitals or other facilities to instruct or demonstrate any medical/nursing tasks 35% 45%*
Requiring hospitals to inform you about major decisions 32% 43%*
Having respite services available 26% 35%*
When asked to select the most helpful potential policy focused on providing financial support to caregivers (out of three potential policies), one in three (33%) caregivers of younger adults selected an income tax credit to offset the cost of care. About one in four (23%) selected a program where caregivers could be paid for at least some of the hours they provide care, fewer than caregivers of older adults (32%). The third policy – a
12
C a r e g i v i n g i n t h e U . S . 2 0 1 5 – A F o c u s e d L o o k a t C a r e g i v e r s o f Y o u n g e r A d u l t s
14
partially paid leave of absence from work for employed caregivers – was deemed helpful by just 13% of caregivers of younger adults.
About seven in 10 caregivers of younger adults are in favor of banning workplace discrimination against workers who have caregiving responsibilities (69%).
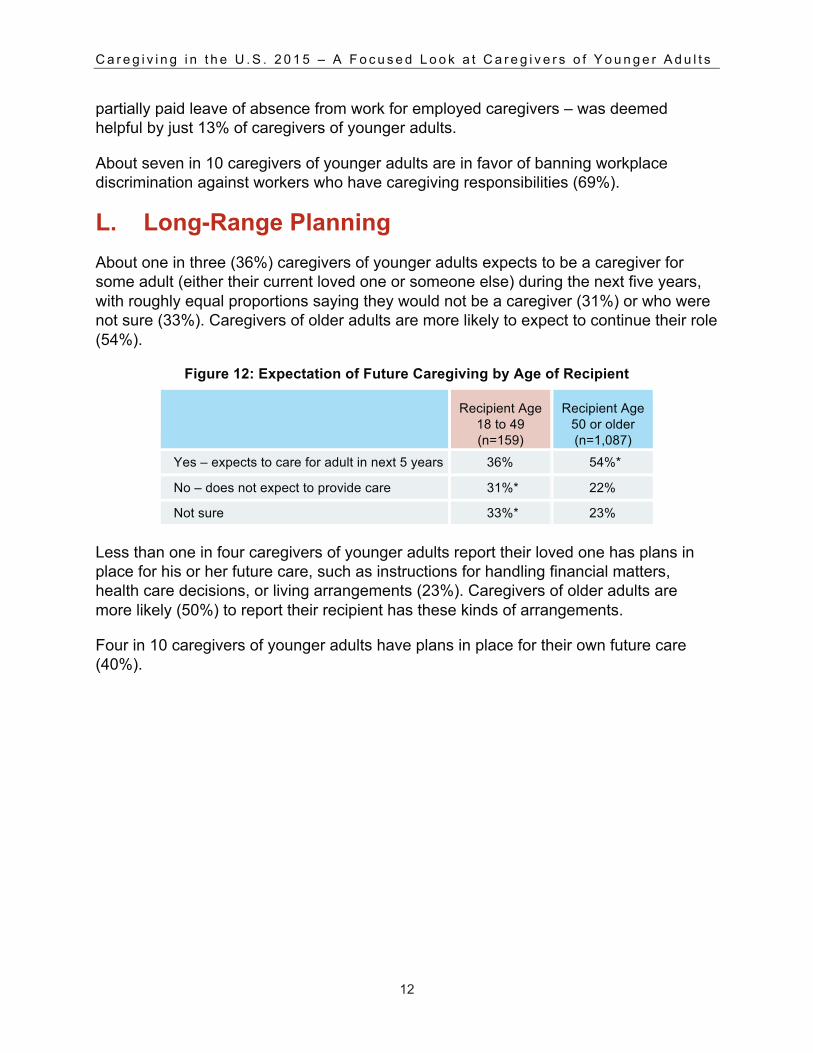
L. Long-Range Planning About one in three (36%) caregivers of younger adults expects to be a caregiver for some adult (either their current loved one or someone else) during the next five years, with roughly equal proportions saying they would not be a caregiver (31%) or who were not sure (33%). Caregivers of older adults are more likely to expect to continue their role (54%).
Figure 12: Expectation of Future Caregiving by Age of Recipient
Recipient Age 18 to 49 (n=159)
Recipient Age 50 or older (n=1,087)
Yes – expects to care for adult in next 5 years 36% 54%*
No – does not expect to provide care 31%* 22%
Not sure 33%* 23%
Less than one in four caregivers of younger adults report their loved one has plans in place for his or her future care, such as instructions for handling financial matters, health care decisions, or living arrangements (23%). Caregivers of older adults are more likely (50%) to report their recipient has these kinds of arrangements.
Four in 10 caregivers of younger adults have plans in place for their own future care (40%).

13
C a r e g i v i n g i n t h e U . S . 2 0 1 5 – A F o c u s e d L o o k a t C a r e g i v e r s o f Y o u n g e r A d u l t s
15
M. Respondent Profile Six in 10 caregivers of younger adults are female and they are 42.8 years old, on average – younger than caregivers of older adults. About six in 10 are white, and 22% are Hispanic. Four in 10 have a high school education or less (43%), which is higher than the number who have a college degree (24%).
Figure 13: Demographic Summary by Care Recipient Age
Recipient Age
18 to 49 (n=159)
Recipient Age 50 or older (n=1,087)
Caregiver Gender Male 39% 40% Female 61 60 Age of Caregiver 18 to 34 40%* 21%
35 to 49 22 24
50 to 64 26 35*
65 to 74 7 12*
75 or older 5 8
Mean age 42.8 50.3* Race/Ethnicity of Caregiver White 59% 62%
African American 12 13
Hispanic 22 16
Asian American10 3 7*
Other 4 2
Caregiver Education
Less than high school 13%* 7%
High school graduate 29 28
Some college 25 21
Technical school 8 7
College graduate 16 20
Graduate school 8 16* Note: Letters in superscript indicate a figure is significantly higher than the figure in the column indicated.
10 Asian American is inclusive of those caregivers who are of Asian origin, background, or descent, including the regions of the Indian subcontinent, Far East, Southeast Asia, or Pacific Islands.

14
C a r e g i v i n g i n t h e U . S . 2 0 1 5 – A F o c u s e d L o o k a t C a r e g i v e r s o f Y o u n g e r A d u l t s
16
Caregivers of younger adults have a median household income of $53,900, comparable to $53,046 for the United States overall.11 Most are married or living with a partner, and 33% have a child or grandchild under the age of 18 living in their household.
Profile of Respondents (continued)
Recipient Age 18 to 49 (n=159)
Recipient Age 50 or older (n=1,087)
Caregiver Marital Status Married 57% 57% Living with a partner 13* 7
Widowed 6 5 Separated 1 2 Divorced 5 8 Single, never married 17 20
Caregiver Household Income Less than $50,000 (net) 47% 46%
Less than $15,000 13 12
$15,000 to $29,999 18 16
$30,000 to $49,999 16 19
$50,000 or more (net) 53 54
$50,000 to $74,999 16 18
$75,000 to $99,999 15 13
$100,000 or more 21 23
Median Household Income $53,900 $55,000 Children/Grandchildren in Caregiver’s Household Yes 33% 28% No 67 71
Note: Letters in superscript indicate a figure is significantly higher than the figure in the column indicated.
11 U.S. Census Bureau, American Community Survey, 2013.

15
C a r e g i v i n g i n t h e U . S . 2 0 1 5 – A F o c u s e d L o o k a t C a r e g i v e r s o f Y o u n g e r A d u l t s
17
About two in three caregivers of younger adults are employed, and most live in an urban or suburban setting. Fourteen percent have served in the armed forces, and just 3% report their care recipient has served, fewer than caregivers of older adults. Eight percent self-identify as lesbian, gay, bisexual, or transgender (LGBT).12
Profile of Respondents (continued)
Recipient Age 18 to 49 (n=159)
Recipient Age 50 or older (n=1,087)
Care Recipient Living Location Urban/Suburban 71% 71% Rural 28 28 Caregiver Living Location Urban/Suburban 81% 85% Rural 19 15 Caregiver Employment Status
Employed in past year while caregiving 65% 59%
Not employed 35 41
Caregiver Service in Armed Forces
Served on active duty 14% 10%
Did not ever serve 85 89
Care Recipient Service in Armed Forces
Served on active duty 3% 15%*
Did not ever serve 94* 83
Caregiver LGBT status
Yes 8% 9%
No 92 91 Note: Letters in superscript indicate a figure is significantly higher than the figure in the column indicated.
12 6.9% of all screened respondents in Caregiving in the U.S. 2015 self-identify as LGBT. In addition, we find that caregiving for an adult is more common among those who identify as LGBT (20.4% vs. 16.5% not identifying as LGBT). Nationally, Gallup estimates 5.6% of Americans are LGBT. Gates, G.J. (October 2014) “LGBT Demographics: Comparisons among population based surveys,” The Williams Institute.

This report was made possible with generous sponsorship from
About the National Alliance for Caregiving
Established in 1996, the National Alliance for Caregiving is a non-profit coalition of national organizations focusing on advancing family caregiving through research, innovation, and advocacy. The Alliance conducts research, does policy analysis, develops national best-practice programs, and works to increase public awareness of family caregiving issues. Recognizing that family caregivers provide important societal and financial contributions toward maintaining the well-being of those they care for, the Alliance supports a network of 80+ state and local caregiving coalitions and serves as Secretariat for the International Alliance of Carer Organizations. Learn more at www.caregiving.org.
About AARP
AARP is a nonprofit, nonpartisan organization, with a membership of nearly 38 million, that helps people turn their goals and dreams into real possibilities, strengthens communities and fights for the issues that matter most to families such as healthcare, employment and income security, retirement planning, affordable utilities and protection from financial abuse. We advocate for individuals in the marketplace by selecting products and services of high quality and value to carry the AARP name as well as help our members obtain discounts on a wide range of products, travel, and services. A trusted source for lifestyle tips, news and educational information, AARP produces AARP The Magazine, the world's largest circulation magazine; AARP Bulletin; www.aarp.org; AARP TV & Radio; AARP Books; and AARP en Español, a Spanish-language website addressing the interests and needs of Hispanics. AARP does not endorse candidates for public office or make contributions to political campaigns or candidates. The AARP Foundation is an affiliated charity that provides security, protection, and empowerment to older persons in need with support from thousands of volunteers, donors, and sponsors. AARP has staffed offices in all 50 states, the District of Columbia, Puerto Rico, and the U.S. Virgin Islands. Learn more at www.aarp.org.