A flexural isostasy model for the Pleistocene evolution...
19
1 NORWEGIAN JOURNAL OF GEOLOGY Vol 97 Nr. 1 http://dx.doi.org/10.17850/njg97-1-01 Krzysztof Jan Zieba 1 , Kamaldeen Olakunle Omosanya 1 & Jochen Knies 2,3 1 Department of Geoscience and Petroleum, Norwegian University of Science and Technology (NTNU), NO–7491 Trondheim, Norway. 2 Geological Survey of Norway, Post Box 6315 Sluppen, NO–7491 Trondheim, Norway. 3 CAGE – Centre for Arctic Gas Hydrate, Environment and Climate; Department of Geology, University of Tromsø, NO–9037 Tromsø, Norway. E-mail corresponding author (Krzysztof Jan Zieba): [email protected] The topographic relief of the Barents Sea was subjected to major changes during the past 1.5 million years mostly due to sediment redistribution driven by glacial activity. This paper addresses the problem of Pleistocene bathymetric evolution of the southern Barents Sea using a numerical modelling approach that considers the influence of regional isostasy on relief development. The model presented in this work shows that most of the bathymetric features were initiated prior to the first documented, shelf-edge glaciations at around 1.5 Ma. During the Early Pleistocene (Calabrian), the Barents Sea shelf was close to sea level with some areas elevated to about 300 m. Most of the shelf experienced up to 200 m topography reduction during the Early to Middle Pleistocene (1.5–0.7 Ma) facilitating bifurcation of the North Atlantic waters into the Barents Sea. Later during the Middle Pleistocene–Present (0.7–0.0 Ma) the relief deepened by 0 to 250 m. Our results demonstrate that the present-day topography of the southern Barents Sea is the consequence of glacial activity influenced by a regional isostatic component, which is the result of selective trough erosion and significant sediment deposition at the Barents Sea margins during the Pleistocene. Keywords: bathymetry, topography, erosion, uplift, glaciations, isostasy, modelling, Pleistocene, Barents Sea, North Atlantic Current, Quaternary Received 30. May 2016 / Accepted 11. January 2017 / Published online 24. January 2017 A flexural isostasy model for the Pleistocene evolution of the Barents Sea bathymetry Introduction The Barents Sea has experienced a gradual change in topography since the intensification of the Northern Hemisphere glaciation at 2.7 million years ago. A subaerial to shallow marine relief was transformed into a contrasting bathymetry of deep troughs and relatively shallow banks observed at the present (Vorren et al., 1991; Andreassen et al., 2008; Laberg et al., 2010; Ruddiman, 2010). The topographic development of the Barents Sea during this period is often attributed to glacial carving and sediment transport driven by glacial activity (Vorren et al., 1989; Andreassen et al., 2004, 2007; Patton et al., 2015). Glacially related sediment redistribution resulted in isostatic readjustments of the lithosphere that contributed to 1–2 km of Cenozoic uplift (Nyland et al., 1992; Rasmussen & Fjeldskaar, 1996; Green & Duddy, 2010; Zattin et al., 2016). The first efforts to investigate the problem of the Pleistocene bathymetry date back to the work of Nansen (1904). Mostly based on the present-day bathymetry and onshore observations, Nansen (1904) suggested a subaerially exposed shelf prior to the Pleistocene glaciations. The evolution of the Pleistocene bathymetry was revisited later in the 1990s and early 2000s, thanks to new geophysical data providing information about the sediment volumes eroded from the shelf and deposited Zieba, K.J., Omosanya, K.O. & Knies, J. 2017: A flexural isostasy model for the Pleistocene evolution of the Barents Sea bathymetry. Norwegian Journal of Geology 97, 1–19. http://dx.doi.org/10.17850/njg97-1-01. © Copyright the authors. This work is licensed under a Creative Commons Attribution 4.0 International License.
Transcript of A flexural isostasy model for the Pleistocene evolution...

1
NORWEGIAN JOURNAL OF GEOLOGY Vol 97 Nr. 1
http://dx.doi.org/10.17850/njg97-1-01
Krzysztof Jan Zieba1, Kamaldeen Olakunle Omosanya1 & Jochen Knies2,3
1Department of Geoscience and Petroleum, Norwegian University of Science and Technology (NTNU), NO–7491 Trondheim, Norway.2Geological Survey of Norway, Post Box 6315 Sluppen, NO–7491 Trondheim, Norway.3CAGE – Centre for Arctic Gas Hydrate, Environment and Climate; Department of Geology, University of Tromsø, NO–9037 Tromsø, Norway.
E-mail corresponding author (Krzysztof Jan Zieba): [email protected]
The topographic relief of the Barents Sea was subjected to major changes during the past 1.5 million years mostly due to sediment redistribution driven by glacial activity. This paper addresses the problem of Pleistocene bathymetric evolution of the southern Barents Sea using a numerical modelling approach that considers the influence of regional isostasy on relief development. The model presented in this work shows that most of the bathymetric features were initiated prior to the first documented, shelf-edge glaciations at around 1.5 Ma. During the Early Pleistocene (Calabrian), the Barents Sea shelf was close to sea level with some areas elevated to about 300 m. Most of the shelf experienced up to 200 m topography reduction during the Early to Middle Pleistocene (1.5–0.7 Ma) facilitating bifurcation of the North Atlantic waters into the Barents Sea. Later during the Middle Pleistocene–Present (0.7–0.0 Ma) the relief deepened by 0 to 250 m. Our results demonstrate that the present-day topography of the southern Barents Sea is the consequence of glacial activity influenced by a regional isostatic component, which is the result of selective trough erosion and significant sediment deposition at the Barents Sea margins during the Pleistocene.
Keywords: bathymetry, topography, erosion, uplift, glaciations, isostasy, modelling, Pleistocene, Barents Sea, North Atlantic Current, Quaternary
Received 30. May 2016 / Accepted 11. January 2017 / Published online 24. January 2017
A flexural isostasy model for the Pleistocene evolution of the Barents Sea bathymetry
Introduction
The Barents Sea has experienced a gradual change in topography since the intensification of the Northern Hemisphere glaciation at 2.7 million years ago. A subaerial to shallow marine relief was transformed into a contrasting bathymetry of deep troughs and relatively shallow banks observed at the present (Vorren et al., 1991; Andreassen et al., 2008; Laberg et al., 2010; Ruddiman, 2010). The topographic development of the Barents Sea during this period is often attributed to glacial carving and sediment transport driven by glacial activity (Vorren et al., 1989; Andreassen et al., 2004, 2007; Patton et al., 2015). Glacially related sediment
redistribution resulted in isostatic readjustments of the lithosphere that contributed to 1–2 km of Cenozoic uplift (Nyland et al., 1992; Rasmussen & Fjeldskaar, 1996; Green & Duddy, 2010; Zattin et al., 2016).
The first efforts to investigate the problem of the Pleistocene bathymetry date back to the work of Nansen (1904). Mostly based on the present-day bathymetry and onshore observations, Nansen (1904) suggested a subaerially exposed shelf prior to the Pleistocene glaciations. The evolution of the Pleistocene bathymetry was revisited later in the 1990s and early 2000s, thanks to new geophysical data providing information about the sediment volumes eroded from the shelf and deposited
Zieba, K.J., Omosanya, K.O. & Knies, J. 2017: A flexural isostasy model for the Pleistocene evolution of the Barents Sea bathymetry. Norwegian Journal of Geology 97, 1–19. http://dx.doi.org/10.17850/njg97-1-01.
© Copyright the authors.This work is licensed under a Creative Commons Attribution 4.0 International License.

BB
SVB
TB
BRFC LH
HFB
BP
FP
PSP
SR
NKB
HRB
VH
Bjørnøya Trough
Ingøydjupet
Scandinavia
Bjørnøya
Spitsbergenbanken
Tromsøflaket
Nordkappbanken
Murmanskbanken
Sentralbanken
RLFC Djuprenna
MB
FsBVvpSH
Håkjerringdjupet
topo
grap
hy/b
athy
met
ry [
m]
7216/11-1S
0 50 km
K.J.Zieba et al.2
as the Bjørnøya (Bear Island) and Storfjorden trough mouth fans (Vorren et al., 1991; Knutsen et al., 1992; Rasmussen & Fjeldskaar, 1996; Dimakis et al., 1998; Elverhøi et al., 1998; Butt et al., 2002). For example, Rasmussen & Fjeldskaar (1996) proposed a first numerical model of preglacial topography of the Barents Sea. Additionally, Dimakis et al. (1998) and Butt et al. (2002) provided further topography reconstructions of the Barents Sea prior to and after the intensification of the Northern Hemisphere glaciation. All the available models however lack information about the development of bathymetric features and discussion on the impact of regional isostasy on topographic development.
This paper presents a numerical approach explaining the evolution of the Pleistocene topographic relief in the southern Barents Sea (Fig. 1) affected by substantial glacigenic sediment redistribution. This is achieved by a modelling of the flexural isostasy (Vening-Meinesz, 1941). The model uses the revisited Pleistocene erosion and deposition maps (Laberg et al., 2012) and chronostratigraphy (Knies et al., 2009; Laberg et al., 2010), as well as incorporating the effects of the global sea-level change (Boer et al., 2014). We aim to provide a first approximation of the geometry and water depth changes along the western continental margin that affected the maximum extent of the ice sheet (Stokes et al., 2015) as well as northward heat and salt transport through advection of warm North Atlantic waters
(Hurdle, 1986). One of the key objectives of the modelling is to understand to what degree the topography has been influenced by the regional isostatic adjustments to glacial erosion and deposition. In addition, we aim to provide new arguments in the discussion of tectonic vs. isostatic contributions to the Barents Sea uplift (Nyland et al., 1992; Doré, 1995; Doré & Jensen, 1996; Rasmussen & Fjeldskaar, 1996; Cavanagh et al., 2006; Henriksen et al., 2011).
Cenozoic evolution of the southern Barents Sea
The evolution of the southwestern Barents Sea was dominated by Devonian to Cenozoic tectonic events related to rifting in the northern Atlantic. Those events generated a complex geological setting with deep basins, platforms, highs and the associated deposition and erosion history (Gabrielsen, 1984; Doré, 1991; Ritzmann & Faleide, 2007; Faleide et al., 2008; Omosanya et al., 2015; Mattos et al., 2016). The sedimentary succession of the southeastern Barents Sea basins does not show evidence of any large extensional movements being located on the stable continental platform since the Late Palaeozoic (Faleide et al., 1993; Ebbing et al., 2007; Klitzke et al., 2015).
Figure 1. Present-day bathymetry of the study area including names of discussed geomorphological features and structural elements (Etopo5 model, http://www.ngdc.noaa.gov/mgg/global/etopo5.html). Orange line shows location of the seismic section shown in Fig. 4. Abbreviations: BB – Bjørnøya Basin, BP – Bjarmeland Platform, BRFC – Bjørnøyrenna Fault Complex, HFB – Hammerfest Basin, FsB – Fingerdjupet sub–basin, FP – Finnmark Platform, HRB – Harstad Basin, LH – Loppa High, MB – Maud Basin, NKB – Nordkapp Basin, PSP – Polheim Subplat-form, RLFC – Ringvassøy–Loppa Fault Complex, SH – Stappen High, SR – Senja Ridge, SVB – Sørvestsnaget Basin, TB – Tromsø Basin, VH – Veslemøy High, Vvp – Vestbakken volcanic province.

NORWEGIAN JOURNAL OF GEOLOGY A flexural isostasy model for the Pleistocene evolution of the Barents Sea bathymetry 3
al., 2013; Zattin et al., 2016). Apatite fission track data suggest that uplift started during the Late Miocene–Early Pliocene, between 10 and 5 Ma (Green & Duddy, 2010; Zattin et al., 2016). An elevated subaerial Barents shelf is thought to have prevailed until ~1.6–1.0 Ma and developed further into a submarine–subglacial relief at approximately 1.0 Ma (Dimakis et al., 1998; Butt et al., 2002).
The Barents Sea comprised a passive, glaciated, continental margin during the Pleistocene (Vorren et al., 1989) with the first shelf-edge glaciation occurring approximately 1.5 million years ago (Knies et al., 2009; Laberg et al., 2010). The youngest glacial history (post–Saalian, <0.14 Ma) is relatively well constrained, but little is known about glaciations prior to the Saalian (Svendsen et al., 2004; Knies et al., 2009; Ingólfsson & Landvik, 2013; Patton et al., 2015). Glacial carving led to sediment redistribution over the shelf–continental slope area and left a significant imprint on the Barents Sea shelf in the form of deep troughs and relatively shallow banks. Most of the sediment eroded from the southern Barents Sea shelf by glacial and earlier proglacial processes was deposited on the outer western shelf and on the continental slope as the Bjørnøya Trough Mouth Fan developed at the mouth of the Bjørnøya Trough (Vorren & Laberg, 1997; Laberg et al., 2012).
Method and data
Flexural isostasy modelling
Sediment redistribution would usually result in isostatic adjustments of the effectively elastic lithosphere, which is here considered as a flat structure fixed at its sides underlain by inviscid fluid mantle. Erosion would be compensated for the loss of sediment weight by isostatic uplift while deposition will cause downwarping (subsidence) of the elastic lithospheric plate (Turcotte & Schubert, 2002). The importance of this effect is examined numerically in the case of the southern
The Cenozoic structural development of the southwestern Barents Sea is related to Early Cenozoic rifting and development of a sheared margin in the west, continental breakup and subsequent opening of the Norwegian–Greenland Sea (Faleide et al., 2008). Continental breakup and related thermal activity might have resulted in uplift and erosion of the central–eastern Barents Sea (Faleide et al., 1993; Green & Duddy, 2010). During the Late Paleocene, marine conditions were established in the western Barents Sea and persisted throughout the Eocene resulting in substantial deposition of sediments on the Barents Sea shelf (Wood et al., 1989; Gabrielsen et al., 1990; Vorren et al., 1991; Riis, 1996; Ryseth et al., 2003; Faleide et al., 2008; Japsen et al., 2014). A major reorganisation in plate motion took place at the Eocene–Oligocene boundary (Lundin & Doré, 2002; Faleide et al., 2008; Japsen et al., 2014). During the Oligocene and Miocene, several phases of compression and basin inversion occurred as a result of plate-tectonic movements in the northeastern Atlantic. A main phase of uplift and erosion affecting wide areas of the Arctic regions occurred during the Eocene–Oligocene transition (Faleide et al., 1993; Green & Duddy, 2010; Japsen et al., 2014). The uplift might have been caused by changes in plate motion or a thermal process and resulting flexure (Rasmussen & Fjeldskaar, 1996; Dimakis et al., 1998; Japsen et al., 2014). From the Oligocene, the Barents shelf became tectonically stable (Faleide et al., 1993; Clark et al., 2014). The depositional setting during the Oligocene–Middle Miocene is uncertain but isostatic modelling suggests largely marine conditions in the Barents Sea at this time (Rasmussen & Fjeldskaar, 1996).
Miocene–Pliocene uplift and erosion affected large areas of the Arctic including the Barents Sea (Faleide et al., 2008; Anell et al., 2009; Japsen et al., 2014). This event might have been related to a change of the stress field in the northeastern Atlantic from extension to mild compression, as documented in the southern North Sea and Norwegian Sea, and/or thermal, lithospheric-scale anomalies with resulting elevation of the lithosphere–asthenosphere boundary (Doré et al., 1999; Eidvin et
Figure 2. Restoration of topographic relief at onset of sediment redistribution of the green unit — a simplified scheme. (A) Initial bathymetry and sediment setting. (B) Sediment backstripping (green dashed line) and adjustment of eustatic sea level to the level at the onset of sediment redistribution. (C) Calculation of the isostatic response to sediment backstripping (black arrows) and sea-level change (blue arrows). Adjust-ment of the topographic relief to the isostasy.

K.J.Zieba et al.4
Barents Sea by moving back the sediments to their original depositional areas and calculating the flexure of the lithosphere. Palaeo-relief was modelled backward in time by adjusting the initial relief, i.e., adjusting the base topography to the magnitude of the elastic response (Fig. 2).
The reconstruction of the palaeo-relief is provided for two time slices: 1) the Early Pleistocene (Calabrian, 1.5 Ma) and 2) the Middle Pleistocene (0.7 Ma). The initial relief (the base topography) for the reconstruction at 0.7 Ma is the present-day relief, while for the reconstruction at 1.50 Ma the modelled relief at 0.7 Ma is used as the initial one. The relaxation time for the isostatic response in the Scandinavian region is usually estimated as a few thousand years (Fjeldskaar, 1997; Berg et al., 2008). Therefore, it is reasonable to assume that the isostatic equilibrium was achieved during sediment redistribution events that lasted for 0.1–1 Myr. Flexure calculations were performed using the Matlab script of Cardozo (2009). The elastic calculations were performed on a 10 km grid resolution. The present-day elevation model ETOPO5 of 5–minute latitude/longitude grid was used. Parameters used in the modelling are listed in Table 1.
Input data
The only available sediment redistribution model covering the entire ice ages in the Barents Sea is a model of Laberg et al. (2012) used in this study as the modelling input. The model provides averaged erosion values for the drainage area of the Bjørnøya Trough. The model was built by using a mass-balance approach where volumes
of redeposited glacial sediments are compared with their drainage area and the thickness of the eroded sequence is calculated accordingly. A combination of structure–contour map of the upper regional unconformity, present-day bathymetry and total area of the troughs occupied by ice streams was used for evaluating the sediment drainage area (Vorren et al., 1991; Laberg et al., 2012). Volumes of redistributed glacial deposits were estimated based on the seismic interpretation of the internal structure of the Bjørnøya Trough Mouth Fan. The model assumptions include: 1) the catchment area was homogeneous throughout the Pleistocene, 2) the compaction level of accumulated erosional products is the same as the compaction level of the source rocks, 3) sediment deposition is not considered in the drainage area and erosion is not considered in the depositional area during both glaciations and interglacial periods.
Erosion and deposition values were interpolated from the maps of Laberg et al. (2012) by using a nearest-neighbour interpolation, smoothed by a 30 km–width filter that was applied 3 times (Fig. 3). In order to avoid sharp contrasts in input data that can disturb the isostatic response, the interpolation was extended over the area outside the Bjørnøya Trough catchment where erosion values were not available (interpolated from given values at the drainage boundary to zero). The area where erosion estimates are not available is masked as shown in Fig. 3. A model of the topographic relief of northernmost Scandinavia is also provided along with the reconstructions of the southern Barents Sea. The data and grid resolution used here, however, are too sparse for a detailed and reliable reconstruction. The topographic model of onshore Scandinavia, which is not the main focus of this paper, should therefore be treated only as a first approximation.
The erosion/deposition estimates are provided for two time–periods constrained by ages of seismic reflectors R5 and R1. The age of reflector R5, that often marks the onset of glaciations in the southern Barents Sea, is dated at ~1.5 Ma (Knies et al., 2009; Mattingsdal et al., 2014). Reflector R1 (here R7, see Table 2) is dated at ~700–200 ka (Sættem et al., 1992; Elverhøi et al., 1998; Andreassen et al., 2007; Laberg et al., 2010). Here, the oldest age of R1 is used so that the erosion/deposition estimates are
Table 1. Modelling parameters.
Parameter Value
Effective elastic thickness of the lithosphere 20 km
Young Modulus 1.0311 Pa
Poisson's ratio 0.25
Sediment density 2200 kg/m3
Water density 1025 kg/m3
Mantle density 3300 kg/m3
Table 2. Seismic character and ages of some of the interpreted seismic horizons as compared to some previous work in the Barents Sea.
Reflector (This study) Knies et al. (2009) Yermak Plateau
Seismic ODP 986 ODP 911Omosanya et al.
(2016) /Ryseth et al. (2003)
R4(High-amplitude and continuous trough)
R7(2.3 to 2.5 Ma) >2.7 Ma Sandy, silty clay, no
clasts (Unit IVa & IVb)
Silty clay with clayey silt, with few drop-
stones (Unit Ib)
Pliocene 1 (5.3 Ma) Flat to descending
clinoforms
R5(High-amplitude and
continuous peak)
R5(1.3 to 1.5 Ma) <2.7 Ma
Silty clay with variable amount of clasts, i.e., debris flow (Unit II) Silty clay and clayey
silt, with numerous dropstones (Unit Ia)
Pliocene 2 High-angle ascending
clinoforms
R7(High-amplitude and continuous trough)
R1(~0.2 Ma) <2.7 Ma
Silty clay with clasts and dropstones
(Unit I)
Pliocene 3 (2.6 Ma) Low-angle ascending
clinoforms
-400
-300 -200
-100
0200
400
600
800
0
B)
0
-200-100
-300
500
1000
1500
0
A)
Late Weichselian ice sheet flow lines(Andreassenet al. 2007)
Deposition/erosion thickness [m]~0.7 - 0.0 Ma
Deposition/erosion thickness [m]~1.5 - 0.7 Ma
0 50 km
0 50 km
NORWEGIAN JOURNAL OF GEOLOGY A flexural isostasy model for the Pleistocene evolution of the Barents Sea bathymetry 5
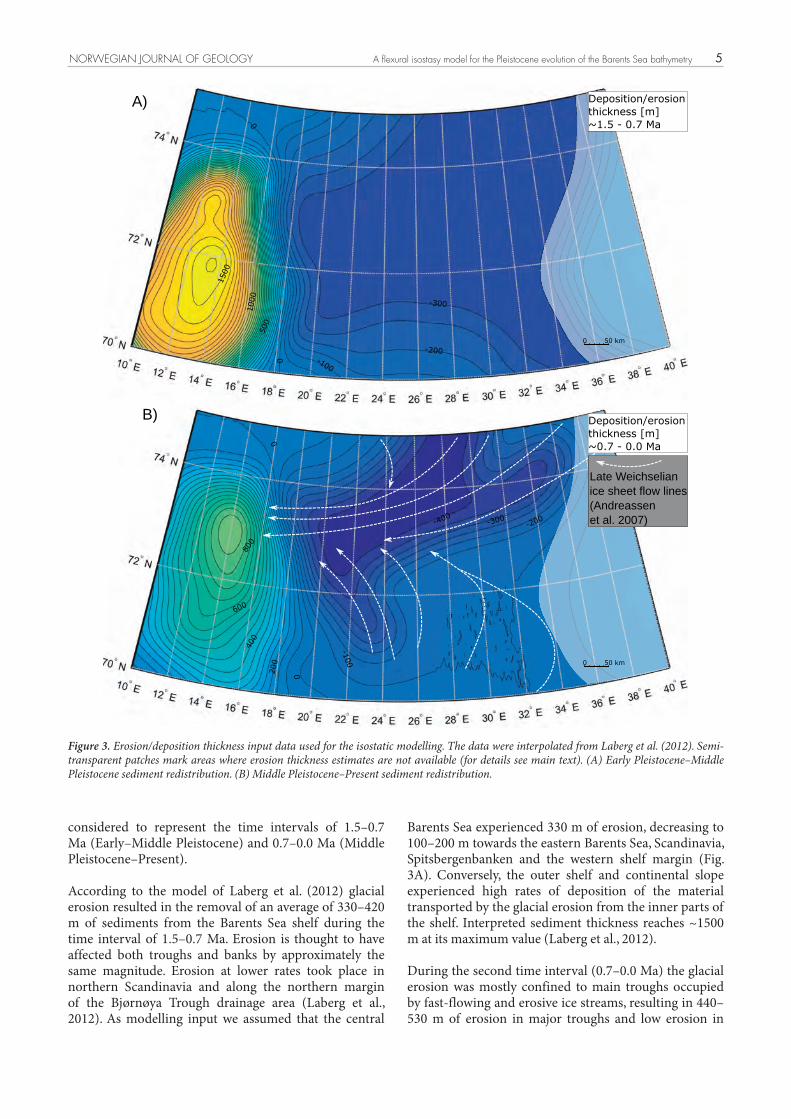
Barents Sea experienced 330 m of erosion, decreasing to 100–200 m towards the eastern Barents Sea, Scandinavia, Spitsbergenbanken and the western shelf margin (Fig. 3A). Conversely, the outer shelf and continental slope experienced high rates of deposition of the material transported by the glacial erosion from the inner parts of the shelf. Interpreted sediment thickness reaches ~1500 m at its maximum value (Laberg et al., 2012).
During the second time interval (0.7–0.0 Ma) the glacial erosion was mostly confined to main troughs occupied by fast-flowing and erosive ice streams, resulting in 440–530 m of erosion in major troughs and low erosion in
considered to represent the time intervals of 1.5–0.7 Ma (Early–Middle Pleistocene) and 0.7–0.0 Ma (Middle Pleistocene–Present).
According to the model of Laberg et al. (2012) glacial erosion resulted in the removal of an average of 330–420 m of sediments from the Barents Sea shelf during the time interval of 1.5–0.7 Ma. Erosion is thought to have affected both troughs and banks by approximately the same magnitude. Erosion at lower rates took place in northern Scandinavia and along the northern margin of the Bjørnøya Trough drainage area (Laberg et al., 2012). As modelling input we assumed that the central
Figure 3. Erosion/deposition thickness input data used for the isostatic modelling. The data were interpolated from Laberg et al. (2012). Semi-transparent patches mark areas where erosion thickness estimates are not available (for details see main text). (A) Early Pleistocene–Middle Pleistocene sediment redistribution. (B) Middle Pleistocene–Present sediment redistribution.

K.J.Zieba et al.6
the banks (Andreassen et al., 2004; Laberg et al., 2012). For the modelling input, we set the maximum erosion thickness to be 440 m in the Bjørnøya and Ingøydjupet troughs (Fig. 3B). Bank erosion is conceptually set as 100 m increasing towards the troughs. Deposition values in the outer shelf and continental slope increase towards the depocentre, reaching ~800 m at its maximum (Laberg et al., 2012).
The modelling approach presented here takes into consideration the weight of removed or added water due to variations of the eustatic sea-level changes. The values of the sea level relative to the present (Boer et al., 2014) are as follows: Early Pleistocene (1.50 Ma) sea level: –50.2 m, Middle Pleistocene (0.7 Ma) sea level: –22.2 m.
Seismic data
The seismic data used to complement this research are in a post-stack, time-migrated, 3D seismic cube acquired in 1998. The NH9803 cube has a bin spacing of 12.5 m and is located on the axial to western part of the Sørvestsnaget Basin. The cube was used for this research as it runs through wellbore 7216/11–1S in which some biostratigraphic and palaeomagnetic dating have been previously done (e.g., Ryseth et al., 2003; Knies et al.,
2009). With a P-wave velocity of approximately 2100 m/s and a dominant frequency of 40 Hz, the vertical seismic resolution for the reflectors corresponding to the intervals intersected by the borehole is 13 m. Horizontal resolution of the data is equivalent to the bin size. The seismic data are displayed in the Society for Exploration Geophysicists (SEG) normal polarity convention. An increase in acoustic impedance with depth is a positive reflection or peak. Peaks are black reflections on seismic sections. The red reflections are troughs or negative reflections while the white reflections represent the zero–crossings. Furthermore, check-shot information from wellbore 7216/11–1S was used to tie the seismic to well data and define the ages of the interpreted seismic horizons. There seems to be some disparity in the ages assigned to the horizons above the Miocene. Authors such as Ryseth et al. (2003) and Omosanya et al. (2016) relied only on biostratigraphic data to define the ages of the units above the Miocene reflector whereas Butt et al. (2000), Hjelstuen et al. (2007) and Knies et al. (2009) used a combination of palaeomagnetic and biostratigraphic data. Hence, this study has relied on the most common ages used for the Pliocene to Pleistocene reflectors (Table 2). In addition, the shelf-edge position defined by Omosanya et al. (2016) was used to compare some of the results from the present study to see how the model fits with their seismic interpretation.
Figure 4. NW to SE seismic section through the Sørvestsnaget Basin. The horizons of interest for this study are R4 to R8. Three Pliocene packa-ges are defined and the position of the shelf edge was identified by mapping the trajectory of shelf-edge clinoforms within them. R1 to R4 repre-sent sediments of Eocene to Miocene ages while the underlying sediments are older and are severely faulted, with several normal faults forming graben and horst structures. For location see Fig. 1.

0 50 km
0 50 km
NORWEGIAN JOURNAL OF GEOLOGY A flexural isostasy model for the Pleistocene evolution of the Barents Sea bathymetry 7
Results
Isostatic readjustments of the lithosphere
The Early Pleistocene (Calabrian) to Middle Pleistocene sediment redistribution (Fig. 3A) and sea-level change was modelled to result in significant isostatic readjustments in the southern Barents Sea (Fig. 5A). The shelf area was largely uplifted between the Early Pleistocene (1.5 Ma), representing the onset of glaciations in the southern Barents Sea sensu Laberg et al. (2010) and Mattingsdal et al. (2014), and the Middle Pleistocene (0.7 Ma). The magnitude of uplift in the shelf area was modelled as being relatively uniform, i.e., 150–200 m. The uplift values were modelled to decrease towards peripheral parts of the shelf. This is mostly related to lower erosion rates on Spitsbergenbanken and the eastern part of the study area (Fig. 3A). On the outer shelf and continental slope, high deposition rates resulted in a significant downwarping reaching up to 540 m at the depocentre (Fig. 5A).
The seismic character of the main horizons used in this study is shown in Table 2. Horizon R4 corresponds to the base of the Pliocene or Pliocene 1 of Omosanya et al. (2016) while horizon R5 represents Pliocene 2 (Omosanya et al., 2016). In addition, R7 corresponds to top Pliocene 3 of Omosanya et al. (2016) and the base of the Pleistocene of Ryseth et al. (2003). On seismic sections, the packages underlying all these three horizons are characterised by shelf-margin clinoforms that are more than 1 km in height and about 40 km in length (Fig. 4). Omosanya et al. (2016) considered the packages to have flat to descending clinoforms from R4 to R5, which changes to high-angle ascending clinoforms from R5 to R6 and to low-angle ascending clinoforms at the top i.e., R6 to R7. All previous data agree that the package above R7 is Pleistocene in age (Myhre et al., 1995; Butt et al., 2000; Ryseth et al., 2003; Geissler & Jokat, 2004; Hjelstuen et al., 2007; Knies et al., 2009; Mattingsdal et al., 2014; Omosanya et al., 2016).
Figure 5. (A) Modelled isostatic response to the Early Pleistocene–Middle Pleistocene sediment redistribution. (B) Modelled isostatic response to the Middle Pleistocene–Present sediment redistribution.

K.J.Zieba et al.8
The Middle Pleistocene–Present sediment redistribution (Fig. 3B) and sea-level change resulted in an isostatic uplift of up to 200 m in the shelf area (Fig. 5B). The maximum values follow the erosion trend along the Bjørnøya Trough (Fig. 3B). Outside the Bjørnøya Trough the uplift values decrease in all directions with almost no uplift or downwarping modelled in the areas close to the present-day shelf edge and in the easternmost part of the study area. These are areas where erosion thickness estimates were not available. Farther west, the stratigraphic units of the present-day outer shelf and continental slope were subjected to downwarping (Fig. 5B). The maximum value was modelled at about 280 m within the depocentre (Fig. 3B).
Topographic relief evolution
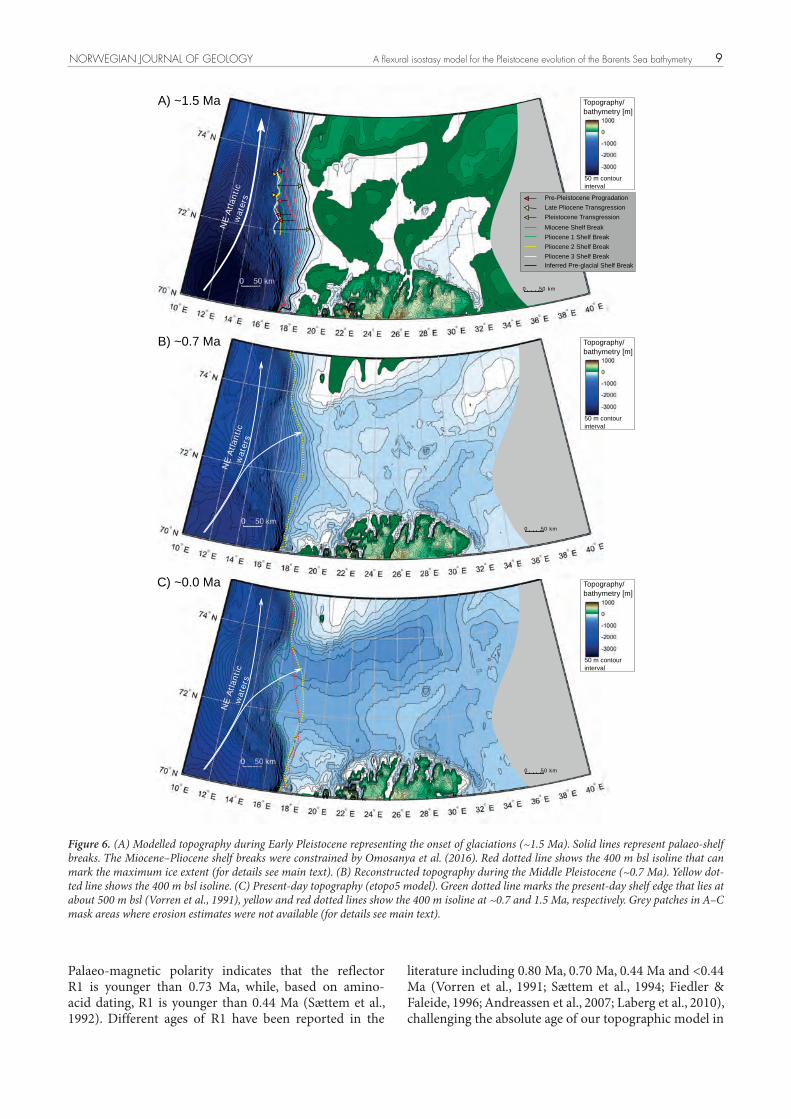
Early Pleistocene (1.5 Ma)During the Early Pleistocene the Barents Sea shelf was modelled as being close to the sea level (sea level about 50 m lower than at present). The deepest parts of the shelf were modelled at about 100–150 m bsl (metres below sea level) and the most elevated parts at about 300 m asl (metres above sea level, Fig. 6A). The shelf gently tilts towards the west to water depths of about 100–150 m. Below that depth the gradient significantly increases, reaching a maximum value of about 1850 m bsl. Between 100 and 1850 m bsl the gradient is modelled to be approximately 0.8°. Below that depth the gradient gradually decreases.
The deepest parts of the shelf were modelled in the present-day area of Djuprenna, Håkjerringdjupet and the western part of the present-day Bjørnøya Trough (Fig. 6A). The Bjørnøya Trough was modelled as a clear depression between today’s Spitsbergenbanken and a continuous area at the southern side of the trough (Fig. 6A). The areas elevated above the sea level represent the present-day Spitsbergenbanken including Bjørnøya, the southwestern part of Sentralbanken, the northern part of Murmanskbanken, Tromsøflaket, Nordkappbanken, an area on the southern side of the Bjørnøya Trough, as well as the northern parts of Scandinavia.
Middle Pleistocene (0.7 Ma)Most of the shelf bathymetry was modelled from about 100 to 200 bsl. The deepest parts were at 200–300 m bsl and the shallowest at about 200 m asl (Fig. 6B). Except for the areas west of the Spitsbergenbanken and Tromsøflaket, the seabed gently tilts to water depths of about 700–900 m. Below 700–900 m bsl the gradient steepens to about 1° and remains the same for an additional depth of 1000 m. Below 1700–1900 m bsl the slope becomes gentler again. The deepest parts of the shelf comprise today’s Djuprenna, Bjørnøya Trough, Håkjerringdjupet and an area southwest of Ingøydjupet. The bathymetric highs include Nordkappbanken, Tromsøflaket, Murmanskbanken and an area on the
southern side of the Bjørnøya Trough. The subaerial highs include Spitsbergenbanken, part of western Sentralbanken and northern Scandinavia (Fig. 6B).
Compared to the Early Pleistocene relief (Fig. 6A), the central Barents Sea shelf relief was deepened by about 150 m. This value decreases towards Scandinavia, Spitsbergenbanken, and to the eastern part of the study area. The highest deepening was modelled at the mouth of the Bjørnøya Trough and to the south of the trough including Tromsøflaket and the elevated area to the south of the Bjørnøya Trough. The outer shelf and continental slope relief was shallowed by up to about 1000 m in the thickest parts of the Bjørnøya Trough Mouth Fan (Fig. 3).
PresentThe present-day bathymetry comprises the troughs of Bjørnøya (up to 500 m bsl), Ingøydjupet, Djuprenna and Håkjerringdjupet (all up to 400 m bsl) and the banks of Spitsbergenbanken — with elevated areas above sea level such as Bjørnøya, Sentralbanken, Nordkappbanken, Murmanskbanken and Tromsøflaket. The present-day shelf edge lies at about 500 m bsl (Vorren et al., 1991) and clearly separates the relatively flat shelf and the steep continental slope. Below 500 m bsl, the slope gradient suddenly increases and remains approximately constant (about 1.1°) to about 1200 m bsl. Below that depth, the gradient becomes gentler again.
In the model, the area of Bjørnøya Trough and Ingøydjupet was deepened up to 260 m between the Middle Pleistocene and Present. The highest values are associated with the mouth of the Bjørnøya Trough. The elevation difference diminishes from the central parts of the troughs towards their margins. Outside the troughs the deepening of the relief was modelled as 40–60 m in Nordkappbanken, Murmanskbanken and Djuprenna, 0–100 m in Spitsbergenbanken, and 60–100 m in southwestern Sentralbanken. The present-day outer shelf and continental slope relief is modelled to be about 580 m shallower than during the Middle Pleistocene.
Discussion
Limitations and assumptions
Input dataThe model presented in this paper provides an insight on the topographic development and magnitude of the isostatic uplift in the southern Barents Sea during the Pleistocene by using the long-term (Pliocene–Pleistocene) erosion/deposition model of Laberg et al. (2012). The erosion/deposition estimates were split into two time–slices constrained by ages of seismic reflectors R5 and R1 (here R7, see Table 2) and the present (dated at 1.5 Ma, 0.7 Ma and 0.0 Ma respectively). These ages were used as time-points for topographic modelling.
NORWEGIAN JOURNAL OF GEOLOGY A flexural isostasy model for the Pleistocene evolution of the Barents Sea bathymetry 9
literature including 0.80 Ma, 0.70 Ma, 0.44 Ma and <0.44 Ma (Vorren et al., 1991; Sættem et al., 1994; Fiedler & Faleide, 1996; Andreassen et al., 2007; Laberg et al., 2010), challenging the absolute age of our topographic model in
Palaeo-magnetic polarity indicates that the reflector R1 is younger than 0.73 Ma, while, based on amino-acid dating, R1 is younger than 0.44 Ma (Sættem et al., 1992). Different ages of R1 have been reported in the
A) ~1.5 Ma
B) ~0.7 Ma
C) ~0.0 Ma
NE
Atla
ntic
wat
ers
NE
Atla
ntic
wat
ers
NE
Atla
ntic
wat
ers
Pleistocene Transgression
Pre-Pleistocene ProgradationLate Pliocene Transgression
Miocene Shelf BreakPliocene 1 Shelf BreakPliocene 2 Shelf BreakPliocene 3 Shelf BreakInferred Pre-glacial Shelf Break
50 m contour interval
Topography/bathymetry [m]
50 m contour interval
Topography/bathymetry [m]
50 m contour interval
Topography/bathymetry [m]
0 50 km
0 50 km
0 50 km
Figure 6. (A) Modelled topography during Early Pleistocene representing the onset of glaciations (~1.5 Ma). Solid lines represent palaeo-shelf breaks. The Miocene–Pliocene shelf breaks were constrained by Omosanya et al. (2016). Red dotted line shows the 400 m bsl isoline that can mark the maximum ice extent (for details see main text). (B) Reconstructed topography during the Middle Pleistocene (~0.7 Ma). Yellow dot-ted line shows the 400 m bsl isoline. (C) Present-day topography (etopo5 model). Green dotted line marks the present-day shelf edge that lies at about 500 m bsl (Vorren et al., 1991), yellow and red dotted lines show the 400 m isoline at ~0.7 and 1.5 Ma, respectively. Grey patches in A–C mask areas where erosion estimates were not available (for details see main text).

K.J.Zieba et al.10
The erosion/deposition model used here assumes that the Barents Sea shelf was subjected only to erosion, and no on-shelf deposition is considered to have occurred during the last 1.5 Myr. Pleistocene net erosion (balance between total erosion and deposition) would be diminished if some sediment deposition had occurred, probably leading to a drop of the isostatic uplift magnitude (Zieba et al., 2016). The well data indeed show that some glacial deposition took place during the Pleistocene. The glacigenic cover (Nordland Group) is usually about 50 m thick, thickening to the west and reaching 161 m in the location of exploration well 7219/8–1S (Norwegian Petroleum Directorate, http://factpages.npd.no/). The glacial deposits consist of sediments deposited during both glacial and interglacial periods during the Middle–Late Pleistocene (Vorren et al., 1990; Sættem et al., 1992). Moreover, numerical modelling showed that some parts of study area, where only erosion is assumed, most likely experienced net deposition during the Middle–Late Pleistocene glacial periods and Early–Late Pleistocene interglacial periods (Zieba et al., 2016).
Isostatic modellingModelling of isostatic uplift and further topographic development was carried out in the southern Barents Sea, in the drainage area of the Bjørnøya Trough. The drainage area of the Bjørnøya Trough is the only area in the Barents Sea where long-term erosion estimates are available. Erosion values outside the trough were interpolated in input maps in order to avoid sharp contrasts in modelled isostatic uplift. Nonetheless, the model cannot be considered reliable in these areas, i.e., the easternmost part shown in Figs. 3 & 6).
The modelling time-span includes the last 1.5 Myr, when the southern Barents Sea was subjected to several advances of the Barents/Kara Sea ice sheet (Knies et al., 2009). The topography was modelled only during interglacial periods without considering the topographic changes during ice-sheet loading events. Other flexural isostasy modelling studies showed that the topographic surface of the study area could have been deepened by the ice sheet by up to 800 m in the northeastern part to less than 200 m in the westernmost part during the Last Glacial Maximum (Kjemperud & Fjeldskaar, 1992; Zieba & Grøver, 2016).
Isostatic adjustments and topography calculations were conducted by using a simple flexural isostasy modelling approach where elastic lithosphere is underlain by inviscid mantle. The main uncertainties related to this approach are 1) densities of redistributed sediments and the mantle, 2) flexural rigidity, and 3) fault compensation. The uplift calculations assume a density of the eroded sediments equal to that of the deposited sediments. Differences in compaction and density of the Barents Sea’s source rocks and erosion products in the Bjørnøya Trough Mouth Fan are estimated between
the Middle Pleistocene and rates at which the modelled topography evolved.
The erosion thickness was estimated for two periods (1.5–0.7 Ma and 0.7–0.0 Ma) by using a mass-balance method that provides averaged erosion estimates over large areas. The calculations are based on interpreted volumes of redistributed sediments, a fixed sediment drainage area and erosion indicators including mega-scale glacial lineations (Laberg et al., 2012). The main uncertainties in erosion thickness estimates are related to 1) volumes of redistributed sediments, 2) size of the drainage area, and 3) sediment compaction. Volumes of sediments were calculated based on seismic interpretation. Available volume estimates of the same sediment units differ, leading to discrepancies in the calculated erosion thickness of about 90 m (Vorren et al., 1991; Fiedler & Faleide, 1996; Laberg et al., 2012). The size of drainage area was assumed to be fixed during the erosion time periods, following the area size estimates of Vorren et al. (1991) and Laberg et al. (2012). The catchment area and its size might, however, have been changing due to topographic evolution and dynamic changes of the ice-sheet configuration, potentially affecting calculations of the erosion thickness. The mass-balance approach assumes the same densities of sediments in the source and depositional areas despite a higher compaction level of source sediments (Laberg et al., 2012). This led to an erosion overestimate of <10% (Laberg et al., 2012).
The mass-balance approach thus provides averaged erosion estimates within the drainage area for long time-spans including entire ice ages. The relatively uniform erosion/thickness model resulted in a nearly homogeneous uplift of the study area, especially during the time-span between 1.5 and 0.7 Ma (Fig. 5). Moreover, the erosion input and modelling approach, where present-day bathymetry is used as a base for palaeo-topography calculations, might explain why the modelled palaeo-topographical/bathymetrical features mainly reflect present-day features (Fig. 6). The main erosion trends, including increased erosion in the main troughs and little erosion in the banks, were found to be similar to trends presented in a Weichselian erosion model covering a much shorter (the last 0.12 Myr) timespan (Amantov et al., 2011). The spatial distribution of erosion has certainly a more local character in the Weichselian erosion model than in the model of Laberg et al. (2012). The effect of local deposition and erosion on modelled flexure is most pronounced in areas where the elastic part of the lithosphere is sufficiently thin, since a thin lithosphere has low rigidity for short-wavelength loads (Turcotte & Schubert, 2002). In our modelling, where an effective elastic plate was set as 20 km thick, local sedimentary features could not impact the modelled uplift and topography to any appreciable degree.

NORWEGIAN JOURNAL OF GEOLOGY A flexural isostasy model for the Pleistocene evolution of the Barents Sea bathymetry 11
0.0 and 0.5 kg/m3 (Butt et al., 2002). A density value of 2200 kg/m3 was used following Riis & Fjeldskaar (1992). A lower sediment density of 1800 kg/m3 was also tested, as suggested by Butt et al. (2002) and Rasmussen & Fjeldskaar (1996). This value results in modelling of a higher topographic relief compared to a sediment density of 2200 kg/m3. The maximum elevation difference was modelled as 50–100 m. The calculations consider the mantle to have a homogeneous density of 3300 kg/m3.
The effective elastic thickness of the lithosphere (EET) is here assumed as 20 km (flexural rigidity = 6.4 × 10²² N m by using parameters listed in Table 1) uniformly distributed in the study area (Fjeldskaar, 1997; Berg et al., 2008). To quantify the influence of different EETs, a sensitivity test was performed in which values of 10 km and 50 km were tested. The value of 10 km resulted in relief differences reaching 50 m in restricted areas as compared to 20 km EET. The overall modelled bathymetric setting is very similar to a model with an EET = 20 km. EET = 50 km gave topography differences reaching 100 m, mostly in an isolated area between 18°E and 22°E. This area was modelled as elevated in relation to areas farther east. Except for Nordkappbanken (not modelled as topographic high if EET = 50 km) all the bathymetrical features were modelled by using the EET models of 10, 20 and 50 km at 1.5 Ma.
Another mechanism that potentially can alter the model-led uplift distribution and topography is movement of fault blocks due to applied or removed loads. Instead of flexure, the crust can respond to applied and removed loads by a displacement of entire fault blocks leading to distinct uplift variations over areas crossed by faults (Hetzel & Hampel, 2005). Susceptibility to fault movements due to sediment redistribution in the Barents Sea during the Pleistocene, however, is unknown. Hence, the effect of this mechanism is not addressed in this study.
Relation to published work and empirical data
Our results from the modelling support previous inferences that the preglacial Barents Sea shelf (prior to 1.5 Ma) represented an elevated area generally close to sea level with some parts raised up to about 300 m asl (Rasmussen & Fjeldskaar, 1996; Dimakis et al., 1998; Butt et al., 2002). The reconstruction at 1.5 Ma, based on the erosion model of Laberg et al. (2012), indicates a shallow–marine to subaerial southern Barents Sea shelf (Fig. 6A) and suggests strongly elevated areas of the Spitsbergenbanken and Sentralbanken separated by an elongated depression represented by the present-day Bjørnøya Trough (Fig. 6A). In contrast to Butt et al. (2002), the present study shows a submerged Djuprenna area prior to 1.5 Ma. The modelled Djuprenna might, however, also be regarded as an artefact related to the input erosion model (see Discussion–Input data).
According to Butt et al. (2002), the shallow marine (0–100 m bsl) shelf is thought to persist until ~1.0 Ma. However, our model suggests that the shallow-marine relief could have remained for longer times, at least until about 0.7 Ma, with a deepening of the Bjørnøya Trough after 0.7 Ma and formation of the Ingøydjupet during most of the recent glacial events. Our modelling is based on erosion models which fit the sediment geometry of the Bjørnøya Trough Mouth Fan (Fiedler & Faleide, 1996; Laberg et al., 2012) and shows that prior to 0.7 Ma, sediments forming the fan were deposited over large areas across the western Barents Sea shelf break. After 0.7 Ma, sediments were more constrained to the Bjørnøya Trough Mouth Fan signifying that the outer trough was a major depocentre for the Pliocene–Pleistocene prograding sequence, as indicated by Vorren et al. (1989).
Direct comparison of the modelled pre–glacial topo-graphy to the water depth and basin geometry indicators (e.g., seismo–stratigaphy, microfossils) is feasible only at the outer shelf area (Sørvestsnaget Basin, Vestbakken Volcanic Province, Fig. 1) due to removal of sedimentary evidence from the inner shelf (Nyland et al., 1992). The available information was found to support the proposed reconstruction (Fig. 6A). Thickening of the Late Pliocene sedimentary wedge from the western part of the Veslemøy High to the western part of the Sørvestsnaget Basin suggests increasing accommodation space and increasing water depths to the west (Ryseth et al., 2003; Omosanya et al., 2016). A similar setting was proposed for the Vestbakken Volcanic Province where the Late Pliocene sedimentary wedge filled the available accommodation space in a slope–inner shelf environment (Sættem et al., 1994).
The modelling results fit with the seismic interpretation of Omosanya et al. (2016). By analysing the trajectories of several shelf–margin clinoforms, these authors showed that prior to the Pleistocene the shelf-edge position had shifted westwards and that the beginning of the Pleistocene was dominated by marine processes and deposition of deep-water sediments. Their trajectory analyses revealed flat to descending clinoforms during the earliest Pliocene, changing to high-angle clinoforms in the Middle Pliocene and lastly to low-angle clinoforms at the end of Pliocene. This is evidence that the area has witnessed fluctuating sea level conditions and has alternated between continental and marine processes from Early to Late Pliocene. In addition, the authors also showed that there is evidence for transgression of the shoreline in the Late Pliocene, especially towards the northern part of Sørvestsnaget Basin. Hence, the prediction of a marine setting prior to the glaciations is in support of a deep-marine environment for the area. The inferred shelf edge for the preglacial relief east of the Pliocene positions is thus a result of transgression and dominant marine processes (Fig. 6A).

K.J.Zieba et al.12
topography that could have been preserved through a tectonically stable Late Cenozoic (Clark et al., 2014). It is thought that the wide Paleogene Barents Sea platform has been uplifted in relation to the Sørvestsnaget, Tromsø and Bjørnøya basins (Faleide et al., 1993; Worsley, 2008; Clark et al., 2014), which are related to the modelled depressions west of Tromsøflaket and in the western part of the Bjørnøya Trough, respectively (Fig. 6C).
After 1.5 MaSelective glacial erosion and deposition occurring after 1.5 Ma, and controlled by initial topography, were the main processes that shaped the present-day bathymetry of the Barents Sea (Vorren et al., 1989; Sættem et al., 1994; Andreassen et al., 2008; Laberg et al., 2012). Regional isostatic adjustments to these processes, and in particular to trough incision, might have affected a larger area than the area of actual erosion due to the lithospheric rigidity (Molnar & England, 1990; Montgomery, 1994). Due to significant glacially-related unloading in troughs, both the troughs and the surrounding areas can be uplifted at high magnitude as explained in Fig. 7. Flexural isostasy modelling indicates that Cenozoic fjord incision in
In terms of the implications for erosion, deposition and recurrent mass wasting in areas such as the Sørvestsnaget Basin during Pliocene to Pleistocene time, the modelled isostatic response during the Early Pleistocene is greater than that in the Middle Pleistocene to Present (Fig. 5A, B), indicating that the prevalence of deep-water processes, formation of high-angle clinoforms and deposition of a large trough mouth fan (e.g., MTD 5 of Omosanya et al., 2016) are in line with rising sea-level conditions at the Pliocene–Early Pleistocene boundary. The uplifted areas during the Early Pleistocene might also account for the presence of low-angle clinoforms and the deposition of MTDs 6 and 7 of Omosanya et al. (2016) across the shelf–edge break in the Pleistocene. Hence, uplifted areas or isostatic response during these times influenced accommodation space and deposition of sediments across the shelf-edge break.
Driving forces for the bathymetric changes
Prior to 1.5 MaThe glacial erosion was modelled to induce 250–400 m of isostatic uplift in the Bjørnøya and Ingøydjupet troughs. This value decreases to about 200 m outside the troughs and to negative values in the westernmost parts of the shelf (Fig. 5). The total Cenozoic uplift magnitude is suggested to vary between 1 km and more than 2 km (Nyland et al., 1992; Green & Duddy, 2010; Zattin et al., 2016). The Pleistocene isostatic component of the uplift is thus deemed to be relatively small, varying from 10 to 20% in the banks and about 10 to 40% in the troughs. We therefore propose that most of the uplift in the Barents Sea is related to tectonic uplift during the Neogene, as documented by Sættem et al. (1994), Green & Duddy (2010), Japsen et al. (2014) and Knies et al. (2014).
Our reconstruction (Fig. 6A) indicates a mostly subaerially elevated shelf before the onset of glaciation, being probably a remnant of the uplift during the Neogene (Green & Duddy, 2010; Japsen et al., 2014). The results show that some of the present-day troughs (Bjørnøya Trough, Djuprenna and Håkjerringdjupet) represented submerged areas (up to 100–150 m) before the glacial ages. The initial depressions might have been formed by fluvial erosion earlier in the Cenozoic and perhaps acted as conduits for ice movement during the Middle to Late Pleistocene (Vorren et al., 1989; Laberg et al., 2010). In addition, most of the banks including Spitsbergenbanken, Murmanskbanken, Sentralbanken, Nordkappbanken and Tromsøflaket, were modelled to exist at >1.5 Ma, as documented for example by Lebesbye & Vorren (1996) for Spitsbergenbanken. The fact that many present-day bathymetrical features were modelled to have existed in the past might, however, be regarded as a caveat of the modelling process related to the uniform character of the erosion model (see Discussion–Input data). The modelled preglacial highs and depressions to some degree coincide with the Paleogene post-rift
Figure 7. Theoretical influence of regional isostatic response on ero-sion with extra high erosion in the centre (not to scale). Such a set-ting might represent the Barents Sea shelf with moderate erosion out-side the troughs and high erosion in the troughs. The highest uplift is expected in the central part being driven by extra high erosion. The margins to the trough areas also experience elevated uplift values resulting in a high erosion thickness to uplift magnitude ratio. The model uses a three-layer lithosphere consisting of an upper sedimen-tary part (yellow), a rigid part of the lithosphere (brown), and an inviscid mantle (green). Modified from Medvedev et al. (2013). (A) Initial relief. (B) Erosion. (C) Isostatically adjusted relief.

NORWEGIAN JOURNAL OF GEOLOGY A flexural isostasy model for the Pleistocene evolution of the Barents Sea bathymetry 13
western Norway and eastern Greenland could have led to uplifts of surrounding areas exceeding 1 km, and thus responsible for the development of large-scale positive topographic features (Medvedev et al., 2008; Steer et al., 2012). In this study, we tested if the southern Barents Sea submarine banks that are adjacent to deep troughs are products of the regional isostatic compensation to glacial erosion in a similar way as in western Norway and eastern Greenland. To detect if the banks were indeed uplifted in relation to surrounding areas, we plotted the ratio between uplift and erosion thickness (during the time-span of 1.50–0.0 Ma). The uplift to erosion ratio of 1.0 indicates that the entire erosion is compensated by uplift and there is no topography reduction, while a value of 0.0 implies that erosion has not been compensated and topography was reduced by the thickness of erosion.
A map of the compensating uplift to erosion ratio (Fig. 8) shows higher values of 0.55–0.65 along the margins of the Bjørnøya and Ingøydjupet troughs (mostly associated with present-day banks) than within and outside the troughs (below 0.5). High compensating uplift together with low erosion thickness led to low topography reduction in the banks. In contrast, low compensation of the high erosion thickness resulted in an efficient drainage of the troughs (Fig. 7C). Therefore, the difference in the compensation level is thought to enhance the contrasts in topographic relief between the troughs and the banks.
The magnitude of this effect depends on the size of the discharge area and the EET. Due to the lithospheric rigidity, erosion concentrated in narrow troughs will be isostatically compensated by lower magnitude than wide troughs (Turcotte & Schubert, 2002). By using modelling parameters (Table 1), trough erosion is fully compensated for troughs wider than about 150 km. For 50 km-wide troughs, the compensation level is modelled to be about a half of full compensation. The effect of relative uplift on the banks was modelled only at the margins along the major troughs of the southern Barents Sea. The used erosion model of Laberg et al. (2012) accounts for extra high erosion only in the Bjørnøya and Ingøydjupet troughs but does not include those of other troughs such as Djuprenna and Håkjerringdjupet, which were occupied by fast-flowing and erosive ice streams during the Pleistocene (Andreassen et al., 2004). The total Pleistocene erosion thickness in Djuprenna and Håkjerringdjupet has not been evaluated therefore that the effect of relative uplift of the banks adjacent to these troughs cannot be quantified. It might be speculated that if Ingøydjupet, Djuprenna and Håkjerringdjupet had been subjected to the same amount of erosion, the relative uplift of the banks adjacent to the troughs should be similar in Ingøydjupet and Djuprenna due to the comparable size of the troughs (both about 50 km wide). We further hypothesise that the southern part of Nordkappbanken and the western part of Murmanskbanken (adjacent to Djuprenna) could have been developed to some degree
-700
-600
-500
-400
-300-200-1000
Uplift/erosion
0 50 km
Figure 8. Total isostatic uplift to total erosion ratio. The contrasting values might indicate an additional regional component to the local isostasy. Black lines show contours of present-day topography with 50 m intervals. White dashed lines with numbers show total erosion thick-ness. For details and interpretation see the main text.

K.J.Zieba et al.14
the Barents Sea (Fig. 6) has prevented bifurcation of the North Atlantic Current i.e., the northernmost extension of the Atlantic thermohaline circulation and, as a result, warm and salty waters could be directed towards the Fram Strait resulting in heat transport farther north and potential sea-ice feedbacks. To buttress this point, Hill (2015) showed that uplifted landmasses in the Barents Sea can produce a significant temperature response at high latitudes and may have played an important role for the observed low meridional temperature gradient in the Pliocene North Atlantic–Arctic gateway region. Butt et al. (2002) argued that this non-analogue ocean circulation pattern with a subaerial Barents Sea shelf existed until about 1 million years ago. This timing is roughly in agreement with the present study suggesting that the Barents Sea shelf was close to or somehow elevated (~300 m) above the sea level at around 1.5 Ma. Based on the revised chronostratigraphy of Knies et al. (2009) and Laberg et al. (2010), we show that the inflow of warm Atlantic–derived water masses to the inner Barents Sea shelf started at some time between 0.7 and 1.5 Ma. Regardless of the ultimate timing of subsidence, initial bifurcation of northward-flowing Atlantic–derived water masses into the Barents Sea between 1.0 and 0.7 Ma is consistent with the onset of numerous large-scale, shelf-edge glaciations in the Barents Sea (Flower, 1997; Kristoffersen et al., 2004) and potentially northern Eurasia (Astakhov, 2004). These are manifested as distinct freshwater pulses in the Atlantic–Arctic gateway (Knies et al., 2007). Thus, the increase of global ice volume during the Middle Pleistocene transition from ~1.25 to 0.70 Ma (Hays et al., 1976) may be supported by the gradual subsidence of the Barents Sea relief and subsequent eastward penetration of Atlantic waters towards the inner Barents Sea shelf. The latter could have acted as an additional moisture source for build-up of massive Eurasian ice sheets as documented by Flower (1997) and Kristoffersen et al. (2004). Moreover, lesser volumes of northward-flowing warm and salty waters might have caused positive feedbacks for Arctic sea-ice dynamics in the Fram Strait (Stein & Fahl, 2013).
Influence on extent of ice sheets
Grounded ice sheets in the Barents Sea are thought to have reached the shelf edge multiple times during the Pleistocene (Laberg & Vorren, 1996). Mapping and modelling show that the well defined shelf edge that developed during the Late Pleistocene was the result of high sediment delivery to the outer shelf (Fig. 6). Due to the unclear position of the modelled shelf edge, the maximum ice extent during the Early and Middle Pleistocene remains ambiguous. Moreover, modelling the extent of grounded marine ice sheets is a complex process that requires reliable ice thickness data in the simplest approximations (Blatter et al., 2011; Kirchner et al., 2011; Stokes et al., 2015; Patton et al., 2016). The data are not available for such long time periods in the
by regional isostatic forces in addition to a significant deposition of glaciogenic sediments (Andreassen et al., 2008). If any, a much lower relative uplift is expected for Tromsøflaket bank, adjacent to the narrow (3–36 km) Håkjerringdjupet Trough.
High compensation ratios in bank areas and mainland northern Scandinavia are, however, also influenced by initial topography as previously suggested by Vorren et al. (1989), Sættem et al. (1994), Andreassen et al. (2008), Laberg et al. (2012) and Hall et al. (2013). For most of the Pleistocene, northern Scandinavia, Spitsbergenbanken and southwestern Sentralbanken were modelled as subaerial areas. The same amount of erosion is more compensated by uplift in onshore ares than in offshore environments due to water weight counteracting the uplift. In conclusion, our model suggests that present-day banks, often reflecting the bedrock morphology (Vorren et al., 1989), are not only an effect of the selective erosion and deposition controlled by initial topography. The contrasting bathymetry of the deep troughs and adjacent shallow banks is considered here to be a result of glacial activity affected by regional isostatic adjustments to these processes.
The westernmost part of the shelf shows uplift to erosion ratios declining to the west (Fig. 8). The lowest ratios are modelled as negative values suggesting that erosion is not compensated by any uplift, but is affected by lithospheric downwarping. A reduced compensation ratio in the westernmost shelf area is attributed to pulldown of the lithospheric plate in the western part of the study area (Fig. 5), which is linked to significant deposition on the outer shelf and continental slope (Fig. 3). The influence of the sinking plate in the west together with erosion could have been a very effective topography-reducing mechanism and might explain why the greatest topography reduction was modelled at the mouth of the Bjørnøya Trough (see Results–Topographic relief evolution). Due to different compensation ratios, the same amount of erosion led to very different degrees of bathymetry reduction, which is variable from one locality to another in the study area. For example, 500 m of erosion at the mouth of the Bjørnøya Trough with 0.25 of compensating uplift results in 375 m of topography reduction. In Nordkappbanken, the same amount of erosion with 0.60 of compensating uplift results in only 200 m of deepening.
Impact on northern Atlantic thermohaline circulation
Recent climate in the Arctic is controlled by the advection of the warm and saline Atlantic waters into the Nordic seas (Hurdle, 1986). At present, about 40% of northward-flowing waters are directed to the Barents Sea while the remaining part flows towards the Fram Strait (Simonsen & Haugan, 1996). In the past, the elevated palaeo–relief of

NORWEGIAN JOURNAL OF GEOLOGY A flexural isostasy model for the Pleistocene evolution of the Barents Sea bathymetry 15
deepest parts of the shelf were modelled at about 100–150 m bsl and the most elevated parts at about 300 m asl.
2. The results are interpreted to show that most of the prominent present-day troughs and banks were initiated prior to large-scale glaciations occurring from ~1.5 Ma, possibly as a response to tectonic uplift and related structural development.
3. Modelling indicates that between the Early (Calabrian) and Middle Pleistocene (1.5–0.7 Ma) the relief was deepened by 0–200 m with the greatest topography reduction in major troughs and the lowest on the banks. The Middle Pleistocene shelf is modelled as a shallow-marine relief with Spitsbergenbanken elevated above sea level. Between the Middle Pleistocene and the present (0.7–0.0 Ma), the shelf was deepened by up to 250 m in the trough areas. On the banks, the topography was reduced by up to 100 m.
4. Glacial erosion is modelled to induce isostatic uplift in the range of 250–400 m in the troughs and below 200 m in the remaining areas in the southern Barents Sea. The isostatic component of the total shelf uplift (1–2 km) is deemed to be relatively small, thus favouring the tectonic component of the Barents Sea uplift.
5. The topography throughout the Pleistocene was mostly shaped by glacial erosion and deposition, controlled by the initial topography as has already been reported in the literature. The present-day relief was found to be affected also by regional isostatic adjustments beyond the areas of focused trough erosion and significant deposition on the shelf margins.
6. Our model suggests that the inflow of the North Atlantic Current to the Barents Sea was barred by the topography at 1.5 Ma, whereas it probably entered the Barents Sea during the period between 1.5 and 0.7 Ma. The age of restricted bifurcation coincides with glacial expansions in the Barents Sea and potentially also in northern Eurasia.
Acknowledgements. This study is a part of the project ‘Impact of Ceno-zoic structural development and glacial erosion on gas expansion, hydraulic fracturing and leakage in the Western Barents Sea’ sponso-red by ENI Norge. K.J.Z. is thankful to ENI Norge for financial support of his Ph.D. and Sintef Petroleum AS for providing infrastructure and overall support. J.K. is supported by the Research Council of Norway (RCN grant 223259). We also thank Stephen Lippard for proof reading the manuscript and greatly appreciate the constructive comments of Fridtjof Riis and one anonymous reviewer which helped us in impro-ving the manuscript.
study area. Nonetheless, we may speculate about the extent of the Barents Sea ice sheet at the western shelf margin based on the grounding line position from the Last Glacial Maximum (LGM). In a marine environment, the grounding line represents a transition between flowing and floating ice (Stokes et al., 2015). The LGM grounding line bathymetry lies at approximately 500 m of the present water depths (Landvik et al., 1998). Hence, assuming similar ice-sheet geometry and a sea level at approximately 100 m lower than at the present (Boer et al., 2014), the past grounding lines can be expected at about 400 m below past sea levels.
Based on these simplistic assumptions, the maximum extent of the grounded ice can be approximated for the southwestern Barents Sea margin (Fig. 6). However, we stress that the proposed Pleistocene ice extent boundaries are only conceptual lines and should be considered only as a first approximation. The results suggest that between the onset of shelf-edge glaciations at ~1.5 Ma and the Middle Pleistocene (0.7 Ma), the area experienced sediment accumulation and shallowing only in the deep parts of the outer shelf/shallow continental slope and erosion to the east of the area. This resulted in almost no change in position of the 400 m bsl isoline in the areas south and north of the mouth of the Bjørnøya Trough. Some regression of the isoline to the east (up to about 30 km) might have occurred only in the central part of the study area (Fig. 6). Major shelf progradation mapped and modelled between the Middle Pleistocene and the present might have resulted in advance of the 400 m bsl isoline to the west. The maximum ice-sheet extent can therefore be expected to have occurred during the most recent glaciations. A significant advance of the maximum grounding line between the Middle and Late Pleistocene occurred in the area occupied by the Bjørnøya Trough ice stream, at the mouth of the Bjørnøya Trough (up to 90 km). This maximum ice-sheet extent became possible from the Late Pleistocene due to shelf progradation driven by significant glacial deposition at the mouth of the Bjørnøya Trough (Laberg et al., 2012). West of Tromsøflaket and Spitsbergenbanken, the maximum ice extent has not changed much since the Early Pleistocene where the steep seabed gradient has not changed significantly throughout the Pleistocene.
Conclusions
The evolution of Pleistocene bathymetry in the southern Barents Sea is addressed in this work by using flexural isostasy modelling. Relation between regional isostatic response to sediment redistribution and contrasting present-day submarine relief was studied. The main findings are as follows:
1. The preglacial (1.5 Ma) relief of the southern Barents Sea was modelled generally close to the sea level. The

K.J.Zieba et al.16
modelling. Basin Research 26, 550–566. https://doi.org/10.1111/bre.12039. Dimakis, P., Braathen, B.I., Faleide, J.I., Elverhøi, A. & Gudlaugsson, S.T.
1998: Cenozoic erosion and the preglacial uplift of the Svalbard–Barents Sea region. Tectonophysics 300, 311–327.
https://doi.org/10.1016/S0040-1951(98)00245-5. Doré, A.G. 1991: The structural foundation and evolution of Mesozoic
seaways between Europe and the Arctic. Palaeogeography, Palaeoclimatology, Palaeoecology 87, 441–492.
https://doi.org/10.1016/0031-0182(91)90144-G. Doré, A.G. 1995. Barents Sea Geology, Petroleum Resources and
Commercial Potential. Arctic 48, 207–221. https://doi.org/10.14430/arctic1243. Doré, A.G. & Jensen, L.N. 1996: The impact of late Cenozoic uplift and
erosion on hydrocarbon exploration: offshore Norway and some other uplifted basins. Global and Planetary Change 12, 415–436. https://doi.org/10.1016/0921-8181(95)00031-3.
Doré, A.G., Lundin, E.R., Jensen, L.N., Birkeland, O., Eliassen, P.E. & Fichler, C. 1999: Principal tectonic events in the evolution of the northwest Atlantic margin. In Fleet, A.J. & Boldy, A.A.R. (eds.): Petroleum Geology of Northwest Europe – Proceedings of the 5th Conference, Geological Society of London, pp. 41–61. https://doi.org/10.1144/0050041.
Ebbing, J., Braitenberg, C. & Wienecke, S. 2007: Insights into the lithospheric structure and tectonic setting of the Barents Sea region from isostatic considerations. Geophysical Journal International 171, 1390–1403. https://doi.org/10.1111/j.1365-246X.2007.03602.x.
Eidvin, T., Riis, F., Rasmussen, E.S. & Rundberg, Y. 2013: Investigation of Oligocene to Lower Pliocene deposits in the Nordic offshore area and onshore Denmark. Norwegian Petroleum Directorate Bulletin 10, p. 62.
Elverhøi, A., Hooke, R.L. & Solheim, A. 1998: Late Cenozoic erosion and sediment yield from the Svalbard–Barents Sea region: implications for understanding erosion of glacierized basins. Quaternary Science Reviews 17, 209–241. https://doi.org/10.1016/S0277-3791(97)00070-X.
Faleide, J.I., Vagnes, E. & Gudlaugsson, S.T. 1993: Late Mesozoic–Cenozoic Evolution of the South–Western Barents Sea in a Regional Rift Shear Tectonic Setting. Marine and Petroleum Geology 10, 186–214. https://doi.org/10.1016/0264-8172(93)90104-Z.
Faleide, J.I., Tsikalas, F., Breivik, A.J., Mjelde, R., Ritzmann, O., Engen, O., Wilson, J. & Eldholm, O. 2008: Structure and evolution of the continental margin off Norway and Barents Sea. Episodes 31, 82–91.
Fiedler, A. & Faleide, J.I. 1996: Cenozoic sedimentation along the southwestern Barents Sea margin in relation to uplift and erosion of the shelf. Global and Planetary Change 12, 75–93. https://doi.org/10.1016/0921-8181(95)00013-5.
Fjeldskaar, W. 1997: Flexural rigidity of Fennoscandia inferred from the postglacial uplift. Tectonics 16, 596–608. https://doi.org/10.1029/97TC00813.
Flower, B.P. 1997: Overconsolidated section on the Yermak Plateau, Arctic Ocean: Ice sheet grounding prior to ca. 660 ka? Geology 25, 147–150. https://doi.org/10.1130/0091-7613(1997)025<0147:OSOTYP>2.3.CO;2.
Gabrielsen, R.H. 1984: Long-lived fault zones and their influence on the tectonic development of the southwestern Barents Sea. Journal of Geological Society of London 141, 651–662. https://doi.org/10.1144/gsjgs.141.4.0651.
References
Amantov, A., Fjeldskaar, W. & Cathles, L. 2011: Glacial erosion in the Baltic Sea region: Effect on the postglacial uplift. In Harff, J., Björck, S. & Hoth, P. (eds.): The Baltic Sea Basin, Springer, Berlin Heidelberg, pp. 53–71.
Andreassen, K., Nilssen, L.C., Rafaelsen, B. & Kuilman, L. 2004: Three-dimensional seismic data from the Barents Sea margin reveal evidence of past ice streams and their dynamics. Geology 32, 729–732. https://doi.org/10.1130/G20497.1.
Andreassen, K., Ødegaard, C.M. & Rafaelsen, B. 2007: Imprints of former ice streams, imaged and interpreted using industry three-dimensional seismic data from the south–western Barents Sea. In Davies, R.L., Posamentier, H.W., Wood, L.J. & Cartwright, J.A. (eds.): Seismic Geomorphology: Applications to Hydrocarbon Exploration and Production, Geological Society of London Special Publication 277, pp. 151–169. https://doi.org/10.1144/gsl.sp.2007.277.01.09.
Andreassen, K., Laberg, J.S. & Vorren, T.O. 2008: Seafloor geomorphology of the SW Barents Sea and its glaci-dynamic implications. Geomorphology 97, 157–177.
https://doi.org/10.1016/j.geomorph.2007.02.050. Anell, I., Thybo, H. & Artemieva, I.M. 2009: Cenozoic uplift and
subsidence in the North Atlantic region: Geological evidence revisited. Tectonophysics 474, 78–105.
https://doi.org/10.1016/j.tecto.2009.04.006. Astakhov, V. 2004: Middle Pleistocene glaciations of the Russian North.
Quaternary Science Reviews 23, 1285–1311. https://doi.org/10.1016/j.quascirev.2003.12.011. Berg, J. van den, van de Wal, R.S.W., Milne, G.A. & Oerlemans, J.
2008: Effect of isostasy on dynamical ice sheet modeling: A case study for Eurasia. Journal of Geophysical Research: Solid Earth 113. https://doi.org/10.1029/2007JB004994.
Blatter, H., Greve, R. & Abe-Ouchi, A. 2011: Present State and Prospects of Ice Sheet and Glacier Modelling. Surveys in Geophysics 32, 555–583. https://doi.org/10.1007/s10712-011-9128-0.
Boer, B. de, Lourens, L.J. & van de Wal, R.S. 2014: Persistent 400,000-year variability of Antarctic ice volume and the carbon cycle is revealed throughout the Plio–Pleistocene. Nature Communications 5, 1–8. https://doi.org/10.1038/ncomms3999.
Butt, F.A., Elverhoi, A., Solheim, A. & Forsberg, C.F. 2000: Deciphering Late Cenozoic development of the western Svalbard Margin from ODP Site 986 results. Marine Geology 169, 373–390. https://doi.org/10.1016/S0025-3227(00)00088-8.
Butt, F.A., Drange, H., Elverhoi, A., Ottera, O.H. & Solheim, A. 2002: Modelling Late Cenozoic isostatic elevation changes in the Barents Sea and their implications for oceanic and climatic regimes: preliminary results. Quaternary Science Reviews 21, 1643–1660. https://doi.org/10.1016/S0277-3791(02)00018-5.
Cardozo, N. 2009: 3D flexural modeling. Continuous plate of variable elastic thickness (finite difference solution). Matlab script. http://www.ux.uis.no/~nestor/work/matlabScripts.html (accessed 07.12. 2016).
Cavanagh, A.J., Di Primio, R., Scheck-Wenderoth, M. & Horsfield, B. 2006: Severity and timing of Cenozoic exhumation in the southwestern Barents Sea. Journal of the Geological Society 163, 761–774. https://doi.org/10.1144/0016-76492005-146.
Clark, S.A., Glorstad-Clark, E., Faleide, J.I., Schmid, D., Hartz, E.H. & Fjeldskaar, W. 2014: Southwest Barents Sea rift basin evolution: Comparing results from backstripping and time-forward

NORWEGIAN JOURNAL OF GEOLOGY A flexural isostasy model for the Pleistocene evolution of the Barents Sea bathymetry 17
Gabrielsen, R.H., Færseth, R.B., Jensen, L.N., Kalheim, J.E. & Riis, F. 1990: Structural elements of the continental shelf. Part I: The Barents Sea Region. Norwegian Petroleum Directorate Bulletin 6, p. 33.
Geissler, W.H. & Jokat, W. 2004: A geophysical study of the northern Svalbard continental margin. Geophysical Journal International 158, 50–66. https://doi.org/10.1111/j.1365-246X.2004.02315.x.
Green, P.F. & Duddy, I.R. 2010: Synchronous exhumation events around the Arctic including examples from Barents Sea and Alaska Slope. Petroleum Geology Conference series 7, 633–644.
Hall, A.M., Ebert, K., Kleman, J., Nesje, A. & Ottesen, D. 2013: Selective glacial erosion on the Norwegian passive margin. Geology 41, 1203–1206. https://doi.org/10.1130/G34806.1.
Hays, J.D., Imbrie, J. & Shackleton, N.J. 1976: Variations in the earth’s orbit: Pacemaker of the ice ages. Science 194, 1121–1132. https://doi.org/10.1126/science.194.4270.1121.
Henriksen, E., Bjornseth, H.M., Hals, T.K., Heide, T., Kiryukhina, T., Klovjan, O.S., Larssen, G.B., Ryseth, A.E., Ronning, K., Sollid, K. & Stoupakova, A. 2011: Chapter 17 Uplift and erosion of the greater Barents Sea: impact on prospectivity and petroleum systems. Geological Society of London Memoirs 35, 271–281.
Hetzel, R. & Hampel, A. 2005: Slip rate variations on normal faults during glacial-interglacial changes in surface loads. Nature 435, 81–84. https://doi.org/10.1038/nature03562.
Hill, D.J. 2015: The non-analogue nature of Pliocene temperature gradients. Earth and Planetary Science Letters 425, 232–241. https://doi.org/10.1016/j.epsl.2015.05.044.
Hjelstuen, B.O., Eldholm, O. & Faleide, J.I. 2007: Recurrent Pleistocene mega–failures on the SW Barents Sea margin. Earth and Planetary Science Letters 258, 605–618. https://doi.org/10.1016/j.epsl.2007.04.025.
Hurdle, B.G. 1986: The Nordic Seas. Springer Verlag, New York, 777 pp.Ingólfsson, Ó. & Landvik, J.Y. 2013: The Svalbard–Barents Sea ice-sheet
– Historical, current and future perspectives. Quaternary Science Reviews 64, 33–60. https://doi.org/10.1016/j.quascirev.2012.11.034.
Japsen, P., Green, P.F., Bonow, J.M., Nielsen, T.F.D. & Chalmers, J.A. 2014: From volcanic plains to glaciated peaks: Burial, uplift and exhumation history of southern East Greenland after opening of the NE Atlantic. Global and Planetary Change 116, 91–114. https://doi.org/10.1016/j.gloplacha.2014.01.012.
Kirchner, N., Hutter, K., Jakobsson, M. & Gyllencreutz, R. 2011: Capabilities and limitations of numerical ice sheet models: a discussion for Earth-scientists and modelers. Quaternary Science Reviews 30, 3691–3704. https://doi.org/10.1016/j.quascirev.2011.09.012.
Kjemperud, A. & Fjeldskaar, W. 1992: Pleistocene glacial isostasy – implications for petroleum geology. In Larsen, R.M., Brekke, H., Larsen, B.T. & Talleraas, E. (eds.): Structural and Tectonic Modelling and its Application to Petroleum Geology, Norwegian Petroleum Society Special Publication, pp. 187–195. https://doi.org/10.1016/B978-0-444-88607-1.50017-6.
Klitzke, P., Faleide, J.I., Scheck-Wenderoth, M. & Sippel, J. 2015: A lithosphere-scale structural model of the Barents Sea and Kara Sea region. Solid Earth 6, 153–172. https://doi.org/10.5194/se-6-153-2015.
Knies, J., Matthiessen, J., Mackensen, A., Stein, R., Vogt, C., Frederichs, T. & Nam, S.I. 2007: Effects of Arctic freshwater forcing on thermohaline circulation during the Pleistocene. Geology 35, 1075–1078. https://doi.org/10.1130/G23966A.1.
Knies, J., Matthiessen, J., Vogt, C., Laberg, J.S., Hjelstuen, B.O., Smelror, M., Larsen, E., Andreassen, K., Eidvin, T. & Vorren, T.O. 2009: The Plio–Pleistocene glaciation of the Barents Sea–Svalbard region: a new model based on revised chronostratigraphy. Quaternary Science Reviews 28, 812–829. https://doi.org/10.1016/j.quascirev.2008.12.002.
Knies, J., Mattingsdal, R., Fabian, K., Grøsfjeld, K., Baranwal, S., Husum, K., De Schepper, S., Vogt, C., Andersen, N., Matthiessen, J., Andreassen, K., Jokat, W., Nam, S.-I. & Gaina, C. 2014: Effect of early Pliocene uplift on late Pliocene cooling in the Arctic–Atlantic gateway. Earth and Planetary Science Letters 387, 132–144. https://doi.org/10.1016/j.epsl.2013.11.007.
Knutsen, S.M., Richardsen, G. & Vorren, T.O. 1992: Late Miocene–Pleistocene sequence stratigraphy and mass movements on the western Barents Sea margin. In Vorren, T.O., Bergsager, E., Dahl-Stamnes, Ø.A., Holter, E., Johansen, B., Lie, E. & Lund, T.B. (eds.): Arctic Geology and Petroleum Potential, Norwegian Petroleum Society Special Publication 2, pp. 573–606.
Kristoffersen, Y., Coakley, B., Jokat, W., Edwards, M., Brekke, H. & Gjengedal, J. 2004: Seabed erosion on the Lomonosov Ridge, central Arctic Ocean: A tale of deep draft icebergs in the Eurasia Basin and the influence of Atlantic water inflow on iceberg motion? Paleoceanography 19, 1–14 https://doi.org/10.1029/2003PA000985.
Laberg, J.S. & Vorren, T.O. 1996: The Middle and Late Pleistocene evolution of the Bear Island Trough Mouth Fan. Global and Planetary Change 12, 309–330. https://doi.org/10.1016/0921-8181(95)00026-7.
Laberg, J.S., Andreassen, K., Knies, J., Vorren, T.O. & Winsborrow, M. 2010: Late Pliocene–Pleistocene development of the Barents Sea Ice Sheet. Geology 38, 107–110. https://doi.org/10.1130/G30193.1.
Laberg, J.S., Andreassen, K. & Vorren, T.O. 2012: Late Cenozoic erosion of the high-latitude southwestern Barents Sea shelf revisited. Geological Society of America Bulletin 124, 77–88. https://doi.org/10.1130/B30340.1.
Landvik, J.Y., Bondevik, S., Elverhøi, A., Fjeldskaar, W., Mangerud, J., Salvigsen, O., Siegert, M.J., Svendsen, J.I. & Vorren, T.O. 1998: The last glacial maximum of Svalbard and the Barents sea area: Ice sheet extent and configuration. Quaternary Science Reviews 17, 43–75. https://doi.org/10.1016/S0277-3791(97)00066-8.
Lebesbye, E. & Vorren, T.O. 1996: Submerged terraces in the southwestern Barents Sea: origin and implications for the late Cenozoic geological history. Marine Geology 130, 265–280. https://doi.org/10.1016/0025-3227(96)00170-3.
Lundin, E. & Doré, A.G. 2002: Mid–Cenozoic post-breakup deformation in the ‘passive’ margins bordering the Norwegian – Greenland Sea. Marine and Petroleum Geology 19, 79–93. https://doi.org/10.1016/S0264-8172(01)00046-0.
Mattingsdal, R., Knies, J., Andreassen, K., Fabian, K., Husum, K., Grøsfjeld, K. & De Schepper, S. 2014: A new 6 Myr stratigraphic framework for the Atlantic–Arctic Gateway. Quaternary Science Reviews 92, 170–178. https://doi.org/10.1016/j.quascirev.2013.08.022.
Mattos, N., Alves, T.A. & Omosanya, K.O. 2016: Crestal fault geometries reveal late halokinesis and collapse of the Samson Dome, Northern Norway: Implications for petroleum systems in the Barents Sea. Tectonophysics 690, 76–96. https://doi.org/10.1016/j.tecto.2016.04.043.
Medvedev, S., Hartz, E.H. & Podladchnikov, Y.Y. 2008: Vertical motions of the fjord regions of central East Greenland: Impact of glacial

K.J.Zieba et al.18
Ritzmann, O. & Faleide, J.I. 2007: Caledonian basement of the western Barents Sea. Tectonics 26, 1–20. https://doi.org/10.1029/2006TC002059.
Ruddiman, W.F. 2010: A Paleoclimatic Enigma? Science 328, 838–839. https://doi.org/10.1126/science.1188292.
Ryseth, A., Augustson, J.H., Charnock, M., Haugerud, O., Knutsen, S.-M., Midbøe, P.S., Opsal, J.G. & Sundsbø, G. 2003: Cenozoic stratigraphy and evolution of the Sørvestsnaget Basin, southwestern Barents Sea. Norsk Geologisk Tidskrift, 83, 107–130.
Simonsen, K. & Haugan, P.M. 1996: Heat budgets of the Arctic Mediterranean and sea surface heat flux parameterizations for the Nordic Seas. Journal of Geophysical Research: Oceans 101, 6553–6576. https://doi.org/10.1029/95JC03305.
Steer, P., Huismans, R.S., Valla, P.G., Gac, S. & Herman, F. 2012: Bimodal Plio–Quaternary glacial erosion of fjords and low-relief surfaces in Scandinavia: Nature Geoscience 5, 635–639. https://doi.org/10.1038/ngeo1549.
Stein, R. & Fahl, K. 2013: Biomarker proxy shows potential for studying the entire Quaternary Arctic sea ice history. Organic Geochemistry 55, 98–102. https://doi.org/10.1016/j.orggeochem.2012.11.005.
Stokes, C.R., Tarasov, L., Blomdin, R., Cronin, T.M., Fisher, T.G., Gyllencreutz, R., Hättestrand, C., Heyman, J., Hindmarsh, R.C.A., Hughes, A.L.C., Jakobsson, M., Kirchner, N., Livingstone, S.J., Margold, M., Murton, J.B., Noormets, R., Peltier, W.R., Peteet, D.M., Piper, D.J.W., Preusser, F., Renssen, H., Roberts, D.H., Roche, D.M., Saint-Ange, F., Stroeven, A.P. & Teller, J.T. 2015: On the reconstruction of palaeo-ice sheets: Recent advances and future challenges. Quaternary Science Reviews 125, 15–49. https://doi.org/10.1016/j.quascirev.2015.07.016.
Svendsen, J.I., Alexanderson, H., Astakhov, V.I., Demidov, I., Dowdeswell, J.A., Funder, S., Gataullin, V., Henriksen, M., Hjort, C., Houmark-Nielsen, M., Hubberten, H.W., Ingólfsson, Ó., Jakobsson, M., Kjær, K.H., Larsen, E., Lokrantz, H., Lunkka, J.P., Lyså, A., Mangerud, J., Matiouchkov, A., Murray, A., Möller, P., Niessen, F., Nikolskaya, O., Polyak, L., Saarnisto, M., Siegert, C., Siegert, M.J., Spielhagen, R.F. & Stein, R. 2004: Late Quaternary ice sheet history of northern Eurasia. Quaternary Science Reviews 23, 1229–1271. https://doi.org/10.1016/j.quascirev.2003.12.008.
Sættem, J., Poole, D.A.R., Ellingsen, L. & Sejrup, H.P. 1992: Glacial geology of outer Bjørnøyrenna, southhwestern Barents Sea. Marine Geology 103, 15–51. https://doi.org/10.1016/0025-3227(92)90007-5.
Sættem, J., Bugge, T., Fanavoll, S., Goll, R.M., Mørk, A., Mørk, M.B.E., Smelror, M. & Verdenius, J.G. 1994: Cenozoic margin development and erosion of the Barents Sea: Core evidence from southwest of Bjørnøya. Marine Geology 118, 257–281. https://doi.org/10.1016/0025-3227(94)90087-6.
Turcotte, D.L. & Schubert, G. 2002: Geodynamics. Cambridge University Press, Cambridge, 456 pp. https://doi.org/10.1017/CBO9780511807442.
Vening-Meinesz, F.A. 1941: Gravity over Hawaiian archipelago and over Madeira area. Proceedings of the Koninklijke Nederlandse Academie Wetensia 44, 1–12.
Vorren, T.O. & Laberg, J.S. 1997: Trough mouth fans – palaeoclimate and ice-sheet monitors. Quaternary Science Reviews 16, 865–881. https://doi.org/10.1016/S0277-3791(97)00003-6.
Vorren, T.O., Lebesbye, E., Andreassen, K. & Larsen, K.B. 1989: Glacigenic sediments on a passive continental margin as exemplified by the Barents Sea. Marine Geology 85, 251–272. https://doi.org/10.1016/0025-3227(89)90156-4.
erosion, deposition, and isostasy. Geology 36, 539–542. https://doi.org/10.1130/G24638A.1.
Medvedev, S., Souche, A. & Hartz, E.H. 2013: Influence of ice sheet and glacial erosion on passive margins of Greenland. Geomorphology 193, 36–46. https://doi.org/10.1016/j.geomorph.2013.03.029.
Molnar, P. & England, P. 1990: Late Cenozoic uplift of mountain ranges and global climate change—Chicken or egg? Nature 346, 29–34. https://doi.org/10.1038/346029a0.
Montgomery, D.R. 1994: Valley incision and the uplift of mountain peaks. Journal of Geophysical Research 99, 13913–13921. https://doi.org/10.1029/94JB00122.
Myhre, A., Thiede, J. & Firth, J.A. 1995: Proceedings of the Ocean Drilling Program. Initial Reports, Leg 151, Ocean Drilling Program, College Station, Texas, USA, p. 951.
Nansen, F. 1904: The Bathymetric Features of the North Polar Seas, with a Discussion of the Continental Shelves and Previous Oscillations of the Shore-Line: Norwegian Polar Expeditions 1893–1896 Scientific Results Volume 4. Jacob Dybwad, Christiania, 232 pp.
Nyland, B., Jensen, L.N., Skagen, J., Skarpnes, O. & Vorren, T. 1992: Tertiary uplift and erosion in the Barents Sea: magnitude, timing and consequences. Structural and tectonic modelling and its application to petroleum geology. Norwegian Petroleum Society Special Publications 1, 153–162.
Omosanya, K.O., Johansen, S.E. & Harishidayat, D. 2015: Evolution and Character of Supra-Salt Faults in the Easternmost Hammerfest Basin, SW Barents Sea. Marine and Petroleum Geology 66, 1013–1028. https://doi.org/10.1016/j.marpetgeo.2015.08.010.
Omosanya, K.O., Harishidayat, D., Marheni, L., Johansen, S.E., Felix, M. & Abrahamson, P. 2016: Recurrent mass-wasting in the Sørvestsnaget Basin Southwestern Barents Sea: A test of multiple hypotheses. Marine Geology 376, 175–193. https://doi.org/10.1016/j.margeo.2016.03.003.
Patton, H., Andreassen, K., Bjarnadóttir, L.R., Dowdeswell, J.A., Winsborrow, M.C.M., Noormets, R., Polyak, L., Auriac, A. & Hubbard, A. 2015: Geophysical constraints on the dynamics and retreat of the Barents Sea ice sheet as a paleobenchmark for models of marine ice sheet deglaciation. Reviews of Geophysics 53, 1051–1098. https://doi.org/10.1002/2015RG000495.
Patton, H., Hubbard, A., Andreassen, K., Winsborrow, M., Stroeven, A.P. 2016: The build-up, configuration, and dynamical sensitivity of the Eurasian ice-sheet complex to Late Weichselian climatic and oceanic forcing. Quaternary Science Reviews 153, 97–121. https://doi.org/10.1016/j.quascirev.2016.10.009.
Rasmussen, E. & Fjeldskaar, W. 1996: Quantification of the Pliocene–Pleistocene erosion of the Barents Sea from present-day bathymetry. Global and Planetary Change 12, 119–133. https://doi.org/10.1016/0921-8181(95)00015-1.
Riis, F. 1996: Quantification of Cenozoic vertical movements of Scandinavia by correlation of morphological surfaces with offshore data. Global and Planetary Change 12, 331–357. https://doi.org/10.1016/0921-8181(95)00027-5.
Riis, F. & Fjeldskaar, W. 1992: On the magnitude of the Late Tertiary and Quaternary erosion and its significance for the uplift of Scandinavia and the Barents Sea. In Larsen, R.M., Brekke, H., Larsen, B.T., Talleraas, E. (eds.): Structural and Tectonic Modelling and its Application to Petroleum Geology, Norwegian Petroleum Society Special Publications 1, pp. 163–185. https://doi.org/10.1016/B978-0-444-88607-1.50016-4.

NORWEGIAN JOURNAL OF GEOLOGY A flexural isostasy model for the Pleistocene evolution of the Barents Sea bathymetry 19
Vorren T.O., Lebesbye, E. & Larsen K.B. 1990: Geometry and genesis of the glacigenic sediments in the southern Barents Sea. Geological Society of London Special Publications 53, 269–288. https://doi.org/doi:10.1144/gsl.sp.1990.053.01.15.
Vorren, T.O., Richardsen, G. & Knutsen, S.M. 1991: Cenozoic erosion and sedimentationn in the western Barents Sea. Marine and Petroleum Geology 8, 317–340. https://doi.org/10.1016/0264-8172(91)90086-G.
Wood, R.J., Edrich, S.P. & Hutchison, I. 1989: Influence of North Atlantic Tectonics on the Large-Scale Uplift of the Stappen High and Loppa High, Western Barents Shelf. In Tankard A.J. & Balkwill, H.R. (eds.): Extensional Tectonics and Stratigraphy of the North Atlantic Margins, American Association of Petroleum Geologists Memoir 46, pp. 559–566.
Worsley, D. 2008: The post-Caledonian development of Svalbard and the western Barents Sea. Polar Research 27, 298–317. https://doi.org/10.1111/j.1751-8369.2008.00085.x.
Zattin, M., Andreucci, B., de Toffoli, B., Grigo, D. & Tsikalas, F. 2016: Thermochronological constraints to late Cenozoic exhumation of the Barents Sea Shelf. Marine and Petroleum Geology 73, 97–104. https://doi.org/10.1016/j.marpetgeo.2016.03.004.
Zieba, K. & Grøver, A. 2016: Isostatic response to glacial erosion, deposition and ice loading. Impact on hydrocarbon traps of the southwestern Barents Sea. Marine and Petroleum Geology 78, 168–183. https://doi.org/10.1016/j.marpetgeo.2016.09.009.
Zieba, K., Felix, M. & Knies, J. 2016: The Pleistocene contribution to the net erosion and sedimentary conditions in the outer Bear Island Trough, western Barents Sea. arktos 2, 1–17. https://doi.org/10.1007/s41063-016-0022-3.