A Five-Species 50K Axiom SNP Microarray Allows High ... · Dario Grattapaglia, Lucileide V....
37
Dario Grattapaglia, Lucileide V. Resende, Pedro Tanno, Alan Andrade and Orzenil B. Silva-Junior A Five-Species 50K Axiom SNP Microarray Allows High Quality Genotyping of Coffee, Cashew, Cassava, Brazilian Pine and Eucalyptus
Transcript of A Five-Species 50K Axiom SNP Microarray Allows High ... · Dario Grattapaglia, Lucileide V....

Dario Grattapaglia, Lucileide V. Resende, Pedro Tanno,
Alan Andrade and Orzenil B. Silva-Junior
A Five-Species 50K Axiom SNP Microarray Allows High Quality Genotyping of Coffee, Cashew,
Cassava, Brazilian Pine and Eucalyptus
• The identification of new sources of genetic variation is a key component of any long-term breeding strategy to increase the productivity, resilience and sustainability of crop varieties
• Over six million crop accessions are currently being conserved worldwide in still largely untapped genebanks
• High throughput, low cost and robust SNP genotyping technologies are necessary to unlock this wealth of diversity
• SNP data has to be simple, robust, reproducible and interchangeable across organizations to allow user friendly adoption by germplasm curators and breeders
Affordable SNP data needed for hundreds of crops, fruit and forest trees


Davey et al. Nat. Genet. Rev. 2011
GbS Genotyping-by-sequencing
methods
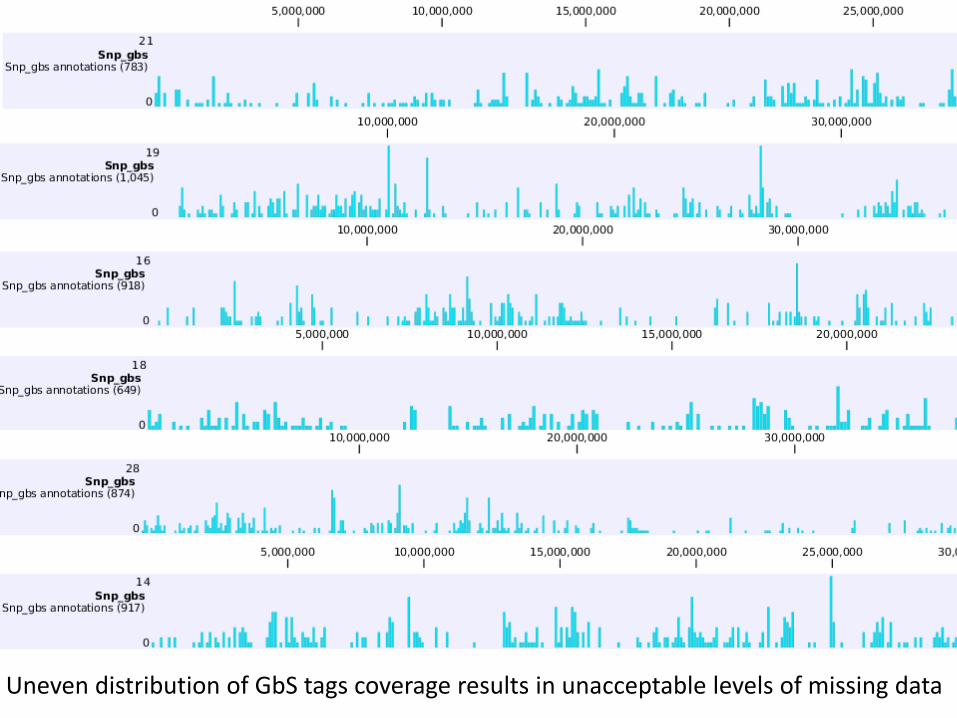
Uneven distribution of GbS tags coverage results in unacceptable levels of missing data
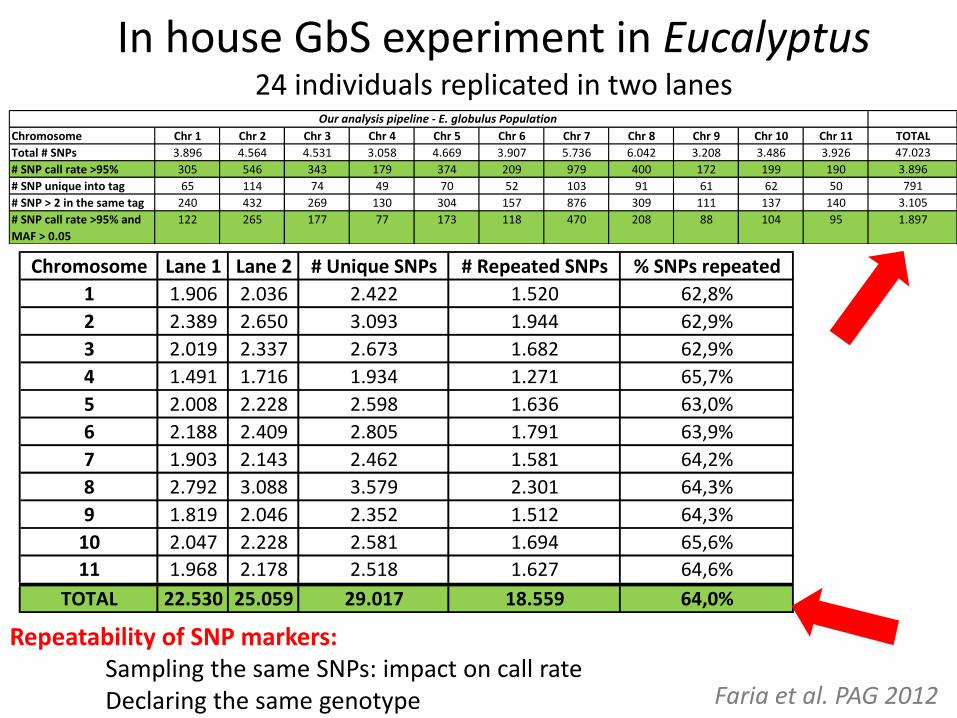
In house GbS experiment in Eucalyptus 24 individuals replicated in two lanes
Chromosome Lane 1 Lane 2 # Unique SNPs # Repeated SNPs % SNPs repeated
1 1.906 2.036 2.422 1.520 62,8%
2 2.389 2.650 3.093 1.944 62,9%
3 2.019 2.337 2.673 1.682 62,9%
4 1.491 1.716 1.934 1.271 65,7%
5 2.008 2.228 2.598 1.636 63,0%
6 2.188 2.409 2.805 1.791 63,9%
7 1.903 2.143 2.462 1.581 64,2%
8 2.792 3.088 3.579 2.301 64,3%
9 1.819 2.046 2.352 1.512 64,3%
10 2.047 2.228 2.581 1.694 65,6%
11 1.968 2.178 2.518 1.627 64,6%
TOTAL 22.530 25.059 29.017 18.559 64,0%
Chromosome Chr 1 Chr 2 Chr 3 Chr 4 Chr 5 Chr 6 Chr 7 Chr 8 Chr 9 Chr 10 Chr 11 TOTAL
Total # SNPs 3.896 4.564 4.531 3.058 4.669 3.907 5.736 6.042 3.208 3.486 3.926 47.023
# SNP call rate >95% 305 546 343 179 374 209 979 400 172 199 190 3.896
# SNP unique into tag 65 114 74 49 70 52 103 91 61 62 50 791
# SNP > 2 in the same tag 240 432 269 130 304 157 876 309 111 137 140 3.105
# SNP call rate >95% and
MAF > 0.05
122 265 177 77 173 118 470 208 88 104 95 1.897
Our analysis pipeline - E. globulus Population
Faria et al. PAG 2012
Repeatability of SNP markers: Sampling the same SNPs: impact on call rate Declaring the same genotype
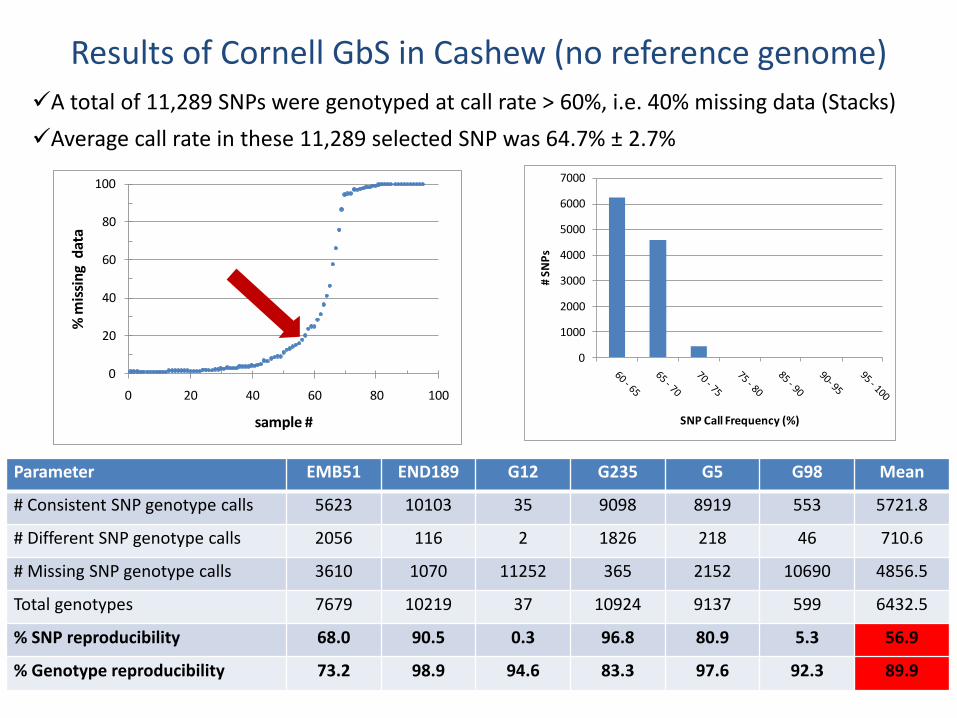
Results of Cornell GbS in Cashew (no reference genome)
A total of 11,289 SNPs were genotyped at call rate > 60%, i.e. 40% missing data (Stacks)
Average call rate in these 11,289 selected SNP was 64.7% ± 2.7%
0
20
40
60
80
100
0 20 40 60 80 100
% m
issi
ng
dat
a
sample #
0
1000
2000
3000
4000
5000
6000
7000
# SN
Ps
SNP Call Frequency (%)
Parameter EMB51 END189 G12 G235 G5 G98 Mean
# Consistent SNP genotype calls 5623 10103 35 9098 8919 553 5721.8
# Different SNP genotype calls 2056 116 2 1826 218 46 710.6
# Missing SNP genotype calls 3610 1070 11252 365 2152 10690 4856.5
Total genotypes 7679 10219 37 10924 9137 599 6432.5
% SNP reproducibility 68.0 90.5 0.3 96.8 80.9 5.3 56.9
% Genotype reproducibility 73.2 98.9 94.6 83.3 97.6 92.3 89.9

• 76% of the predicted ApeKI cut sites were not sampled • In the maize genome with 23 million ApeKI GbS reads/individual = 30% missing data • GbS highly dependent on data imputation (not an option for highly variable trees) • Solution: much higher target coverage necessary – higher cost per sample
Beissinger et al. Genetics 2013

Myles S. 2013 Trends in Genetics
Examples of the challenges associated with calling genotypes from genotyping-by-sequencing (GBS) data
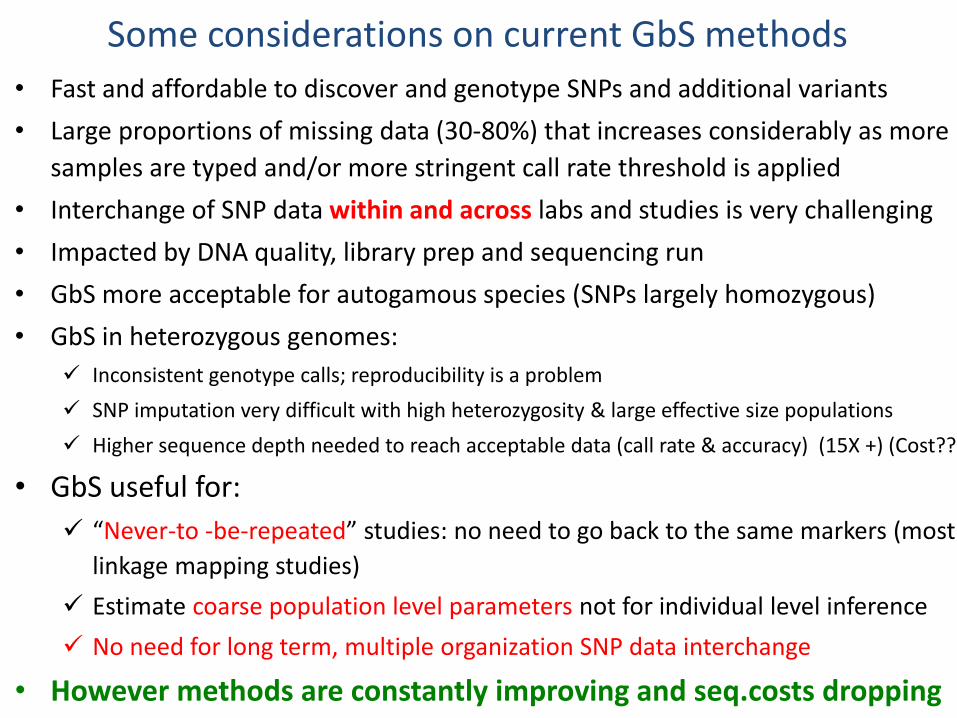
• Fast and affordable to discover and genotype SNPs and additional variants
• Large proportions of missing data (30-80%) that increases considerably as more
samples are typed and/or more stringent call rate threshold is applied
• Interchange of SNP data within and across labs and studies is very challenging
• Impacted by DNA quality, library prep and sequencing run
• GbS more acceptable for autogamous species (SNPs largely homozygous)
• GbS in heterozygous genomes:
Inconsistent genotype calls; reproducibility is a problem
SNP imputation very difficult with high heterozygosity & large effective size populations
Higher sequence depth needed to reach acceptable data (call rate & accuracy) (15X +) (Cost??)
• GbS useful for:
“Never-to -be-repeated” studies: no need to go back to the same markers (most
linkage mapping studies)
Estimate coarse population level parameters not for individual level inference
No need for long term, multiple organization SNP data interchange
• However methods are constantly improving and seq.costs dropping
Some considerations on current GbS methods

Eucalyptus genome
Myburg, Grattapaglia, Tuskan et al. Nature 2014

EuCHIP60k development
• For robust, long term, breeder-friendly data interchangeble implementation of GS in Eucalyptus we needed:
– Genome-wide marker density
– High assay reproducibility
– Informative SNPs across the BIG TEN Eucalyptus sp.
– Speed of data delivery
– Public access, world use and platform transferable
– Low cost per sample
• “Crowd funding”: eucalypt forest companies worldwide
• 240 tree genomes of 13 species resequenced at 3.5X/tree
• 46M SNPs – 64K on chip, 61K converted
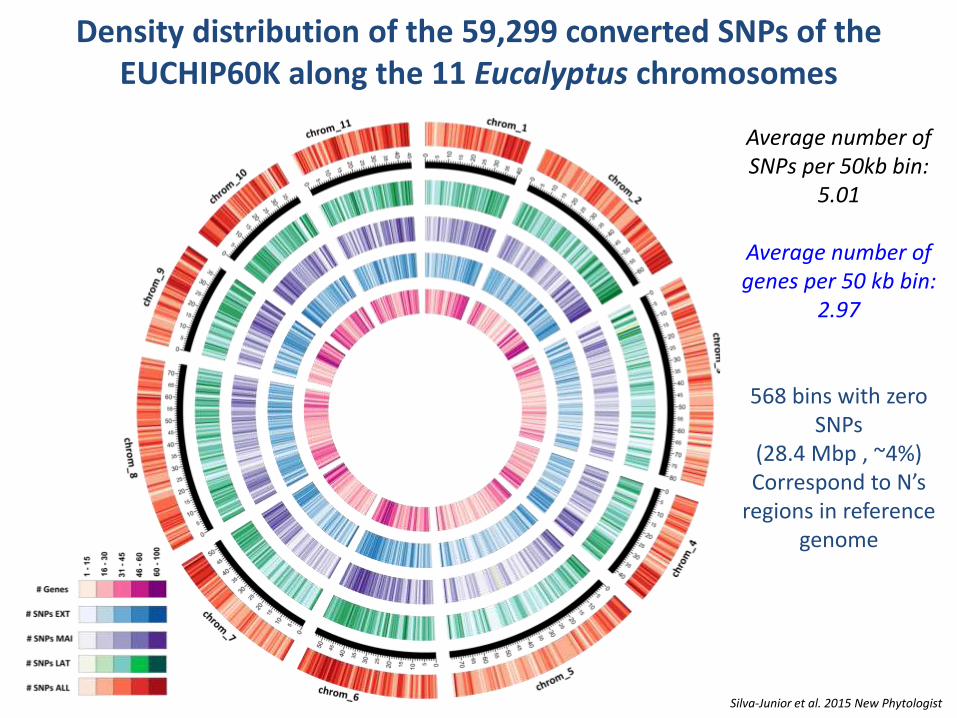
Density distribution of the 59,299 converted SNPs of the EUCHIP60K along the 11 Eucalyptus chromosomes
Silva-Junior et al. 2015 New Phytologist
Average number of SNPs per 50kb bin:
5.01
Average number of genes per 50 kb bin:
2.97
568 bins with zero SNPs
(28.4 Mbp , ~4%) Correspond to N’s
regions in reference genome
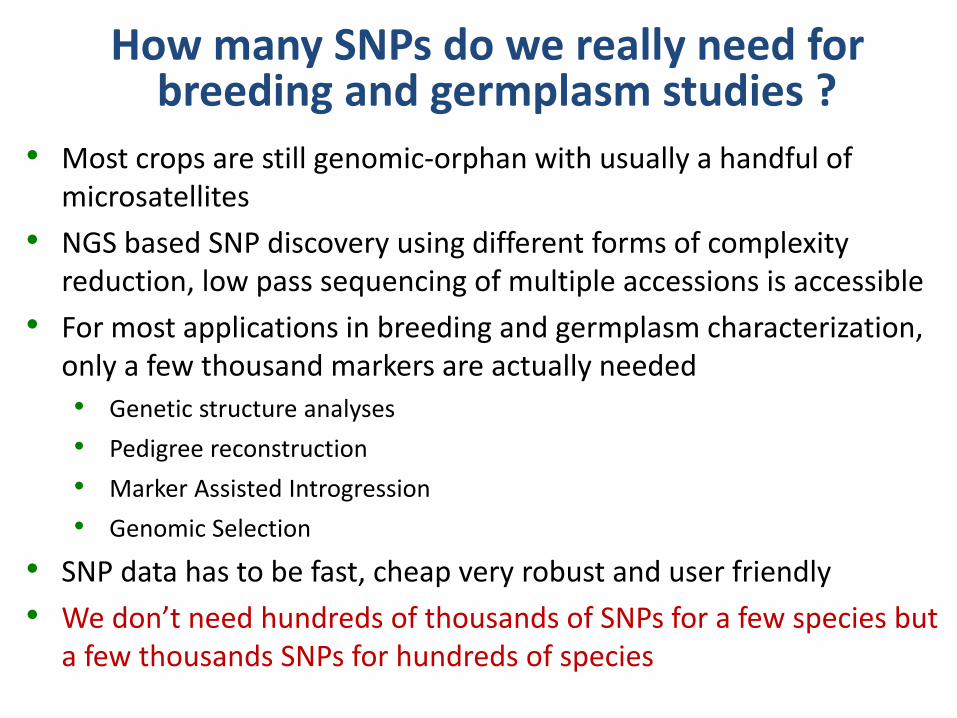
• Most crops are still genomic-orphan with usually a handful of microsatellites
• NGS based SNP discovery using different forms of complexity reduction, low pass sequencing of multiple accessions is accessible
• For most applications in breeding and germplasm characterization, only a few thousand markers are actually needed
• Genetic structure analyses
• Pedigree reconstruction
• Marker Assisted Introgression
• Genomic Selection
• SNP data has to be fast, cheap very robust and user friendly
• We don’t need hundreds of thousands of SNPs for a few species but a few thousands SNPs for hundreds of species
How many SNPs do we really need for breeding and germplasm studies ?

Germplasm Inventory
Total: 152,873 accessions (141 Active Germplasm Banks) 700 species 300 genera Largest collections (# accessions): Rice: 27,050 Bean: 18,447 Soybean: 18,024 Wheat: 15,118 Sorghum: 7,215 Cowpea: 3,942 Maize: 3,922 ... Basic Seed collection: 122,000 accessions

Glaszmann et al. 2010 COPB

Glaszmann et al. 2010 COPB

• Underutilized sources of genetic variation • Selection imprints • Heterotic patterns (maize) • Hidden translocations (wheat) • Rare recombinants
• Breeder-ready lines and populations with new, beneficial alleles for priority characters in elite genetic backgrounds
• Molecular markers linked to beneficial alleles and statistical models for estimating breeding values to accelerate genetic progress in breeding programs
• Novel, beneficial alleles, haplotypes • Markers linked to loci and alleles that
control priority traits • Genetically distinct ‘donor accessions’
Molecular atlases Asociación genómica
Novel alleles and allele donors
‘Bridging germplasm’
1 2
3 Elite germplasm
selected by breeders
New breeding approaches and
technologies; new tools such as GS
Seeds of Discovery (SeeD)
Slide kindly provided by
Dr. Peter Wenzl

• Coffee (Coffea canephora) • Genome size: 710 Mb – Genome assembly available
• SNP discovery from pooled whole-genome resequencing of 80 accessions
• Cashew (Anacardium occidentale) • Genome size: 488 Mb – Draft reference genome built by our group (Nut & Fruit Workshop
PAG2017)
• SNP discovery from whole-genome individual resequencing of 25 diverse accessions
• 18 M GATK SNP; 9.9 M filtered and recalibrated
• Cassava (Manihot esculenta) • Genome size: 742 Mb - Draft reference genome available
• SNP discovery from 20 resequenced accessions by JGI (NCBI data)
• Brazilian Pine (Araucaria angustifolia) • Genome size 24 Gbp; no reference genome
• SNP discovery from reduced representations RAD and RNAseq data
• Eucalyptus (Eucalyptus grandis) • Genome size: 640 Mb; Draft reference genome available
• Validated SNPs from Infinium chip
Species, genomes and SNPs for multi-species Axiom array

SNP categories in Axiom suite analysis

Axiom array conversion statistics
Metric Coffee Cashew Cassava Pine Eucalypt TOTAL
# SNPs selected for array 25,456 16,504 3,417 3,400 2,000 50,777
# individuals genotyped 767 671 192 192 96 1918
# individuals passed 744 602 191 185 95 1817
High resolution polymorphic 19,586 12,437 2,382 1,650 1,572 37,627
No minor homozygous 2,603 560 423 57 5 3,648
High resolution monomorphic 1,396 341 409 814 1 2,961
Call rate below threshold 241 539 41 178 250 1,249
Off target variants 488 678 44 33 34 1,277
Other 1,142 1949 118 668 138 4,015
# Converted SNPs 23,585 13,338 3,214 2,521 1,578 44,236
Effective conversion rate (%) 93 81 94 74 79 88
Reproducibility (%) 99.97 99.92 99.98 99.92 99.94 99.95

The Cashew fruit
Pseudo-fruit (hypertrophied pedicel)
a.k.a Apple
True fruit (kidney shaped achene)
Cashew Nuts Seed kernel after shelling

Cashew progeny trial Cashew grafted plants
Cashew fruit and nut diversity Cashew fruit and nut products
Cashew plantation
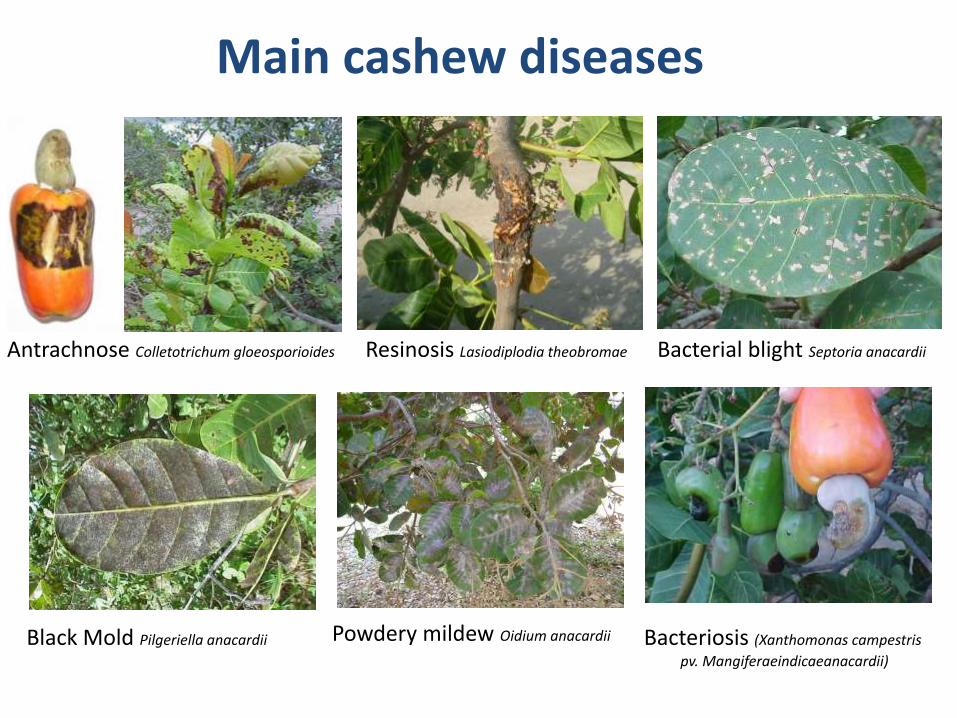
Antrachnose Colletotrichum gloeosporioides
Black Mold Pilgeriella anacardii
Resinosis Lasiodiplodia theobromae
Bacteriosis (Xanthomonas campestris
pv. Mangiferaeindicaeanacardii)
Powdery mildew Oidium anacardii
Bacterial blight Septoria anacardii
Main cashew diseases
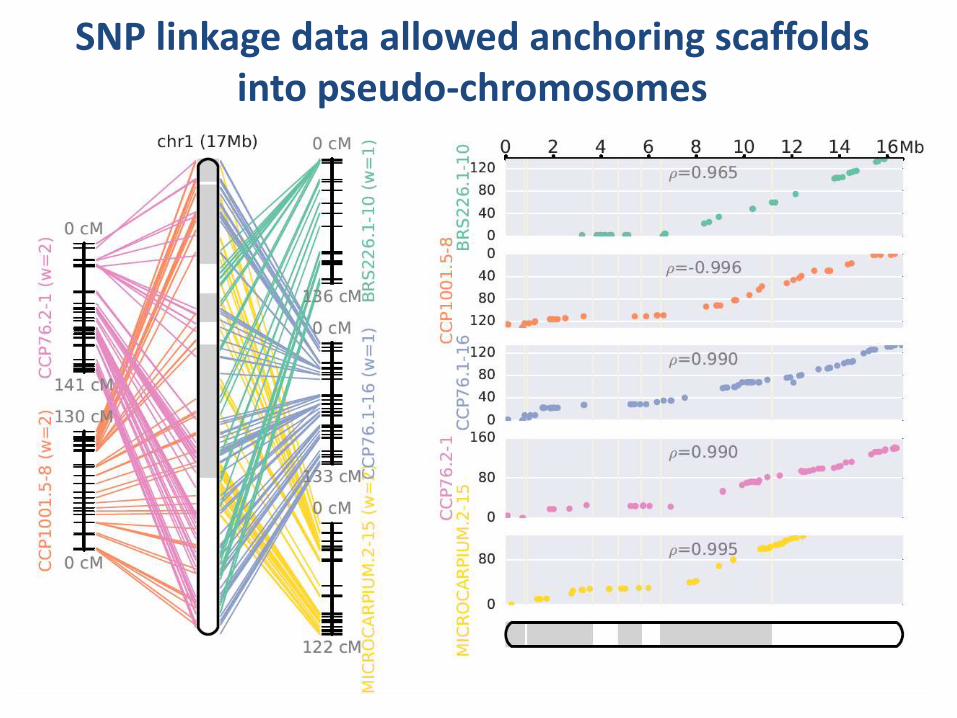
SNP linkage data allowed anchoring scaffolds into pseudo-chromosomes
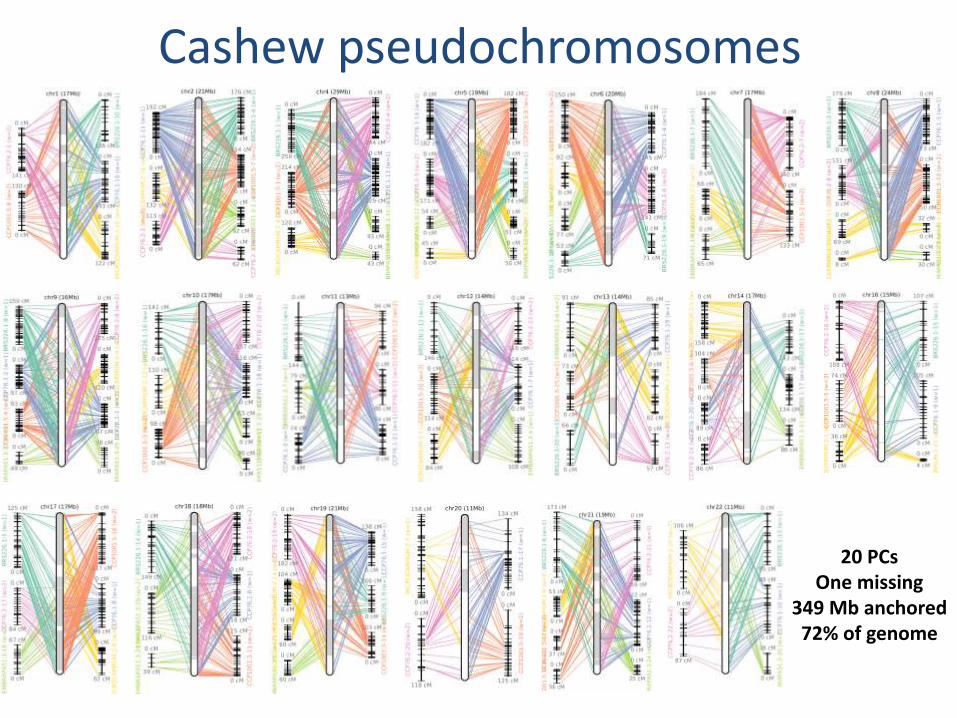
Cashew pseudochromosomes
20 PCs One missing
349 Mb anchored 72% of genome
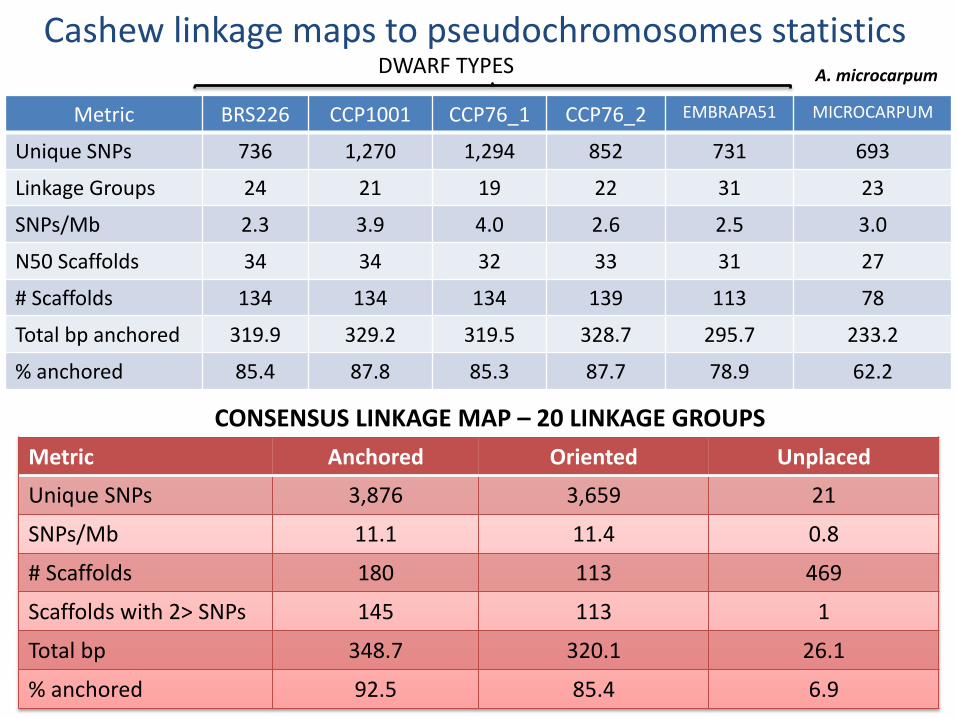
Cashew linkage maps to pseudochromosomes statistics
Metric BRS226 CCP1001 CCP76_1 CCP76_2 EMBRAPA51 MICROCARPUM
Unique SNPs 736 1,270 1,294 852 731 693
Linkage Groups 24 21 19 22 31 23
SNPs/Mb 2.3 3.9 4.0 2.6 2.5 3.0
N50 Scaffolds 34 34 32 33 31 27
# Scaffolds 134 134 134 139 113 78
Total bp anchored 319.9 329.2 319.5 328.7 295.7 233.2
% anchored 85.4 87.8 85.3 87.7 78.9 62.2
DWARF TYPES A. microcarpum
Metric Anchored Oriented Unplaced
Unique SNPs 3,876 3,659 21
SNPs/Mb 11.1 11.4 0.8
# Scaffolds 180 113 469
Scaffolds with 2> SNPs 145 113 1
Total bp 348.7 320.1 26.1
% anchored 92.5 85.4 6.9
CONSENSUS LINKAGE MAP – 20 LINKAGE GROUPS

SNP data provide higher resolution and precision and less biased population structure inferences in Araucaria natural populations
Marker type
# Markers
Fst Gst (Hedrick standard.)
AMOVA (% variation among)
SSR 30 0.083 ± 0.015 0.148 ± 0.028
13.3
SNP 30 0.165 ± 0.030 0.292 ± 0.045
27.9
SNP 300 0.221 ± 0.012 0.371 ± 0.017
35.4
SNP 1643 0.186 ± 0.004 0.290 ± 0.006
31.0
Collection sites
Germplasm collection across 15 natural
populations
Need to estimate variation within and among
populations for conservation management
purposes
Microsatellites lead to substantial underestimates
of variation among populations despite using
corrected estimators (Gst)

Numerator relationship matrix (A matrix) EXPECTED PEDIGREES
Genomic relationship matrix (G matrix) REALIZED PEDIGREES
SNP based genomic relationship matrix resolved pedigree errors and revealed cryptic relatedness among selected cultivars
Cassava SNPs for Pedigree reconstruction
Cassava breeding advanced by open pollination in “Hybridization fields” Pedigrees are “expected” and no actual control of inbreeding and relatedness is possible SNP data used for parentage analysis and pedigree reconstruction (300 SNPs) SNP data planned for Genomic Selection and low resolution GWAS for disease traits

The (genomic) breeder`s equation
DG = i * r * sA
L *genotyping cost
DG = Response to selection i = selection intensity r = selection accuracy(correlation betweene stimated breeding value and true BV) sA = additive genetic standard deviation (additive genetic variation available) L = breeding cycle length
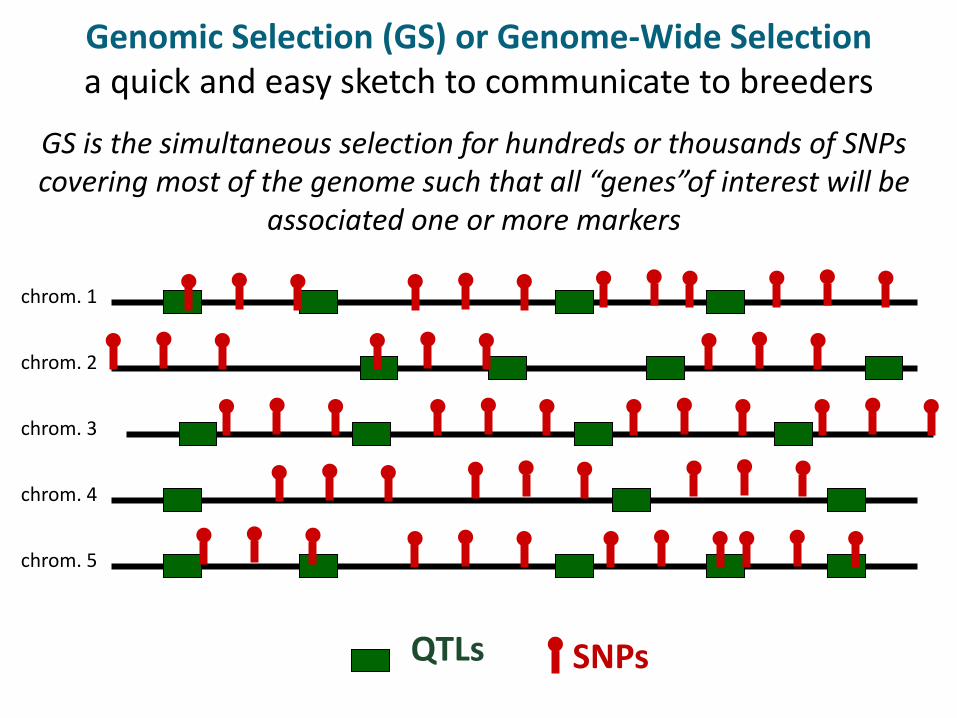
Genomic Selection (GS) or Genome-Wide Selection a quick and easy sketch to communicate to breeders
GS is the simultaneous selection for hundreds or thousands of SNPs covering most of the genome such that all “genes”of interest will be
associated one or more markers
QTLs SNPs
chrom. 1
chrom. 2
chrom. 3
chrom. 4
chrom. 5
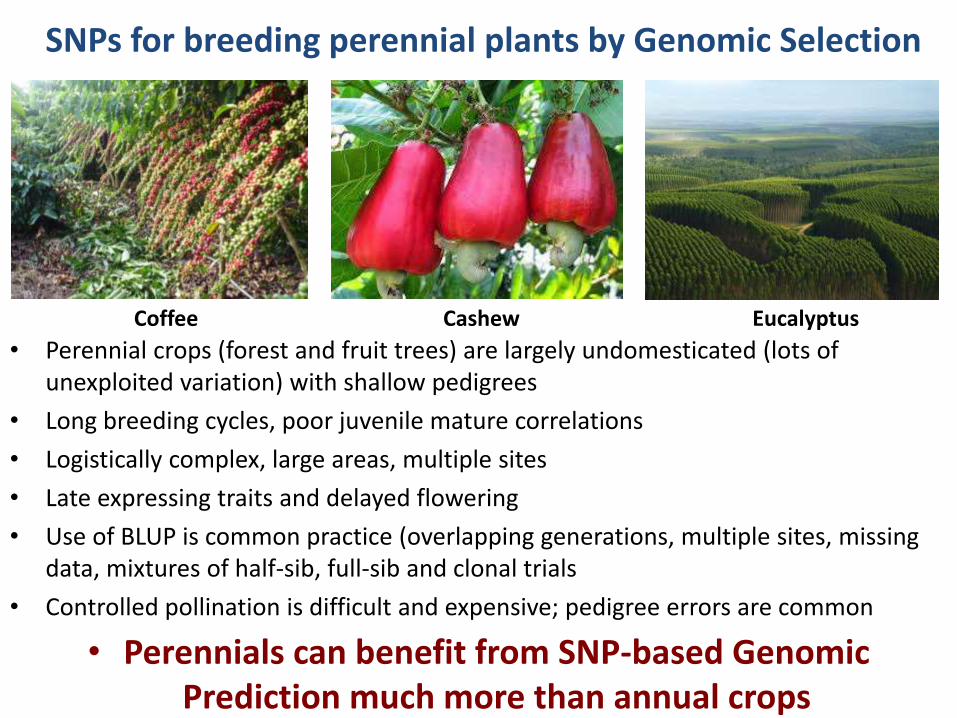
SNPs for breeding perennial plants by Genomic Selection
• Perennial crops (forest and fruit trees) are largely undomesticated (lots of unexploited variation) with shallow pedigrees
• Long breeding cycles, poor juvenile mature correlations
• Logistically complex, large areas, multiple sites
• Late expressing traits and delayed flowering
• Use of BLUP is common practice (overlapping generations, multiple sites, missing data, mixtures of half-sib, full-sib and clonal trials
• Controlled pollination is difficult and expensive; pedigree errors are common
• Perennials can benefit from SNP-based Genomic Prediction much more than annual crops
Coffee Cashew Eucalyptus
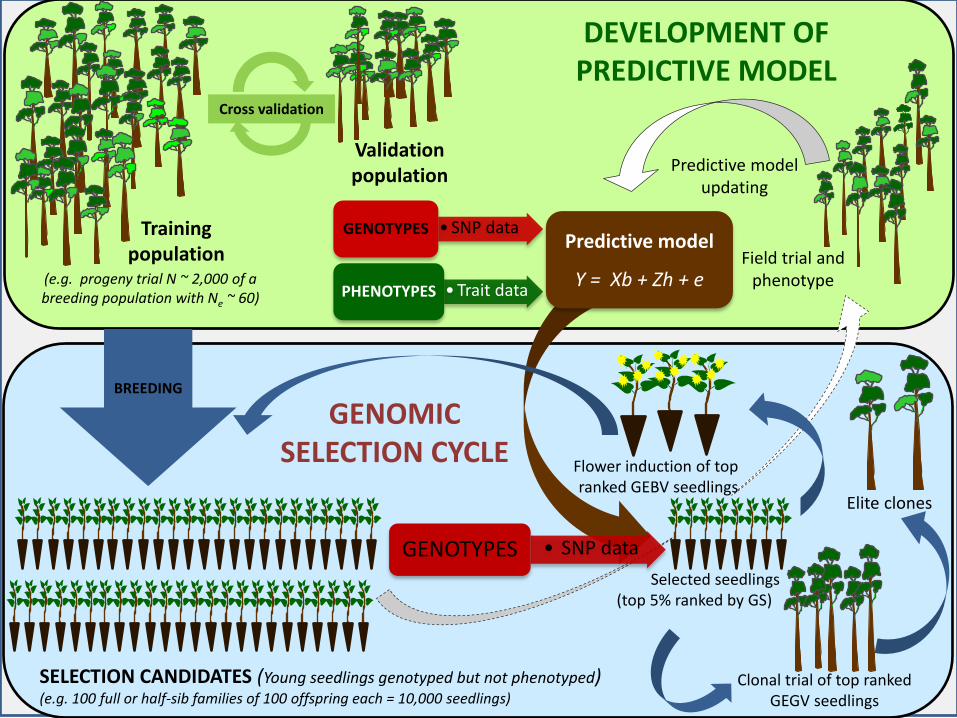
• SNP data GENOTYPES
• Trait data PHENOTYPES
Predictive model
Y = Xb + Zh + e
Cross validation
SELECTION CANDIDATES (Young seedlings genotyped but not phenotyped) (e.g. 100 full or half-sib families of 100 offspring each = 10,000 seedlings)
• SNP data GENOTYPES
Predictive model updating
GENOMIC SELECTION CYCLE
Elite clones
Selected seedlings (top 5% ranked by GS)
Field trial and phenotype
Clonal trial of top ranked GEGV seedlings
Flower induction of top ranked GEBV seedlings
BREEDING
DEVELOPMENT OF PREDICTIVE MODEL
(e.g. progeny trial N ~ 2,000 of a breeding population with Ne ~ 60)
Training population
Validation population

Breeding population
Breeding
Selection candidates
SNP data GS model
Selected seedlings
GEBV Flower induction
Improved population
GEGV
Breeding population
Breeding
Selection candidates
Progeny test
Year 0
1
2
3
4
5
6
7
8
Selection of elite clones
Breeding
Selection candidates
Selected seedlings
Phenotypes for model updating
9
10
11
12
13
14
Selected trees GV
15
BV
Grafted orchard
Improved population
GENOMIC SELECTION BREEDING PHENOYTPIC SELECTION BREEDING
Field plant in exper. design
Phenotypes for model updating
Breeding
Selection candidates
Progeny test
GEGV
SNP data GS model
GEBV Flower induction
Improved population
Breeding
Selection candidates
Selected seedlings
SNP data GS model
GEBV Flower induction
Improved population
Field plant in exper. design
GEGV
Verification clonal trial
Verification clonal trial
Verification clonal trial
Verification clonal trial
Nursery
Nursery
Selection of elite clones
Selection of elite clones
Grattapaglia 2014. Advances in Genomics of Plant Genetic Resources. Chapter 26. Springer. DOI 10.1007/978-94-007-7572-5_26

Summary • There is an urgent need to develop robust, high throughput SNP
platforms for hundreds of plant species
• SNP discovery is currently very affordable and accessible using NGS with or without reference genome
• SNP data has to be genome-wide, affordable, simple, fast, interchangeable across institutions
• SNP data will allow a vast array of applications in germplasm characterization, genomic prediction, gene discovery, operational breeding
• Multi-species arrays allow sharing the upfront cost of array development and provide great flexibility, low cost and high quality data

Genomic Selection to boost existing breeding programs of Brazilian tropical fruit crops
Passion Fruit Passiflora edulis Passifloraceae
Genome: 1500 Mb Diploid
Mangaba Hancornia speciosa
Apocynaceae Genome: 500 Mb
Diploid
Guava Psidium guyava
Myrtaceae Genome: 240 Mb
Diploid
Pitanga Eugenia uniflora
Myrtaceae Genome: 240 Mb
Diploid
• Draft assembly
• Resequencing pool of diversity
Genome
• SNP discovery
• Multispecies chip
SNP Resource
• Model development
• Operational use in breeding
Genomic Selection
Cashew Anacardium
Anacardiaceae Genome: 500 Mb
Diploid

Acknowledgments
Funding
Brazilian National Research Council
Brazilian Corporation of Agricultural Research
Federal District Research Foundation
Service providers
part of Thermo Fisher Scientific