A finite element study on Plastic deformation of ... · A finite element study on Plastic...
13
A finite element study on Plastic deformation of Suspension Bushing Sayfa 1 A finite element study on Plastic deformation of Suspension Bushing A.K.Serbest a , S.Kayaci b Las-Par Rubber Components & Development Ltd. Co. Akcalar Industrial Zone Kale St. No:10 16225 Nilufer/Bursa/Turkey Abstract Force-Displacement data of elastic and plastic regions were collected with tensile test of flat metal alloy specimen. After simplification of collected data, engineering and true stress-strain values of specified materials were obtained. The data, obtained in the tensile of flat specimens, were applied to the finite element model of specimen to perform a finite element analysis (FEA). Results, which were collected in tensile test and calculated by FEA, were compared to evaluate the accuracy of obtained stress-strain values and FEA application. After data and application verification, obtained data applied to a FEA model of suspension bushing, whose serial production is in progress. The actual results obtained from the serial parts and the results obtained in FEA were compared to introduce the consistency of computational results. At the end of this study, a material library for a steel alloy has been created for FEA calculations, by using the collected and simplified stress-strain data for the steel alloy mentioned. 1. Introduction During product design phases, production materials are to be determined according to its mechanical properties and working conditions. Determination of material properties is the most important point for this kind of design studies. Tensile test is an indispensable examination method of determining the mechanical properties of a material. It supplies mechanical properties of materials; which are needed for static and quasi static loading of machine and systems. Indeed it is applied to determine the maximum amount of force per unit cross-sectional area, elastic and plastic behavior of materials under an increasing load and strain change behavior. [1]. Tensile tests are comparable because they are carried out according to national and international standards. Today, tensile tests can be applied more precisely and accurately because of the developments in test methods and testing devices than past. In today’s engineering problems, conceptual designs can be solved with high accuracy by the benefit of FEM and other similar numerical methods without physical model production. FEM is a numerical method, which is used to solve complex and difficult engineering problems with a negligible error. The reason of widely usage of FEA, its easy algorithm for computer applications and its application areas like static analysis, fluid mechanics, heat transfer, electromagnetic analysis and acoustics. With the spread of computer use and techniques, computer softwares written are diversified for the FEA. The variations like material models and element types of FEA, has been developed for getting closer results to real results. Success of FEA results depends on correct and usable material data. Today, metal alloys have a widely usage in every area. In this study, mechanical data collected from tensile test specimen which made of metal alloy. These collected data were edited a Corresponding Author “[email protected]”
Transcript of A finite element study on Plastic deformation of ... · A finite element study on Plastic...

A finite element study on Plastic deformation of Suspension Bushing Sayfa 1
A finite element study on Plastic deformation of Suspension Bushing
A.K.Serbest a, S.Kayaci b
Las-Par Rubber Components & Development Ltd. Co. Akcalar Industrial Zone Kale St. No:10
16225 Nilufer/Bursa/Turkey
Abstract
Force-Displacement data of elastic and plastic regions were collected with tensile test of flat
metal alloy specimen. After simplification of collected data, engineering and true stress-strain values
of specified materials were obtained. The data, obtained in the tensile of flat specimens, were
applied to the finite element model of specimen to perform a finite element analysis (FEA). Results,
which were collected in tensile test and calculated by FEA, were compared to evaluate the accuracy
of obtained stress-strain values and FEA application. After data and application verification, obtained
data applied to a FEA model of suspension bushing, whose serial production is in progress. The actual
results obtained from the serial parts and the results obtained in FEA were compared to introduce
the consistency of computational results. At the end of this study, a material library for a steel alloy
has been created for FEA calculations, by using the collected and simplified stress-strain data for the
steel alloy mentioned.
1. Introduction
During product design phases, production materials are to be determined according to its
mechanical properties and working conditions. Determination of material properties is the most
important point for this kind of design studies. Tensile test is an indispensable examination method
of determining the mechanical properties of a material. It supplies mechanical properties of
materials; which are needed for static and quasi static loading of machine and systems. Indeed it is
applied to determine the maximum amount of force per unit cross-sectional area, elastic and plastic
behavior of materials under an increasing load and strain change behavior. [1]. Tensile tests are
comparable because they are carried out according to national and international standards. Today,
tensile tests can be applied more precisely and accurately because of the developments in test
methods and testing devices than past.
In today’s engineering problems, conceptual designs can be solved with high accuracy by the
benefit of FEM and other similar numerical methods without physical model production. FEM is a
numerical method, which is used to solve complex and difficult engineering problems with a
negligible error. The reason of widely usage of FEA, its easy algorithm for computer applications and
its application areas like static analysis, fluid mechanics, heat transfer, electromagnetic analysis and
acoustics. With the spread of computer use and techniques, computer softwares written are
diversified for the FEA. The variations like material models and element types of FEA, has been
developed for getting closer results to real results. Success of FEA results depends on correct and
usable material data.
Today, metal alloys have a widely usage in every area. In this study, mechanical data
collected from tensile test specimen which made of metal alloy. These collected data were edited
a Corresponding Author “[email protected]”

A finite element study on Plastic deformation of Suspension Bushing Sayfa 2
and converted to a form to use in FEA and therefore to create a material library. By the help of
obtained data, elastic and plastic behaviors of metal alloys were defined. Defined material model is
used in FEA of a real suspension bushing. FEA calculations and serial production results were
compared to determine the accuracy of study.
2. Experimental Arrangements and Calculations
Figure 1 shows the test specimen, which was prepared according to DIN EN ISO 6892-1
standart. The specimens were prepared with laser cut according to the dimensions of the specified
standard with an offset then CNC milling machine is used to remove the additional material exposed
to heat in laser cut process also to give the final dimensions stated in the standard.
(a)
(b)
Figure 1 - Tensile Test Specimen (a), (b)
UTEST universal test machine is used for all tensile tests. Test machine has a 250 kN load
capacity. Physical extensometer is used for measurement of elongation.
As a result of tensile tests, load-displacement data of specimens were collected.
2.1. Tensile Tests and Collection of Load-Displacement data.
The specimens prepared according to DIN EN ISO 6892-1 were tested until failure in the test
machine and corresponding load displacement data were collected (Graph 1). Data is used to
determine the true stress-strain data of material to define the material model in FEA [2]. Engineering
stress-strain values are calculated with an assumption that the cross-section remains constant during
tensile test. True stress-strain values are calculated, based on the fact that the volume remains
constant, using the instantaneous cross-sectional area Formula 1, 2 and 3 are used to obtain true
stress-strain data.

A finite element study on Plastic deformation of Suspension Bushing Sayfa 3
Graph 1 - Load-Displacement Curve obtained from Test Specimen
(1)
(2)
(3)
Where, Ai is instantaneous cross-sectional area, A0 is initial cross-sectional area, L0 is initial
parallel length, Fi is instantaneous force, σt is real stress and εt is real strain.
0
2500
5000
7500
10000
12500
0 2 4 6 8 10 12 14 16 18
Load
(N
)
Displacement (mm)
Load - Displacement Curve

A finite element study on Plastic deformation of Suspension Bushing Sayfa 4
Graph 2 - Obtaioned Stress-Strain Graphs
With the help of obtained values, tensile strength, ultimate strength was determined and
elasticity modulus calculated with formula 4. (Hookes Law)
(4)
Where E is elasticity modulus, σy is stress at yield and εy is strain at yield. Modulus of
elasticity was calculated as an average of three different specimens to be 206 GPa.
2.2. Usage of obtained Tensile Test values in Finite Element Model
MSC.Patran 2008 interface was used to prepare the finite element model of test specimen.
2712 Hex8 element are used in FEM. The aim of fine mesh usage in the middle of the specimen is to
get more precise results at large deformation expected areas. (Figure 2)
Figure 2 - FEM of Test Specimen
True stress-strain values, which obtained from load-displacement data of tensile tests, were
used for material data in FEA. MSC.Patran 2008 is used to define elastic and plastic behaviors of
material, for MSC.Marc 2008 r1 solver.
Elasticity modulus: 206GPa and Poisson Ratio: 0,30 were used for elastic behavior of
material.
Plastic region of true stress-strain curve, which is obtained from test specimen, was used to
define the plastic behavior of material. (Graph 3)
0
50
100
150
200
250
300
350
400
0 5 10 15 20 25
Stre
ss (
N/m
m²)
Strain %
Stress-Strain Graph
Engineering
True

A finite element study on Plastic deformation of Suspension Bushing Sayfa 5
Graph 3 - Plastic Section Curve
Plastic section data inputs was done in MSC.Patran 2008 interface with “Fields-Material
Property” tab as “Strain=e”. The important point of material data input is that strain (e) value must
begin with value “0”. [2] Then, plastic range behavior assigned to material at tab “Materials-Input
Properties-Plastic”. “Piecewise Linear” option used for “Strain Rate Method”. Corresponding
attributes of this option is explained deeply in reference [2]. Basically, it is associated with work
hardening. After completion of material property inputs, it is expected that, the behavior of material
must be according to Hookes Law if part subjected by a force in only elastic region and must follow
Plastic curve if part is subjected by a force in plastic region.
2.3. Comparison of Tensile Test Results and FEA Results
According to comparison of tensile test results and FEA results, it is easy to see that, data
collection and application processes are successfully performed.
Figure 3 - Tensile Test Results with FEA
050
100150200250300350400450
0 0,05 0,1 0,15 0,2 0,25
Tru
e S
tre
ss (
N/m
m²)
True Strain (-)
Plastic Region
Patran

A finite element study on Plastic deformation of Suspension Bushing Sayfa 6
(a) (b)
Graph 4 - MSC Marc (a) and Tensile Test (b) Load-Displacement Graphs
Graph 5 - Comparison Graphs for Tensile Test and FEA Results
0
2000
4000
6000
8000
10000
12000
14000
0 2 4 6 8 10 12
Load
(N
)
Displacement (mm)
MSC Marc vs Tensile Test
MSC Marc
Tensile Test
0
2500
5000
7500
10000
12500
15000
0 2 4 6 8 10 12
Load
(N
)
Displacement (mm)
MSC Marc
0
2500
5000
7500
10000
12500
15000
0 2 4 6 8 10 12
Load
(N
)
Displacement (mm)
Tensile Test

A finite element study on Plastic deformation of Suspension Bushing Sayfa 7
Tensile Test FEA % Error
Displacement (mm)
Load (N) Displacement (mm)
Load (N) Load
1 0,1279984 9630 0,12799048 9591,9063 -%0,40
2 2,038002 10660 2,0385141 10480,898 -%1,70
3 4,057999 11400 4,0490518 11254,372 -%1,29
4 5,968002 11850 5,9656715 11720,451 -%1,11
5 7,968002 12080 7,9670215 12008,695 -%0,60
6 10,662 12120 10,6596 12136,8260 +%0,14
Table 1 - Comparison table for Tensile Test and FEA Results
2.4. FEA application on a real Suspension Bushing with obtained material values
A FEA is performed on a real suspension bushing to verify created material values.
Suspension bushing has 4 sub-components which are listed below. (Table 2)
Part Name Material Note
1 Inner Tube DIN 2393 ST37.2 BK 1 Part, 60 mm length pre-shaped
2 Inter leaf EN 10130 / BS 1449 CR1 2 Part, 1,2mm thickness pre-shaped
3 Outer Tube DIN 2393 St37.2 BK 1 Part, 41mm length
4 Rubber 70ShA Natural Rubber
Table 2 - Parts of Suspension Bushing
After production of suspension bushing in vulcanization presses, some plastic deformation
processes are applied on the part to get the finished product.

A finite element study on Plastic deformation of Suspension Bushing Sayfa 8
Figure 4 - Suspension Bushing after Vulcanization
Aim of plastic deformation processes after vulcanization is to increase the durability of
rubber section of the complete part. Firstly end-forming process is applied to both ends of the outer
tube. (Figure 6a) With this process, rubber material is partially trapped in outer tube. Then outer
tube is swaged inwards in radial direction. (Figure 6b) This process applies a pre-compression on
part. Metal alloys make a spring-back movement while plastic deformation if the applied force
removed. So metals need are to be subjected to smaller or larger geometrical tools than required to
get proper final dimensions.
(a) (b)
Figure 5 - End-Forming Tool (a), Swaging (b)

A finite element study on Plastic deformation of Suspension Bushing Sayfa 9
Figure 6 - Final Suspension Bushing
At final part, end-forming angel is 45°, outer tube length is 39mm. After vulcanization outer
dimension of outer tube is 61,1mm and after swaging operation this dimension is 60,1mm. In end-
forming process ends of outer tube subjected with angle 49° and in swaging process outer tube is
swaged to 59,9 mm diameter. After both processes, part makes a spring-back move and gets its final
dimensions. (Figure 6) The material model discussed in the previous section is used to define the
material behavior of outer tube, the material model of rubber is taken from a previous study made
by S.Kayaci et al. [3] In this study, mechanical properties of rubber materials were defined by a two-
coefficients Mooney-Rivlin formula.
All plastic deformation processes, which are using in serial production, are applied in FEA.
FEM model is shown in Figure 7. 1/8 of model has prepared for analysis by using symmetry boundary
conditions. 47480 Hex 8 elements are used for FEM. During analysis, first rigid body 1 performs end-
forming process and turns back to its initial place to release the load. Then rigid body 2 performs
swaging process and it also turns back. Analysis is completed by these two phases.
Figure 7 - FEM of Suspension Bushing
Dış Burç
Kauçuk
Ara Sac
İç Burç

A finite element study on Plastic deformation of Suspension Bushing Sayfa 10
3. Results and Discussions
Results of this study shown in Table 3, Fig. 8, 9 and 10. Two dimensions are used to compare
results. Displacement results are multiplied by 2 due to the symmetrical boundaries to find the
diameter and length results. Table 3 shows a comparison between real results and FEA results.
Results have an acceptable deviation. According to these results, obtained material data can be used
for a material library creation.
Dimension After Vulcanization (mm)
Required (mm)
FEA Result (mm)
Deviation %
Image
Outer Diameter
61,4 60,182 +0,137 Figure 11 –
(a) Outer Tube
Length 41 39 39,776 +1,980 Figure 11 –
(b)
Table 3 - Dimensional Comparison Table
(a) (b)
Figure 8 - End-Forming Von misses Stress, (a) Full Load, (b) Load Removed
Figure 8 shows von misses stress distribution on the part. Maximum stress value at full load
case (Figure 8a) is around 391MPa. This value is closed the maximum point of entered Plastic stress
curve. If load is released, the maximum residual stress can be read around 340 MPa.

A finite element study on Plastic deformation of Suspension Bushing Sayfa 11
(a) (b)
Figure 9 - After Swaging Von misses Stress, (a) Full Load, (b) Load Removed
Von misses stress distribution is shown in Figure 9 for swaging operation. Maximum von
misses stress value is around 380 MPa under full load. Residual stress is around 375 MPa when load
is removed. Both residual stress values are placed under ultimate point FEA result geometries are
nearly similar to real part. (Figure 10)
Figure 10 - Final Part and After Vulcanization Part

A finite element study on Plastic deformation of Suspension Bushing Sayfa 12
(a) (b)
Figure 11 - Final Part Displacement Results, (a) Y Direction, (b) X Direction
4. Conclusion
For manufacturers who manufacture their own raw materials, want to determine the
mechanical properties of own raw materials, is inevitable. Raw material suppliers generally serve
only generalized material properties with a wide range. In design and product development process,
it is hard to get proper design requirements with these generalized material properties. The material
library which was created in this study can be used for FEA to get more precise and proper results.
Reference [3] for rubber materials and this study for metal alloys give us road maps for creating
material libraries. The methodology of these studies can be used for other possible engineering
materials’ characterization.
A finite element study on Plastic deformation of Suspension Bushing Sayfa 13
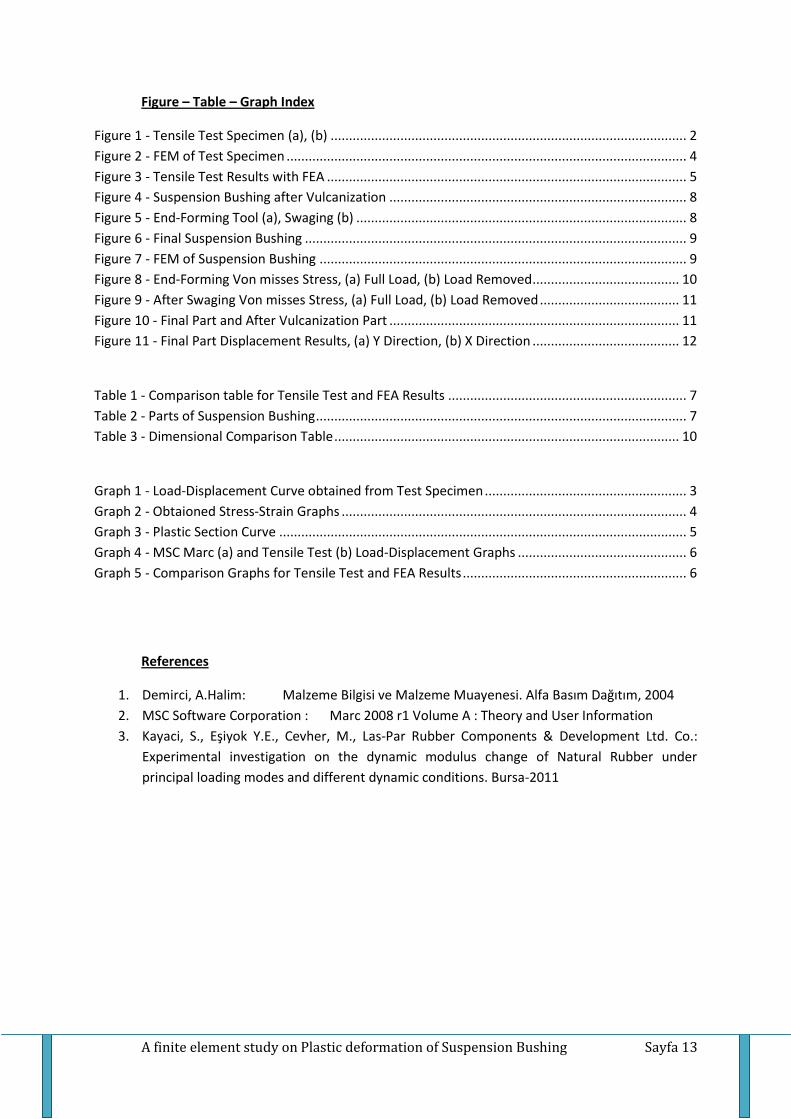
Figure – Table – Graph Index
Figure 1 - Tensile Test Specimen (a), (b) ................................................................................................. 2
Figure 2 - FEM of Test Specimen ............................................................................................................. 4
Figure 3 - Tensile Test Results with FEA .................................................................................................. 5
Figure 4 - Suspension Bushing after Vulcanization ................................................................................. 8
Figure 5 - End-Forming Tool (a), Swaging (b) .......................................................................................... 8
Figure 6 - Final Suspension Bushing ........................................................................................................ 9
Figure 7 - FEM of Suspension Bushing .................................................................................................... 9
Figure 8 - End-Forming Von misses Stress, (a) Full Load, (b) Load Removed ........................................ 10
Figure 9 - After Swaging Von misses Stress, (a) Full Load, (b) Load Removed ...................................... 11
Figure 10 - Final Part and After Vulcanization Part ............................................................................... 11
Figure 11 - Final Part Displacement Results, (a) Y Direction, (b) X Direction ........................................ 12
Table 1 - Comparison table for Tensile Test and FEA Results ................................................................. 7
Table 2 - Parts of Suspension Bushing ..................................................................................................... 7
Table 3 - Dimensional Comparison Table .............................................................................................. 10
Graph 1 - Load-Displacement Curve obtained from Test Specimen ....................................................... 3
Graph 2 - Obtaioned Stress-Strain Graphs .............................................................................................. 4
Graph 3 - Plastic Section Curve ............................................................................................................... 5
Graph 4 - MSC Marc (a) and Tensile Test (b) Load-Displacement Graphs .............................................. 6
Graph 5 - Comparison Graphs for Tensile Test and FEA Results ............................................................. 6
References
1. Demirci, A.Halim: Malzeme Bilgisi ve Malzeme Muayenesi. Alfa Basım Dağıtım, 2004
2. MSC Software Corporation : Marc 2008 r1 Volume A : Theory and User Information
3. Kayaci, S., Eşiyok Y.E., Cevher, M., Las-Par Rubber Components & Development Ltd. Co.:
Experimental investigation on the dynamic modulus change of Natural Rubber under
principal loading modes and different dynamic conditions. Bursa-2011