A fertilizer primer: Potash and the need to feed more … fertilizer primer: Potash and the need to...
27
June 10, 2013 Rocks & Ores A fertilizer primer: Potash and the need to feed more with less Commodities Research We initiate coverage of potash with a positive outlook Global population growth will add 71 million new mouths to feed each year, while rising income levels are driving an increase in the average number of calories consumed per capita. Arable land is a finite resource, so the agricultural sector will continue to meet growing demand for food by increasing the average yield per hectare, partly via greater use of chemical fertilizers. On that basis, we expect potash demand growth to average 3.1% over our forecast period and beyond, driven by higher fertilizer intensity and a rebalancing of the NPK 1 mix in non-OECD markets. This differentiates potash from other commodities that experience weaker demand after the industrialization phase. 1. Three main nutrients in a fertilizer mixture: nitrogen (N), phosphate (P), and potassium (K). Industry structure should maintain prices well above cost support Producer discipline has delivered consistently high margins in recent years and we believe it will sustain prices well above cost support for the remainder of our forecast period; two marketing organizations control ~65% of current production and ~60% of new production in the period to 2020. In the short term, spot prices have been impacted by a cut to Indian fertilizer subsidies and by moderate crop prices. Looking beyond the current crop cycle, we expect prices to average US$520/t over the period 2014-17, equivalent to a ~70% premium over our US$300/t estimate of marginal production costs. Normalized prices are unlikely before 2020 In the long term, the grip of the established oligopoly should gradually weaken as new entrants expand their production capacity. Based on our analysis of 30+ growth projects across the globe, we expect the rate of production capacity additions to accelerate. We forecast production capacity to increase from 64Mtpa in 2013 to 83Mtpa in 2020, implying a modest decline in the global utilization rate towards the end of the decade. As industry concentration is gradually eroded by new entrants and as the supply side becomes more competitive, we expect prices to converge towards the inducement price level of US$475 (in 2018 US$ terms). Christian Lelong +61(2)9321-8635 [email protected] Goldman Sachs Australia Pty Ltd Damien Courvalin (212) 902-3307 [email protected] Goldman, Sachs & Co. Jeffrey Currie (212) 357-6801 [email protected] Goldman, Sachs & Co. Investors should consider this report as only a single factor in making their investment decision. For Reg AC certification and other important disclosures, see the Disclosure Appendix, or go to www.gs.com/research/hedge.html. The Goldman Sachs Group, Inc. Goldman Sachs
Transcript of A fertilizer primer: Potash and the need to feed more … fertilizer primer: Potash and the need to...

June 10, 2013
Rocks & Ores
A fertilizer primer: Potash and the
need to feed more with less
Commodities Research
We initiate coverage of potash with a positive outlook
Global population growth will add 71 million new mouths to feed each
year, while rising income levels are driving an increase in the average
number of calories consumed per capita. Arable land is a finite resource, so
the agricultural sector will continue to meet growing demand for food by
increasing the average yield per hectare, partly via greater use of chemical
fertilizers. On that basis, we expect potash demand growth to average 3.1%
over our forecast period and beyond, driven by higher fertilizer intensity
and a rebalancing of the NPK1 mix in non-OECD markets. This
differentiates potash from other commodities that experience weaker
demand after the industrialization phase.
1. Three main nutrients in a fertilizer mixture: nitrogen (N), phosphate (P), and potassium (K).
Industry structure should maintain prices well above cost support
Producer discipline has delivered consistently high margins in recent years
and we believe it will sustain prices well above cost support for the
remainder of our forecast period; two marketing organizations control
~65% of current production and ~60% of new production in the period to
2020. In the short term, spot prices have been impacted by a cut to Indian
fertilizer subsidies and by moderate crop prices. Looking beyond the
current crop cycle, we expect prices to average US$520/t over the period
2014-17, equivalent to a ~70% premium over our US$300/t estimate of
marginal production costs.
Normalized prices are unlikely before 2020
In the long term, the grip of the established oligopoly should gradually
weaken as new entrants expand their production capacity. Based on our
analysis of 30+ growth projects across the globe, we expect the rate of
production capacity additions to accelerate. We forecast production
capacity to increase from 64Mtpa in 2013 to 83Mtpa in 2020, implying a
modest decline in the global utilization rate towards the end of the decade.
As industry concentration is gradually eroded by new entrants and as the
supply side becomes more competitive, we expect prices to converge
towards the inducement price level of US$475 (in 2018 US$ terms).
Christian Lelong
+61(2)9321-8635 [email protected] Goldman Sachs Australia Pty Ltd
Damien Courvalin
(212) 902-3307 [email protected] Goldman, Sachs & Co.
Jeffrey Currie
(212) 357-6801 [email protected] Goldman, Sachs & Co.
Investors should consider this report as only a single factor in making their investment decision. For Reg AC certificationand other important disclosures, see the Disclosure Appendix, or go to www.gs.com/research/hedge.html.
The Goldman Sachs Group, Inc. Goldman Sachs

June 10, 2013 Global
Goldman Sachs Global Economics, Commodities and Strategy Research 2
Contents
Executive Summary: oligopoly + steady growth = high margins 3
Potash prices to recover post 2014 season 5
The quest for higher yields will drive potash demand 9
Supply growth and market structure will drive prices 16
Risks to our views 23
Appendix: Potash 101 24
Disclosure Appendix 27
The authors wish to thank Amber Cai for her contribution to this report.

June 10, 2013 Global
Executive Summary: oligopoly + steady growth = high margins
We add potash to our list of bulk commodities under coverage. On the demand side,
agriculture is very different to steel and power generation, while the potash industry
structure is admittedly unusual. However, there is also much in common on the supply
side in terms of underground mining and ore beneficiation techniques, as well as in
transportation and logistics.
The appeal of a late cycle commodity
We believe potash demand will be driven by the need to improve agricultural yields,
particularly in emerging markets where output per hectare lags well behind the level
achieved in Europe, North America and Northeast Asia. On the one hand, the world’s
population is set to grow at an average annual rate of 0.9% in the period to 2030
according to United Nations forecasts; this is equivalent to 71 million new mouths to
feed each year. In addition to population growth, the average daily food intake per
capita has increased from 2,189kcal in 1961 to 2,831kcal in 2009, equivalent to an
average growth rate of 0.5% per year. On the other hand, arable land is a finite
resource, so the agricultural sector must meet growing demand for food mainly by
increasing the average yield per hectare. Rising food consumption is therefore a long-
term trend that will outlast the demand for early cycle commodities such as steel that
are driven by industrialization and urbanization. In the case of the US, primary steel
production per capita rose during the first half of the 20th century before declining
afterwards; current production levels are barely 30% of their level 50 years ago. Food
consumption on the other hand has been increasing, and current intake per capita is
approximately 30% above the level in 1962 (Exhibit 1). We view the US experience as a
leading indicator for emerging markets such as China and India.
Exhibit 1: Early cycle versus late cycle commodities
Steel production and food supply per capita in the US
Source: USGS, USDA, Goldman Sachs Global ECS Research
Industry structure will maintain prices above cost support
Producer discipline has delivered consistently high margins in recent years and we
believe it will sustain prices well above cost support for the remainder of our forecast
period; the two marketing organizations control ~65% of current production and ~60%
of new production in the period to 2020. In the short term, the upside to spot prices will
be limited by a cut to Indian fertilizer subsidies and by moderate crop prices. Looking
beyond the current crop cycle, we expect prices to average US$520/t over the period
0
500
1,000
1,500
2,000
2,500
3,000
3,500
4,000
4,500
-
50
100
150
200
250
300
350
400
450
1900 1910 1920 1930 1940 1950 1960 1970 1980 1990 2000 2010
Primary steel production (kg per capita - LHS) Food supply (kcal/day per capita - RHS)
Primary steel prod. trendline (kg per capita - LHS)

June 10, 2013 Global
2014-17, equivalent to a 73% premium over our US$300/t estimate of marginal
production costs (Exhibit 2).
Exhibit 2: We initiate coverage of potash with a positive view
Potash price forecasts
Source: Goldman Sachs Global ECS Research
In the long term, we expect the grip of the marketing oligopoly to gradually weaken as
new entrants expand their production capacity. Based on our analysis of 30+ growth
projects across the globe, we expect the rate of production capacity additions to
increase significantly relative to the 2000-12 trend rate. We forecast production capacity
to increase from 64Mtpa in 2013 to 83Mtpa in 2020, implying a modest decline in the
global utilization rate towards the end of the decade. The eventual normalization of the
potash industry as the supply side becomes more competitive will drive prices to
converge towards the inducement price level of US$475 (in 2018 US$ terms), in our
view (Exhibit 3).
Exhibit 3: We expect prices to trade above cost support
Historical and forecast potash prices – MOP granulated CFR Brazil
Source: CRU, Goldman Sachs Global ECS Research estimates
In this report we focus on our analysis on:
The gap in agricultural yields between emerging and developed economies,
and the challenge of rising population and rising living standards.
The role of fertilizers in driving agricultural output, alongside other inputs
(labor, land and capital), as well as productivity gains.
The growth in production capacity and the implications for capacity utilization
and prices.
.
Bulk Commodities: Price Forecast Summary
nominal US$/t Long Term
Q2 2013 Q3 2013F Q4 2013F Q1 2014F 2012 2013F 2014F 2015F 2016F 2017F 2018 $
PotashMOP - granulated CFR Brazil 445$ 450$ 490$ 520$ 514$ 458$ 520$ 520$ 520$ 520$ 475$
MOP - standard CFR SE Asia 450$ 460$ 480$ 500$ 513$ 457$ 500$ 500$ 500$ 500$ 460$
basin spread (5)$ (10)$ 10$ 20$ 1$ 0$ 20$ 20$ 20$ 20$ 15$
$0
$100
$200
$300
$400
$500
$600
$700
$800
$900
$1,000
2006 2007 2008 2009 2010 2011 2012 2013 2014 2015 2016 2017 2018 2019 2020
Historical Forecast Long Term
Strong harvest and
Indian subsidy cuts put
prices under pressure
Potash trades above
cost support
Inducement
price

June 10, 2013 Global
Potash prices to recover post 2014 season
In the short term, we expect the upside to potash prices to be limited by a cut to Indian
fertilizer subsidies and by moderate crop prices. Looking beyond the current crop cycle,
we expect prices to average US$520/t over the period 2014-17, equivalent to a ~70%
premium over our US$300/t estimate of marginal production costs. In the long term,
the grip of the established oligopoly will gradually weaken as new entrants expand
their production capacity, driving prices to converge towards the inducement price
level of US$475 (in 2018 US$ terms), in our view
Short term view: crop prices and subsidy cuts limit upside
In the short term, the price upside will be mitigated by expectations of rising
agricultural production and an increase in the stock-to-use ratio. According to the latest
estimates from the USDA, global grain output will increase by 7.5% yoy in the 2013/14
season, lifting the stock-to-use ratio from 19% to 20% (Exhibit 4). Similarly, global
oilseeds output will increase by 4.7%, lifting the stock-to-use ratio to 20% (Exhibit 5). In
principle, a strong harvest will drive food prices lower and reduce the incentive of
commercial farmers to increase production in the next crop cycle.
Exhibit 4: Higher volumes expected for grains… Global grain output and stock-to-use ratio - Mt
Exhibit 5: … and oilseeds will weigh on fertilizer demandGlobal oilseeds output and stock-to-use ratio - Mt
Source: USDA
Source: USDA
Historically, food prices have been strongly correlated with fertilizer prices. Since
January 2000 the IMF Food index increased by 177%, while potash prices increased by
273%. The IMF Food Price index surged in 1H 2008, and potash prices duly followed in
2H 2008 to reach an all-time high. As demand contracted during the financial crisis,
food prices declined and caused a sharp drop in potash prices (Exhibit 6). Based on
average quarterly prices, the correlation between food and potash prices appears to be
strongest with prices on a 6-month lag (Exhibit 7) with a coefficient of determination
(R2) of 0.58.
0%
5%
10%
15%
20%
25%
30%
0
500
1,000
1,500
2,000
2,500
3,000
2008/09 2009/10 2010/11 2011/12 2012/13F 2013/14F
Output (LHS) Stock to use (RHS)
0%
5%
10%
15%
20%
25%
30%
0
100
200
300
400
500
600
2008/09 2009/10 2010/11 2011/12 2012/13F 2013/14F
Output (LHS) Stock to use (RHS)

June 10, 2013 Global
Exhibit 6: Food and potash prices are correlated…
Crop prices versus potash prices
Exhibit 7: … with 6-month lag
Quarterly crop prices versus potash prices (6 month lag)
Source: IMF, Goldman Sachs Global ECS Research
Source: IMF, Goldman Sachs Global ECS Research
Corn futures in the US suggest a period of slightly lower crop prices (Exhibit 8). On that
basis, the short term outlook for crop prices suggests a period of relatively soft demand
and prices for potash. Another headwind for potash comes from recent changes to
fertilizer subsidies in India. In May 2013 the Indian government announced a range of
cuts to subsidies for NPK nutrients. In the case of potash, the subsidies will be reduced
by 22%. Fertilizers can be a material cost to both commercial and subsistence farmers
(Exhibit 9), and we therefore expect Indian demand to contract slightly in 2013.
Exhibit 8: Crop prices to soften in the short term US corn prices – US cents per bushel
Exhibit 9: Fertilizer use contributes to variable costs Cost analysis of wheat farming in Europe
Source: CBOT
Source: K+S Group
Long term view: producer discipline to hold until 2020
Producer discipline has delivered consistently high margins in recent years and we
believe it will sustain prices well above cost support for the remainder of our forecast
period; the two marketing organizations control ~65% of current production and ~60%
of new production in the period to 2020. Our positive view on potash prices is based on
the following rationale:
The potash industry has relatively high barriers to entry in the form of a) high
capital costs of US$1,000 per tonne of production capacity to develop new
deposits and b) relative geological scarcity, with just 3 countries accounting for
60% of global production. This will limit the amount of new production
capacity to be induced, in our view.
$-
$200
$400
$600
$800
$1,000
0
50
100
150
200
250
2000 2002 2004 2006 2008 2010 2012
Food price index (Jan 1980 = 100 - LHS)
Potash (CFR Asia, US$/t - RHS)
0
50
100
150
200
250
$- $200 $400 $600 $800 $1,000
0
100
200
300
400
500
600
700
800
900
2008 2009 2010 2011 2012 2013 2014 2015
Historical Futures
Fixed costs
48%
Variable
costs
14%
Crop
protection
10%
Seeds
7%
Fertilizer -
other
18%
Fertilizer- K
3%

June 10, 2013 Global
Based on our analysis of growth projects, we expect 16Mtpa of new
production capacity to be induced by 2017. This would be sufficient to meet
demand growth of 3%, and we expect capacity utilization in the potash
industry to remain near a range between 75% and 80% during that period
(Exhibit 10).
Exhibit 10: Global utilization will converge towards 75% as capacity additions ramp up Production capacity, demand and utilization rate
Source: CRU, Company data, FAO, Goldman Sachs Global ECS Research forecasts
The development of incremental production capacity outside of the marketing
oligopoly should gradually erode the profitability of the potash industry. We expect the
rate of capacity additions to increase relative to the historical trend rate, with global
capacity rising from 64Mtpa in 2013 to 83Mtpa in 2020. This will coincide with a modest
decline in the global utilization rate towards the end of the decade; as the supply side
becomes more competitive, this will drive prices to converge towards the inducement
price level of US$475 (in 2018 US$ terms), in our view (Exhibit 11).
Exhibit 11: In the long term, potash prices will be supported by the need to induce additional capacity
Methodology behind long term price forecasts - bulk commodities under GS coverage
Source: Goldman Sachs Global ECS Research
We introduce our new potash supply & demand model
We have developed a supply and demand model for potash (Exhibit 12). On the
demand side, we have based our forecasts on the historical trends in arable land and
fertilizer use in each region, and we make adjustments whenever we believe there is a
change in trend under way. For example, based on industry sources we believe that the
K:N ratio in China will gradually increase as the agricultural sector corrects its
excessive reliance on nitrogen, and we adjust our figures accordingly. We develop our
demand analysis in the section titled The quest for higher yields will drive potash
demand on page 9.
On the supply side, we have calculated the proven production capacity of the potash
ind st b efe in to the eak od ction ol me of indi id al assets ( hene e
0%
10%
20%
30%
40%
50%
60%
70%
80%
90%
100%
-
10
20
30
40
50
60
70
80
90
100
2003 2005 2007 2009 2011 2013E 2015E 2017E
Capacity (Mtpa - LHS) Production (Mt - LHS) Utilisation (% - RHS)
Potash Iron Ore Metallurgical coal Thermal Coal
Long term
priceinducement price marginal production cost inducement price hybrid
Rationale
Lasting demand growth,
high barriers to entry limit
risk of oversupply
Excess capacity will keep
the market in surplus from
2014+
Geological scarcity and
industry concentration
Demand growth will slow
until the need for new
capacity vanishes

June 10, 2013 Global
possible) or companies. We continue to follow the same methodology used in other
bulk commodities to assess new growth projects: the inclusion of a new project into
our supply forecasts is a binary decision based on a scorecard rating that reflects a
project’s viability and its probability of securing approvals and financing. We develop
our supply analysis in the section titled Supply growth and market structure will drive
prices on page 16.
Exhibit 12: Potash supply & demand balance
Source: CRU, IFA, World Bank, FAO, Goldman Sachs Global ECS Research estimates
Million tonnes - KCl 2007 2008 2009 2010 2011 2012 2013E 2014E 2015E 2016E 2017E
Arable Land - million hectaresOECD 415 418 420 416 416 420 419 418 417 416 415 non-OECD 957 958 962 967 971 975 978 982 986 990 994
Total 1,372 1,376 1,381 1,383 1,387 1,395 1,398 1,400 1,403 1,406 1,409
Fertilizer intensity - kg/haOECD 85.3 71.1 75.1 80.0 80.8 81.6 82.4 83.2 84.0 84.9 85.7 non-OECD 60.4 54.9 123.7 129.0 133.5 134.2 136.6 139.1 141.6 144.1 146.7
Consumption - fertilizers
US 6.7 4.4 6.4 6.9 7.0 7.0 7.0 7.0 7.0 7.0 7.1
EU27 5.9 3.2 3.8 4.5 4.6 4.7 4.8 4.8 4.9 5.0 5.0
Other OECD 2.9 2.0 2.2 2.4 2.4 2.5 2.5 2.5 2.6 2.6 2.6
OECD total 15.5 9.6 12.4 13.9 14.1 14.1 14.2 14.4 14.5 14.6 14.7
Brazil 6.6 5.8 5.0 6.2 7.0 7.1 7.3 7.6 7.8 8.0 8.3
China 10.3 7.4 6.8 8.2 9.4 10.1 10.5 10.9 11.3 11.7 12.1
India 4.2 5.3 5.8 5.6 4.4 4.0 3.9 4.4 4.8 5.3 5.9
Indonesia 1.5 1.5 1.3 2.0 2.4 2.4 2.5 2.6 2.7 2.8 2.9
CIS 1.6 1.8 1.8 1.8 1.9 2.0 2.0 2.1 2.2 2.3 2.4
Other non-OECD 6.4 5.2 4.5 6.2 6.5 6.8 7.1 7.4 7.7 8.0 8.4
non-OECD total 30.6 27.1 25.1 30.0 31.6 32.4 33.4 34.9 36.5 38.2 39.9
Total 46.1 36.7 37.5 43.9 45.6 46.5 47.6 49.3 51.0 52.8 54.6
Consumption - industrial & losses
OECD total 3.1 6.1 0.2 1.0 2.6 2.7 2.7 2.8 2.8 2.9 2.9
Total non-OECD 2.4 2.9 2.5 2.9 2.9 2.9 3.0 3.1 3.2 3.3 3.3
Total - other sectors 5.5 9.0 2.7 3.9 5.5 5.6 5.7 5.9 6.0 6.1 6.3
Total demand 51.6 45.7 40.1 47.7 51.1 52.1 53.4 55.1 57.0 58.9 60.9
% growth -11.5% -12.1% 19.0% 7.1% 1.9% 2.4% 3.4% 3.4% 3.4% 3.4%
Incremental production capacity
Canada - - - 1 5 8 9 13 Others - - - 0 0 1 1 4
Total incremental - unrisked - - - 1 5 8 11 17
Total incremental - risked - - - 2 7 11 13 16
Production
Canada 18.1 17.3 7.2 15.6 17.7 15.3 18.1 19.1 20.7 22.2 23.5
Russia 10.6 9.9 6.1 10.2 10.8 9.4 9.9 10.3 10.4 10.5 10.5
Belarus 8.3 8.3 4.1 8.7 8.9 8.0 8.1 8.4 8.6 8.8 8.8
Israel 3.6 3.6 3.0 3.3 2.8 3.2 3.0 3.0 3.0 3.1 3.2
China 3.3 3.3 3.6 3.7 4.0 4.3 4.3 4.3 4.4 4.4 4.5
Germany 4.7 3.9 2.2 3.5 3.6 3.5 3.5 3.5 3.5 3.5 3.5
Other 6.0 6.1 4.6 6.2 7.1 7.1 6.4 6.5 6.4 6.4 6.9
Total Production 54.5 52.3 31.0 51.0 54.9 50.8 53.4 55.1 57.0 58.9 60.9
% growth -4.1% -40.7% 64.4% 7.7% -7.5% 5.1% 3.4% 3.4% 3.4% 3.4%
Production capacity 60.2 60.6 62.1 62.3 62.3 63.7 65.7 70.8 74.9 76.8 79.3 utilisation rate 91% 86% 50% 82% 88% 80% 81% 78% 76% 77% 77%
Balancing item
Stock changes 2.9 6.6 (9.1) 3.2 3.8 (1.3) - - - - -
Exports
Canada 191 16.5 6.4 15.8 16.7 14.9 15.5 18.5 20.1 21.5 22.9
Russia 112 8.9 4.5 8.3 8.8 7.0 7.5 8.6 8.6 8.7 8.7
Belarus 60 6.3 3.0 7.0 7.8 6.4 7.0 6.8 6.9 7.1 7.1
Germany 67 3.6 2.2 3.4 3.3 3.3 3.3 2.7 2.7 2.7 2.7
Israel 3.1 1.8 3.7 3.5 2.9 2.9 2.7 2.7 2.8 2.9
Other 133 2.7 2.2 4.2 4.2 4.6 4.3 9.3 9.3 9.3 9.8
Total seaborne exports 563 41.1 20.1 42.4 44.2 38.9 40.5 48.6 50.3 52.1 54.0
Imports
US 8.1 8.0 3.3 8.0 7.4 6.8 7.0 7.1 7.1 7.1 7.2
EU27 5.9 5.4 1.7 4.8 4.8 4.6 4.7 3.7 3.7 3.7 3.8
Other OECD 2.4 2.7 1.1 2.4 2.4 2.3 2.4 4.9 6.4 7.8 9.1
OECD total 16.3 16.0 6.2 15.3 14.6 13.8 14.1 15.7 17.2 18.7 20.0
Brazil 7.1 5.9 3.7 6.8 7.2 7.3 7.4 7.7 7.9 8.1 8.4
China 9.3 5.1 1.3 5.1 6.8 6.3 6.5 6.7 7.0 7.4 7.8
India 3.9 6.0 5.4 6.2 4.7 3.2 4.0 4.5 5.0 5.5 6.0
Indonesia 1.4 1.9 0.8 2.4 3.1 2.5 2.5 2.7 2.8 2.9 3.0
Other non-OECD 6.3 6.2 2.7 6.5 7.7 5.9 6.0 9.0 9.4 9.8 10.2
non-OECD total 27.9 25.1 13.9 27.1 29.5 25.2 26.4 30.6 32.1 33.7 35.4
Total imports 44.3 41.1 20.1 42.4 44.2 38.9 40.5 46.3 49.3 52.4 55.4
% growth -7.1% -51.1% 111.1% 4.1% -11.9% 3.9% 14.4% 6.6% 6.3% 5.8%
June 10, 2013 Global
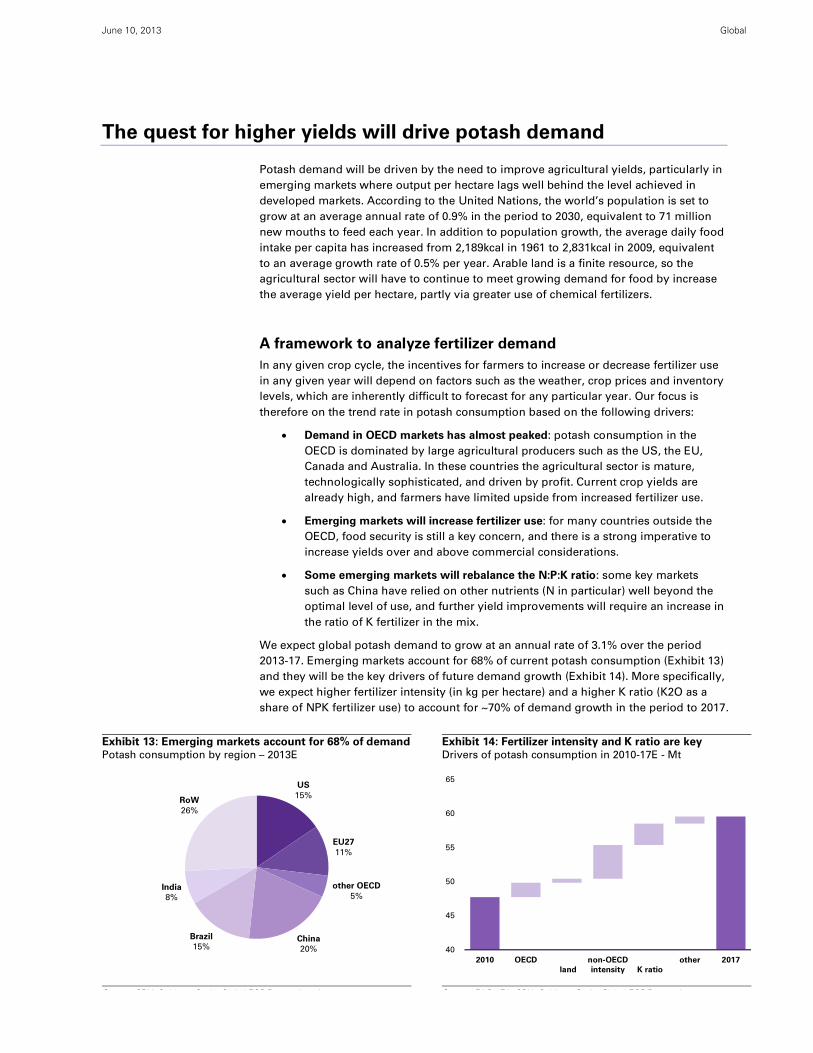
The quest for higher yields will drive potash demand
Potash demand will be driven by the need to improve agricultural yields, particularly in
emerging markets where output per hectare lags well behind the level achieved in
developed markets. According to the United Nations, the world’s population is set to
grow at an average annual rate of 0.9% in the period to 2030, equivalent to 71 million
new mouths to feed each year. In addition to population growth, the average daily food
intake per capita has increased from 2,189kcal in 1961 to 2,831kcal in 2009, equivalent
to an average growth rate of 0.5% per year. Arable land is a finite resource, so the
agricultural sector will have to continue to meet growing demand for food by increase
the average yield per hectare, partly via greater use of chemical fertilizers.
A framework to analyze fertilizer demand
In any given crop cycle, the incentives for farmers to increase or decrease fertilizer use
in any given year will depend on factors such as the weather, crop prices and inventory
levels, which are inherently difficult to forecast for any particular year. Our focus is
therefore on the trend rate in potash consumption based on the following drivers:
Demand in OECD markets has almost peaked: potash consumption in the
OECD is dominated by large agricultural producers such as the US, the EU,
Canada and Australia. In these countries the agricultural sector is mature,
technologically sophisticated, and driven by profit. Current crop yields are
already high, and farmers have limited upside from increased fertilizer use.
Emerging markets will increase fertilizer use: for many countries outside the
OECD, food security is still a key concern, and there is a strong imperative to
increase yields over and above commercial considerations.
Some emerging markets will rebalance the N:P:K ratio: some key markets
such as China have relied on other nutrients (N in particular) well beyond the
optimal level of use, and further yield improvements will require an increase in
the ratio of K fertilizer in the mix.
We expect global potash demand to grow at an annual rate of 3.1% over the period
2013-17. Emerging markets account for 68% of current potash consumption (Exhibit 13)
and they will be the key drivers of future demand growth (Exhibit 14). More specifically,
we expect higher fertilizer intensity (in kg per hectare) and a higher K ratio (K2O as a
share of NPK fertilizer use) to account for ~70% of demand growth in the period to 2017.
Exhibit 13: Emerging markets account for 68% of demandPotash consumption by region – 2013E
Exhibit 14: Fertilizer intensity and K ratio are key Drivers of potash consumption in 2010-17E - Mt
S CRU G ld S h Gl b l ECS R h i S FAO IFA CRU G ld S h Gl b l ECS R h
US
15%
EU27
11%
other OECD
5%
China
20%
Brazil
15%
India
8%
RoW
26%
40
45
50
55
60
65
2010 OECD
land
non-OECD
intensity K ratio
other 2017

June 10, 2013 Global
We expect demand for K fertilizer to accelerate
The increased use of fertilizer has been uneven across the 3 macronutrients. Global
consumption over the period 1980-2010 has grown fastest for nitrogen, followed by
phosphate and potash (Exhibit 15). Different types of soils and crops will require a
different balance of nutrients, but we argue that in some regions the current fertilizer
mix is suboptimal, explaining some of the large differences in the N:P:K ratio across
countries (Exhibit 16). For instance, soils in China (the southern provinces in particular)
are known to be deficient in K. At the same time, China is an important producer of
vegetables (accounting for ~50% of global production) which require more potash than
most other crops. In spite of these factors conducive to a relatively high use of K
fertilizer, current potash consumption is low by global standards.
Exhibit 15: K has lagged N and P demand growth Global nutrient demand (Mt – LHS) and K share (RHS)
Exhibit 16: The N:P:K ratio varies greatly by country Potash share of total nutrients – selected countries
Source: IFA
Source: IFA
We expect global potash demand to grow at an average rate of 3.1% in the period
2012-17E. Our forecast rests on the two following assumptions:
1. Fertilizer demand will outpace crop output. Excluding the impacts of a change
in diet and the rise of biofuels, we expect population growth and the trends
towards more calorific diets to underpin a trend rate of 1.4% in global crop
output. We expect fertilizer use to grow at a modest rate in the OECD, but we
also expect non-OECD countries to increase their fertilizer use at an average
annual rate of 2.2% over the period to 2017, lifting the global rate to 1.8% over
that same period.
2. Potash demand will outpace fertilizer demand: We expect China and India in
particular to balance their N:P:K ratio over time. In both cases the current
fertilizer mix is skewed towards nitrogen, and the imperative to increase
agricultural yields will require a bigger role for potash in the mix. We assume
that the K ratio in other regions remains unchanged from current levels.
On that basis, we forecast demand for K fertilizer to outpace both N and P (Exhibit 17)
and demand growth to be concentrated in the emerging markets of China, India and
Brazil (Exhibit 18).
0%
5%
10%
15%
20%
25%
0
40
80
120
160
200
1980 1985 1990 1995 2000 2005 2010
N P K K (% of total)
0%
10%
20%
30%
40%
50%
60%
70%
80%
90%
100%
Brazil Indonesia US France India China
N
P
K

June 10, 2013 Global
Exhibit 17: K fertilizer to outpace N and P
Average annual growth rates- 2012-17E
Exhibit 18: Key growth markets are outside the OECD
Potash demand growth by region – 2012-17E
Source: GS Global ECS Research
Source: Goldman Sachs Global ECS Research
Land is a finite resource but demand for food will keep growing
The area of arable land has largely stagnated for the past 20 years. In 2011, global
arable land amounted to 1.4 billion hectares, marginally below the 1991 level and just
9% above the level 50 years ago (Exhibit 19). Over that period, arable land has actually
shrunk in North America and Europe, but this has been offset by increases in South
America, Africa and Asia. The challenge posed by a finite amount of land is brought
into sharper focus by population growth and by the unequal distribution of land across
regions. A rising population has reduced the amount of arable land per capita in most
countries (Exhibit 20). With the exception of Brazil, where arable land has grown faster
than population, land per capita has shrunk in China (-24%), India (-30%) and the US
(-30%) over the period 1990-2010. This established trend is compounded by the
unequal distribution of land. For example, China only has 16% as much arable land per
person as the US.
Exhibit 19: Limited growth in arable land… Arable land by region – million hectares
Exhibit 20: … means less land per capita Arable land per capita – hectares
Source: FAO
Source: FAO, World Bank
A separate trend is the impact of rising income levels on diet. For example, countries
with a GDP per capita below US$10,000 tend consume 7.6kg of beef per year, whereas
countries with a GDP above US$30,000 consume 21kg of beef per year on average
(Exhibit 21) Of course several factors determine the national diet including the climate
0.0%
0.5%
1.0%
1.5%
2.0%
2.5%
3.0%
Food NPK K
Fertilizer
use
Calories
per capita
Population
growth
China
24%
India
22%
Brazil
15%
other non-
OECD
29%
OECD
10%
0
250
500
750
1,000
1,250
1,500
1961 1971 1981 1991 2001 2011
RoW
Africa
Asia
EU
South America
North America
0.00
0.10
0.20
0.30
0.40
0.50
0.60
0.70
0.80
Brazil China India US
1990 2000 2010

June 10, 2013 Global
and culture; the average Argentine ate his way through 54kg of beef in 2009. More
broadly, rising income levels are associated with an increase in the average intake of
protein and calories (Exhibit 22).
Exhibit 21: Rising income leads to a change of diet… Annual bovine meat consumption and GDP per capita - kg
Exhibit 22: … and a higher intake of protein and caloriesAverage food (kcal - LHS) and protein (g – RHS) daily intake
Source: FAO, World Bank
Source: FAO
In spite of these established trends towards less arable land per capita and growing
demand for food, agricultural output has increased sufficiently to keep food prices
relatively stable over long periods of time. However, using a basket of key agricultural
products (beef, corn, rice, soybean and wheat) we note an inflection point in 2007 when
food prices started to increase (Exhibit 23). The drivers behind the recent increase in
food prices include higher energy prices, higher biofuel mandates and poor weather.
Importantly, oil prices have now stabilized while the increase in biofuel demand has
slowed and weather patterns are due to normalize. As a result, the inflationary
pressures on food prices should moderate somehow.
Exhibit 23: Food prices have passed an inflection point Food prices – Jan 1980 = 100
Source: IMF
The great divide: high yield versus low yield countries
The main driver of agricultural production growth has been the increase in crop yields.
The deployment of better seeds, modern farming techniques, irrigation, pest control
and fertilizers have all contributed to bigger harvests per hectare. However, progress
has been unequal with a clear divide between advanced farming sectors in the OECD
0
5
10
15
20
25
30
35
40
45
$- $10,000 $20,000 $30,000 $40,000 $50,000
0
25
50
75
100
0
1,000
2,000
3,000
4,000
1961 1966 1971 1976 1981 1986 1991 1996 2001 2006
China - food India - food Nigeria - food
China - protein India - protein Nigeria - protein
0
50
100
150
200
250
300
350
1980 1983 1986 1989 1992 1995 1998 2001 2004 2007 2010 2013
Beef
Corn
Rice
Soybean
Wheat
Average
June 10, 2013 Global
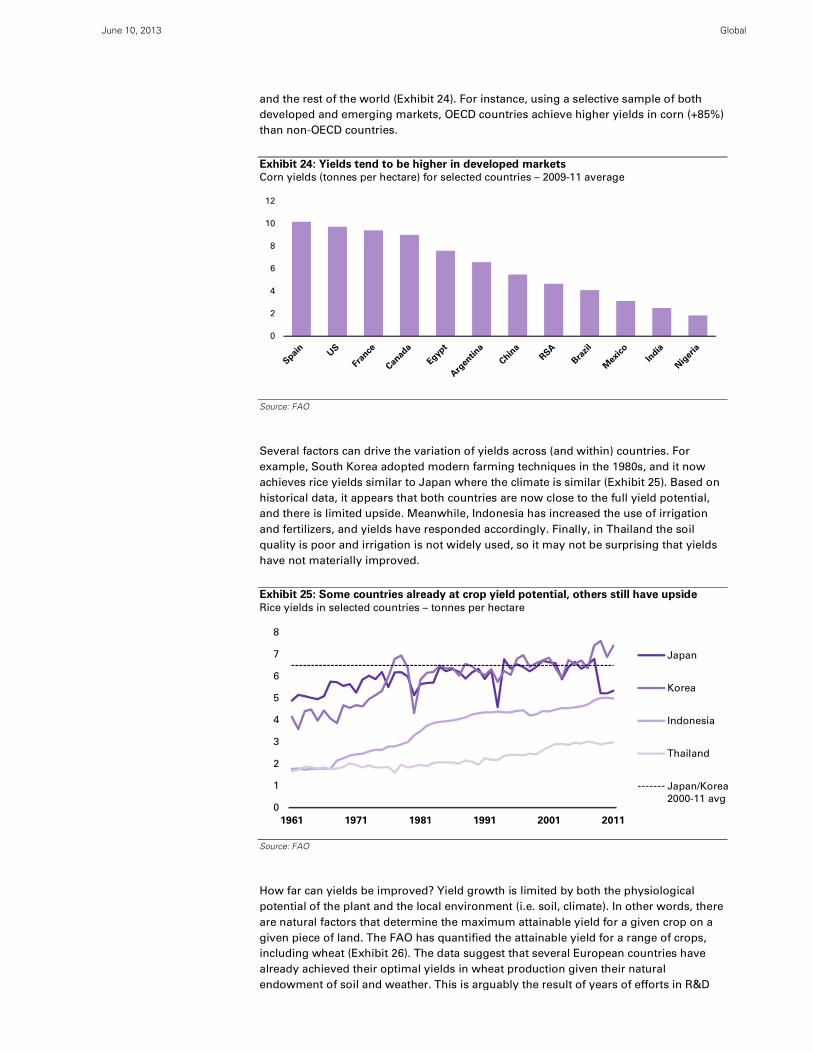
and the rest of the world (Exhibit 24). For instance, using a selective sample of both
developed and emerging markets, OECD countries achieve higher yields in corn (+85%)
than non-OECD countries.
Exhibit 24: Yields tend to be higher in developed markets Corn yields (tonnes per hectare) for selected countries – 2009-11 average
Source: FAO
Several factors can drive the variation of yields across (and within) countries. For
example, South Korea adopted modern farming techniques in the 1980s, and it now
achieves rice yields similar to Japan where the climate is similar (Exhibit 25). Based on
historical data, it appears that both countries are now close to the full yield potential,
and there is limited upside. Meanwhile, Indonesia has increased the use of irrigation
and fertilizers, and yields have responded accordingly. Finally, in Thailand the soil
quality is poor and irrigation is not widely used, so it may not be surprising that yields
have not materially improved.
Exhibit 25: Some countries already at crop yield potential, others still have upside
Rice yields in selected countries – tonnes per hectare
Source: FAO
How far can yields be improved? Yield growth is limited by both the physiological
potential of the plant and the local environment (i.e. soil, climate). In other words, there
are natural factors that determine the maximum attainable yield for a given crop on a
given piece of land. The FAO has quantified the attainable yield for a range of crops,
including wheat (Exhibit 26). The data suggest that several European countries have
already achieved their optimal yields in wheat production given their natural
endowment of soil and weather. This is arguably the result of years of efforts in R&D
0
2
4
6
8
10
12
0
1
2
3
4
5
6
7
8
1961 1971 1981 1991 2001 2011
Japan
Korea
Indonesia
Thailand
Japan/Korea
2000-11 avg

June 10, 2013 Global
fertilizers, pesticides, equipment and labor. However, countries that achieve lower
yields are not necessarily less efficient. For instance, a commercial farm that is driven
by profit rather than food security may achieve better returns for its owner by limiting
the amount of materials, labor and capital, thereby remaining deliberately below its
attainable yield. The challenge for farmers is therefore to narrow the gap between
current and maximum attainable yield, partly via the better use of fertilizers.
Exhibit 26: Some countries have realized the maximum attainable yield Wheat yield (t/ha) in selected countries – actual versus attainable
Source: FAO
The role of fertilizers in driving agricultural output
Farmers can increase yields towards the potential level by a) increasing the amount of
labor, materials (fertilizers, pesticides, better seeds) and capital (machinery, irrigation,
etc.) , and b) by using them more productively. If agricultural output grows faster than
inputs, it implies that productivity has increased. Agricultural R&D is a big driver of
productivity; in the US, productivity gains have been the main driver of agricultural
production growth (Exhibit 27). Over the past 60 years, US agricultural output has
increased by 170% even though the amount of inputs has declined in aggregate
(Exhibit 28). In other words, farmers have been working smarter, not harder. The only
type of input that has increased consistently during the period 1948-2009 is material
inputs (+370%).
Exhibit 27: US agricultural output and productivity
Sources of growth in US agriculture – 1948 = 100
Exhibit 28: Materials use has increased at a slowing rate
Average annual growth rates in US agricultural inputs
Source: USDA
Source: USDA
-2
0
2
4
6
8
10 Attainable yield Yield 2009-11
0
50
100
150
200
250
300
1948 1958 1968 1978 1988 1998 2008
Output Inputs Productivity
-0.75%
-0.50%
-0.25%
0.00%
0.25%
0.50%
0.75%
1.00%
1.25%
Labor Capital Land Materials
1948-81 1981-2009
June 10, 2013 Global
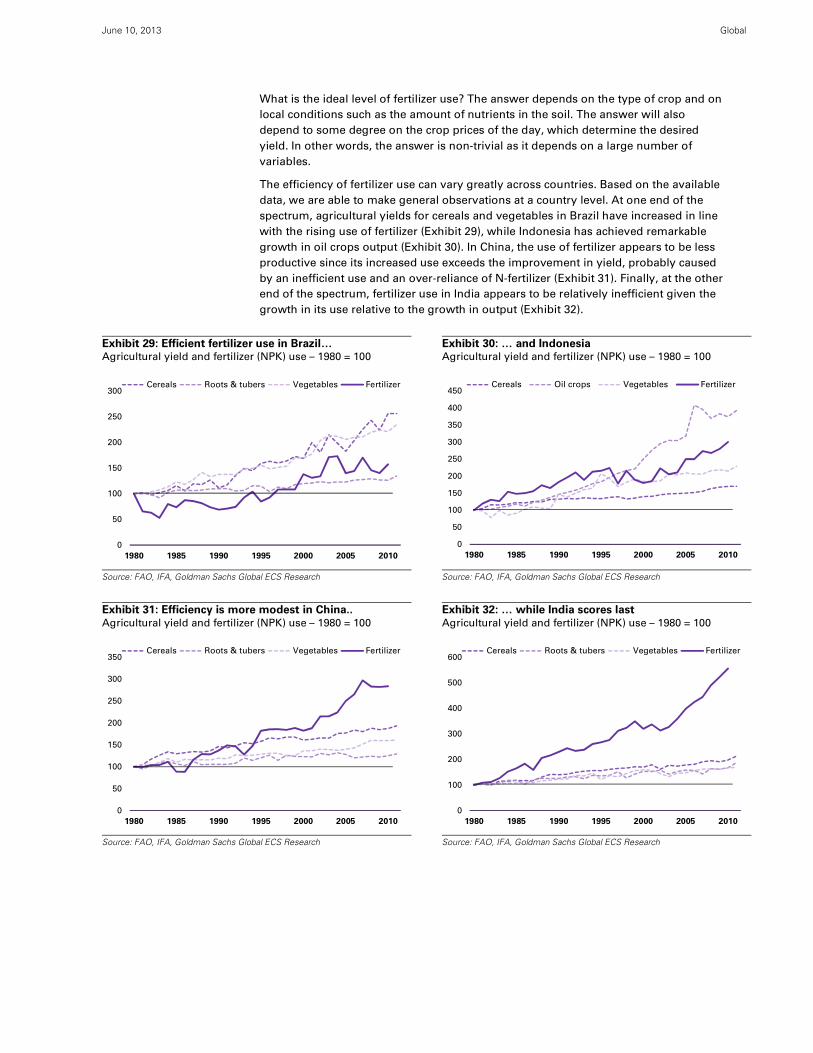
What is the ideal level of fertilizer use? The answer depends on the type of crop and on
local conditions such as the amount of nutrients in the soil. The answer will also
depend to some degree on the crop prices of the day, which determine the desired
yield. In other words, the answer is non-trivial as it depends on a large number of
variables.
The efficiency of fertilizer use can vary greatly across countries. Based on the available
data, we are able to make general observations at a country level. At one end of the
spectrum, agricultural yields for cereals and vegetables in Brazil have increased in line
with the rising use of fertilizer (Exhibit 29), while Indonesia has achieved remarkable
growth in oil crops output (Exhibit 30). In China, the use of fertilizer appears to be less
productive since its increased use exceeds the improvement in yield, probably caused
by an inefficient use and an over-reliance of N-fertilizer (Exhibit 31). Finally, at the other
end of the spectrum, fertilizer use in India appears to be relatively inefficient given the
growth in its use relative to the growth in output (Exhibit 32).
Exhibit 29: Efficient fertilizer use in Brazil… Agricultural yield and fertilizer (NPK) use – 1980 = 100
Exhibit 30: … and Indonesia Agricultural yield and fertilizer (NPK) use – 1980 = 100
Source: FAO, IFA, Goldman Sachs Global ECS Research
Source: FAO, IFA, Goldman Sachs Global ECS Research
Exhibit 31: Efficiency is more modest in China..
Agricultural yield and fertilizer (NPK) use – 1980 = 100
Exhibit 32: … while India scores last
Agricultural yield and fertilizer (NPK) use – 1980 = 100
Source: FAO, IFA, Goldman Sachs Global ECS Research
Source: FAO, IFA, Goldman Sachs Global ECS Research
0
50
100
150
200
250
300
1980 1985 1990 1995 2000 2005 2010
Cereals Roots & tubers Vegetables Fertilizer
0
50
100
150
200
250
300
350
400
450
1980 1985 1990 1995 2000 2005 2010
Cereals Oil crops Vegetables Fertilizer
0
50
100
150
200
250
300
350
1980 1985 1990 1995 2000 2005 2010
Cereals Roots & tubers Vegetables Fertilizer
0
100
200
300
400
500
600
1980 1985 1990 1995 2000 2005 2010
Cereals Roots & tubers Vegetables Fertilizer

June 10, 2013 Global
Goldman Sachs Global Economics, Commodities and Strategy Research 16
Supply growth and market structure will drive prices
Uniquely among bulk commodities, the potash industry is characterized by two
marketing organizations that collectively account for ~65% of current production and
~60% of new production in the period to 2020. Canpotex (representing PotashCorp,
Mosaic and Agrium) and BPC (representing Uralkali and Belaruskali) do compete
against one another, but they have also shown sufficient market discipline to deliver
consistently high margins. We estimate effective production capacity at 63Mtpa and we
forecast 16Mtpa of new production capacity to be induced by 2017. This will be
sufficient to meet demand growth of 3%, and we expect capacity utilization in the
potash industry will remain close to the 75% level during that period.
We estimate 2012 production capacity at 64Mtpa
Pricing tension and capacity utilization rates are closely linked, so an adequate estimate
of current and future production capacity is central to our price view. Unlike other bulk
commodities where mines are usually run at full capacity (or not at all) and estimates
of global capacity are relatively simple to assess, potash mines often operate at a rate
below full capacity. On that basis, calculating the global production capacity requires
some judgment. In particular, an estimate based on the nameplate capacity of a mine
may not be a reliable indicator.
We therefore adopt a different approach based on the highest recorded annual
production volume, and we adjust that figure based on any mine expansions that may
have taken place after the year of peak production. This approach can underestimate
the capacity of assets that have been consistently underutilized for the past decade.
However, we believe that a mine that has not performed at its nameplate capacity for
years may not be physically capable of achieving that higher rate without additional
investment to debottleneck the mine. Conversely, our approach may overestimate
production capacity in cases where peak production occurred some time ago, and as
the mine matures (e.g. the mine plan moves into less productive areas) and/or
sustaining capital dries up, the effective capacity falls below the historical peak level of
production. We note that approximately 25% of the current production capacity
achieved peak production over 8 years ago. In our view, these upside and downside
risks offset each other to some degree, and we are therefore comfortable with our
global production capacity estimate of 64Mtpa as of end 2012.
The potash oligopoly will remain in place until 2020 at least
Potash reserves and production are highly concentrated, with 3 countries accounting
for 89% and 64% of the global total, respectively (Exhibit 33). This geographical
concentration is replicated at a company level; on a marketing basis, the top two
suppliers have a much larger share of the export market in potash than in other bulk
commodities, including iron ore and metallurgical coal (Exhibit 34).

June 10, 2013 Global
Exhibit 33: Potash supply is highly concentrated
Potash reserves and production– as % of world total
Exhibit 34: Greater concentration than other bulks
Export market share (marketing basis) - top producers
Source: USGS, CRU
Source: Company data, Goldman Sachs Global ECS Research estimates
The two marketing organizations do compete against each other, for example by
selling into the Chinese market in an uncoordinated fashion in an attempt to win
market share. However, as a general rule they have shown remarkable discipline in
adjusting production in a way to support prices well above the marginal cost of
production. Based on our estimates of production capacity, Canpotex and BPC have
operated at an average utilization rate of 79% in the period 2006-12 (Exhibit 35). Not
only did they curtail production in 2009-10, but they also accepted a lower utilization
rate than the independent producers who produced at an average rate of 86%. From
that perspective, producers outside the oligopoly are enjoying a free ride from high
potash prices but without the restraint on production volumes.
Exhibit 35: Canpotex and BPC have shown producer discipline Capacity utilization rates by company type
Source: Company data, Goldman Sachs Global ECS Research
The impact of industry concentration is also evident on the historical level of profit
margins (Exhibit 36). Over the period 2005-12, the average operating margin for potash
producers accounting for 70% of current global output was 43%. The average margin
peaked in 2008 at 59%. Even more remarkably, profit margins only declined marginally
in 2009 when potash imports contracted by 51% yoy. These profitability levels put
potash in the same league as iron ore during the period 2008-11. However, whereas
iron ore margins were dependent on Chinese demand growth and high marginal
production costs, margins in potash are largely the result of producer discipline and are
likely to outlast the period of high iron ore margins by several years.
0% 10% 20% 30% 40% 50%
RoW
US
Jordan
Israel
Germany
China
Belarus
Russia
Canada
Reserves
Production
0% 20% 40% 60% 80% 100%
Thermal coal
Met coal
Iron ore
Potash
Top 5
Top 2
40%
50%
60%
70%
80%
90%
100%
2006 2007 2008 2009 2010 2011 2012
Canpotex and BPC Independent producers
average ‐ Canpotex and BPC
average ‐ independent producers

June 10, 2013 Global
Exhibit 36: Producer discipline has delivered high margins for the potash industry Operating margins for selected potash producers and global demand growth rates
Source: Company data, Goldman Sachs Global ECS Research
We estimate marginal FOB costs at US$300/t
In our view, the main drivers of production costs are (in order of importance):
Labor costs: potash production is relatively labor intensive. Average labor
productivity ranges from 0.5 to 2K tonnes of product per employee per year.
This compares with labor productivity rates of up to 10K tonnes per employee
in underground coal mining. On that basis, differences in wages and in labor
productivity across countries and between individual companies will have a
material impact on its position in the cost curve.
Mine depth: the deeper the mine shaft, the higher the costs of hauling potash
ore to the surface. By the same token, deeper mines with mining faces located
far from the shaft will incur higher operating costs transporting staff and
equipment to and from the mine face.
Ore grade: the higher the grade in the potash deposit, the less material needs
to be mined and processed in order to deliver one tonne of finished product.
Site-specific factors: some sites may benefit from weather conducive to solar
evaporation, which equates to lower energy costs. Conversely, some sites may
incur additional costs from mine flooding which requires regular brine
pumping or some other palliative measures.
We conduct a bottom-up analysis of production costs for a range of generic mine types
(Exhibit 37). We apply unit cost benchmarks from the coal industry to estimate mining
and processing costs, on the basis that underground mining and flotation tanks have
similar costs regardless of the type of ore being produced. On similar grounds we also
apply rail tariffs and port cost benchmarks from the coal industry. In our view, potash
mines located in the top quartile of the FOB cost curve are located in North America
and Europe. We estimate the current marginal cost of production at US$300/t.
0%
10%
20%
30%
40%
50%
60%
70%
80%
2005 2006 2007 2008 2009 2010 2011 2012
average

June 10, 2013 Global
Exhibit 37: We estimate marginal production costs at US$300/t Indicative production costs for generic mine types – US$ per tonne, unless otherwise indicated
Source: Company data, Goldman Sachs Global ECS Research estimates
Cost inflation has averaged 10%
Production costs have increased across a sample of major producers (Exhibit 38).
Excluding the boom/bust period of 2008-10 when production volumes and unit costs
varied significantly, the industry has experienced an average cost inflation rate of
approximately 10% on average in the periods 2002-7 and 2010-12.
Exhibit 38: The potash industry has experienced significant cost inflation
Annual increase in potash production costs for selected producers
Source: Company data, Goldman Sachs Global ECS Research estimates
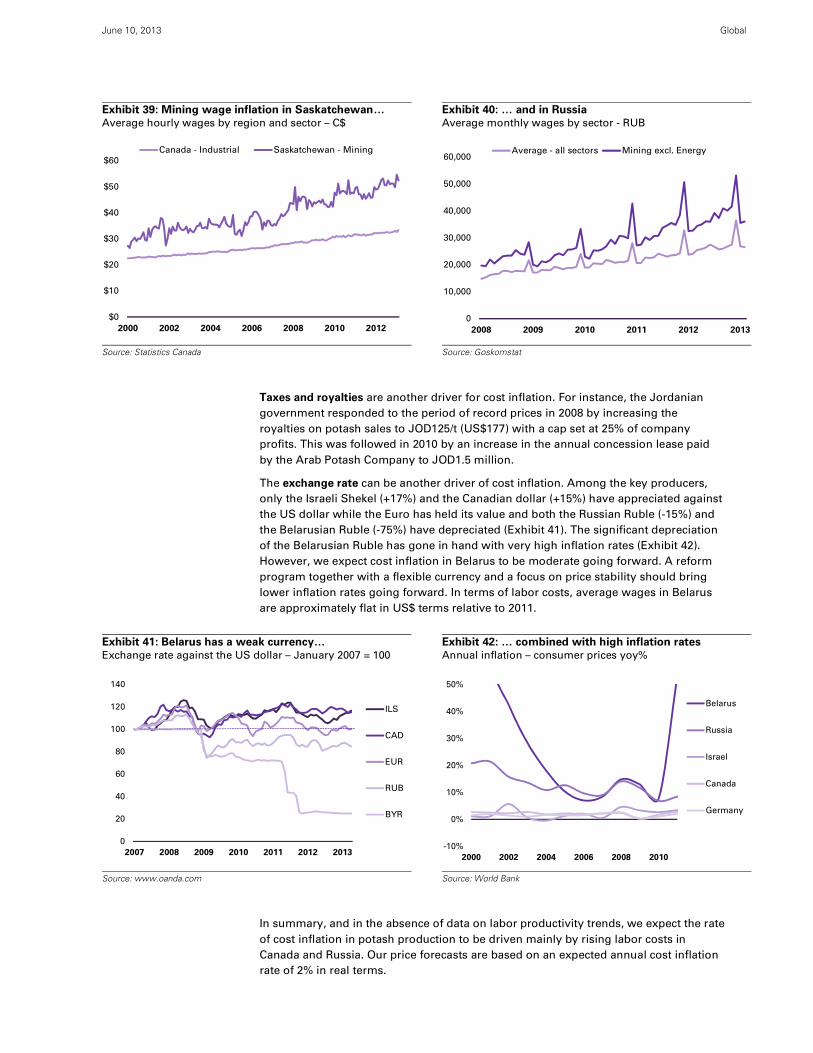
Wage inflation has been an important driver of rising costs, particularly in regions
enjoying a robust mining sector and suffering from a tight labor market. In
Saskatchewan, average wages in the mining sector have increased at an average
annual rate of 5% over the period 2000-12, outpacing wages in the broader Canadian
economy; they are now 62% higher (Exhibit 39). Employment in the mining sector will
grow by 42% in the next 10 years, according to the Saskatchewan Mining Association,
so this trend is likely to persist during our forecast period. Meanwhile, wages in the
Russian mining sector grew at an annual rate of 24% in the period 2000-08, before
slowing down to a still robust 13% over the period 2008-13; they are 42% higher than
the average wage (Exhibit 40)
Region Russia Belarus Germany Israel
Mine type UG - low cost UG - high cost UG UG UG EV
Mine depth meters 1,000 1,000 400 400 1,000 n/a
Mining $ / t ROM 30$ 45$ 30$ 25$ 60$ n/a
Ore grade % K ₂O 23% 22% 23% 23% 22% n/a
Beneficiation $ / t ROM 8$ 10$ 7$ 6$ 12$ n/a
Sub-total $ / t 104$ 158$ 101$ 85$ 206$ 150$
Sustaining capital $ / t 30$ 35$ 20$ 15$ 35$ 10$
Royalties (1) $ / t 32$ 27$ 4$ 106$ -$ 11$
Overheads $ / t 15$ 15$ 10$ 5$ 18$ 10$
FOR (cash cost) $ / t 151$ 200$ 115$ 196$ 224$ 171$
FOR (all-in) $ / t 181$ 235$ 135$ 211$ 259$ 181$
Distance to port km 1,800 1,800 2,250 750 450 50
Transportation rate $ / t.km 0.020$ 0.020$ 0.015$ 0.030$ 0.045$ 0.100$
Transportation $ / t 36$ 36$ 34$ 23$ 20$ 5$
Port fees $ / t 4$ 4$ 4$ 4$ 10$ 10$
FOB $ / t 221$ 275$ 173$ 238$ 290$ 196$
Freight (2) $ / t 30$ 30$ 18$ 18$ 14$ 18$
CIF $ / t 251$ 305$ 192$ 256$ 303$ 215$
North America
Notes: 1) includes both mining royalties and taxes but excludes corporate tax 2) estimated costs of sea freight to either Brazil or Southeast Asia
(whichever is closest) on a Handysize vessel
-40%
-20%
0%
20%
40%
60%
80%
100%
120%
2005 2006 2007 2008 2009 2010 2011 2012
boom/bust cycle
average
June 10, 2013 Global
Exhibit 39: Mining wage inflation in Saskatchewan…
Average hourly wages by region and sector – C$
Exhibit 40: … and in Russia
Average monthly wages by sector - RUB
Source: Statistics Canada
Source: Goskomstat
Taxes and royalties are another driver for cost inflation. For instance, the Jordanian
government responded to the period of record prices in 2008 by increasing the
royalties on potash sales to JOD125/t (US$177) with a cap set at 25% of company
profits. This was followed in 2010 by an increase in the annual concession lease paid
by the Arab Potash Company to JOD1.5 million.
The exchange rate can be another driver of cost inflation. Among the key producers,
only the Israeli Shekel (+17%) and the Canadian dollar (+15%) have appreciated against
the US dollar while the Euro has held its value and both the Russian Ruble (-15%) and
the Belarusian Ruble (-75%) have depreciated (Exhibit 41). The significant depreciation
of the Belarusian Ruble has gone in hand with very high inflation rates (Exhibit 42).
However, we expect cost inflation in Belarus to be moderate going forward. A reform
program together with a flexible currency and a focus on price stability should bring
lower inflation rates going forward. In terms of labor costs, average wages in Belarus
are approximately flat in US$ terms relative to 2011.
Exhibit 41: Belarus has a weak currency…
Exchange rate against the US dollar – January 2007 = 100
Exhibit 42: … combined with high inflation rates
Annual inflation – consumer prices yoy%
Source: www.oanda.com
Source: World Bank
In summary, and in the absence of data on labor productivity trends, we expect the rate
of cost inflation in potash production to be driven mainly by rising labor costs in
Canada and Russia. Our price forecasts are based on an expected annual cost inflation
rate of 2% in real terms.
$0
$10
$20
$30
$40
$50
$60
2000 2002 2004 2006 2008 2010 2012
Canada - Industrial Saskatchewan - Mining
0
10,000
20,000
30,000
40,000
50,000
60,000
2008 2009 2010 2011 2012 2013
Average - all sectors Mining excl. Energy
0
20
40
60
80
100
120
140
2007 2008 2009 2010 2011 2012 2013
ILS
CAD
EUR
RUB
BYR
-10%
0%
10%
20%
30%
40%
50%
2000 2002 2004 2006 2008 2010
Belarus
Russia
Israel
Canada
Germany

June 10, 2013 Global
Growth projects will deliver 19Mt of new capacity by 2020
Rather than discounting the potential production of all growth projects, we have
chosen instead to make a binary decision on each project on the basis of its likely
position in the cost curve, its capital intensity and the company’s access to finance as
well as other risk factors. We exclude projects from our supply/demand forecasts,
which would add an additional 19Mt of production by 2020 if approved (Exhibit 43). We
expect the majority of new production to come from Canada (Exhibit 44).
Exhibit 43: We expect 19Mt in new capacity by 2020 Risked and unrisked supply growth - Mt
Exhibit 44: Canada will drive future supply growth Geographical distribution - 2020E production growth
Source: Company data, Goldman Sachs Global ECS Research
Source: Company data, Goldman Sachs Global ECS Research
The forecast of supply growth is subject to significant uncertainty. First, a large number
of potash projects are still awaiting board approval; this is particularly the case for
Jansen, which at 8Mtpa is by far the largest project in the pipeline. Second, the potash
industry has limited experience in developing growth projects in recent times,
particularly for greenfield sites. Whereas the global industry has added on average
0.5Mt in incremental annual capacity per year over the period 2000-12, we expect an
average annual increase of 2.4Mt in the period to 2020. This represents a five-fold
increase in terms of supply growth, and we expect that it will test the project
management and engineering skills of the industry. In other words, the risks of project
slippage (schedule and cost) are relatively high when compared with projects in the
iron ore and coal industries where such expertise is in ample supply.
We provide a sample of potash projects where first production is expected before 2020
(Exhibit 45). The list may not be exhaustive, but it is nevertheless representative of the
diversity of the global project pipeline in terms of location, project type, mine type and
capital intensity. Based on this sample, the average level of capital intensity is
~US$1,000/t. Assuming that the marginal project will have similar operating costs as
the marginal producers in operation today, we estimate the inducement price at
US$400/t in 2013 US$ terms, equivalent to US$475/t in 2018 US$ terms.
-
5
10
15
20
25
30
35
40
45
50
2013 2014 2015 2016 2017 2018 2019 2020
Unrisked
Risked
Canada
68%
Russia
4%
Belarus
9%
Israel
2%
RoW
17%

June 10, 2013 G
lobal
Goldm
an Sachs Global Econom
ics, Com
modities and Strategy R
esearch
22
Exhibit 45: The growth pipeline suggests capital intensity for greenfield projects is in excess of US$1,000/t
A selective sample of potash projects
Source: Company data, Goldman Sachs Global ECS Research estimates
Note on capital intensity: Although we have estimated the capital intensity of potash projects based on available information, we do
so in the knowledge that comparisons between projects can be misleading. A low figure (in US$ per tonne of capacity) for a project
may simply reflect the fact that mining equipment capex has been excluded from the balance sheet because contractors will operate
the site. Conversely, a higher than average capital intensity figure may reflect the development capital for rail and port infrastructure
and/or for life extensions and latent capacity for future expansions.
Country Company Mine Basin Ore Type Mine typeProject
Type
Production
CapacityStart date Status Capex Capex/t
Belarus Belaruskali Berezovsky ph 1-3 Starobin basin Sylvinite Underground bf 1.4 2013 Development 540$ 386$
Belarus Belaruskali Krasnoslobodsky ph 3 Starobin basin Sylvinite Underground bf 0.7 2013 Development 270$ 386$
Canada Mosaic Belle Plaine ph 2 Saskatchewan Solution Mining bf 0.4 2013 Development 102$ 255$
Canada Mosaic Colonsay ph 2 Saskatchewan Underground bf 0.5 2013 Development 255$ 510$
Canada Mosaic Esterhazy K2 Saskatchewan Sylvinite Underground bf 0.9 2013 Operation 700$ 778$
Canada Potash Corp Allan I Saskatchewan Underground bf 1.0 2013 Development 785$ 785$
Canada Potash Corp Cory II Saskatchewan Underground bf 1.0 2013 Development 755$ 755$
Canada Potash Corp New Brunswick New Brunswick Underground bf 1.2 2013 Development 2,203$ 1,836$
Russia Uralkali Debottlenecking Upper Kama Mixed Underground bf 1.0 2013 Development 192$ 192$
US Intrepid Mining HB Solar Carlsbad, New Mexico Sylvite Solution Mining bf 0.2 2013 Development 215$ 1,075$
Canada Agrium Vanscoy Saskatchewan Underground bf 1.0 2014 Development 1,500$ 1,500$
Canada Potash Corp Rocanville Saskatchewan Underground bf 2.7 2014 Development 2,856$ 1,058$
Israel ICL Debottlenecking Dead Sea Carnallite Surface Aquifer bf 0.5 2015 Development 188$ 376$
ROC MagIndustries Mengo ROC Carnallite Solution Mining gf 1.2 2015 Feasibility 723$ 603$
Canada K+S Legacy ph 1&2 Saskatchewan Solution Mining gf 2.9 2016 Development 3,315$ 1,143$
Turkmenistan Turkmenkhimiya Garlyk Guardak/Garlyk Underground gf 1.4 2016 Development 1,200$ 857$
Brazil Verde Potash Cerrado Verde ph1 Minas Gerais Silicate Opencast gf 0.6 2017 PFS 598$ 997$
Canada K+S Legacy ph 1-2 Saskatchewan Solution Mining gf 2.9 2017 Development 4,100$ 1,434$
Canada Mosaic Belle Plaine ph 3 Saskatchewan Solution Mining bf 0.5 2017 On hold 700$ 1,400$
Canada Mosaic Colonsay ph 3 Saskatchewan Underground bf 1.5 2017 On hold 2,100$ 1,400$
Canada Mosaic Esterhazy K3 Saskatchewan Sylvinite Underground bf 0.9 2017 Development 1,000$ 1,111$
Canada Western Potash Milestone Saskatchewan Solution Mining gf 2.8 2017 Feasibility 2,900$ 1,036$
Russia Acron Talitsky Verkhnekamsk Mixed Underground gf 2.0 2017 Development 2,000$ 1,000$
Russia Eurochem VolgaKaliy phase 1&2 Karatau basin Mixed Underground gf 4.6 2017 Development 3,783$ 822$
UK Sirius Minerals York Potash North Yorkshire Polyhalite Underground gf 5.0 2017 PFS 1,700$ 340$
Argentina Vale Rio Colorado ph 1 Mendoza province Solution Mining gf 2.4 2018 On hold 6,000$ 2,500$
Canada BHP Billiton Jansen Saskatchewan Underground gf 8.0 2018 Feasibility 12,000$ 1,500$
Russia Eurochem Usolskiy ph 1&2 Karatau basin Mixed Underground gf 3.7 2018 Development 2,850$ 770$
Argentina Vale Rio Colorado Mendoza province Solution Mining gf 1.9 2020 On hold n/a n/a
Russia Uralkali Ust-Yayvinksy Upper Kama Mixed Underground gf 2.8 2021 Development 1,605$ 573$
Canada K+S Legacy ph 3 Saskatchewan Solution Mining bf 1.1 2034 Feasibility 700$ 614$
Total (unrisked) 58.7 57,835$ 985$

Risks to our views
We highlight a set of risks that have the potential to undermine our forward view of the
global market and our investment thesis for potash. The key risks on the demand side are:
Agricultural commodity prices: crop prices are influenced by weather variations
and by changes in production volumes and stock levels. This in turn determines
the incentive that farmers have in increasing fertilizer for the next harvest.
Fertilizer subsidies: in certain markets such as India, fertilizer demand is highly
sensitive to the level of subsidies provided by the government. Future demand
growth will continue to depend in part on future policy changes.
Productivity and efficiency improvements: Mature markets tend to enjoy higher
returns on their use of fertilizer. This is the result of crop management practices
adapted and fine-tuned to local conditions over several decades. Emerging
markets on the other hand may lag behind in terms of technical knowledge,
implementation of best practice, or both. This may lead to rates of potash fertilizer
that may be above or below their optimal level. As farmers in emerging markets
become more sophisticated, potash consumption could have upside or downside
risks depending on the region and crop type.
Organic substitutes: environmental concerns regarding the excess use of chemical
fertilizers are likely to increase over time in certain regions. This may drive the
search for substitutes in the form of manure, human/animal/industrial waste and
other sources of organic nutrients.
The key risks on the supply side are:
Future investment in potash production: the growth in potash production capacity,
and therefore the level of capacity utilization during our forecast period, will
depend on the rate of capital investment by mining companies. High barriers to
entry and a large universe of investment opportunities in the resources sector (e.g.
copper, iron ore, metallurgical coal, etc.) have contributed to relatively low levels
of capacity growth to date. However, future capacity growth may outpace global
demand growth as new entrants establish a foothold in the potash industry.
Conversely, the current pipeline of growth projects may underperform relative to
our estimates, leading to a tighter market and higher prices. We note that most
growth projects are at a relatively early stage, and the potash industry as a whole
suffers from a lack of recent experience in large project execution.

June 10, 2013 Global
Goldman Sachs Global Economics, Commodities and Strategy Research 24
Appendix: Potash 101
Potash is a relatively unknown commodity in the natural resources sector. In this appendix
we provide a brief overview of the production process, and we also provide additional
background on fertilizers.
Potash mining and beneficiation
Underground mining is the primary method of extracting potash ore, accounting for 76% of
2012 production (Exhibit 46). The mine depth typically ranges between 400 and 1,000
meters, and conventional mining methods such as continuous miners and longwalls are
used. The ore is transported in conveyor belts from the mine face to the bottom of the shaft,
from where it is hauled to the surface for processing.
Solution mining is an alternative method used in cases where the deposit is buried at
depths greater than 1,000 meters and conventional mining is not practical. Brine is injected
at high temperature as a way to dissolve the potash salt. The brine is then pumped back to
the surface where the potash can be recovered in ponds. Solution mining accounts for 6%
of global potash production and is mainly used in Canada and the US.
In a few cases, potash deposits are accessible at ground level in the form of surface water
bodies (e.g. saline aquifers or inland seas). In that case, the brine is pumped into
evaporation ponds where the potash salts can be harvested. This production method
accounts for 18% of global potash production, mainly from the Dead Sea, with smaller
volumes in China, Chile and the US.
Exhibit 46: Potash production chain Potash mining and processing flow
Source: Company data, Goldman Sachs Global ECS Research estimates
The raw potash ore typically has a KCl content of approximately 35%, and it is usually
crushed into small particles to facilitate the separation of the different minerals (however,
Underground
MiningCrushing and
De-slimingFlotation
DewateringSizing and
Granulation
Potash seams are mined
and hauled up to 1,000
meters to the surface
76%of global
production
6%of global
production
18%of global
production
Thermal
Dissolution
Solar
Evaporation
Standard
Product
<0.6 mm
Premium
Product
granulated
Solution
Mining
Surface Water
Bodies
Brine is pumped at high
temperature to dissolve
potash at depths > 1,000m
Natural deposits (e.g. Dead
Sea) with high potash
levels to be exploited
commercially
KCl crystallises out of the
saturated brine as it cools
down
Ore is crushed into small
particles to enable
beneficiation
Air bubbles carry KCl to the
surface of the tank where it
is separated from NaCl
Water dried from natural
ponds, leaving salt
deposits

June 10, 2013 Global
Goldman Sachs Global Economics, Commodities and Strategy Research 25
the potash industry reports ore grades in terms of K2O content, with typical grades around
23%). There are several alternative methods to beneficiate potash ore. The most common
is the flotation process, where the ore is placed in tanks where air bubbles stick to KCl
particles and carry them to the surface where they can be collected, while the residues sink
to the bottom. Alternatively, the ore can be dissolved in brine at high temperature (~110°C).
The solubility of KCl and NaCl varies at different temperatures, and as the brine cools down
the potash crystallizes and is filtered out of the solution. Other beneficiation methods
include electrostatic separation and heavy media separation but their use is less
widespread.
The final product is a fine powder that is either pink or white, depending on the
beneficiation process. This standard product can be granulated into a premium product for
ease of handling an application.
An introduction to potash fertilizers
Fertilizers are the primary end use of potash, accounting for approximately 90% of global
demand. Potash fertilizer is usually applied during sowing, but in certain soil types a
second application is necessary to ensure a steady supply of K to the crop. The amount of
potash required depends on a range of factors, including the soil type, the amount of K
already present in the soil and the amount of recycling of organic residue (Exhibit 47).
Potash brings the following benefits to crops:
Growth: potash helps regulate the metabolism of crops and it enhances the
absorption of other nutrients, improving the efficiency of N and P fertilizers.
Yield: potash increases the tolerance to drought and frost, thereby reducing
potential crop losses.
Quality: potash can lead to higher protein and vitamin content in crops and bigger
size of fruits, thereby increasing the commercial value of the crop.
Exhibit 47: Potash use in crops Potash balance in the crop lifecycle
Source: Goldman Sachs Global ECS Research
In the short run, fertilizer demand from commercial farms depends in part on crop prices
(Exhibit 48). When crop stocks are high and prices for agricultural commodities are low,
farmers will be incentivized to reduce costs. When the cycle moves and crop prices are
Leaching into the
ground (e.g.
sandy soil)
Fixation in the soil
(e.g. heavy black
soils)
Excess K remains in
the soil for future
planting seasons
Fertilizer application
(usually at sowing
time)
Every harvest
removes K
from the soil
Straw and other crop residues can
be used as organic fertilizer

June 10, 2013 Global
Goldman Sachs Global Economics, Commodities and Strategy Research 26
high (e.g. following a poor harvest), farmers will be incentivized to maximize production,
partly via the greater use of fertilizer.
Exhibit 48: Fertilizer demand is sensitive to crop prices
The crop cycle and its impact on farmer incentives and fertilizer use
Source: Goldman Sachs Global ECS Research
The amount of potash fertilizer also depends on the type of crop (Exhibit 49). For example,
cereals tend to have a lower requirement for potash than some higher value crops such as
fruits and vegetables.
Exhibit 49: Fertilizer use varies by crops
Indicative nutrient requirements by crop type – in kg of nutrient per hectare
Source: International Potash Institute
Other end uses of potash
Industrial demand for potash accounts for approximately 10% of global demand. It comes
from a wide range of applications, including: aluminium recycling, mud for oil-well drilling,
water softening and several chemical compounds used in downstream applications from
cement to soap manufacturing.
Fixed Costs
Variable Costs
incl. fertilizers
Profit
Year 1 Year 2 Year 3
Harvest
Prices
IncentiveReduce
costs
Maximise
yield
Crop prices
decline
Crop prices
rally
Yield
t/ha N P K N P K
Corn 6 120 50 120 120 60 60
Rice 5 110 34 156 120 60 60
Wheat 6 170 75 175 120 60 60
Potato 40 175 80 310 150 60 150
Required from chemical fertilizersContained in harvested crop
Nutrients - kg/ha

June 10, 2013 Global
Goldman Sachs Global Economics, Commodities and Strategy Research 27
Disclosure Appendix
Reg AC
We, Christian Lelong, Damien Courvalin and Jeffrey Currie, hereby certify that all of the views expressed in this report accurately reflect our personal
views, which have not been influenced by considerations of the firm's business or client relationships.
Disclosures
Global product; distributing entities
The Global Investment Research Division of Goldman Sachs produces and distributes research products for clients of Goldman Sachs on a global
basis. Analysts based in Goldman Sachs offices around the world produce equity research on industries and companies, and research on
macroeconomics, currencies, commodities and portfolio strategy. This research is disseminated in Australia by Goldman Sachs Australia Pty Ltd
(ABN 21 006 797 897); in Brazil by Goldman Sachs do Brasil Corretora de Títulos e Valores Mobiliários S.A.; in Canada by Goldman, Sachs & Co.
regarding Canadian equities and by Goldman, Sachs & Co. (all other research); in Hong Kong by Goldman Sachs (Asia) L.L.C.; in India by Goldman
Sachs (India) Securities Private Ltd.; in Japan by Goldman Sachs Japan Co., Ltd.; in the Republic of Korea by Goldman Sachs (Asia) L.L.C., Seoul
Branch; in New Zealand by Goldman Sachs New Zealand Limited; in Russia by OOO Goldman Sachs; in Singapore by Goldman Sachs (Singapore)
Pte. (Company Number: 198602165W); and in the United States of America by Goldman, Sachs & Co. Goldman Sachs International has approved this
research in connection with its distribution in the United Kingdom and European Union.
European Union: Goldman Sachs International, authorized and regulated by the Financial Services Authority, has approved this research in
connection with its distribution in the European Union and United Kingdom; Goldman Sachs AG and Goldman Sachs International
Zweigniederlassung Frankfurt, regulated by the Bundesanstalt für Finanzdienstleistungsaufsicht, may also distribute research in Germany.
General disclosures
This research is for our clients only. Other than disclosures relating to Goldman Sachs, this research is based on current public information that we
consider reliable, but we do not represent it is accurate or complete, and it should not be relied on as such. We seek to update our research as
appropriate, but various regulations may prevent us from doing so. Other than certain industry reports published on a periodic basis, the large
majority of reports are published at irregular intervals as appropriate in the analyst's judgment.
Goldman Sachs conducts a global full-service, integrated investment banking, investment management, and brokerage business. We have
investment banking and other business relationships with a substantial percentage of the companies covered by our Global Investment Research
Division. Goldman, Sachs & Co., the United States broker dealer, is a member of SIPC (http://www.sipc.org).
Our salespeople, traders, and other professionals may provide oral or written market commentary or trading strategies to our clients and our
proprietary trading desks that reflect opinions that are contrary to the opinions expressed in this research. Our asset management area, our
proprietary trading desks and investing businesses may make investment decisions that are inconsistent with the recommendations or views
expressed in this research.
The analysts named in this report may have from time to time discussed with our clients, including Goldman Sachs salespersons and traders, or may
discuss in this report, trading strategies that reference catalysts or events that may have a near-term impact on the market price of the equity
securities discussed in this report, which impact may be directionally counter to the analysts' published price target expectations for such stocks. Any
such trading strategies are distinct from and do not affect the analysts' fundamental equity rating for such stocks, which rating reflects a stock's
return potential relative to its coverage group as described herein.
We and our affiliates, officers, directors, and employees, excluding equity and credit analysts, will from time to time have long or short positions in,
act as principal in, and buy or sell, the securities or derivatives, if any, referred to in this research.
This research is not an offer to sell or the solicitation of an offer to buy any security in any jurisdiction where such an offer or solicitation would be
illegal. It does not constitute a personal recommendation or take into account the particular investment objectives, financial situations, or needs of
individual clients. Clients should consider whether any advice or recommendation in this research is suitable for their particular circumstances and, if
appropriate, seek professional advice, including tax advice. The price and value of investments referred to in this research and the income from them
may fluctuate. Past performance is not a guide to future performance, future returns are not guaranteed, and a loss of original capital may occur.
Fluctuations in exchange rates could have adverse effects on the value or price of, or income derived from, certain investments.
Certain transactions, including those involving futures, options, and other derivatives, give rise to substantial risk and are not suitable for all investors.
Investors should review current options disclosure documents which are available from Goldman Sachs sales representatives or at
http://www.theocc.com/about/publications/character-risks.jsp. Transaction costs may be significant in option strategies calling for multiple purchase
and sales of options such as spreads. Supporting documentation will be supplied upon request.
In producing research reports, members of the Global Investment Research Division of Goldman Sachs Australia may attend site visits and other
meetings hosted by the issuers the subject of its research reports. In some instances the costs of such site visits or meetings may be met in part or in
whole by the issuers concerned if Goldman Sachs Australia considers it is appropriate and reasonable in the specific circumstances relating to the
site visit or meeting.
All research reports are disseminated and available to all clients simultaneously through electronic publication to our internal client websites. Not all
research content is redistributed to our clients or available to third-party aggregators, nor is Goldman Sachs responsible for the redistribution of our
research by third party aggregators. For all research available on a particular stock, please contact your sales representative or go to
http://360.gs.com.
Disclosure information is also available at http://www.gs.com/research/hedge.html or from Research Compliance, 200 West Street, New York, NY
10282.
© 2013 Goldman Sachs.
No part of this material may be (i) copied, photocopied or duplicated in any form by any means or (ii) redistributed without the prior written consent of The Goldman Sachs Group, Inc.