A Fault-Tolerant Location Approach for Transient Voltage ...
25
University of Rhode Island DigitalCommons@URI Department of Electrical, Computer, and Biomedical Engineering Faculty Publications Department of Electrical, Computer, and Biomedical Engineering 2016 A Fault-Tolerant Location Approach for Transient Voltage Disturbance Source Based on Information Fusion Guoqing Weng Feiteng Huang See next page for additional authors Creative Commons License is work is licensed under a Creative Commons Aribution 4.0 License. Follow this and additional works at: hps://digitalcommons.uri.edu/ele_facpubs is Article is brought to you for free and open access by the Department of Electrical, Computer, and Biomedical Engineering at DigitalCommons@URI. It has been accepted for inclusion in Department of Electrical, Computer, and Biomedical Engineering Faculty Publications by an authorized administrator of DigitalCommons@URI. For more information, please contact [email protected]. Citation/Publisher Aribution Weng, G.; Huang, F.; Yan, J.; Yang, X.; Zhang, Y.; He, H. A Fault-Tolerant Location Approach for Transient Voltage Disturbance Source Based on Information Fusion. Energies 2016, 9, 1092. Available at: hps://doi.org/10.3390/en9121092
Transcript of A Fault-Tolerant Location Approach for Transient Voltage ...

University of Rhode IslandDigitalCommons@URI
Department of Electrical, Computer, andBiomedical Engineering Faculty Publications
Department of Electrical, Computer, andBiomedical Engineering
2016
A Fault-Tolerant Location Approach for TransientVoltage Disturbance Source Based on InformationFusionGuoqing Weng
Feiteng Huang
See next page for additional authors
Creative Commons License
This work is licensed under a Creative Commons Attribution 4.0 License.
Follow this and additional works at: https://digitalcommons.uri.edu/ele_facpubs
This Article is brought to you for free and open access by the Department of Electrical, Computer, and Biomedical Engineering atDigitalCommons@URI. It has been accepted for inclusion in Department of Electrical, Computer, and Biomedical Engineering Faculty Publicationsby an authorized administrator of DigitalCommons@URI. For more information, please contact [email protected].
Citation/Publisher AttributionWeng, G.; Huang, F.; Yan, J.; Yang, X.; Zhang, Y.; He, H. A Fault-Tolerant Location Approach for Transient Voltage DisturbanceSource Based on Information Fusion. Energies 2016, 9, 1092.Available at: https://doi.org/10.3390/en9121092

AuthorsGuoqing Weng, Feiteng Huang, Jun Yan, Xiaodong Yang, Youbing Zhang, and Haibo He
This article is available at DigitalCommons@URI: https://digitalcommons.uri.edu/ele_facpubs/61

Article
A Fault-Tolerant Location Approach for TransientVoltage Disturbance Source Based onInformation FusionGuoqing Weng 1, Feiteng Huang 1, Jun Yan 2, Xiaodong Yang 1, Youbing Zhang 1 and Haibo He 2,*
1 College of Information Engineering, Zhejiang University of Technology, Hangzhou 310023, China;[email protected] (G.W.); [email protected] (F.H.); [email protected] (X.Y.);[email protected] (Y.Z.)
2 Department of Electrical, Computer, and Biomedical Engineering, University of Rhode Island,Kingston, RI 02881, USA; [email protected]
* Correspondence: [email protected]; Tel.: +1-401-874-5844
Academic Editor: Silvio SimaniReceived: 15 July 2016; Accepted: 14 December 2016; Published: 20 December 2016
Abstract: This paper proposed a fault-tolerant approach based on information fusion (IF) toautomatically locate the transient voltage disturbance source (TVDS) in smart distribution grids.We first defined three credibility factors that will influence the reliability of the direction-judgments ateach power quality monitor (PQM). Then we proposed two rules of influence and a verification factorfor the distributed generation (DG) integration. Based on the two sets of direction-judgment criteria,a novel decision-making method with fault tolerance based on the IF theory is proposed for automaticlocation of the TVDS. Three critical schemes, including credibility fusion, conflict weakening, andcorrection for DG integration, have been integrated in the proposed fusion method, followed bya reliability evaluation of the location results. The proposed approach was validated on the IEEE13-node test feeder, and the TVDS location results demonstrated the effectiveness and fault toleranceof the IF based approach.
Keywords: transient voltage disturbance source; automatic location; direction-judgment;fault tolerance; DG integration; information fusion
1. Introduction
With the increasing amount of sensitive loads and the rapid development of electrical powermarket in smart distribution grids, the intelligent diagnosis of the power quality (PQ) has drawngrowing attention [1]. While the classification of PQ disturbance types has been the focus in manyfruitful studies [2–4], the accurate location of a power quality disturbance source remains a problemless studied. Nevertheless, the location plays a critical role in determining the cause, responsibility,and effective mitigation strategies [5]. According to statistics, transient voltage disturbance events,mainly the voltage sag and voltage swell, account for the highest portion of disturbances comparedto other PQ events [6]. There is an urgent need for advanced approaches for automatic location oftransient voltage disturbance source (TVDS) in smart distribution grids.
With the recent progress in networked power quality monitoring system (NPQMS) [7], locationstrategies of TVDS based on graph theory and matrix algorithm have been developed [5,8,9]. Comparedwith other strategies based on pattern recognition and artificial intelligence [10–12], the former utilizespower quality monitors (PQMs) for enhancements in the applicability to different types of TVDScaused by various reasons, the consistency of accuracy with different grid sizes and structures, and thesimplicity without complicated training beforehand.
Energies 2016, 9, 1092; doi:10.3390/en9121092 www.mdpi.com/journal/energies

Energies 2016, 9, 1092 2 of 23
There are two major tasks in the automatic location of the TVDS based on the graph theory andmatrix algorithm. The first task is the direction-judgment at each PQM. It determines the relativepositions between the TVDS and each PQM. In 2000, Parsons et al. first proposed the disturbancepower (DP) algorithm and the disturbance energy (DE) algorithm for voltage-sag events [13]. ImprovedDE [14] and other algorithms based on different PQ disturbance features, e.g., instantaneous energy [15],instantaneous voltage and current [16], have been published for the direction-judgment of TVDS.However, there was a common weakness in the binary direction-judgments in these algorithms:the judgments only indicate the TVDS locating in the UP or DOWN area with respect to eachPQM, which could be affected by many factors in a real distribution grid. However, there wereno metric to evaluate the reliability or credibility of these results numerically. Additionally, in thesmart distribution grid, an increasing number of distributed generators (DG) are being integrated,which has demonstrated critical influences on the existing direction-judgment algorithms [17,18].
The second task in automatic location of the TVDS is to determine the location of the TVDSbased on the direction-judgment in the whole NPQMS. Enabled by the theory of fault-location inpower grids, the matrix-based approach was first proposed by Won et al. [8], which integrated all thedirection-judgments and the topological information of the PQMs for the final location. Several studieshave tried to improve its performance or reduced the implementation cost [9,19]; the concept of virtualPQM was also introduced [9] to handle incomplete PQM installation. However, these traditionalmatrix-based methods lack the fault-tolerant capability: if any direction misjudgment exists in theNPQMS, the location result of the TVDS would become incorrect. The accuracy of the final locationresult depends on the absolutely reliable direction-judgments at every PQM, which is hard to guaranteein practice. To address this issue, the disturbance measure (DM) utilized the disturbance intensityto acquire both the direction and quantity of the transient voltage disturbance signal [20], but thedisturbance intensity is only one of many influence factors that need to be considered. In [17,21],the sensitivity and impact of the DG integration were considered, but the mechanism and rules behindthe influence of DG remained to be further explained.
To locate the TVDS with better reliability and accuracy in the smart distribution grid, the followinginformation can be utilized: (1) the credibility of direction-judgment corresponding to differentinfluence factors should be integrated; (2) the influence of DG integration to direction-judgment shouldbe verified and corrected; (3) multiple applicable criteria of direction-judgment for one same type ofTVDS could be integrated as multi-evidences fusion; and (4) other important information, such as grid’stopology, PQ measured data, layout of PQMs, and parameters of gird’s components, among others,should be integrated for PQ information completing and correlating. Considering these multi-sourceinformation and evidences with different properties, the existing matrix-based methodologies forTVDS location cannot provide good performance. Information fusion (IF) techniques [22] can improvethe decision-making process in an uncertain environment by the fused information with correlativeand integrative properties.
In this paper, we first analyze the influence of the multiple factors to the reliability of thedirection-judgment at each PQM in the NPQMS. Then, an improved fault-tolerant approach based onthe IF techniques is proposed to locate the TVDS for DG integrated smart distribution grid. The maincontributions of this paper are summarized as follows:
1. Three credibility factors are developed to denote quantitatively the reliability of thedirection-judgment of TVDS at each PQM considering multiple influence factors, including thedisturbance intensity and the fluctuation characteristic of transient voltage disturbance signals,and estimation errors at the virtual PQMs.
2. Two influence rules of DG integration on the direction-judgments are proposed. The rules can beused to verify whether mistake or reliability weakening takes place in direction-judgment at eachPQM in typical scenarios. It is the basis to correct the fault location of TVDS caused by the DGintegration in the subsequent decision-making.
Energies 2016, 9, 1092 3 of 23
3. An improved fault-tolerant approach, based on the IF techniques is proposed to automaticallylocate the TVDS for DG integrated smart grid. Three critical schemes, including multi-credibilitiesfusion and multi-evidences fusion, credibility weakening of conflict points, and correction for DGintegration, have been integrated for consideration in the proposed fusion method. Simulationresults demonstrate that the proposed approach has significantly improved fault-tolerantcapability and good applicability for various types of TVDS.
The rest of this paper is organized as follows. Section 2 introduces the limitation of the existingmethods and the overall framework of the proposed approach. Section 3 provides the detailedanalysis about the credibility factors that may affect the direction-judgments. Section 4 describesthe decision-making strategy for the automatic location of the TVDS based on multi-evidence fusiontheory, with consideration of the DG integration. Section 5 sets up simulation models and analyzesexperimental results. Section 6 draws some conclusions.
2. Overview of the Methodology
2.1. Limitation of Existing Matrix-Based Methods
To automatically locate the TDVS in a distribution network, existing matrix-based methods [5,8,9]first generate the coverage-matrix CL×N and the direction-matrix DN×1, where L and N are the totalnumbers of the lines and the monitors, respectively. CL×N denotes the relative directions betweeneach line and each PQM in the grid, and DN×1 denotes the relative directions between the TVDS andeach PQM when disturbance event happens. Their elements are illustrated in Equations (1) and (2).Then the result-matrix RL×1 can be obtained by RL×1 = [r1, r2, ..., rL]
T = CL×N × DN×1. If there existsRj = max{r1, r2, ..., rL} = N, the line Lj corresponding to rj is determined as the location of the TVDS.
cji =
{+1, i f Lj is in DOWN-area of PQMi−1, i f Lj is in UP-area of PQMi
(1)
di =
{+1, i f TVDS is in DOWN-area of PQMi−1, i f TVDS is in UP-area of PQMi
(2)
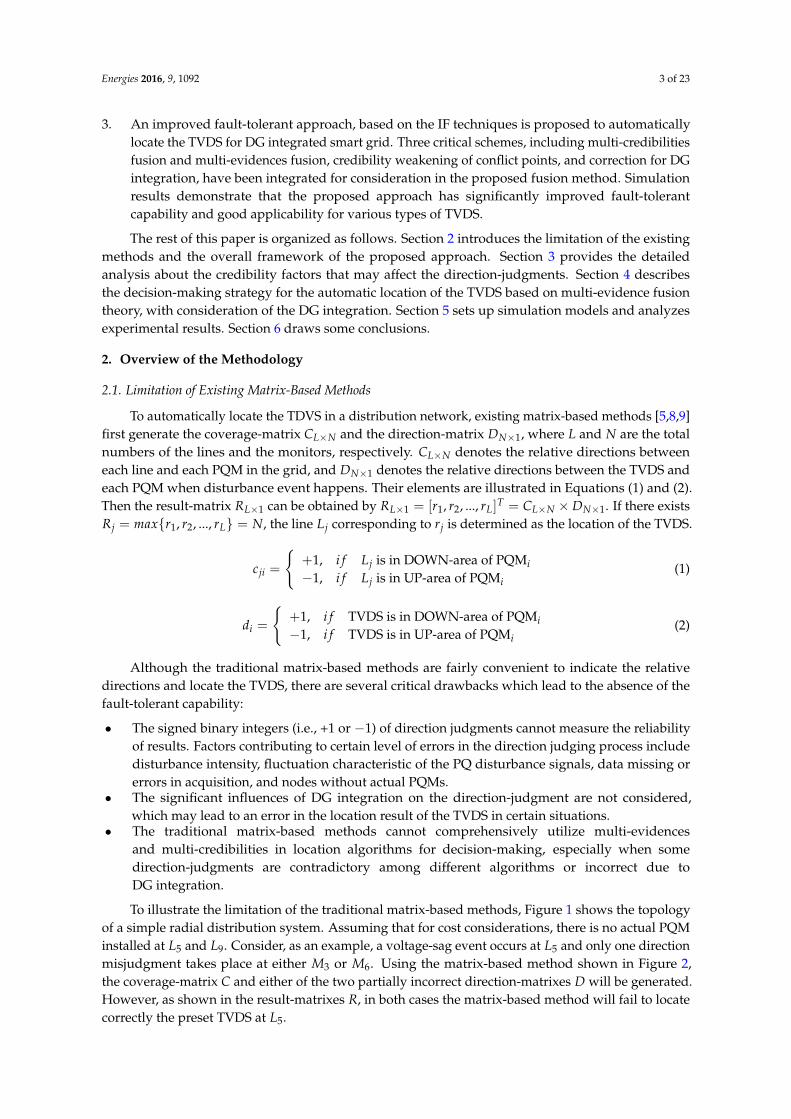
Although the traditional matrix-based methods are fairly convenient to indicate the relativedirections and locate the TVDS, there are several critical drawbacks which lead to the absence of thefault-tolerant capability:
• The signed binary integers (i.e., +1 or −1) of direction judgments cannot measure the reliabilityof results. Factors contributing to certain level of errors in the direction judging process includedisturbance intensity, fluctuation characteristic of the PQ disturbance signals, data missing orerrors in acquisition, and nodes without actual PQMs.
• The significant influences of DG integration on the direction-judgment are not considered,which may lead to an error in the location result of the TVDS in certain situations.
• The traditional matrix-based methods cannot comprehensively utilize multi-evidencesand multi-credibilities in location algorithms for decision-making, especially when somedirection-judgments are contradictory among different algorithms or incorrect due toDG integration.
To illustrate the limitation of the traditional matrix-based methods, Figure 1 shows the topologyof a simple radial distribution system. Assuming that for cost considerations, there is no actual PQMinstalled at L5 and L9. Consider, as an example, a voltage-sag event occurs at L5 and only one directionmisjudgment takes place at either M3 or M6. Using the matrix-based method shown in Figure 2,the coverage-matrix C and either of the two partially incorrect direction-matrixes D will be generated.However, as shown in the result-matrixes R, in both cases the matrix-based method will fail to locatecorrectly the preset TVDS at L5.

Energies 2016, 9, 1092 4 of 23
Figure 1. Topology of a simple grid and definition of DOWN/UP area.
Figure 2. Failure in TVDS location with one direction misjudgment.
2.2. Framework of the Proposed Approach
An overview of the framework of the proposed fault-tolerant location approach for TVDS basedon IF is shown in Figure 3. The preliminary modules in this framework during the pre-process areshown in white boxes, while the modules for the proposed approach are shown in orange boxes.
Figure 3. Overall framework of the proposed approach.
There are three basic components in the NPQMS, including all the monitors installed at the lines,the communication network and the IF center. First, the PQMs are responsible for disturbance PQsignals acquisition, features extraction, and disturbances identification. Then, the most important

Energies 2016, 9, 1092 5 of 23
data-processing tasks, such as information correlating, information completing, and intelligentdecision-making, will be executed in the IF center. Due to economic concerns and technical issues inpractice, the PQ information in the NPQMS is often incomplete [23,24], and the information completingmodule is thereby set up to solve this problem with the technique of PQ state estimation. As thedata center of the NPQMS, the integrated data platform need to collect and store all kinds of data,such as the acquisition and analysis data from the PQMs, the topological structure and componentsparameters of the grid, the layout information of the PQMs, the complete data from state estimation,the process data and results of decision-making, etc.
After the pre-process, four key modules in the focus of this paper at the IF center are:
• Credibility factors module: to measure the reliability of direction-judgment at each PQMwith consideration of multiple credibility factors, including disturbance intensity, fluctuationcharacteristic and state estimation.
• DG verification module: to analyze the influences of DG integration on the direction-judgment,deduce the influence rules, and define the verification factor.
• Fusion credibility module: to obtain the fusion credibility of the direction-judgments based onDempster-Shafer evidence theory, with integrated considering of multi-credibilities fusion andmulti-evidences fusion.
• Decision-making module: to automatically locate the TVDS for DG integrated smart grid withsatisfying fault-tolerant capability.
Each of the four modules will be described in the sections below.
3. Credibility of Direction-Judgement
To transient voltage disturbance event, both the polarity of the initial peak of the DP and thepolarity of the final DE value can be taken as the criteria of the direction-judgment between theTVDS and each PQM. The DP is the difference in the total instantaneous power and the steady-stateinstantaneous power, and the DE is the integral of the DP representing the change in energy flowthrough the PQM due to the disturbance. In this paper, we develop a new credibility metric ofdirection-judgment to properly measure the influences caused by those factors. The metric includesthe relative direction between the TVDS and each PQM used in the existing matrix-based methods,and adds the credibility of direction-judgments in various cases. Taking two typical criteria, i.e., the DPand DE algorithms, for example, three credibility factors are defined as follows. The following factorsare valid to both voltage sag and voltage swell caused by all kinds of TVDS.
3.1. Credibility Factor for Disturbance Intensity
Voltage disturbance signals are the basis of all direction-judgment algorithms for the TVDS.In general, the disturbance signals at PQMs that are distant from the TVDS are relatively weaker due toline loss and bypass flow. The DG integration can also alter the intensity in certain subareas. With thesame noise condition, the direction misjudgment is also more likely to occur under the weaker transientvoltage disturbance signals. It is the major factor that affects the credibility of the direction-judgment.
Suppose that a voltage-sag event caused by a single-phase grounding fault occurs at L6 inFigure 1, where a Gaussian white noise (GWN) with the same intensity is added. As shown inFigure 4, the impacts of the GWN on the direction-judgment are different at M4 and M8. Figure 4a,bshow that only the disturbance signals be changed slightly at M4, but the direction-judgment is notaffected. Meanwhile, the PQ disturbance intensity at M8 was quite weak, and thus we observed themisjudgment caused by this noise as shown in Figure 4c,d.

Energies 2016, 9, 1092 6 of 23
(a) (b)
(c) (d)
Figure 4. Effects on direction-judgments with different disturbance intensities. (a) DP at M4; (b) DE atM4; (c) DP at M8; (d) DE at M8.
To measure the effect of the transient voltage disturbance intensity with consideration to thetwo direction-judgment algorithms (DP and DE) [13,14], the credibility factor αv,i of disturbanceintensity is defined as:
αv,i =
{1, i f kv,i > θ1√
kv,i +(1−√
θ1)
, i f 0 ≤ kv,i ≤ θ1(3)
in which
kv,i = |∆Fv(i)|/|∆Fv,max| (4)
where v is a criteria indicator: v = 1 is for the DP algorithm and v = 2 is for the DE algorithm. θ1 isa threshold value less than 1, and the two square roots in Equation (4) prevent αi from being toosmall and transform the piecewise function to be a continuous function, respectively. ∆Fv(i) is thecharacteristic value of the transient voltage disturbance signal at PQMi and ∆Fv,max is the maximumamong all ∆Fv(i). ∆F1(i) is the initial peak value of the DP signal and ∆F2(i) is the stable final valueof the DE signal. As shown in Figure 5a, the range of αv,i is set as (1−
√θ1) ≤ αv,i ≤ 1, and there is
a strong positive correlation between αv,i and kv,i.
0 0.2 0.4 0.6 0.8 10
0.2
0.4
0.6
0.8
1
κv,i
α v,i
θ1=0.8
θ1=0.7
0 0.2 0.4 0.6 0.8 10
0.2
0.4
0.6
0.8
1
qi
β v,i
β1,i
, si=1
β1,i
, si=−1
β2,i
, si=−1
β2,i
, si=1
θ3=0.8
θ2=0.5
(a) (b)
Figure 5. Distribution characteristics αv,i of and βv,i. (a) αv,i with θ1 = 0.8 or θ1 = 0.7; (b) βv,i withθ2 = 0.5 and θ3 = 0.8.

Energies 2016, 9, 1092 7 of 23
3.2. Credibility Factor for Fluctuation Characteristics
The fluctuation characteristics of the transient voltage disturbance signals could differ significantly,which shall be taken into consideration when calculating the possibility of direction misjudgment.Compared to the DP signal which yields more intense fluctuation, the DE signal is more stable inthe presence of a voltage transient disturbance. According to [13], the threshold value, i.e., 0.8, is theempirical preference between the two algorithms. Namely, if the final value of DE is greater than orequal to 80% of the peak excursion of DE during the event, then disturbance direction is determinedby the DE algorithm; otherwise, the direction is determined by the DP algorithm.
The polarity fluctuation of the disturbance signal is also related to the credibility ofdirection-judgment. If the DP signal fluctuates frequently between the positive and negative polarities,the DE signal may fail to keep a strict monotonicity; the polarities between the final and initial peak DEvalues may even be reversed. In either case, its credibility should be reduced. As an example, Figure 6shows the DE signals detected at M7 and M3 when a voltage-sag event takes place at L7 in Figure 1caused by capacitors switching. A direction misjudgment will occur at M3 because of its distance fromthe TVDS that weakens the DE signal and leads to a failure of strict monotonicity.
(a) (b)
Figure 6. Effects on direction-judgments from different fluctuation characteristics. (a) DE signal at M7;(b) DE signal at M3.
According to the two laws for direction-judgment shown in [13], two new variables qi and si canbe defined to represent the characteristics of fluctuation intensity and monotonicity:
qi = |∆ER(i)/∆EPE(i)| (5)
si = sgn [∆EI(i) · ∆ER(i)] (6)
where ∆EI(i) and ∆ER(i) are the initial peak value and final value of DE signal at PQMi, respectively;∆EPE(i) is the peak excursion of DE signal during the PQ disturbance event at PQMi. If qi ≥ 0.8, the DEalgorithm is more credible; otherwise, the DP algorithm is more credible. Meanwhile, if the polarityof the initial peak of the DP matches that of the final DE value (i.e., si = 1 ), the direction-judgmentshould be assigned with higher credibility; otherwise, if si = −1, the credibility of direction-judgmentshould be reduced.
To measure the effect of fluctuation characteristics on the transient voltage disturbance signals,the corresponding credibility factors βv,i are defined as:
βv,i = [β1,i, β2,i] =
[1− 1−θ2
0.2 (qi − 0.8) , 1], i f qi ≥ 0.8∩ si = 1[θ3 − θ3−θ2
0.2 (qi − 0.8) , θ3], i f qi ≥ 0.8∩ si = −1[1 , 1−θ2
0.8 qi + θ2], i f qi < 0.8∩ si = 1[θ3 , θ3−θ2
0.8 qi + θ2], i f qi < 0.8∩ si = −1
(7)

Energies 2016, 9, 1092 8 of 23
where θ2 determines the minimum of βv,i, and θ3 determines the maximum of βv,i when si = −1.If si = 1, βv,i ∈ [θ2, 1]; if si = −1, βv,i ∈ [θ2, θ3]. Considering that the fluctuation characteristics ofthe voltage disturbance signal is also a factor in the credibility of the direction-judgment, we haverefined the range of θ2 as θ2 ∈ [0.4, 0.6] and θ2 < θ3 < 1. Figure 5b shows the general distributioncharacteristics of β1,i and β2,i in the case that we set θ2 = 0.5 and θ3 = 0.8.
3.3. Credibility Factor for State Estimation
To obtain the credibility factors αv,i and βv,i at each node, the minimal requirement of actualPQM installment is to satisfy the complete observability of the power quality information in theNPQMS. With the optimal placement of the PQMs [19], the missing or erroneous PQ informationcan be completed reasonably with data from state estimation [23,24] and taken as data collected froma “virtual” PQM, such as M5 and M9 shown in Figure 1. However, due to the estimation errors,the credibility of direction-judgments at the virtual PQMs should be reduced. Therefore, the credibilityof state estimation χv,i is adopted as an additional factor to the major credibility factor αv,i.
According to the theory of uncertainty in measurement [25], the concept uncertainty of estimationis defined to reflect the possible distribution range of the estimation error and can be considered as theerror limit under certain confidence probability. A relative deviation index di can be defined as:
di =hi,z1(x1)− hi,z2(x2)
Ui(p)(8)
where Ui(p) is the expanded uncertainty with the confidence probability p at virtual monitor Mi.x1 and x2 are the state estimation results for one same state variable at Mi based on two different actualmeasuring points z1 and z2, and hi,z1(x1) and hi,z2(x2) are their corresponding measurement functions.
A larger di means larger deviation between the two estimation results, and thus a lower credibilityshould be assigned. Mi can be considered as a normal estimation point if |di| ≤ 1, or an abnormalestimation point if |di| ≥ λ, or suspected estimation point if 1 < |di| < λ.
A feasible credibility function should satisfy the following requirements: the function shouldbe continuous and smooth; if |di| ≤ 1, the credibility of the state estimation at Mi should becomesaturated and close to 1; if |di| ≥ λ, the credibility of the state estimation at Mi should be close to 0;if 1 < |di| < λ, the credibility should decrease sharply.
To measure the effect of the state estimation, the credibility factor χv,i is defined as:
χv,i =
{1, i f ρi = 0
max { f (di), 0.5} , i f ρi = 1(9)
in which
f (di) = 1− [g (di) + g (−di)] (10)
g (di) =1
1 + e2kλ [di+(1+ λ
2 )](11)
where PQMi is an actual measuring point if ρi = 0 and a virtual measuring point if ρi = 1.According to [25], k is a real number between 2 to 5, and λ is a natural number between 2 to 6.
Figure 7 shows the distribution characters of f (di) with different λ and k. The drop of f (di)
is mainly determined by the parameter choice of λ. When λ is fixed, the credibility values at themiddle point, i.e., |di| = 2, are the same despite different values of k. Meanwhile, the credibilityvalues at another critical point, i.e., |di| = 1, is significantly influenced by different k. Considering therequirements of the credibility function and the distribution characters of f (di), this paper considersthe choice of λ = 2 and k = 3. We also have χ1,i = χ2,i where χv,i in the range of χv,i ∈ [0.5, 1].

Energies 2016, 9, 1092 9 of 23
Figure 7. Curves of f (di) with different λ and k.
4. DG Verification of Direction-Judgement
In the smart distribution grid with DG integration, a traditional radial network with singlepower supply turns into a multi-source system, causing a significant variation in the power flowdistribution [26,27]. Thus, the transient voltage disturbance intensity at each PQM may be affected,and direction misjudgments can take place in certain situation. Although the voltage sag events areused to demonstrate the influence of DG integration on TVDS, it is worth noting that the followinganalysis procedure and rules can also be applied to voltage swell caused by energy injection by simplyreversing the polarity of the parameters.
4.1. Influence Rules of DG Integration
To analyze the general influence of the DG integration, we first transform the grid shown inFigure 1 to a scalable topology as shown in Figure 8. The partial networks Na ∼ Nd represent anysub-networks with tree structure, which makes this model scalable for grids with radial structure.Moreover, we assume that one DG is connected to the grid at B4 and a voltage-sag event F takes placeat L1.
Figure 8. Scalable grid model with DG integration.
In Figure 8, we introduced the following notions: (1) (A_B) denotes the path from arbitrarycomponent A to B in the grid; (2) Link(G−DG) is the link between G and DG, i.e., (G_L1_L2_L5_DG);(3) Link(F−DG) is the link between DG and TVDS, i.e., (F_L2_L5_DG); (4) Bus(F−DG) is the busconnected to TVDS at the side of DG; and (5) NFi is the current-dividing network that includesall the partial networks and lines between Bus(F−DG) and PQMi. In addition, ∆Pi and ∆Ei are theDP and DE values at PQMi, ∆UF and ∆UB2 are the voltage variations at F and bus B2 in Figure 8

Energies 2016, 9, 1092 10 of 23
during the voltage-sag event, ∆EF is the DE value at TVDS, ∆PFB and ∆EFB are the DP and DE valuestransmitted from TVDS to Bus(F−DG), and ∆PFi and ∆EFi are the DP and DE values absorbed by NFi.
For the scalable topology shown in Figure 8, we can further distinguish it into different scenarios:
• Scenario 1: F is on Link(G−DG), PQMi is on Link(F−DG), |∆PFi| > |∆PFB|, and |∆EFi| > |∆EFB|.• Scenario 2: F is on Link(G−DG), PQMi is on Link(F−DG), but |∆PFi| < |∆PFB| and |∆EFi| < |∆EFB|.• Scenario 3: F is on Link(G−DG), but PQMi is not on Link(F−DG).• Scenario 4: F is not on Link(G−DG), and F is on the branch of Link(G−DG) in the UP-area of DG.• Scenario 5: F is not on Link(G−DG), and F is in the DOWN-area of DG.
(1) Scenario 1 and Scenario 2In Scenario 1 and 2, since voltage sag is an energy-absorbing disturbance, we have ∆EF > 0,
∆UF < 0 and ∆UB2 < 0. The power flow at L1 could be positive or negative for the DG integration.But in either situation, we have ∆Pb < 0, ∆PFB < 0, ∆Eb < 0 and ∆EFB < 0. Based on the energyconservation law at B2, we can obtain ∆P2 = ∆PFB − ∆Pb and ∆E2 = ∆EFB − ∆Eb. Given that Nb isactually NF2, two cases of the DP and DE algorithms of direction-judgment at M2 can be deduced as:
∆P2 =
{> 0 (DOWN − area), i f |∆PF2| > |∆PFB|< 0 (UP− area), i f |∆PF2| < |∆PFB|
(12)
∆E2 =
{> 0 (DOWN − area), i f |∆EF2| > |∆EFB|< 0 (UP− area), i f |∆EF2| < |∆EFB|
(13)
The direction-judgment at M2 will be incorrect if |∆PF2| > |∆PFB| or |∆EF2| > |∆EFB|. The sameobservation applies for the result obtained at B3, and two possible direction-judgments at M5 can beobtained according to the components of NF5 shown in Figure 8. The direction-judgment at M5 will bewrong if |∆PF5| > |∆PFB| or |∆EF5| > |∆EFB|.
The scalable topology shown in Figure 8 can represent arbitrary distribution grid with a treetopology and single-DG integration. Subsequently, we can conclude the first influence rule of DGintegration in direction-judgment as follows:
First influence rule: the direction-judgment at PQMi is wrong and should be reversed if the TVDSis on Link(G−DG), PQMi is on Link(F−DG), and |∆PFi| > |∆PFB| for DP signal or |∆EFi| > |∆EFB| forDE signal.
In the following discussion of Scenario 3 to 5, we will use the DE algorithm as an example toanalyze the influence of DG integration for the direction-judgment.
(2) Scenario 3In Scenario 3, there exist ∆EF > 0, ∆UB1 < 0, ∆UB2 < 0, ∆UB3 < 0, and ∆UB4 < 0 when the
voltage-sag occurs at F. Considering the effect of voltage stability of the DG integration, there alsoexist |∆UB1| < |∆U′B1|, |∆UB2| < |∆U′B2|, |∆UB3| < |∆U′B3| and |∆UB4| < |∆U′B4|, where ∆U′B1, ∆U′B2,∆U′B3 and ∆U′B4 are the variable values of voltage at the buses B1, B2, B3 and B4 if there has no DGintegration, respectively. Except for the PQMs on Link(G−DG), the variations of the DE values of thePQMs in the UP-area of TVDS (e.g., M1, Ma), on the branch of Link(F−DG) (e.g., M3, Mc) and in theDOWN-area of DG (e.g., Md), can be summarized as:
0 < ∆E1 < ∆E′1 (DOWN − area)∆E′a < ∆Ea < 0 (UP− area)∆E′3 < ∆E3 < 0 (UP− area)∆E′c < ∆Ec < 0 (UP− area)∆E′d < ∆Ed < 0 (UP− area)
(14)
where ∆E′1, ∆E′a, ∆E′3, ∆E′c and ∆E′d are the variations of the DE values at M1, Ma, M3, Mc and Md ifthere has no DG integration, respectively.

Energies 2016, 9, 1092 11 of 23
In Figure 8, the given TVDS (i.e., F) is in the UP-area of Ma, M3, Mc and Md, while in theDOWN-area of M1. Therefore, the results of direction-judgment at all the PQMs except for those areon Link(G−DG) are correct in this scenario, but only their disturbance intensities could be affected.
(3) Scenario 4 and Scenario 5In Scenario 4, the simplified scalable topology of Figure 8 is shown in Figure 9a, where we have
∆EF > 0, ∆UB2 < 0 and ∆UB4 < 0 when the voltage-sag occurs at F. Considering the effect of voltagestability of the DG integration, there also exist |∆UB2| < |∆U′B2| and |∆UB4| < |∆U′B4|. The variationsof the DE values at the PQMs in this scenario are:
0 < ∆E1 < ∆E′1 (DOWN − area)0 < ∆Eb < ∆E′b (DOWN − area)∆E′2 < ∆E2 < 0 (UP− area)∆E′d < ∆Ed < 0 (UP− area)
(15)
where ∆E′b, ∆E′2 are the variations of the DE values at Mb and M2 if there has no DGintegration, respectively.
(a) (b)
Figure 9. Simplified topologies in (a) Scenario 4 and (b) Scenario 5.
In Figure 9a, the given TVDS (i.e., F) is in the UP-area of M2 and Md, while in the DOWN-area ofM1 and Mb. Therefore, the results of direction-judgment at all the PQMs are correct in this scenario,but the disturbance intensities could be affected.
In Scenario 5, the simplified scalable topology is shown in Figure 9b. The partial network Nd isexpanded to two sub-networks (i.e., Ne and N f ), and G and DG can be regarded as one equivalentsource. Similarly, we have |∆UB4| < |∆U′B4|. The variations of the DE values at the PQMs in thisscenario can be deduced as:
0 < ∆E3 < ∆E′3 (DOWN − area)∆E′e < ∆Ee < 0 (UP− area)0 < ∆E4 < ∆E′4 (DOWN − area)
(16)
where ∆E′e, ∆E′4 are the variations of the DE values at Me and M4 if there has no DG integration,respectively.
In Figure 9b, the given TVDS (i.e., F) is in the UP-area of Me and the DOWN-area of M3 andM4. Therefore, the results of direction-judgment at all the PQMs are correct in this scenario, but thedisturbance intensities could be affected.
Combining the analyses of Scenario 2, Scenario 3, Scenario 4, and Scenario 5, we can derive thesecond influence rule of DG integration in direction-judgment:
Second influence rule: in cases other than state in the first rule, only the intensity of transientvoltage disturbance is influenced by the DG integration; the signs of the direction-judgmentsremain unaffected.

Energies 2016, 9, 1092 12 of 23
Based on the above analysis, comprehensive simulation tests of the disturbance signals have beencarried out to validate the two influence rules. Figures 10 and 11 illustrate the comparative case studiesof Scenario 1. It has been demonstrated that the reversal of the direction-judgments agrees with thefirst influence rule of DG integration. As the other scenarios will not result in direction misjudgment,the figures of the disturbance signals are not shown herein.
• Case 1: F is on Link(G−DG), PQMi is on Link(F−DG), |∆PFi| > |∆PFB| and |∆EFi| > |∆EFB|.• Case 2: same F and PQMi as Case 1 without DG integration.
(a) (b) (c)
Figure 10. Disturbance signals for Case 1: (a) voltage and current at F; (b) DP signal (c) DE signal.
(a) (b) (c)
Figure 11. Disturbance signals for Case 2: (a) voltage and current at F; (b) DP signal; (c) DE signal.
It should be noted that a distribution grid with a circular topology or multiple DGs integrationare more challenging due to the direction change of the power flow and the identification of the relatedlinks. While the proposed method is robust to different internal structures of the tree-like distributiongrid and positions of the DG connected, further investigations should be conducted for more dynamictopology and DG configurations in practice.
4.2. Verification Factor for DG Integration
The first influence rule of DG integration cannot be directly utilized as the other factors becausethe TVDS location is unknown in advance. Instead, it can be used to verify the accuracy of the primarylocation result of the TVDS if the location is on Link(G−DG). To achieve this goal, we define thepartial-DE as follows:
∆Epj = ∆Ej − ∆ELj − Σ∆Eout
j (17)
where ∆ELj is the DE loss at Lj, ∑ ∆Eoutj is the total DE value of all outgoing branches connected to the
nearest bus at the DOWN-area of Lj. As an example, the components of ∆Ep5 at L5 has been shown
in Figure 8.
Energies 2016, 9, 1092 13 of 23
By definition, ∆Epj = ∆EF if the TVDS is at Lj; otherwise, ∆Ep
j will be close to zero. Therefore,for any Lj on Link(G−DG), a partial verification factor δj is defined as:
δj =
{−1, if Lj ∈ Link(G−DG) and pj = 1
+1, otherwise(18)
in which
pj =∣∣∣∆Ep
j
/∆Ep
max
∣∣∣ (19)
where ∆Epmax is the maximum among all ∆Ep
j on Link(G−DG). If the primary location result is onLink(G−DG), δj will be used for verification and correction, and only the line Lj corresponding toδj = −1 will be trusted as the actual TVDS.
5. Location Based on Information Fusion
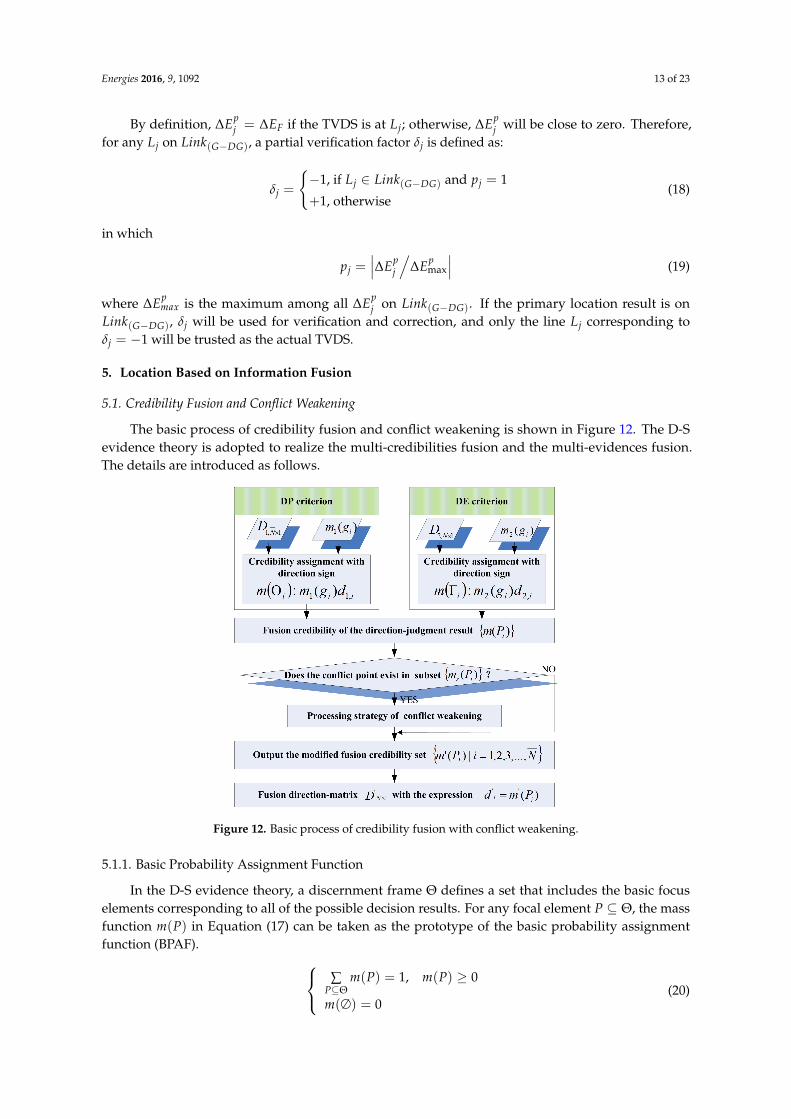
5.1. Credibility Fusion and Conflict Weakening
The basic process of credibility fusion and conflict weakening is shown in Figure 12. The D-Sevidence theory is adopted to realize the multi-credibilities fusion and the multi-evidences fusion.The details are introduced as follows.
Figure 12. Basic process of credibility fusion with conflict weakening.
5.1.1. Basic Probability Assignment Function
In the D-S evidence theory, a discernment frame Θ defines a set that includes the basic focuselements corresponding to all of the possible decision results. For any focal element P ⊆ Θ, the massfunction m(P) in Equation (17) can be taken as the prototype of the basic probability assignmentfunction (BPAF). ∑
P⊆Θm(P) = 1, m(P) ≥ 0
m(∅) = 0(20)

Energies 2016, 9, 1092 14 of 23
As for the decision goal of the TVDS location, supposing that each PQMi in the NPQMS isnumbered as gi, we can construct Θ = {gi|i = 1, 2, ..., N}, where N is the total number of all the actualand virtual PQMs.
Considering both the DP algorithm and the DE algorithm as the criteria of direction-judgment forthe TVDS, their respective integrated credibility factor ωv(i) of the direction-judgment at PQMi can beobtained by:
ωv (i) = αv,i · βv,i · χv,i (21)
where v is the same criteria indication defined before (i.e. v = 1 is for the DP algorithm and v = 2 isfor the DE algorithm).
The BPAF for both criteria are expressed as:
mv (gi) =
ω∗v (i) = ωv(i)/N∑
i=1ωv(i), gi ∈ Θ
0, gi = ∅(22)
5.1.2. Credibility Fusion Based on D-S Evidence Theory
For the TVDS location, the direction-judgments from the two criteria can be taken as two differentevidences, and each of them has respective BPAF and complete direction-matrix Dv,N×1. D1,N×1and D2,N×1 can be generated by Equation (2) according to the DP algorithm and the DE algorithm,respectively. Therefore, two groups of basic credibilities containing both the direction-judgmentinformation and the credibility information can be constructed as:{
m(Oi) : m1 (g1) d1,1, ..., m1(
gN)
d1,Nm(Γi) : m2 (g1) d2,1, ..., m2
(gN)
d2,N(23)
where Oi and Γi are the focal elements of the two BPAF, d1,i and d2,i are the row elements of D1,N×1 andD2,N×1, respectively. m1(gi) and m2(gi) are the values of the BPAF corresponding to the two criteria.
D-S evidence theory can be used to obtain the fusion credibility of these two criteria. However,in some cases, the direction-judgments based on the two criteria at a given PQM may be conflict (i.e.,d1,i 6= d2,i), in which the evidence combination rule of traditional D-S theory is unable to addressevidence data with different signs. To solve this problem, an improved evidence combination ruleis proposed:
m(Pi) =
s1 (Kτ)−1 ∑
Pi=Oi∩Γi
|m(Oi)m(Γi)| , s1 = s2 or {s1 6= s2, km ≥ 1}
s2 (Kτ)−1 ∑Pi=Oi∩Γi
|m(Oi)m(Γi)| , s1 6= s2, km < 1
0, Pi = φ
(24)
in whichKτ = 1− K = 1− ∑
Oi∩Γi=φ
|m(Oi)m(Γi)| (25)
s1 = sgn [m(Oi)] , s2 = sgn [m(Γi)] (26)
km = |m(Oi)|/|m(Γi)| (27)
where K ∈ [0, 1) is the conflict factor between the two focal elements Oi and Γi, and Pi is the intersectionof Oi and Γi. In this way, the sign of the fusion credibility m(Pi) is either s1 or s2 if the signs of m(Oi)

Energies 2016, 9, 1092 15 of 23
and m(Γi) are consistent; otherwise, the sign of m(Pi) is determined by the one with the greaterabsolute value.
5.1.3. Strategy of Conflict Weakening
In general, the multi-evidence fusion can obtain more comprehensive and reliabledirection-judgments [28]. But once a conflict point of direction-judgment (i.e., s1 6= s2) with a strongcredibility is observed at a PQM, it is necessary to reduce its fusion credibility to weaken its effect onthe TVDS location. To this end, we propose a strategy of conflict weakening as follows:
• Step 1: Sort the set M = {m(Pi)|i = 1, 2, ..., N} by the absolute values |m(Pi)| in descending order,and generate a new subset Ms ⊂ M with the elements ranking in the top 30% of M.
• Step 2: Check all the values of m(Oi) and m(Γi) corresponding to the elements in Ms. If thereexists any conflict points, mark their fusion credibility and proceed to Step 3; otherwise, jump toStep 4.
• Step 3: Reduce the marked fusion credibility by 20% and distribute the total reduced credibilityto those monitors that are not conflict points in {m(Pi)|i = 1, 2, ..., N} with the principle ofequipartition. Then go back to Step 1 and repeat.
• Step 4: Output the final set M of the modified fusion credibility {m′(Pi)|i = 1, 2, ..., N}.
The parameter choices here (i.e., the 30% and 20%) are determined empirically. According to thesteps for the strategy of conflict weakening, if the parameter in Step 1 is set too large or the parameterin Step 3 is set too small, the efficiency of the strategy will be reduced. If the parameter in Step 1 isset too small, the effectiveness of the strategy is hard to be guaranteed, because some conflict pointswith relatively high credibility may not be selected into the subset Ms for credibility weakening. If theparameter in Step 3 is set too large, the variation of the fusion credibility may be greater than expected.Therefore, the two parameter choices are given as a trade-off between efficiency and effectiveness ofthe conflict weakening. In practice, they can also be adjusted appropriately to adapt to different actualapplication scenarios.
5.2. Decision-Making and DG Verification
According to the modified fusion credibility {m′(Pi)|i = 1, 2, ..., N}, the fusion direction-matrixD′
N×1can be constructed with d′i = m′(Pi). Similarly to the existing matrix-based location methods,
the fusion result-matrix can be obtained as:
R′L×1 = CL×N · D′N×1
(28)
The basic process of the decision-making and verification of the TVDS location is shown inFigure 13. In the general case without DG integration, the line Lj corresponding to the row elementr′j = max{r′1, r′2, ..., r′L} is the location result of the TVDS. But due to the DG integration, this primarylocation result will be incorrect if Lj is on Link(G−DG).
According to the first rule of influence and the partial verification factor δj in Equation (15),we proposed the following verification and correction process to obtain the adjusted location result ofthe TVDS in the partial area of Link(G−DG).
• Step 1: Calculate ∆Epj and δj for all lines on Link(G−DG).
• Step 2: If δj = +1 for Lj (the primary location result), go to Step 3; otherwise, let δj′ = δj andjump to Step 4.
• Step 3: Check all δj calculated in Step 1, and mark the one whose value equals to −1 as δj′ .• Step 4: Mark the line Lj′ corresponding to δj′ as the adjusted location result of the TVDS.

Energies 2016, 9, 1092 16 of 23
Figure 13. Basic process of decision-making and verification.
5.3. Reliability Evaluation of Location Result
To evaluate the reliability of the location result of the TVDS, we utilize the concordance indexof multiple evidence sources [29] for the two groups of basic credibilities. Meanwhile, the errors andconflict points in direction-judgment shall reduce the reliability of the location result, especially whenthese points are on Link(G−F), the link from G to TVDS and the branches in its DOWN-area. Based onthe above considerations, the reliability coefficient H is defined as:
H = exp
{N
∑i=1
[− (m1 (gi)−m2 (gi))
2]}·
1−
N∑
i=1ρi · n′i
N
(29)
in which
n′i =
1.5, i f PQMi is a misjudgment point1, i f PQMi is a conflict point0, otherwise
(30)
ρi =
2, i f PQMi is in the DOWN-area of Link(G−F)1.5, i f PQMi is in the UP-area of Link(G−F)1, i f PQMi is not on Link(G−F)
(31)
where n′i is used to identify whether PQMi is a direction misjudgment point or conflict point, and ρidenotes the relative position of PQMi and Link(G−F). The values setting of n′i and ρi are done accordingto their relative impacts to the reliability of the location result. The value range of H is H ∈ (e−4, 1),where a higher value of H indicates a higher reliability.
6. Case Study
6.1. Simulation Model Description
Figure 14 shows the topology of an IEEE 13 node test feeder with a nominal voltage of115 kV/4.16 kV and a nominal power capacity of 5000 kVA [30]. There are 18 lines in the system,numbered from L1 to L18. For the NPQMS, the monitors marked in Figure 14 include both 13 actualPQMs and 5 virtual PQMs (N = 18).

Energies 2016, 9, 1092 17 of 23
Figure 14. IEEE 13 node test feeder with DG integration.
To verify the effectiveness of the proposed approach, we use three settings to generate differentcases of direction misjudgments at some PQMs as follows:
1. GWN with the mean value in range of [−5%,+5%]Pssi are added to some monitoring points,
where Pssi is the steady-state active power at PQMi.
2. A DG with 10% SN is connected to Node 646, where SN is the nominal power capacity ofthe system.
3. Three different kinds of events are used to simulate the voltage-sag disturbance, including theline to ground fault, capacitor switching (550 kVar) and starting of large-size induction motor(37.3 kW).
Four typical transient voltage disturbance events for tests, including their locations, causes andDG integration, are shown in Table 1. The threshold values in Equations (3), (5) and (11) areset as: θ1 = 0.8, θ2 = 0.5, θ3 = 0.8, k = 3 and λ = 2. The simulations are performed inMATLAB/simulink environment.
Table 1. Description of different transient voltage disturbance events.
Event Event Location Event Cause DG Integration Adding Points of GWN
F1 L14 Starting of motor No M7, M11, M13F2 L5 Line to ground Yes M3, M7, M11F3 L17 Capacitor switching Yes M3, M7, M11F4 L1 Line to ground Yes None
6.2. Credibility Analysis
With the PQ simulation data obtained at each PQM in the model, the complete direction-matrixesD1,N×1 and D2,N×1 can be generated by the DP algorithm and the DE algorithm, respectively.According to the analysis in Section 3, the three credibility factors αv,i, βv,i , χv,i will be calculated.Then, according to the basic strategies of credibility analysis and fusion shown in Figure 12,all basic credibilities of the direction-judgments from both DP and DE algorithms and their fusioncredibilities for the four disturbance events are calculated, as shown in Figure 15. Comparing thedirection-judgments in these figures and the layout of all PQMs in Figure 14, the direction misjudgmentpoints and conflict points for all these four disturbance events are shown in Table 2.

Energies 2016, 9, 1092 18 of 23
2 4 6 8 10 12 14 16 18−0.1
−0.05
0
0.05
0.1
0.15
0.2
0.25
PQMi
Cre
dibi
lity
m(O
i)
m(Γi)
m(Pi)
conflict pointconflict point
misjudgment
(a)
2 4 6 8 10 12 14 16 18−0.1
−0.05
0
0.05
0.1
0.15
0.2
0.25
0.3
PQMi
Cre
dibi
lity
m(O
i)
m(Γi)
m(Pi)
m’(Pi)
conflict point(weakening) conflict point
(weakening)
misjudgment
(b)
2 4 6 8 10 12 14 16 18
−0.1
−0.05
0
0.05
0.1
0.15
0.2
0.25
0.3
PQMi
Cre
dibi
lity
m(Oi)
m(Γi)
m(Pi)
m’(Pi)
misjudgment
misjudgment
(δ17
=−1)conflict point (weakening)
(c)
2 4 6 8 10 12 14 16 18−0.1
−0.05
0
0.05
0.1
0.15
0.2
0.25
0.3
PQMi
Cre
dibi
lity
m(O
i)
m(Γi)
m(Pi)
adjusted(δ17
=−1)
misjudgment
misjudgment(δ
17=+1)
(d)
Figure 15. Distribution of basic credibilities and fusion credibilities for each disturbance event.(a) Event F1; (b) Event F2; (c) Event F3; (d) Event F4.

Energies 2016, 9, 1092 19 of 23
Table 2. Direction misjudgments and conflict points.
Event Direction Misjudgment Conflict Point Conflict Weakening DG Verification
F1 M7, M11, M13 M7, M11 No NoF2 M3, M7, M11 M3, M7 Yes NoF3 M3, M7, M11 M3 Yes YesF4 M4, M17 None No Yes
The conflict weakening was not activated because there is no conflict point in event F4 and thetwo conflict points in event F1 (M7, M11) are not in the top 30% of the sorted set {M(Pi)|i = 1, 2, ..., N};it was, however, activated in events F2 and F3 to reduce the fusion credibility of the conflict points.Taking the event F2 for example, there were three direction misjudgment points in the whole NPQMS,and the two conflict points at M3 and M7 both activated the conflict weakening process as their fusioncredibilities are in the top 30% of the sorted set. It is also notable that only a few non-conflict pointswith relatively larger basic credibilities by both criteria have noticeably increased fusion credibility;the fusion credibility on other measuring points were all lower than their basic credibilities. This meansthat, with the credibility fusion and conflict weakening, the location result of TVDS depends more onmonitoring points with the same sign and relatively larger basic credibility according to the two criteria.
The configurations in Tables 1 and 2 have considered major factors for the TDVS location withfault tolerance, including different locations and causes of TVDS, settings of GWN and DG integration,and scenarios of direction misjudgment, conflict points and conflict weakening. Four events undertesting are comprehensive combinations of these factors verify the effectiveness of the proposedmethods in different scenarios.
6.3. Decision-Making and Performance Comparison
After the complete coverage-matrix CL×N and the fusion direction-matrix D′N×1
are obtained,the location results of TVDS for each disturbance event will be determined. To demonstrate thefault-tolerant capacity of the IF-based location approach, we compared it with the traditionalmatrix-based (TM) methods [8,9] and the disturbance measuring (DM) algorithm [20]. The criteriaand main features of them are shown in Table 3. All these three methods belong to the first locationstrategy that are based on the graph theory and matrix algorithm, and the proposed IF-based locationapproach can be viewed as an improved method of the other two methods.
Table 3. Criteria and features of different methods.
Method Criterion for TVDS Location Credibility Factors DG Integration
TM If rj = max{r1, ..., rL} = N, Lj is TVDS Not considered Not consideredDM If rj = max{r1, ..., rL}, Lj is TVDS Partly consideration Not consideredIF If r′j = max{r′1, ..., r′L}
∧δj′ = −1, Lj′ is TVDS Comprehensive consideration Considered (two rules)
The location results are shown in Table 4. The location results showed that, for each case withdirection misjudgment points, all the two existing matrix-based methods failed to locate the TVDScorrectly. According to the criteria of TVDS location in the TM method, the TVDS cannot be determinedif the maximum element in the result-matrix (i.e., rj = max{r1, ..., rL}) is unequal to N. In contrast,the proposed IF-based approach predicted correctly in all cases, for its comprehensive considerationfor the multi-information, such as multiple credibility factors, DG integration, multi-evidence, and etc.

Energies 2016, 9, 1092 20 of 23
Table 4. Location Result of Different Methods.
Event Method Max in R or R′
TVDS δj H Result
F1
TM r14 = 16 – – – FDM r13 = 6.31 L13 – – ×IF r′14 = 0.85 L14 – 0.73
√
F2
TM r5 = 16 – – – FDM r11 = 5.44 L11 – – ×IF r′5 = 0.83 L5 – 0.77
√
F3
TM r18 = 14 – – – FDM r11 = 4.19 L11 – – ×IF r′17 = 0.89 L17 −1 0.76
√
F4
TM r17 = 18 L17 – – ×DM r17 = 8.63 L17 – – ×
IF r′17 = 1.0 Primary: L17 +1 0.71√
Adjusted: L1 −1
F = Failed, × = Incorrect,√
= Correct.
Note that the DG verification process was activated for the events F3 and F4, because both theirprimary location results were on Link(G−DG). However, as shown in Figure 15c,d, the DG correctionprocess was only activated for the event F4, because only one partial verification factor δ17 among theprimary location results was equal to +1. It indicated that the primary location result L17 in the eventF4 was incorrect because of the DG integration, and we could obtain the adjusted location result L1
according to δ1 = −1 on Link(G−DG). The values of H also showed the reliability for each locationresult of the TVDS. The relatively low reliability in event F4 was due to all its misjudgment points , i.e.,M4 and M17, only taking place in the DOWN-area of Link(G−F).
6.4. Analysis of Fault Tolerance
With different positions and causes of TVDS as well as settings of GWN and DG integration,we have set up three hundred tests in five groups according to the number of direction misjudgments.For each of these five groups, we compare the fault tolerance of the proposed IF approach with the TMalgorithm and the DM algorithm. The results are shown in Table 5.
Table 5. Comparison of fault tolerance of three location approaches.
Misjudgments Test TimesTM DM Proposed IF
Correct % Correct % Correct %
0 60 60 100 60 100 60 1001 60 N/A – 53 88.3 58 96.72 60 N/A – 43 71.7 55 91.73 60 N/A – 38 63.3 54 90.04 60 N/A – 31 51.6 52 86.7
Total 300 60 20.0 225 75.0 279 93.0
N/A: Not applicable.
According to the above data, the performances of both the TM and the DM algorithms are far fromsatisfactory in the presence of direction misjudgments in the NPQMS. The TM algorithm only workswith the absolute reliability of all direction-judgments. The DM algorithm locates the TVDS correctly in165 of 240 tests with direction misjudgments (75% accuracy on average). For the proposed IF approach,there are only 22 mistakes (93% accuracy on average). The proposed IF approach provides a remarkableimprovement with fault-tolerant capability by taking into full account of different influence factors,multiple criteria of direction-judgment, and verification of DG integration.
Several factors may be related to the mis-location of TVDS in the proposed IF method, including:
• The number of direction misjudgments: more direction misjudgments lead to higher probabilityof location failure.

Energies 2016, 9, 1092 21 of 23
• The position of the direction misjudgments: if direction misjudgments occur in the DOWN-areaof the TVDS, it has higher probability of location failure.
• The credibility of the direction misjudgments: if credibility of the point with directionmisjudgment is relatively high, it has higher probability of location failure.
• The relevancy of the direction misjudgments: strong relevance of the direction misjudgments, i.e.,all misjudgments are located along the same link, leads to higher probability of location failure.
As shown in Table 6, two typical tests are provided to show the failure cases of TVDS locationwith the proposed IF approach. For event F5, both the two direction misjudgments M11 and M13 are inthe down-area of the TVDS (i.e., L7). In event F6, the number of direction misjudgments is relativelylarge (four misjudgments at M3, M4, M17 ,and M18), and there is strong relevance among M4, M17 andM18 as they are located on the same link.
Table 6. Two typical tests of failure for TVDS location.
Event Event Location DG Integration Direction Misjudgment Conflict Point DG Verification TVDS Result H
F5 L7 Yes M11, M13 - - L13 × 0.614F6 L9 Yes M3, M4, M17, M18 - - L18 × 0.611
× = Incorrect.
Moreover, the probabilistic character of the location failure can be reflected in the reliabilityevaluation of location result, as shown in the latter part of Equation (26). The choices of parameter inEquations (27) and (28) partially underscore these probabilistic tendencies. By comparing the reliabilitycoefficients H in Tables 4 and 6, the values of H in the events F5 and F6 are significantly smaller,which means the location results for F5 and F6 have lower reliability.
7. Conclusions
In this paper, we proposed an information fusion based approach to TVDS location withfault-tolerant capacity in the DG integrated smart distribution grid. Based on the assumption ofthe complete observability of the power quality information in the NPQMS, the multi-credibilityfusion algorithm integrates three influence factors and two criteria to quantify the reliability ofthe direction-judgment of TVDS at each PQM. Combined with the strategy of conflict weakening,the proposed IF-based approach improves the fault-tolerant capacity for TVDS location for distributiongrids with a tree topology with and without DG integration. In the presence of DG integration,two influence rules and a correction algorithm have addressed the direction misjudgments caused bythe DG integration at some PQMs, which significantly improved the fault-tolerance of TVDS location.Simulation results on the IEEE 13 node test feeder validated the effectiveness of the proposed approach.Compared with the existing matrix-based methods, the proposed approach holds the advantages ofhigh accuracy and fault-tolerance capability under various influence factors.
The future research work aims to improve the generic applications of the IF-based location strategyof arbitrary topology and DG integration. In particular, theoretical foundation, simulation experimentsand field tests will comprise the major tasks to developed the influence rules and correction strategy ofDG integration for a circular topology and multiple DGs integration.
Acknowledgments: The research was supported by the Natural Science Foundation of China (GrantNos. 51507153, 51207139), Zhejiang Provincial Natural Science Foundation of China (Grant No. LY17E070005),and the China Scholarship Council (Grant No. 201408330220).
Author Contributions: Guoqing Weng conceived and designed the algorithms and experiments; Feiteng Huangand Xiaodong Yang developed the simulation environment and performed the experiments; Jun Yan implementedthe comparative studies and also implemented part of the simulation platform; Youbing Zhang and Haibo Heanalyzed the simulation results and comparative studies, and also led the overall research development for thiswork. All authors have contributed to the writing, editing, and proofreading of this paper.
Conflicts of Interest: The authors declare no conflict of interest.
Energies 2016, 9, 1092 22 of 23
Abbreviations
The following abbreviations are used in this manuscript:
PQ Power qualityPQM Power quality monitorNPQMS Networked power quality monitoring systemTVDS Transient voltage disturbance sourceDP Disturbance powerDE Disturbance energyDG Distributed generatorIF Information fusionBPAF Basic probability assignment functionGWN Gaussian white noiseTM Traditional matrix-based methodDM Disturbance measuring method
References
1. Milanovic, J.V.; Meyer, J.; Ball, R.F.; Howe, W.; Preece, R.; Bollen, M.H.J.; Elphick, S.; Cukalevski, N.International Industry Practice on Power-Quality Monitoring. IEEE Trans. Power Deliv. 2014, 29, 934–941.
2. Liu, Z.; Cui, Y.; Li, W. A Classification Method for Complex Power Quality Disturbances Using EEMD andRank Wavelet SVM. IEEE Trans. Smart Grid 2015, 6, 1678–1685.
3. Huang, N.; Zhang, S.; Cai, G.; Xu, D. Power Quality Disturbances Recognition Based on a MultiresolutionGeneralized S-Transform and a PSO-Improved Decision Tree. Energies 2015, 8, 549–572.
4. Wang, M.H.; Yau, H.T. New Power Quality Analysis Method Based on Chaos Synchronization and ExtensionNeural Network. Energies 2014, 7, 6340–6357.
5. Chung, I.Y.; Won, D.J.; Kim, J.M.; Ahn, S.J.; Moon, S.I. Development of a network-based power qualitydiagnosis system. Electr. Power Syst. Res. 2007, 77, 1086–1094.
6. Tan, R.H.G.; Ramachandaramurthy, V.K. Voltage Sag Acceptability Assessment Using MultipleMagnitude-Duration Function. IEEE Trans. Power Deliv. 2012, 27, 1984–1990.
7. Demirci, T.; Kalaycioglu, A.; Kucuk, D.; Salor, O.; Guderl, M.; Pakhuylu, S.; Atalik, T.; Inan, T.; Cadirci, I.;Akkaya, Y.; et al. Nationwide real-time monitoring system for electrical quantities and power quality of theelectricity transmission system. IET Gener. Transm. Distrib. 2011, 5, 540–550.
8. Won, D.J.; Chung, I.Y.; Kim, J.M.; Moon, S.I.; Seo, J.C.; Choe, J.W. A new algorithm to locate power-qualityevent source with improved realization of distributed monitoring scheme. IEEE Trans. Power Deliv. 2006, 21,1641–1647.
9. Weng, G.; Zhang, Y.; He, H. A Novel Location Algorithm for Power Quality Disturbance Source Using ChainTable and Matrix Operation. Int. Rev. Electr. Eng. 2011, 6, 2746–2753.
10. Bentley, E.C.; Putrus, G.A.; McDonald, S.; Minns, P. Power quality disturbance source identification usingself-organising maps. IET Gener. Transm. Distrib. 2010, 4, 1188–1196.
11. Abu-Elanien, A.E.B.; Salama, M.M.A. A Wavelet-ANN Technique for Locating Switched Capacitors inDistribution Systems. IEEE Trans. Power Deliv. 2009, 24, 400–409.
12. Hong, Y.Y.; Chen, B.Y. Locating Switched Capacitor Using Wavelet Transform and Hybrid PrincipalComponent Analysis Network. IEEE Trans. Power Deliv. 2007, 22, 1145–1152.
13. Parsons, A.C.; Grady, W.M.; Powers, E.J.; Soward, J.C. A direction finder for power quality disturbancesbased upon disturbance power and energy. IEEE Trans. Power Deliv. 2000, 15, 1081–1086.
14. Zhang, W.; Wang, C. Transient disturbances location based on improved disturbance power and energy.Autom. Electr. Power Syst. 2007, 31, 32–35.
15. Kong, W.; Dong, X.; Chen, Z. Voltage sag source location based on instantaneous energy detection.Electr. Power Syst. Res. 2008, 78, 1889–1898.
16. Polajzer, B.; Stumberger, G.; Seme, S.; Dolinar, D. Detection of voltage sag sources based on instantaneousvoltage and current vectors and orthogonal Clarke’s transformation. IET Gener. Transm. Distrib. 2008, 2,219–226.
17. Chen, P.C.; Malbasa, V.; Dong, Y.; Kezunovic, M. Sensitivity Analysis of Voltage Sag Based Fault LocationWith Distributed Generation. IEEE Trans. Smart Grid 2015, 6, 2098–2106.

Energies 2016, 9, 1092 23 of 23
18. Alwash, S.F.; Ramachandaramurthy, V.K.; Mithulananthan, N. Fault-Location Scheme for Power DistributionSystem with Distributed Generation. IEEE Trans. Power Deliv. 2015, 30, 1187–1195.
19. Won, D.J.; Moon, S.I. Optimal Number and Locations of Power Quality Monitors Considering SystemTopology. IEEE Trans. Power Deliv. 2008, 23, 288–295.
20. Guo, Q.; Jia, Q.; Bo, Z. Locating power-quality event source through disturbance measures. In Proceedingsof the 45th Universities Power Engineering Conference (UPEC), Cardiff, UK, 31 August–3 September 2010;pp. 1–5.
21. Huang, F.; Weng, G.; Wang, Q. Location of Power Quality Disturbance Source in Distribution Network withDistributed Generators. Autom. Electr. Power Syst. 2015, 39, 150–155.
22. Sun, K.; Chen, Q.; Gao, Z. An Automatic Faulted Line Section Location Method for Electric PowerDistribution Systems Based on Multi-source Information. IEEE Trans. Power Deliv. 2015, 99, 1–10.
23. Farzanehrafat, A.; Watson, N.R. Power Quality State Estimator for Smart Distribution Grids. IEEE Trans.Power Syst. 2013, 28, 2183–2191.
24. Jin, T.; Chu, F.; Ling, C.; Nzongo, D.L.M. A Robust WLS Power System State Estimation Method Integratinga Wide-Area Measurement System and SCADA Technology. Energies 2015, 8, 2769–2787.
25. He, G.; Dong, S.; Qi, J.; Wang, Y. Robust State Estimator Based on Maximum Normal Measurement Rate.IEEE Trans. Power Syst. 2011, 26, 2058–2065.
26. Ray, P.K.; Kishor, N.; Mohanty, S.R. Islanding and Power Quality Disturbance Detection in Grid-ConnectedHybrid Power System Using Wavelet and S-Transform. IEEE Trans. Smart Grid 2012, 3, 1082–1094.
27. Xia, M.; Li, X. Design and Implementation of a High Quality Power Supply Scheme for DistributedGeneration in a Micro-Grid. Energies 2012, 6, 4924–4944.
28. Li, Z.; Yin, X.; Zhang, Z.; He, Z. Wide-Area Protection Fault Identification Algorithm Based onMulti-Information Fusion. IEEE Trans. Power Deliv. 2013, 28, 1348–1355.
29. Murphy, C.K. Combining belief functions when evidence conflicts. Decis. Support Syst. 2000, 29, 1–9.30. IEEE PES Distribution System Analysis Subcommittee’s Distribution Test Feeder Working Group.
Distribution Test Feeders. Available online: http://ewh.ieee.org/soc/pes/dsacom/testfeeders/2010(accessed on 17 September 2010).
c© 2016 by the authors; licensee MDPI, Basel, Switzerland. This article is an open accessarticle distributed under the terms and conditions of the Creative Commons Attribution(CC-BY) license (http://creativecommons.org/licenses/by/4.0/).