A fault diagnosis methodology for rolling element bearings based … · 2020-03-09 · For rolling...
48
1 A fault diagnosis methodology for rolling element bearings based on advanced signal pretreatment and autoregressive modelling Hussein Al-Bugharbee 1 * , 2 and Irina Trendafilova 1 1 Department of Mechanical and Aerospace Engineering University of Strathclyde, Glasgow, United Kingdom * [email protected] 2 on leave from Department of Mechanical Engineering University of Wasit, Iraq. Abstract This study proposes a methodology for rolling element bearings fault diagnosis which gives a complete and highly accurate identification of the faults present. It has two main stages: signals pretreatment, which is based on several signal analysis procedures, and diagnosis, which uses a pattern-recognition process. The first stage is principally based on linear time invariant autoregressive modelling. One of the main contributions of this investigation is the development of a pretreatment signal analysis procedure which subjects the signal to noise cleaning by singular spectrum analysis and then stationarisation by differencing. So the signal is transformed to bring it close to a stationary one, rather than complicating the model to bring it closer to the signal. This type of pretreatment allows the use of a linear time invariant autoregressive model and
Transcript of A fault diagnosis methodology for rolling element bearings based … · 2020-03-09 · For rolling...

1
A fault diagnosis methodology for rolling element
bearings based on advanced signal pretreatment
and autoregressive modelling
Hussein Al-Bugharbee1*
, 2 and Irina Trendafilova
1
1Department of Mechanical and Aerospace Engineering
University of Strathclyde, Glasgow, United Kingdom
2on leave from Department of Mechanical Engineering
University of Wasit, Iraq.
Abstract
This study proposes a methodology for rolling element bearings fault diagnosis which
gives a complete and highly accurate identification of the faults present. It has two main
stages: signals pretreatment, which is based on several signal analysis procedures, and
diagnosis, which uses a pattern-recognition process. The first stage is principally based
on linear time invariant autoregressive modelling. One of the main contributions of this
investigation is the development of a pretreatment signal analysis procedure which
subjects the signal to noise cleaning by singular spectrum analysis and then
stationarisation by differencing. So the signal is transformed to bring it close to a
stationary one, rather than complicating the model to bring it closer to the signal. This
type of pretreatment allows the use of a linear time invariant autoregressive model and

2
improves its performance when the original signals are non-stationary. This contribution
is at the heart of the proposed method, and the high accuracy of the diagnosis is a result
of this procedure. The methodology emphasises the importance of preliminary noise
cleaning and stationarisation. And it demonstrates that the information needed for fault
identification is contained in the stationary part of the measured signal.
The methodology is further validated using three different experimental setups,
demonstrating very high accuracy for all of the applications. It is able to correctly
classify nearly 100% of the faults with regard to their type and size. This high accuracy
is the other important contribution of this methodology. Thus, this research suggests a
highly accurate methodology for rolling element bearing fault diagnosis which is based
on relatively simple procedures. This is also an advantage, as the simplicity of the
individual processes ensures easy application and the possibility for automation of the
entire process.
Keywords
Rolling element bearings, fault diagnosis, linear autoregressive modelling,
stationarisation, singular spectrum analysis, pattern recognition
1. Introduction
Rolling element bearings are considered the most common reason for failures in rotating
machinery. The literature shows that, for example, roller bearings are considered a
major reason for over 40% of failures in induction machines [1]. When a fault occurs in
a bearing, the overall vibration level is affected. If the fault is not detected and the

3
correct decision is not taken in time, the consequences of fault development can be
catastrophic. Thus, the inspection and detection of faults at an early stage is crucial to
prevent such consequences. However, detection of this change is sometimes difficult at
an early stage. A number of strategies have been developed for the purpose of fault
diagnosis in rolling element bearings, and it is a subject of continuing interest.
For rolling element bearings, vibration-based fault diagnosis is the most popular
strategy. This strategy is based on the analysis of vibration signals acquired from
bearing housings. Many techniques have been developed for analysing bearing vibration
signals and for the purpose of fault diagnosis [2-4]. Some studies compare the
performance of different techniques [5-9].
Generally, these techniques can be divided into non-parametric and parametric. When
using a non-parametric technique, signals can be analysed in the time domain, using
parameters such as kurtosis and crest factors [10-12], in the frequency domain, e.g.
through application of the fast Fourier transform (FFT) [13], and/or in the time-
frequency domain, using techniques such as the wavelet transform [14-20].
Bearing signals are almost always non stationary because bearings are inherently
dynamic. The non-stationarities in the benign bearing are generally due to abrupt
changes in the bearing signal that might come from a clearance between the bearing
outer race and the housing, sliding of a rolling element [21]. The non-stationarities can
also come from the impacts of the damaged and the non damaged part of a bearing,
flaking of one of the bearing raceways [22]. For this reason, conventional non-
parametric techniques have some limitations. For instance, the FFT is an efficient
numerical algorithm that transforms signals from the time domain to a frequency
spectrum; however, it is not appropriate for non-stationary signals [23], and it requires
long time intervals to form a good resolution spectrum [24]. To overcome the

4
limitations of using FFT with non-stationary signals, a lot of studies for bearing fault
detection are proposed. Some of these studies include analysing the signal
instantaneously in its time and frequency domain such as using short term Fourier
transform [25] and the wavelet transform [26-29] which are able to present the overall
view of non-stationary signals in time-frequency domains. Nevertheless, on some
occasions they are still unable to obtain a good frequency resolution [30]. Others do
some transformations which are usually aimed at decomposing the signal into a number
of simpler components such as the empirical mode decomposition [31-33] . But it
should be noted that these transformations are much more complicated than the
proposed differencing technique.
Parametric techniques can be introduced to overcome the problems of the frequency
resolution limitation associated with non-parametric techniques. They are based on
considering the bearing vibration signal as time series which can be predicted using a
suitable model with few parameters [23].
The use of autoregressive modelling for the purpose of fault diagnosis in rolling element
bearings has been the subject of several research papers. As bearing vibration signals
are originally non-stationary, some researchers suggest the use of time-varying
autoregressive (TVAR) models which take into account the presence of
nonstationarities in the signal. In [30] a parametric time- frequency spectrum is made
using a time varying autoregressive model. Then singular value decomposition (SVD)
is used to form features which are used as input to a radial basis function (RBF) neural
network. In [34, 35], three different algorithms, namely, Kalman, extended Kalman and
modified extended Kalman filter, of model coefficients estimation are investigated. In
these TVAR models, the model coefficients are assumed to evolve over time in order to
facilitate the modelling of the non-stationary signals. Nevertheless, there are several
obstacles implicit in such models. Since the coefficients of such models are evolving

5
over time, it is necessary to adopt a coefficient set with proper evolution; a good initial
set of coefficients is also required. Thus, the entire process may be jeopardised by an
improper assumption for coefficient evolution or an inappropriate initial set of
coefficients.
Other studies use nonlinear autoregressive models in which the data points of the signal
are related in a nonlinear form [36, 37]. However, these models are complex in terms
of selection of the nonlinear relationship form, and they require relatively long
computational time.
There are other forms of AR models used in the fault diagnosis of rolling element
bearings, such as periodic time –varying AR model [38]. Such a model assumes that
bearing vibration signal has cyclostationary behaviour.
In terms of complexity, linear autoregressive models of time invariant coefficients are
the simplest way of representing signals. However, these models are suitable for
stationary signals, while bearing vibration signals are originally non-stationary [39]. To
overcome this limitation, some pretreatment of signals has been proposed to enhance
the modelling goodness of fit (i.e. the ability of the model to correctly predict a signal).
In this study, a new pretreatment is proposed, based on the combination of singular
spectrum analysis (SSA) and a particular type of stationarisation, the differencing
technique.
The pretreatment goals are:
1. noise suppression using singular spectrum analysis (SSA), as the presence of
noise deteriorates the quality of model prediction

6
2. Achievement of stationarity by subjecting the non-stationary sub-signals to
differencing which is essentially a kind of high frequency filtering process.
Singular spectrum analysis is one of the non-parametric techniques for time series
analysis. It decomposes a time series (i.e in this research a bearing vibration sub-signal)
into a number of independent components. These components are generally interpreted
as trend, periodic components and structure-less noise components. This technique is
used widely for the analysis of climatic and meteorological time series[40, 41].
Recently, it has been used for health monitoring of tool wear[42], rotor rub problems
[43] and fault diagnosis in rolling element bearings [44-46]. In [44] a number of
statistical features are developed from the trend components and used as input to an
artificial neural network classifier. Singular spectrum analysis is also applied as a
multilevel analysis in [45]. A two level cascade singular spectrum analysis is applied
and the number of the significant components for signal reconstruction is used as an
indicator for the bearing condition monitoring. In [46] singular values and the energy of
the first several principal components are used to form two feature vectors. Both of
these feature vectors are used as input to the back propagation neural network (BPNN)
classifier.
In the present work, SSA is used for the purpose of cleaning the structure-less noise
before subjecting the signal to AR modelling. It helps in improving the goodness of fit
of the linear time invariant autoregressive (LTIVAR) model.
As it was mentioned above there are several techniques that can be used for analysing /
transforming a non stationary signal. In this study the simplest and most straightforward
approach for making a signal stationary, the differencing technique is used. The
differencing technique somehow has not been used before for stationarising bearing and
in general machinery signals, although it is very popular in signal analysis and
biomedical research [47-51].
7
To the knowledge of the authors, no previous applications of the LTIVAR modelling for
ball bearing fault diagnosis have applied a similar type of procedure to ensure that the
signal can be modelled by an LTIVAR model. There are other studies that use linear
autoregressive modelling, some of them also applying pretreatment of the signal, but
this is done by different methods, e.g. empirical mode decomposition (EMD) [52] and
amplitude demodulation (AD) [37]; which are generally more complicated than the
procedure suggested here. Moreover signal stationarisation has not been taken as the
basis of the pretreatment.
It is the opinion of the authors that the above mentioned two steps of signal
pretreatment , namely SSA noise cleaning and stationarisation via differencing,
represent an important improvement to the modelling precision and to the information
contained by the signal, allowing much greater accuracy in the results of the detection
and the classification of bearing condition.
The methodology presented in this work has been developed to achieve accurate and
complete fault identification. The term ‘complete’ refers to the ability of the
methodology to detect and identify the condition of the bearing (e.g healthy, IRF…etc)
and eventually estimate its severity. To the best of the author’s knowledge, the majority
of previous studies using linear autoregressive modelling have not applied it to fault
severity estimation.
The methodology suggested here can be divided into two main stages:
1. signal pretreatment, which is based on several signal analysis procedures,
including signal de-noising using SSA, signal stationarisation and the AR
modelling
2. signal diagnosis, which is essentially based on a pattern-recognition process.
8
In the first stage, signals are segmented into a number of equal-length segments, and
each segment is then subjected to SSA to decompose into a number of components. The
components of the higher singular values (i.e. higher contribution to the total signal
variance) are used to reconstruct the new segment (i.e. sub-signal). When the new
segments are reconstructed, they are subjected to a stationarity test. The non-stationary
segments, i.e. those which fail to meet the test criterion, are stationarised using the
differencing technique. The final step in the first stage of this methodology is to subject
the segments to modelling, using the LTIVAR model and obtaining the model
coefficients.
In the second stage (i.e. the signal diagnosis), the LTIVAR model coefficients are
arranged into feature vectors, and a pattern-recognition approach is used to detect, and
localise the fault and to estimate its size. The nearest neighbour (NN) classification rule,
based on the Mahalanobis distance, is suggested for this purpose. In this classification
approach, the distance of each new feature vector from a testing sample to the
corresponding signal categories from training sample is checked to assign the feature
vector to the category to which its nearest neighbour belongs. If for any reason, the
lengths of the new testing feature vector and that made from the training sample are
different, they should be equalized to measure the Mahlanobis distance properly. Three
different possibilities are investigated in this study to see whether vectors length
equalization may affect the performance of the methodology or not. Eventually, the
technique which ensures best classification results is adopted.
The paper is organised into the following sections: Section 2 presents the pretreatment
of the data, including signal segmentation, noise suppression using singular spectrum
analysis SSA, stationarisation and linear AR modelling. Section 3 describes the
diagnosis method, based on the pattern-recognition process. In Section 4, three case
9
studies for the validation of the method are introduced. In Section 5, the results and
discussion are presented. Section 6 provides a comparison of the performance of the
method suggested here with some recent previous works. Finally, concluding remarks
and proposals for further development of the suggested methodology are given in
Section 7.
2. Signal pretreatment
2.1 Signal segmentation
Signals are segmented to provide more samples and to overcome the difficulty of
obtaining repetitive measurements from the machine. For each bearing condition, each
signal is segmented into a number of non-overlapping sub-signals of equal-length. With
regard to autoregressive modelling, it is generally recommended that the segment length
should follow the ratio 𝑝 𝑛⁄ < 0.1, where p is the model order and n is the segment
length [53]. This ratio is recommended because it is known that a greater ratio can affect
the model’s goodness of fit.
2.2 Singular Spectrum Analysis (SSA)
SSA is a statistical procedure which has been used extensively for climate and
meteorology analysis, but has not yet gained popularity for machinery analysis. It is
simply principal components analysis applied to the lagged components of a time series.
SSA is used to decompose the original signal into a number of independent
components; the principal components (PCs). The initial time series can be then
reconstructed by using a number of PCs. The primary aim of SSA is to uncover the

10
trend in a signal, particularly its oscillatory patterns. SSA can, however, also be used as
a noise-cleaning procedure; it is known to clean structure-less noise by transforming it
into low singular value components [54]. This is the purpose for which SSA is used in
this study. Only the independent principal components that explain a large proportion of
the variance of the sub-signal were selected for the reconstruction step. This resulted in
a considerable improvement in the LTIVAR model’s goodness of fit. In this study, SSA
was used for decomposing the segmented signals, after which they were reconstructed
using a number of the principal components. Thus, the procedure has two stages:
decomposition and reconstruction [55].
In the decomposition stage, a sub-signal x of length n , x(1),x(2),…,x(n),is mapped onto
a window of length (L) to form the so-called trajectory matrix Y (LxK) where K=n-L+1
(see Eq. (2)).
The trajectory matrix (Y) is then subjected to singular value decomposition to obtain (L)
eigenvectors (𝐔𝐢, 𝑖 = 1,2. . , 𝐿) corresponding to (L) eigenvalues (𝜆𝑖, 𝑖 = 1,2. . , 𝐿). Each
𝜆𝑖 represents the partial variance of the original time series in the direction of the 𝐔𝐢.
Projecting the trajectory matrix onto each eigenvector provides the corresponding
principal components (PCi.):
𝐘 =
[
𝑥(1) 𝑥(2)𝑥(2) 𝑥(3)
𝑥(3) … 𝑥(𝐾)
𝑥(4) … 𝑥(𝐾 + 1)
𝑥(3) 𝑥(4)⋮
𝑥(𝐿)⋮
𝑥(𝐿 + 1)
𝑥(5) … 𝑥(𝐾 + 2)⋮
𝑥(𝐿 + 2)⋱…
⋮𝑥(𝑛) ]
(2)
𝑃𝐶𝑖(𝑚) =∑𝑌𝑇(𝑚 + 𝑗 − 1)
𝐿
𝑗=1
∗ 𝑈𝑖(𝑚) (3)

11
where
i=1, 2….L;
m=1, 2…n;
j=1, 2…L.
Then, L elementary matrices
(𝐄𝐥𝑖 = 𝐔i𝐏𝐂i′ 𝑤ℎ𝑒𝑟𝑒 𝑖 = 1,2, … 𝐿 𝑎𝑛𝑑 𝑡ℎ𝑒 𝑝𝑟𝑖𝑚𝑒 𝑚𝑒𝑎𝑛𝑠 𝑡𝑟𝑎𝑛𝑠𝑝𝑜𝑠𝑒) can be created
by the projection of the PCs on the Eigenvectors U.
The contribution of these elementary matrices norms to the original trajectory matrix
norm follows the trend of the singular values, which is the first matrices have the
highest contribution while the last ones have the lowest.
As was mentioned above, the signals can be reconstructed by a linear combination of all
or a number of the PCs. Different criteria can be used to select the number of PCs [45].
In this study, a number (w) of PCs was selected so that 90% of the original sub-signal
variance is contained in the new reconstructed signal (𝐱𝐫) . The reconstruction process
is done by the diagonal averaging technique which is described below[56]:
𝑥𝑟(𝑚) =1
𝑁𝑚∑ ∑ 𝑃𝐶𝑖
𝑈𝑚
𝑗=𝐿𝑚𝑖∈𝑤(𝑚 − 𝑗 + 1) ∗ 𝑈𝑖(𝑚) ,𝑚 = 1,2, , , , 𝑛 − 1 (4)
The Normalisation factor (𝑁𝑚) and the lower (Lm) and upper (Um) bounds of sums
differ for the edges and the centre of the signal. They are defined as follows:
(1
𝑁𝑚, 𝐿𝑚, 𝑈𝑚) =
{
(
1
𝑚, 1,𝑚) , 𝑓𝑜𝑟 1 ≤ 𝑚 ≤ 𝐿 − 1
(1
𝐿, 1, 𝐾) , 𝑓𝑜𝑟 𝐿 ≤ 𝑚 ≤ 𝐾
(1
𝑛 −𝑚 + 1,𝑚 − 𝑛 + 𝐿, 𝐿) , 𝑓𝑜𝑟 𝐾 + 1 ≤ 𝑚 ≤ 𝑛
(5)
12
The new reconstructed signals 𝐱𝐫 will be used for the further analysis.
2.3 Stationarisation
Basically, the property of a stationarity of a signal is defined as the consistency of the
first four statistical moments over the time. Conversely, non stationarity occurs when
these statistical moments are changing with time. However, since the above definition
is too strict and difficult to achieve, a second order or weak stationarity is usually meant
by the term ‘’stationary’’. And it refers to the case when the first two statistical
moments are constant over the time [57].
The suggested procedure uses linear autoregressive modelling as a method for
extracting the information needed for the diagnosis process. Linear autoregressive
modelling is a process which has been developed primarily for stationary time series. As
it was mentioned above differencing is applied to bring the non stationary sub-signal to
stationarity. However, applying further differencing can introduce high frequency noise,
it is suggested to check the signal for stationarity and then apply the differencing to the
nonstationary sub-signals just once. A number of tests have been developed for testing
the stationarity of a signal. In this study, each reconstructed sub-signal was first tested
for stationarity using the Kwiatkowski–Phillips–Schmidt–Shin (KPSS) test [58]. This
test is used for testing the null hypothesis that the sub-signal is stationary around a
deterministic trend. If the sub-signal is recognised as non-stationary then it is subjected
to stationarisation. After applying the test, the differencing technique is applied for the
purpose of stationarisation only to those signals which were recognized as non-
stationary. The differencing technique be described using the following equation [57]:
𝑥𝑟𝑑𝑖𝑓(𝑚) = 𝑥𝑟(𝑚) − 𝑥𝑟(𝑚 − 1),where 𝑚 = 2,3, …𝑛 (6)

13
𝑥𝑟𝑑𝑖𝑓 is the new stationarised sub-signal. The primary aim of differencing is to
remove the stochastic trends responsible for the sub-signal non-stationarity (i.e. to
stabilise the mean of a non-stationary sub- signal [59]). This is the simplest method that
can be used for the purposes of stationarisation. It is clear that the new transformed sub-
signal (i.e.𝑥𝑟𝑑𝑖𝑓) is shorter than the original one.
The order of differencing depends on the complexity of the signals. More specifically,
if a signal lacks a tendency to return to its mean value then higher order of differencing
might be required. In general the differencing method is a rather simple but powerful
process so on most occasions quite high stationarity is achieved through just one
application. In most studies which apply differencing for other purposes not related to
fault diagnosis and machinery dynamics the process is applied just once [60-62].
In this work, one application of differencing was sufficient to bring the sub-signals to
stationary ones.
The differencing technique has been used for purposes of stationarisation in climate
research [63]; to the knowledge of the authors, however, it has not been used in the field
of machinery fault diagnosis.
2.4 Linear AR Modelling
Once the sub-signals (i.e. bearing vibration signals) are stationarised they can be
represented by the linear autoregressive (AR) model.
The structure of a linear AR model can be described as follows [64]:
𝑥𝑟(𝑚) = 𝑎𝑜 + 𝑎1. 𝑥𝑟(𝑚 − 1) + 𝑎3. 𝑥𝑟(𝑚 − 2) +⋯+ 𝑎𝑝. 𝑥𝑟(𝑚 − 𝑝) + 𝜀(𝑚) (7)

14
where
xr(m) is the predicted signal value at time m which is linearly related to (p) previous
values;
p is the order of the model;
ai (i =0,1,2…,p) are weighting coefficients (i.e. model coefficients);
𝜀(𝑚) is the error term, which represents the difference between the actual and linearly
predicted values.
The model coefficients can be estimated using different algorithms. In this research, the
least square algorithm was used. The performance of the model (i.e. goodness of fit) in
representing the experimental signal data is measured by calculating normalised loss
function based on the normalised mean square error (NMSE), as given by the equation
below:
𝐺𝑜𝑜𝑑𝑛𝑒𝑠𝑠 𝑜𝑓 𝐹𝑖𝑡|𝑁𝑀𝑆𝐸 =
(
1 −√∑ (𝑥𝑟𝑝𝑟(𝑖) − 𝑥𝑟𝑚𝑠(𝑖))
2𝑖=𝑛𝑖=1
∑ 𝑥𝑟𝑝𝑟(𝑖) −𝑖=𝑛𝑖=1 𝑥𝑟̅̅ �̅�𝑠
)
∗ 100% (8)
where:
𝑥𝑟𝑝𝑟 is predicted sub-signal;
𝑥𝑟𝑚𝑠 is the real time measured sub-signal;
𝑥𝑟̅̅ �̅�𝑠 is the mean value of real time sub-signal;
n is the number of data points (i.e. sub-signal length).

15
The calculations for the least square algorithm and the NMSE values mentioned above
were carried out using MATLAB.
2.5 Model order selection
The determination of the optimum model order is of great importance, as an incorrect
model order can lead to either over-fitting or under-fitting, which both give poor model
prediction and result in a poor and/or false diagnosis [34, 65] Thus, a proper order
selection can reduce the errors of over-fitting or under-fitting considerably. Several
methods, based on increasing the model order and calculating an error criterion function
of model prediction, have been developed for determining the optimum model order.
This function is primarily based on the calculations of the residual sum of squared errors
between the predicted and measured data. The optimum model order minimises the
error criterion function. In this research, the final prediction error (FPE) criterion is
used. This FPE criterion can be defined in the following way (Eq. (9)):
𝐹𝑃𝐸 = 𝑉. (1 + 𝑝 𝑛⁄ ) (1 − 𝑝 𝑛⁄ ) (9)⁄
where
V is the loss function which is the variance of the residuals (i.e. the difference between
the predicted and the actual signal);
p is the model order;
n is the number of data points.

16
According to this criterion, the model order corresponding to the minimum value of
FPE is selected as the optimum order
2.6 Dealing with model orders
There might be some cases where the model orders for different signals/signal
categories are not the same as some fault types may require a different model order. As
these model orders will represent the lengths of the feature vectors formed for the
diagnosis stage, it means the lengths of the feature vectors will not be the same. In this
case, the equalising step is necessary in order to apply the NN rule properly in the fault
diagnosis stage. Three different possibilities are investigated to see whether the way of
equalising can affect the performance of the methodology or not. Assuming that the
minimum and maximum optimum orders for several signals/categories are (pmin) and
(pmax) respectively, the equalising possibilities are:-
2.6.1 Zero padding. In this procedure the feature lower order vectors (l< pmax)
are transformed by adding (pmax – l) zero elements at the ends (see Figure
1). Eventually all the feature vectors acquire the maximum length pmax..
2.6.2 Variance Threshold Method: In this method, it is proposed to select the
model coefficients which have the highest variance contribution among
the feature vectors. This can be done using the variance threshold method
(pmax – l) elements
[𝑎𝑜 𝑎1 𝑎2 …. 𝑎𝑙 0 0 0 0]
[𝑎𝑜 𝑎1 𝑎2…… …. 𝑎𝑝𝑚𝑎𝑥]
Figure 1: Illustration of zero padding.

17
(VTM), which proposes to select only the model coefficients with a
variance higher than the mean value of all the features vectors variances.
2.6.3 Trimming. It is proposed to trim/cut the features vectors of length l,
where l> pmin, to length (pmin). If [ao a1 a2…….al] is a longer feature
vector (i.e. l> pmin), then its last l- pmin components are removed and the
new vector is [ao a1 a2…….a Pmin] (see Figure 2).
In this research, all the three possibilities above were applied during the detection and
the fault identification stage. The best one in terms of highest correct classification rate
was selected and used further for the next stage of fault severity estimation.
3 Diagnosis Method
In this study feature vectors, which are made of the coefficients of the autoregressive
models (see Section 2.4) of the sub-signals, are used in the diagnosis stages. The
coefficients of each LTIVAR model, after being subjected to one of the above
procedures in order to equalise their numbers, are ordered to form the feature vectors.
Thus each feature vector is made of the coefficients corresponding to a certain sub-
signal. In the first stage, the sub-signal is assigned to one of the categories
corresponding to different bearing conditions mentioned above. Once a signal was
identified as faulty in the first stage, it is further classified in the second stage into one
cut (l-pmin) elements
[𝑎𝑜 𝑎1 𝑎2 …. 𝑎𝑙−3 𝑎𝑙−2 𝑎𝑙−1 𝑎𝑙
[𝑎𝑜 𝑎1 𝑎2… 𝑎𝑝𝑚𝑖𝑛]
Figure 2: Illustration of trimming.

18
of the fault severity levels (small, medium and large). According to the introduced
stages the following signal categories are adopted. For the first stage four categories are
used, namely healthy bearings signals (H), Inner race fault signals (IRF),Outer race fault
signals (ORF) and ball bearing fault signals (BF). For the second stage of the severity
estimation only three categories are used, namely small faults (S), medium faults (M)
and large faults (L). For both stages, the identification and the severity estimation, the
feature vectors are divided into two samples: a training and a testing sample. The
feature vectors from the training sample were used to define the matrices corresponding
to each signal category (Ka matrices for the first stage and Kb for the second stage).
Each of these matrices is formed by arranging the corresponding feature vectors in
rows, (see Eq (10)). Ka =1, 2…4 and Kb=1,2,3)
For each matrix, the number of columns equals the number of model coefficients which
is the optimum model order (p), while the number of rows (N) equals number of sub-
signals in that category:
𝐇𝐾𝑖 = [
𝑎𝐾𝑖11 𝑎𝐾𝑖12 .𝑎𝐾𝑖21 𝑎𝐾𝑖22 ..
𝑎𝐾𝑖𝑁1
.𝑎𝐾𝑖𝑁2
.
.
𝑎𝐾𝑖1𝑝 𝑎𝐾𝑖2𝑝. 𝑎𝐾𝑖𝑁𝑝
] (10)
where Ki corresponds to one of the categories in the diagnosis stages (i.e. fault
identification 𝐾𝑖 ∈ 𝐾𝑎 and quantification 𝐾𝑖 ∈ 𝐾𝑏).
For both fault classification stages, the nearest neighbour (NN) method [66]was used.
According to this method, a feature vector is assigned to its nearest category. In this
study, the distances of a feature vector to each of the categories (represented by matrix
𝐇𝐾𝑖 (see Eq. (10)) were measured by using the Mahalanobis distance. The Mahalanobis
distance measures the distance between a vector and a set of vectors. Here it was used to
measure the distance between a feature vector and a matrix 𝐇𝐾𝑖 .

19
The mean of the row feature vectors for each of the matrices 𝐇𝐾𝑖 is calculated as
follows:
𝐄𝐾𝑖 =∑ (𝑎𝐾𝑖𝑗1……………
𝑎𝐾𝑖𝑗𝑝)𝑁
𝑗=1
𝑁 (11)
The Mahalanobis distance to the mean vectors EK is measured according to:
𝐷𝐾𝑖(𝐟𝐯, 𝐄𝐾𝑖) = (𝐟𝐯 − 𝐄𝐾𝑖). 𝐒−1. (𝐟𝐯 − 𝐄𝐾𝑖)
′ (12)
where
𝐷𝐾 is Mahalanobis distance;
𝐟𝐯 is a feature vector from the testing sample;
𝐒−1 is the inverse of the category covariance matrix 𝐇𝐾𝑖.
The prime ( ′ ) denotes the transpose of the vector (𝐟𝐯 − 𝐄𝐾𝑖).
It is important to mention that both (𝐟𝐯, 𝐄𝐾𝑖) lengths are already equalised using one of
the procedures described in Section 2.6.
When the distances of a new feature vector to each of the categories are obtained,
the vector is classified to the category for which the distance above (see Eq. (12)) has a
minimum; that is, fv belongs to the category for which 𝐷𝐾𝑖(𝐟𝐯, 𝐄𝐾𝑖) has minimum over
all Ki.
Figure 3 shows the stages of the diagnosis procedure. It is clear from the figure that in a
case in which the new feature vector is assigned as healthy, it will not go further for the
second stage of diagnosis.

20
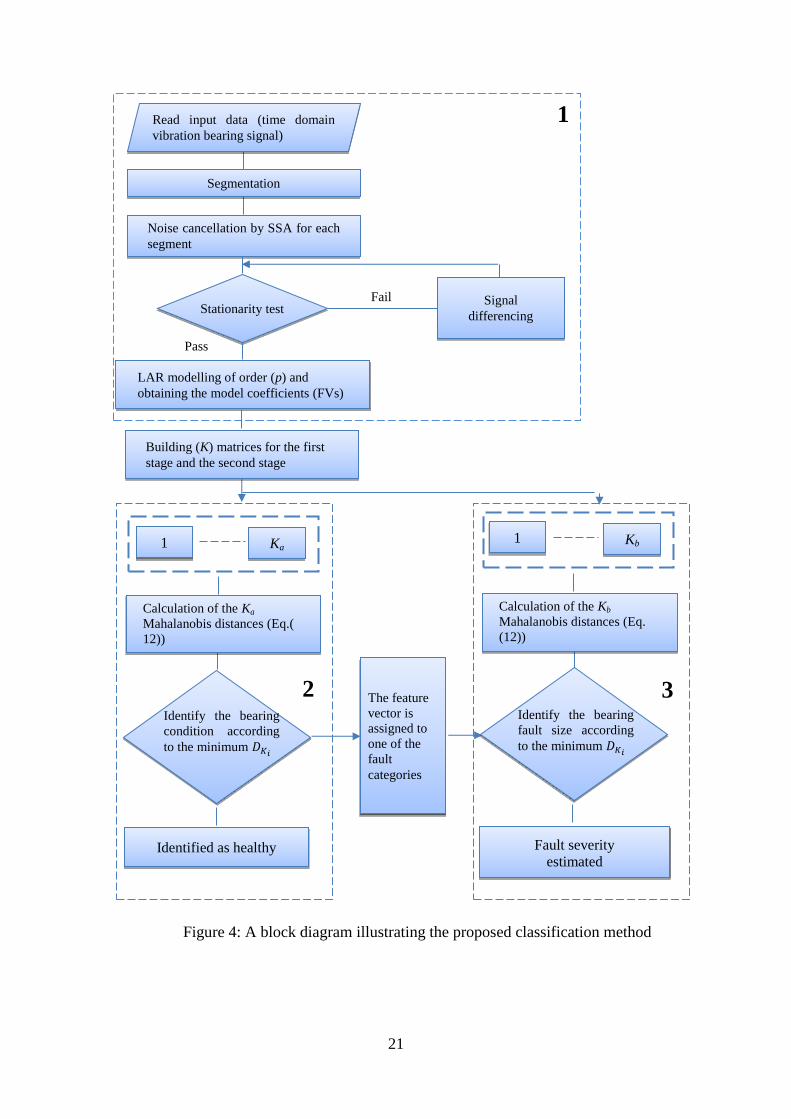
Figure 4 shows the block diagram of the whole process of the methodology. There are
three main blocks in the flow chart (1, 2 and 3), each bordered by a dashed rectangle.
Block 1: the stages of signal pretreatment.
Block 2: Fault identification.
Block 3: Fault severity estimation.
Figure 3: A scheme illustrating the bearing condition categories for
both the diagnosis stages
A new feature vector
Stage 1
Stage 2
Class 1(i.e H) Class2 ……..… Class Ka
…
𝑆𝑖𝑧𝑒1(𝑖. 𝑒 S) 𝑆𝑖𝑧𝑒𝐾𝑏 …
𝑆𝑖𝑧𝑒1(𝑖. 𝑒 S) 𝑆𝑖𝑧𝑒𝐾𝑏
21
Figure 4: A block diagram illustrating the proposed classification method
Pass
1
LAR modelling of order (p) and
obtaining the model coefficients (FVs)
Read input data (time domain
vibration bearing signal)
Segmentation
Noise cancellation by SSA for each
segment
Stationarity test Signal
differencing
Fail
Building (K) matrices for the first
stage and the second stage
The feature
vector is
assigned to
one of the
fault
categories
3
Calculation of the Kb
Mahalanobis distances (Eq.
(12))
1 mo
Kb
Fault severity
estimated
Identify the bearing
fault size according
to the minimum 𝐷𝐾𝑖
Identified as healthy
1 mo
Calculation of the Ka
Mahalanobis distances (Eq.(
12))
Ka
2 Identify the bearing
condition according
to the minimum 𝐷𝐾𝑖

22
The performance of the methodology was estimated by using the so-called confusion
matrix. The confusion matrix is a square (Kk x Kk) matrix, where Kk (i.e, either Ka or Kb)
is the number of sub-signal categories. The columns represent the predicted classes,
while the rows represent the actual classes. Thus, the main diagonal represents the
correctly categorised signals, while all the other elements represent the miscategorised
signals. The name ‘confusion’ stems from the fact that this matrix makes it easy to
evaluate whether the proposed methodology confuses two or more classes (i.e.
mislabelling one category as another). Table 1 shows the structure of a confusion
matrix:
Actual
class/predicted
class
1 2 ...... Kk
1 C11% C12% …… C1Kk%
2 C21% C22% …… C2Kk%
.
.
.
.
.
.
.
.
.
.
Kk CKk1% CKk2% …… CKkKk%
Table 1: An example of a confusion matrix

23
Cij (i and j =1,2…Kk) refers to the percentage of vectors from class i which are
classified as class j. It is clear that if i=j, then Cij represents the percentage of correct
classification. If i≠j, then Cij represents the percentage ratio of the misclassification.

24
4 Method verification-case studies
The methodology was tested and validated using several bearing vibration datasets
obtained from different test rigs.
4.1 Case Study 1
The bearing vibration data were obtained from the test rig of Case Western Reserve
University (CWRU). The data-bearing centre [67] shown in Figure 5 consists of a 2 HP
three-phase induction motor: a dynamometer. The drive end bearing (SKF 6025 deep
grove ball bearing) data were used in this analysis. An electrical discharge machine was
used to introduce single point faults in the bearing raceways and ball elements of
different bearings with fault diameters of 0.007, 0.014, and 0.021 inches and a depth of
0.011 inches. The bearing vibration data were obtained at a sampling rate of 12 kHz for
different fault sizes, with speed varying from 1797 rpm (0 HP) to 1730 rpm (3 HP). The
data for the outer race fault were taken with the fault position centred at the 6 o’clock
position with respect to the load zone.
Figure 5: The bearing test rig [65]

25
4.2 Case Study 2
The test data for this case study was acquired from a bearing test rig at Strathclyde
University/Department of Mechanical and Aerospace Engineering, shown in Figure 6.
The test rig consists of a 1Hp shunt DC motor, bearing assembly and a mechanical
loading system. The bearings used in the experiment are SKF deep grooves 6308. The
motor shaft’s torque is transmitted to the test bearing assembly by a pinion-toothed belt
mechanism. As the pinions at the motor and the entrance of the bearing assembly are of
different diameters, the rotational speed of the test bearing shaft is measured by a
contactless tachometer. Faults were introduced using an electrical discharge machine on
the inner raceway and outer raceway using different bearings with a fault diameter of
0.05 inches. The bearing vibration data were obtained for healthy, inner raceway and
outer raceway fault conditions at two rotational speeds (350 and 500 rpm). Signals
were obtained at a 2.5 kHz sampling rate.
Figure 6: Bearing test rig at Strathclyde University

26
4.3 Case Study 3
The data were acquired from a test assembled at the Department of Mechanical and
Aerospace Engineering of Politecnico di Torino by the Dynamics & Identification
Research Group (DIRG) (Figure 7) [68]. The signals were acquired at a 102.4 kHz
sampling frequency for both healthy, defective inner raceway and defective roller
bearings at 500 Hz speed and 1.8 kN load. The fault diameters were 0.006, 0.0098 and
0.0178 inches.
5 Results and discussion
The bearing vibration signal sets that were considered in the validation of the
methodology are labelled as (CW) for the data corresponding to Case Study 1 (i.e.
CWRU), (ST) for those data corresponding to Case Study 2 (i.e. Strathclyde) and (PT)
for those corresponding to Case Study 3 (i.e. Politecnico di Torino)
Figure 7: DIRG test rig, the triaxial accelerometers (X, Y, Z) and the damaged roller
used in the tests [56]

27
5.1 Signal pretreatment
In this section, the steps of the signal pretreatment stage are illustrated visually. A
sub-signal from a bearing with a small fault on the inner race (e.g case study3) is
used as an example. Figure 8 shows the raw sub-signal in the time domain. The x-
axis represents the number of points (2048) and the y axis represents the
acceleration of the bearing vibration in m/s2.
As mentioned in Section (2.2), the signal is decomposed by the singular spectrum
analysis into a number of components. Figure 9 shows the original sub-signal as well as
the first five components obtained by the SSA. It is clear that the first component
corresponds to the trend of the signal.
Figure 8: A signal from data set 3, a bearing with inner race fault

28
As mentioned above in Section 2.2, a number of the PCs are selected so that at least
90% of the original sub-signal variance is recovered in the new reconstructed signal. In
this example 19 out of the 43 components (e.g contains nearly 90 %) are selected. The
structure-less noise is removed by rejecting the low contribution components.
In the Figure 10 shows the effect of the noise cleaning by SSA. The blue and red lines
refer to the raw and noise cleaned signal respectively where the signal becomes
smoother due to removing the structure-less noise.
Figure 9: Original sub-signal and the first five components obtained from the
singular spectrum analysis

29
When the sub-signal fails at the test of stationarity (Section 2 .3), it is then subjected to
differencing to stabilize its mean and to be transformed to a stationary. It is important to
know that not all the sub-signals are differenced, but only those which fail in the test of
stationarity. The differenced sub-signals are subjected again to the test of stationarity to
see whether one differencing is sufficient to bring it to stationarity. For all the cases,
differencing was applied once. Figure 11 shows the signal after differencing. It can be
seen from the figure that the sub-signal mean is less fluctuated compared to the sub-
signal shown in the Figure 10.
Figure 10: Raw signal verses noise cleaned signal by singular spectrum
analysis (SSA)

30
The sub-signal is then subjected to modelling by the LTIVAR model (Eq.7).
Figure 12 shows both the differenced (black line) and the modelled sub-signal (red
line). It can be seen that the model is accurately representing the differenced sub-signal
(e.g NMSE is 97.6% see Eq.(8)).
Figure 11: A differenced sub-signal

31
5.2 Signal Diagnosis
5.2.1 Case Study 1
The data obtained from the drive end bearing and used for validating the methodology
for fault type identification and fault severity estimation are shown in Table 2. The
notations are as follows: H - healthy bearing; IRF - bearing with a fault on the inner
raceway; BF - bearing with a fault on the rolling element; ORF - bearing with a fault on
the outer raceway; S - small fault (0.007 inch diameter); M – medium-size fault (0.014
inch diameter) and L - large fault (0.021 inch diameter).
Figure 12: a differenced sub-signal versus modelled sub-signal

32
The cases (from CW1 to CW4) were used in the first stage of classification (fault
identification), while the others were used in the second stage of diagnosis (fault
estimation).
For each case in Table 2, the signals were segmented into a number of segments of 2048
points each. Each segment was then decomposed by the singular spectrum analysis into
Case no. Motor speed(rpm) Signal Category
CW1 1797 Healthy, (IRF, BF and ORF) small fault 0.007’’
CW2 1772 Healthy, (IRF, BF and ORF) small fault 0.007’’
CW3 1750 Healthy, (IRF, BF and ORF) small fault 0.007’’
CW4 1730 Healthy, (IRF, BF and ORF) small fault 0.007’’
CW5 1797 IRF (S,M and L)
CW6 1797 BF (S,M and L)
CW7 1797 ORF (S,M and L)
CW8 1772
IRF (S,M and L)
CW9 1772
BF (S,M and L)
CW10 1772
ORF (S,M and L)
CW11 1750
IRF (S,M and L)
CW12 1750
BF (S,M and L)
CW13 1750
ORF (S,M and L)
CW14 1730
IRF (S,M and L)
CW15 1730
BF (S,M and L)
CW16 1730
ORF (S,M and L)
Table 2: The drive end bearing vibration datasets obtained from case study 1
used in the bearing condition diagnosis

33
a number of components equal to the ratio of sampling rate to the minimum bearing
fault frequency. For example, in case CW2 (speed=1772 rpm; see Table 2) the
minimum bearing fault frequency was that of the fault on the outer race, which equals
3.5848*rotational speed (in Hz) [67]. The number of decomposed components therefore
equals (12000 / (3.5848*1772/60)) = 114 components. The number of the selected
components for reconstruction purposes was determined so that at least 90% of the
original signal variance was contained by the reconstructed signal. The model optimum
order and goodness of fit values for CW2 are given in Table 3.
It can be seen from Table 3 how well the model predicts the majority of de-noised sub-
signals.
Samples of the confusion matrices (CW2) described in Section 3 are shown below in
Tables 4-6, based on the different possibilities of equalisation of feature vector length
discussed in Section 2.6. The number of the feature vectors used in the first stage of
diagnosis is 232 (4 signal categories*58 segments for each category, made by dividing
the length of original signal by the segment length (2048)). Half of them (116) are used
for forming the signal category matrices (see Section 3) while the remaining 116 are
used as testing feature vectors.
Signal Category Model optimum order (p) NMSE (Eq. (8))
H 5 99.96%
IRF 12 99.2%
BF 8 98.96%
ORF 6 99.94%
Table 3: The model optimum order and NMSE values for data
obtained at 1772 rpm

34
Prediction
H IRF BF ORF A
ctual
H 100% 100% 0% 0%
IRF 0% 100% 0% 0%
BF 0% 0% 100% 0%
ORF 0% 0% 0% 100%
Table 4 : The confusion matrix using feature vectors modified by
zero padding: 116 feature vectors at 1772 RPM
Prediction
H IRF BF ORF
Act
ual
H 100% 0% 0% 0%
IRF 0% 100 0% 0%
BF 0% 0% 89.65% 10.35%
ORF 0% 0% 79.3% 20.7%
Table (5) : The confusion matrix using feature vectors
modified by variance threshold method : 116 feature vectors at
1772 RPM
Prediction
H IRF BF ORF
Act
ual
H 100% 0% 0% 0%
IRF 0%
100% 0% 0%
BF 0% 0%
100% 0%
ORF 0% 0%
0% 100%
Table (6) : The confusion matrix using feature vectors
modified using trimming: 116 feature vectors at 1772
RPM

35
For the data used in this analysis, it is found that using any of the zero padding and
trimming ensures a very high correct classification rate. Accordingly, one of these two
methods was selected (e.g trimming) and all subsequent results shown in this paper
were obtained following it.
An example of the confusion matrix for fault size estimation (CW8) using trimming is
shown in Table 7. In the stage for fault severity diagnosis, the number of feature vectors
was 174 (3 categories*58). The number of the feature vectors from the testing sample
was 87 (0.5*174).
In order to present the correct classification rates (%), the average of the values on the
diagonal on each confusion matrix are shown rather than the entire confusion matrix, as
the values on the diagonals represent those of correct classification (see Table 1).
For example, for the confusion matrix in Table 7, corresponding to the case CW8, the
average of diagonal values is (100%+100%+100%)/3 = 100%. Table 8 shows the
correct classification rates (in percent) for all the cases mentioned in Table 2.
predicted
S M L
Act
ual
S 100% 0% 0%
M 0%
100% 0%
L 0% 0%
100%
Table 7: Correct classification rate using features vectors based on trimming method
for estimation of different fault sizes on the inner raceway at 1772 rpm.

36
Case
no.
Motor
speed
(rpm)
Signal Category
No of testing FVs Average % correct
classification rate
CW1 1797
Healthy, (IRF,
BF and ORF) small
fault 0.007’’ diameter
116 100%
CW2 1772
Healthy, (IRF,
BF and ORF) small
fault 0.007’’ diameter
116 100%
CW3 1750
Healthy, (IRF,
BF and ORF) small
fault 0.007’’ diameter
116 100%
CW4 1730
Healthy, (IRF,
BF,ORF) small fault
0.007’’ diameter
116 100%
CW5 1797 IRF (S,M and L) 87 100%
CW6 1797 BF (S,M and L) 87 100%
CW7 1797 ORF (S,M and L) 87 100%
CW8 1772 IRF (S,M and L) 87 100%
CW9 1772 BF (S,M and L) 87 100%
CW10 1772 ORF (S,M and L) 87 100%
CW11 1750 IRF (S,M and L) 87 100%
CW12 1750 BF (S,M and L) 87 98.8%
CW13 1750 ORF (S,M and L) 87 100%
CW14 1730 IRF (S,M and L) 87 100%
CW15 1730 BF (S,M and L) 87 100%
CW16 1730 ORF (S,M and L) 87 100%
Table 8: The average correct classification rates based on trimming as equalisation
of feature vectors for case study 1

37
It can be seen that the average correct classification rates are 100% for all of the cases
except one, CW12, in which one feature vectors has been misclassified.
Case Study 2
The data obtained from the test rig presented in Section 4.2 are also used for validating
the methodology for fault type identification. The data considered are shown in the
Table 9.
The notation (ST) refers to the test rig at Strathclyde University from which the test data
were acquired.
The number of signals used for classification was 375 (125 signals*3 classes). Each of
these signals is made of 2048 points. Table 10 illustrates how the performance of the
methodology for Case Study 2.
Case no. Motor speed (rpm) Signal Category
ST1 350 Healthy, IRF, ORF
ST2 500 Healthy, IRF, ORF
Table 9: The bearing vibration datasets obtained from case study 2 used for fault
type identification

38
It can be seen from Table 10 that very few signals have been misclassified. At 350 rpm,
only 6 feature vectors from faulty inner race (IRF) category were misclassified as
healthy (H) category. At 500 rpm, only 8 feature vectors from the healthy (H) category
were misclassified as faulty outer race (ORF) category faulty (outer raceway fault).
5.3 . Case Study 3
Table 11 shows the data acquired from the test rig introduced in Section 4.3.
Case
no.
Motor
speed
(rpm)
Signal Category
No of testing
FVs
Average %
correct
classification
rate
ST1 350 Healthy, IRF and
ORF
375 98.4%
ST2 500 Healthy, IRF and
ORF
375 98%
Table 10: The average correct classification rates based on trimming as
equalisation of feature vectors for case study 2
Case no. Motor speed (rpm) Signal Category
PT1 30000 (Healthy, IRF and BF) small fault 0.006 inch diameter
PT2 30000 IRF (S, M and L)
PT3 30000 BF (S, M and L)
Table 11: The bearing vibration datasets obtained from case study 3 used for the
bearing condition diagnosis
39
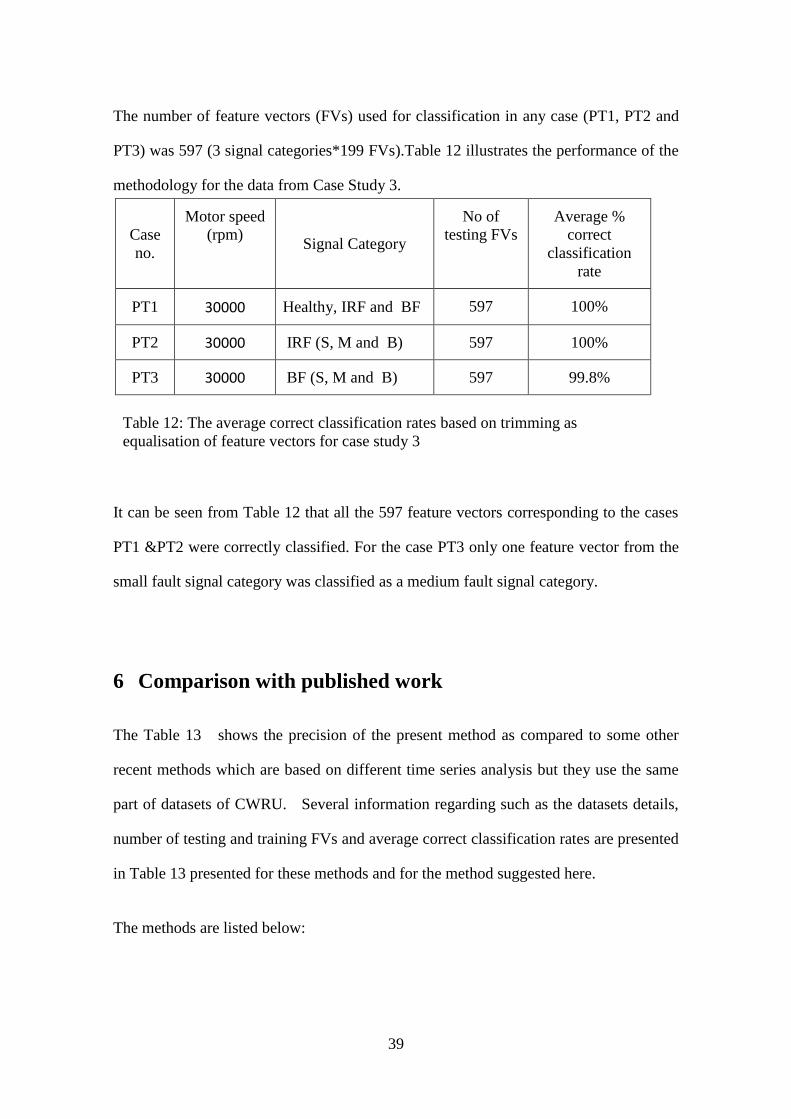
The number of feature vectors (FVs) used for classification in any case (PT1, PT2 and
PT3) was 597 (3 signal categories*199 FVs).Table 12 illustrates the performance of the
methodology for the data from Case Study 3.
It can be seen from Table 12 that all the 597 feature vectors corresponding to the cases
PT1 &PT2 were correctly classified. For the case PT3 only one feature vector from the
small fault signal category was classified as a medium fault signal category.
6 Comparison with published work
The Table 13 shows the precision of the present method as compared to some other
recent methods which are based on different time series analysis but they use the same
part of datasets of CWRU. Several information regarding such as the datasets details,
number of testing and training FVs and average correct classification rates are presented
in Table 13 presented for these methods and for the method suggested here.
The methods are listed below:
Case
no.
Motor speed
(rpm) Signal Category
No of
testing FVs
Average %
correct
classification
rate
PT1 30000 Healthy, IRF and BF 597 100%
PT2 30000 IRF (S, M and B) 597 100%
PT3 30000 BF (S, M and B) 597 99.8%
Table 12: The average correct classification rates based on trimming as
equalisation of feature vectors for case study 3

40
1) Difference histograms (DHs) and feed forward neural network (FFNN) [69]: The
difference histograms (DHs) based method includes the formation of scaled
representation for histograms of increased segment lengths. Some of the first
histogram bins are used as inputs to a FFNN for classification purpose of faults.
2) SSA and back propagation neural network (BPNN) [46]:In this study two sets of
feature vectors are developed using SSA. The first FV includes the singular values of
some of the first several principal components and the other FV uses the energy of the
time domain of sub-signal components corresponding to these principal components.
These feature vectors are used as input to the BPNN classifier.
3) In [70], signals from two different accelerometers are used to create a two
dimensional representation of the bearing condition. The minimum volume ellipsoid
(MVE) method is used to extract the features. Principal component analysis (PCA) is
used for selecting the most important features. The last step is to input the selected
features to the nonlinear nearest neighbour classifier.
It can be seen from Table 13 that all the compared methods achieve a rather good
classification rate. From all the four methods compared it can be seen that the method
suggested here demonstrates the best classification rate, which is between 98.8-100%

41
Method Dataset(single point defect size width; load; signal length)
Training and testing datasets
Condition classified
Average testing accuracy (%)
Fault features
1)DH and FFNN[69] 0.18, 0.36,0.53mm; 0–3 HP load;30000 data points
Both 144 (IF, OF and BF classification only)
92-95 First 6 histogram bins
2)SSA and BPNN [46] 0.18, 0.36, 0.53, 0.71 mm; 0– 3 HP load;6100 data points
Train—336 test—144
H, IF,OF and BF
96.53–100 95–100
4 singular values 3 energy features
3)MVE, PCA and nonlinear neighbour classifier [70]
0.18, 0.36,0.53mm , 0-3 HP, 2000 data points
- Healthy and faulty. It was reported by the author that there is some overlapping among some fault classes
94.68-99.98 -
4)Differencing, SSA and AR [present work]
0.18, 0.36,0.53 mm; 0-3 HP loads; 2048 data points
Train-464 Test-464
H, IF, OF and BF 98.8-100 coefficients of LTIVAR model
Table 13: A comparison of the performance of the present methodology with other published work using the same parts of CWRU data

42
7 Conclusions
The present work suggests a new methodology for rolling element bearing fault
diagnosis based on linear time invariant autoregressive modelling and pattern
recognition. The suggested method is relatively simple in the sense that it uses a
combination of simple processes to first transform the signal and then determine the
condition of the bearing. A new signal pretreatment process is applied before subjecting
the signals to modelling. This process includes noise cleaning, using singular spectrum
analysis (SSA), and stationarisation of the bearing vibration signal by the differencing
procedures. The methodology aims to transform the signal to bring it close to a
stationary one, rather than complicating the model to bring it closer to the signal. The
signal pretretment proposed enhances the precision of the model prediction, which is
influenced by the presence of noise and non-stationary parts in the signal. The LTIVAR
model coefficients are extracted using the least squares method and used as FVs for
signal classification purpose. The FVs are then presented to the 1-NN algorithm based
on the Mahalanobis distance. The signals were assigned to the category of their nearest
neighbour. The performance of the methodology is then assessed on the basis of
confusion matrices, which provide the percentage of correctly- and incorrectly-
classified signals.
The methodology suggested encompasses several relatively simple procedures, which
facilitates its potential practical application and its possible automation.
The developed methodology is intended to serve as a stepping-stone towards the
development of a new process for bearing fault diagnosis which will not require the
availability of sample signal data from the different categories. This will be based on a
study of the behaviour of the AR coefficients with the presence and the growth of
different faults, which the authors are currently conducting.

43
Acknowledgments
The authors acknowledge the support of the Iraqi Ministry of Higher Education and
Scientific Research, which made this research possible. The support of the University of
Torino in terms of providing experimental data is gratefully acknowledged.
[1] H. Çalis, A. Çakir, E. Dandil, Artificial immunity-based induction motor bearing
fault diagnosis, Turkish Journal of Electrical Engineering & Computer Sciences, 21
(2013).
[2] N. Tandon, A. Choudhury, A review of vibration and acoustic measurement
methods for the detection of defects in rolling element bearings, Tribology international,
32 (1999) 469-480.
[3] G.A.a.S.U. Amit R. Bhende, Assessment of Bearing Fault Detection Using
Vibration Signal Analysis, VSRD-TNTJ, 2 (2011) 249-261.
[4] C.N.K. Kappaganthu, Vibration- based diagnostics of rolling element bearings: state
of the art and Challenges, 13th Worl d Congress in Mechanism and Machine Science,
Guanajua´to, Mexico, (2011) 19-25.
[5] C. Sujatha, C. Chandran, On various specialized vibration techniques for detection
of bearing faults, Department of Applied Mechanics, Indian Institute of Technology,
Madras, 600 (2002) 036.
[6] N. Tandon, G. Yadava, K. Ramakrishna, A comparison of some condition
monitoring techniques for the detection of defect in induction motor ball bearings,
Mechanical Systems and Signal Processing, 21 (2007) 244-256.
[7] R.B. Randall, J. Antoni, Rolling element bearing diagnostics—a tutorial, Mechanical
Systems and Signal Processing, 25 (2011) 485-520.
[8] E. Ebrahimi, Vibration analysis for fault diagnosis of rolling element bearings,
Journal of American Science, 8 (2012).
[9] T.B. Jacek Urbanek, Tadeusz Uhl, Comparison of Advanced Signal- Processing
Methods for Roller Bearings Fault Detection, Metrol. Meas. Syst., XIX (2012) 715-726.
[10] J. Antoni, The spectral kurtosis: a useful tool for characterizing non-stationary
signals, Mechanical Systems and Signal Processing, 20 (2006) 282-307.

44
[11] F. Bolaers, O. Cousinard, P. Marconnet, L. Rasolofondraibe, Advanced detection
of rolling bearing spalling from de-noising vibratory signals, Control Engineering
Practice, 12 (2004) 181-190.
[12] J. Dron, F. Bolaers, Improvement of the sensitivity of the scalar indicators (crest
factor, kurtosis) using a de-noising method by spectral subtraction: application to the
detection of defects in ball bearings, Journal of Sound and Vibration, 270 (2004) 61-73.
[13] P. McFadden, J. Smith, Vibration monitoring of rolling element bearings by the
high-frequency resonance technique—a review, Tribology international, 17 (1984) 3-
10.
[14] W. Wang, P. McFadden, Application of wavelets to gearbox vibration signals for
fault detection, Journal of sound and vibration, 192 (1996) 927-939.
[15] S. Tang, On the time–frequency analysis of signals that decay exponentially with
time, Journal of sound and vibration, 234 (2000) 241-258.
[16] N. Baydar, A. Ball, A comparative study of acoustic and vibration signals in
detection of gear failures using Wigner–Ville distribution, Mechanical systems and
signal processing, 15 (2001) 1091-1107.
[17] W.T. Peter, Y. Peng, R. Yam, Wavelet analysis and envelope detection for rolling
element bearing fault diagnosis—their effectiveness and flexibilities, Journal of
Vibration and Acoustics, 123 (2001) 303-310.
[18] J.-H. Lee, J. Kim, H.-J. Kim, Development of enhanced Wigner–Ville distribution
function, Mechanical systems and signal processing, 15 (2001) 367-398.
[19] S.U. Lee, D. Robb, C. Besant, The directional Choi–Williams distribution for the
analysis of rotor-vibration signals, Mechanical Systems and Signal Processing, 15
(2001) 789-811.
[20] N. Nikolaou, I. Antoniadis, Rolling element bearing fault diagnosis using wavelet
packets, Ndt & E International, 35 (2002) 197-205.
[21] J. Zheng, J. Cheng, Y. Yang, Multiscale Permutation Entropy Based Rolling
Bearing Fault Diagnosis, Shock and Vibration, 2014 (2014).
[22] I. Howard, A Review of Rolling Element Bearing Vibration'Detection, Diagnosis
and Prognosis', in, DTIC Document, 1994.
[23] M. Arnold, X. Milner, H. Witte, R. Bauer, C. Braun, Adaptive AR modeling of
nonstationary time series by means of Kalman filtering, Biomedical Engineering, IEEE
Transactions on, 45 (1998) 553-562.
[24] S.L. Marple Jr, Digital spectral analysis with applications, Englewood Cliffs, NJ,
Prentice-Hall, Inc., 1987, 512 p., 1 (1987).
[25] L. Satish, Short-time Fourier and wavelet transforms for fault detection in power
transformers during impulse tests, Science, Measurement and Technology, IEE
Proceedings-, 145 (1998) 77-84.

45
[26] Y.H. Chen, X.L. Zhang, H.H. Li, Feature Extraction of Nonstationarity Vibration
Signal Based on Wavelet Decomposition, Applied Mechanics and Materials, 220 (2012)
2228-2234.
[27] K. Mori, N. Kasashima, T. Yoshioka, Y. Ueno, Prediction of spalling on a ball
bearing by applying the discrete wavelet transform to vibration signals, Wear, 195
(1996) 162-168.
[28] R. Yan, R.X. Gao, An efficient approach to machine health diagnosis based on
harmonic wavelet packet transform, Robotics and Computer-Integrated Manufacturing,
21 (2005) 291-301.
[29] S. Conforto, T. D'alessio, Spectral analysis for non-stationary signals from
mechanical measurements: a parametric approach, Mechanical Systems and Signal
Processing, 13 (1999) 395-411.
[30] G. Wang, Z. Luo, X. Qin, Y. Leng, T. Wang, Fault identification and classification
of rolling element bearing based on time-varying autoregressive spectrum, Mechanical
Systems and Signal Processing, 22 (2008) 934-947.
[31] Y. Zhang, S. Ai, EMD based envelope analysis for bearing faults detection,
Intelligent Control and Automation, 2008. WCICA 2008. 7th World Congress on,
(2008) 4257-4260.
[32] Q. Miao, D. Wang, M. Pecht, Rolling element bearing fault feature extraction using
EMD-based independent component analysis, Prognostics and Health Management
(PHM), 2011 IEEE Conference on, (2011) 1-6.
[33] L. Saidi, J.B. Ali, F. Fnaiech, Bi-spectrum based-EMD applied to the non-
stationary vibration signals for bearing faults diagnosis, ISA transactions, 53 (2014)
1650-1660.
[34] Y. Zhan, A. Jardine, Adaptive autoregressive modeling of non-stationary vibration
signals under distinct gear states. Part 1: modeling, Journal of Sound and Vibration, 286
(2005) 429-450.
[35] Y. Zhan, A. Jardine, Adaptive autoregressive modeling of non-stationary vibration
signals under distinct gear states. Part 2: experimental analysis, Journal of Sound and
Vibration, 286 (2005) 451-476.
[36] B. Harrap, M. Jason, Fault diagnosis of bearings using short data lengths, Proc. of
Condition Monitoring and Diagnostic Engineering Management Conference, (1994)
410-417.
[37] D. Baillie, J. Mathew, A comparison of autoregressive modeling techniques for
fault diagnosis of rolling element bearings, Mechanical Systems and Signal Processing,
10 (1996) 1-17.
[38] A. McCormick, A. Nandi, L. Jack, Application of periodic time-varying
autoregressive models to the detection of bearing faults, Proceedings of the Institution
of Mechanical Engineers, Part C: Journal of Mechanical Engineering Science, 212
(1998) 417-428.

46
[39] N. Doulamis, A. Doulamis, T. Varvarigou, Adaptable neural networks for
modeling recursive non-linear systems, Digital Signal Processing, 2002. DSP 2002.
2002 14th International Conference on, 2 (2002) 1191-1194.
[40] R. Vautard, M. Ghil, Singular spectrum analysis in nonlinear dynamics, with
applications to paleoclimatic time series, Physica D: Nonlinear Phenomena, 35 (1989)
395-424.
[41] R. Vautard, P. Yiou, M. Ghil, Singular-spectrum analysis: A toolkit for short, noisy
chaotic signals, Physica D: Nonlinear Phenomena, 58 (1992) 95-126.
[42] D. Salgado, F. Alonso, Tool wear detection in turning operations using singular
spectrum analysis, Journal of Materials Processing Technology, 171 (2006) 451-458.
[43] W. Wang, J. Chen, X. Wu, Z. Wu, The application of some non-linear methods in
rotating machinery fault diagnosis, Mechanical Systems and Signal Processing, 15
(2001) 697-705.
[44] B. Muruganatham, M. Sanjith, B.K. Kumar, S. Murty, P. Swaminathan, Inner race
bearing fault detection using Singular Spectrum Analysis, Communication Control and
Computing Technologies (ICCCCT), 2010 IEEE International Conference on, (2010)
573-579.
[45] B. Kilundu, X. Chiementin, P. Dehombreux, Singular spectrum analysis for
bearing defect detection, Journal of Vibration and Acoustics, 133 (2011) 051007.
[46] B. Muruganatham, M. Sanjith, B. Krishnakumar, S. Satya Murty, Roller element
bearing fault diagnosis using singular spectrum analysis, Mechanical Systems and
Signal Processing, 35 (2013) 150-166.
[47] M. Sakai, D. Wei, Detection of electrocardiogram mixed in electroencephalogram
by stationarization, International Journal of Bioelectromagnetism, 9 (2007) 61-62.
[48] H. Ijima, A. Ohsumi, Detection of Signals in Nonstationary Noise via Kalman
Filter-Based Stationarization Approach, (2010).
[49] H. Ijima, A. Ohsumi, S. Yamaguchi, Time -delay estimation of signals in
nonstationary random noise via stationarization and Weigner distribution-based
approach, (2010).
[50] H. Ijima, R. Okui, A. Ohsumi, Detection of signals in nonstationary random noise
via stationarization and stationarity test, Statistical Signal Processing, 2005 IEEE/SP
13th Workshop on, (2005) 587-590.
[51] A.M. Atto, Y. Berthoumieu, Wavelet packets of nonstationary random processes:
Contributing factors for stationarity and decorrelation, Information Theory, IEEE
Transactions on, 58 (2012) 317-330.
[52] C. Junsheng, Y. Dejie, Y. Yu, A fault diagnosis approach for roller bearings based
on EMD method and AR model, Mechanical Systems and Signal Processing, 20 (2006)
350-362.

47
[53] P.M. Broersen, Facts and fiction in spectral analysis, Instrumentation and
Measurement, IEEE Transactions on, 49 (2000) 766-772.
[54] H. Hassani, Singular spectrum analysis: methodology and comparison, (2007).
[55] N. Golyandina, V. Nekrutkin, A.A. Zhigljavsky, Analysis of time series structure:
SSA and related techniques, CRC Press, 2010.
[56] M. Ghil, M. Allen, M. Dettinger, K. Ide, D. Kondrashov, M. Mann, A.W.
Robertson, A. Saunders, Y. Tian, F. Varadi, Advanced spectral methods for climatic
time series, Reviews of geophysics, 40 (2002) 3-1-3-41.
[57] H. Mader, Statistics in volcanology, Geological Society of London, London, 2006.
[58] D. Kwiatkowski, P.C. Phillips, P. Schmidt, Y. Shin, Testing the null hypothesis of
stationarity against the alternative of a unit root: How sure are we that economic time
series have a unit root?, Journal of econometrics, 54 (1992) 159-178.
[59] R.J. Hyndman, G. Athanasopoulos, Forecasting: principles and practice, OTexts,
2014.
[60] A. Babu, S. Reddy, Exchange Rate Forecasting using ARIMA, Neural Network
and Fuzzy Neuron, Journal of Stock & Forex Trading, 2015 (2015).
[61] B. Cernat-Gruici, Some empirical evidence on the relationship between
acquisitions, disposals and the stock market, Romanian Economic Journal, 12 (2009) 3-
22.
[62] L. Mangin, M.-N. Fiamma, C. Straus, J.-P. Derenne, M. Zelter, C. Clerici, T.
Similowski, Source of human ventilatory chaos: lessons from switching controlled
mechanical ventilation to inspiratory pressure support in critically ill patients,
Respiratory physiology & neurobiology, 161 (2008) 189-196.
[63] X.H. Cai, Time Series Analysis of Air Pollution CO in California South Coast Area
with Seasonal ARIMA model and VAR model, in: Statistics, University of California
Los Angeles, 2008.
[64] G.E. Box, G.M. Jenkins, G.C. Reinsel, Time series analysis: forecasting and
control, John Wiley & Sons, 2013.
[65] C.-C. Wang, Y. Kang, P.-C. Shen, Y.-P. Chang, Y.-L. Chung, Applications of fault
diagnosis in rotating machinery by using time series analysis with neural network,
Expert Systems with Applications, 37 (2010) 1696-1702.
[66] R.C.G. J.T.Tou, Pattern Recognition Principles, Addison-Wesley Publishing
Company, Reading, Massachusetts, 1974.
[67] C.W.R.U.B.D.C. Website. (07-03-2014),
http://csegroups.case.edu/bearingdatacenter/pages/welcome-case-western-reserve-
university-bearing-data-center-website.
48
[68] A.A. Tabrizi, L. Garibaldi, A. Fasana, S. Marchesielo, Ensemble Empirical Mode
Decomposition (EEMD) and Teager-Kaiser Energy Operator (TKEO) Based Damage
Identification of Roller Bearings Using One-Class Support Vector Machine, EWSHM-
7th European Workshop on Structural Health Monitoring, (2014).
[69] B.J. van Wyk, M.A. van Wyk, G. Qi, Difference histograms: A new tool for time
series analysis applied to bearing fault diagnosis, Pattern recognition letters, 30 (2009)
595-599.
[70] M.O. Mustafa, G. Georgoulas, G. Nikolakopoulos, Bearing fault classification
based on Minimum Volume Ellipsoid feature extraction, Control Applications (CCA),
2013 IEEE International Conference on, (2013) 1177-1182.