A dynamic statistical experiment for atmospheric...
16
Environmental Modeling and Assessment 2 (1997) 307–322 307 A dynamic statistical experiment for atmospheric interactions Devdutta S. Niyogi, Sethu Raman * , Kiran Alapaty and Jongil Han Department of Marine, Earth, and Atmospheric Sciences, North Carolina State University, Raleigh, NC 27695, USA Received July 1996; revised May 1997 Interactions among atmospheric parameters exist at different scales. The pristine approach for observational or model data analysis involves changing the input parameters one at a time (OAT) and studying the effect on the system. Limitations of this approach for atmospheric applications are discussed. A fractional factorial (FF) based study is evolved and a methodology is outlined involving dynamic graphical analysis. Observational data from the FIFE and HAPEX-MOBILHY experiments are utilized with a vegetation and soil moisture scheme dynamically coupled in a planetary boundary layer model to demonstrate the robustness of this approach. Both low-resolution and high-resolution designs are considered. Various aspects of the vegetation-atmosphere interactions are delineated. Results obtained from the interaction-based FF approach differ considerably from the earlier OAT-type studies. Keywords: FIFE, HAPEX-MOBILHY, planetary boundary layer, biospheric analysis, fractional factorial design 1. Introduction The atmosphere is a dynamic system where various energy transfer mechanisms act simultaneously at differ- ent scales. Over the years, our knowledge of this sys- tem has evolved from various field experiments and rig- orous modeling exercises. Efforts to understand the at- mospheric processes started with the assumption of a ho- mogeneous and uniform bare surface. Presently, one of the biggest challenges in atmospheric and climate modeling is to efficiently represent surface features such as vegetation, and soil moisture and associated surface temperature vari- ation [4,20]. This knowledge has helped in understanding and realistically simulating planetary boundary layer (PBL) processes. To study the effect an input parameter has on an entire modeling system, that parameter is generally varied while all the others are held constant. However, we feel that to gain more knowledge of the system, better meth- ods of analysis than the “one-at-a-time” approach must be applied. Our present study proposes the use of a dynamic graph- ical statistical method such as main-effect and Pareto plots, which can be efficiently employed for extracting in- formation on various interactions within the atmospheric processes. The effectiveness of the proposed method is demonstrated through a simulation study using the land- surface scheme of Noilhan and Planton [19] (hereafter re- ferred to as NP89) in a columnar version of the North Car- olina State University (NCSU) planetary boundary layer (PBL) model [1]. Our overall aim is to show that interaction explicit analy- sis is useful, if not essential, for atmospheric studies. * Corresponding author. Address: Department of MEAS, North Carolina State University, Raleigh, NC 27695-8208, USA. E-mail: sethu raman@ ncsu.edu. 2. Experimental design Proper experimental design is crucial for any analysis. Presently there are three ways of designing this kind of an experiment, based on the following approaches: (1) one at a time (OAT), (2) factor separation [21], and (3) fractional factorial [6]. To elucidate the bases of these approaches, consider a system with input parameters P 1 , P 2 , and P 3 . In an OAT approach, the effect a parameter P 1 has on the system is treated as E(P 1 ) = K(P 1 ), i.e., the changes in the system effect are attributed to the changes in P 1 alone through a function K. P 1 is altered over a possible range in steps and the resulting E (OAT) for each P 1 value is obtained. The same is done for P 2 and P 3 , and by comparing the values of E(P i ) the role or significance of each parameter on the entire system is pictured. The factor separation (FacSep) approach attempts to re- solve the effects of P 1 on the system into those that are directly and interactively dependent on P 1 . Thus, the setup involves simulating a system with 2 n combinations (see [21]). In comparing the OAT and FacSep approaches, we find that the OAT approach has the limitations that (1) it is con- ceptually incorrect, as it assumes an independence of the events, and (2) the outcome exaggerates the significance of the parameter. For example, if vegetal cover is altered in a model, corresponding variations are expected in soil mois- ture and soil temperature. The net effect due to the vegetal cover change is thus a combined one and not just that due to change in vegetal cover alone (see [3] for a discussion). This could lead to an erroneous hypothesis for the develop- ment of parameterizations and for an understanding of the process. The FacSep method is informative, but it may not Baltzer Science Publishers BV
Transcript of A dynamic statistical experiment for atmospheric...
Environmental Modeling and Assessment 2 (1997) 307–322 307
A dynamic statistical experiment for atmospheric interactions
Devdutta S. Niyogi, Sethu Raman ∗, Kiran Alapaty and Jongil HanDepartment of Marine, Earth, and Atmospheric Sciences, North Carolina State University, Raleigh, NC 27695, USA
Received July 1996; revised May 1997
Interactions among atmospheric parameters exist at different scales. The pristine approach for observational or model data analysisinvolves changing the input parameters one at a time (OAT) and studying the effect on the system. Limitations of this approach foratmospheric applications are discussed. A fractional factorial (FF) based study is evolved and a methodology is outlined involvingdynamic graphical analysis. Observational data from the FIFE and HAPEX-MOBILHY experiments are utilized with a vegetation andsoil moisture scheme dynamically coupled in a planetary boundary layer model to demonstrate the robustness of this approach. Bothlow-resolution and high-resolution designs are considered. Various aspects of the vegetation-atmosphere interactions are delineated.Results obtained from the interaction-based FF approach differ considerably from the earlier OAT-type studies.
Keywords: FIFE, HAPEX-MOBILHY, planetary boundary layer, biospheric analysis, fractional factorial design
1. Introduction
The atmosphere is a dynamic system where variousenergy transfer mechanisms act simultaneously at differ-ent scales. Over the years, our knowledge of this sys-tem has evolved from various field experiments and rig-orous modeling exercises. Efforts to understand the at-mospheric processes started with the assumption of a ho-mogeneous and uniform bare surface. Presently, one of thebiggest challenges in atmospheric and climate modeling isto efficiently represent surface features such as vegetation,and soil moisture and associated surface temperature vari-ation [4,20]. This knowledge has helped in understandingand realistically simulating planetary boundary layer (PBL)processes. To study the effect an input parameter has on anentire modeling system, that parameter is generally variedwhile all the others are held constant. However, we feelthat to gain more knowledge of the system, better meth-ods of analysis than the “one-at-a-time” approach must beapplied.
Our present study proposes the use of a dynamic graph-ical statistical method such as main-effect and Paretoplots, which can be efficiently employed for extracting in-formation on various interactions within the atmosphericprocesses. The effectiveness of the proposed method isdemonstrated through a simulation study using the land-surface scheme of Noilhan and Planton [19] (hereafter re-ferred to as NP89) in a columnar version of the North Car-olina State University (NCSU) planetary boundary layer(PBL) model [1].
Our overall aim is to show that interaction explicit analy-sis is useful, if not essential, for atmospheric studies.
∗ Corresponding author. Address: Department of MEAS, North CarolinaState University, Raleigh, NC 27695-8208, USA. E-mail: sethu [email protected].
2. Experimental design
Proper experimental design is crucial for any analysis.Presently there are three ways of designing this kind of anexperiment, based on the following approaches: (1) one ata time (OAT), (2) factor separation [21], and (3) fractionalfactorial [6]. To elucidate the bases of these approaches,consider a system with input parameters P1, P2, and P3.In an OAT approach, the effect a parameter P1 has on thesystem is treated as
E(P1) = K(P1),
i.e., the changes in the system effect are attributed to thechanges in P1 alone through a function K. P1 is alteredover a possible range in steps and the resulting E (OAT)for each P1 value is obtained. The same is done for P2
and P3, and by comparing the values of E(Pi) the roleor significance of each parameter on the entire system ispictured.
The factor separation (FacSep) approach attempts to re-solve the effects of P1 on the system into those that aredirectly and interactively dependent on P1. Thus, thesetup involves simulating a system with 2n combinations(see [21]).
In comparing the OAT and FacSep approaches, we findthat the OAT approach has the limitations that (1) it is con-ceptually incorrect, as it assumes an independence of theevents, and (2) the outcome exaggerates the significance ofthe parameter. For example, if vegetal cover is altered in amodel, corresponding variations are expected in soil mois-ture and soil temperature. The net effect due to the vegetalcover change is thus a combined one and not just that dueto change in vegetal cover alone (see [3] for a discussion).This could lead to an erroneous hypothesis for the develop-ment of parameterizations and for an understanding of theprocess. The FacSep method is informative, but it may not
Baltzer Science Publishers BV

308 D.S. Niyogi et al. / A dynamic statistical experiment for atmospheric interactions
be directly applicable for a system with a large number ofparameters.
Compared to the OAT and FacSep approaches, the frac-tional factorial (FF) approach [6] is a practical and usefulcompromise, particularly for systems with numerous para-meters. In the FF approach, the effect due to P1 is analyzedas
E(P1) = K1(P1) +K2(P1 :P2,P1 :P3,P1 :P2,P1 :P2 :P3).
The K1(·) part is the “main-effect” term and is similar to theRHS term in the OAT analysis. The K2(·) part is the inter-action term. For a full fractional experiment, this methodis similar to the FacSep approach, where 2n simulationswould be performed. However, as its name suggests, theFF approach treats a fraction of the combinations. Thismakes the design of the form 2n−p, where p is taken toyield the most information in the fewest simulations [8].The trade-off is between sample size and interactions; mostthree-way and higher interactions are considered negligible(which is valid for most atmospheric cases). Depending onthe information sought in terms of parameter interactions(one, two, or three-way), the FF design has “resolutions.”A resolution V design has all the main effects and two-factor interactions plus principal three-way interactions. Ina resolution III design, all the main effects and principaltwo-factor interactions are resolved, which makes it a de-sirable design for screening when the sample size is largeand interactions alone do not dominate the scenario. A res-olution IV design is intermediate between V and III. Obvi-ously, with increasing resolution the number of simulationsrequired increases.
Below, we describe the application of the FF approachin context of our problem.
3. Methodology
This study has the following objectives: (1) to illustratethe applicability of the dynamic statistical FF-related ap-proaches for land-surface schemes such as that in NP89,(2) to test the sensitivity of the vegetation and soil mois-ture scheme, and (3) to demonstrate the use of graphicalmethods to identify significant input parameters for variouseffects. Thus, the overall objective is to understand the roleof interactions for the purpose of improving parameteriza-tions and analysis of atmospheric-biospheric-related exper-iments. Though the emphasis is on NP89, this should notlimit the application of the method for other atmosphericprocesses or systems.
The theory behind the FF design is well documented [6],and for brevity, therefore, only the key steps about the de-sign approach applied in this study are mentioned here:
1. Decide on the parameters to be included in the study.
2. Decide on the resolution to be applied (III, IV, or V).
3. Conduct simulations/experiments with the combinationsprovided by the design and generate output.
Figure 1. Comparison between FIFE-observed and model-predicted sur-face parameters. Rn and RN (m) are observed and modeled net radiation,H-18 and SHF (m) are the observed and modeled sensible heat fluxes,LH-18 and LHF (m) are the observed and modeled latent heat fluxes for
the FIFE site 18.
For atmospheric data, the next aspect we propose is toperform a graphical analysis, such as the main-effect andPareto plots, or the active-contrast plots (see [9] for de-tails), in order to (1) rank the parameters, and (2) identifythe significant ones; the latter step is crucial in develop-ing computationally efficient models and for measurementprotocol [18]. We illustrate this broad methodology usingthe land-surface scheme of NP89 and data from the FirstInternational Satellite Land Surface Climatology Project(ISLSCP) Field Experiment (FIFE) Golden Day 2 (11 July1987) as the reference data set [20].
The model used is a 1-D, 30-layer modular version of theNCSU PBL model [1]. It utilizes a 1.5-order TKE closurescheme [10,13] with the vegetation and land-surface para-meterization of NP89. Both the turbulence closure schemeand the vegetation parameterizations are employed in anumber of atmospheric models globally [15]. A single-layer vegetation is prescribed and prognostic equations forground temperature and soil moisture are solved. The equa-tions are given in NP89 and Jacquemin and Noilhan [11](hereafter JN90) and are not repeated here. The importantinputs to the model include initial profiles of atmosphericparameters such as wind, temperature, and humidity; ini-tial surface conditions for pressure, moisture availability,and ground temperature; and physiological details such asvegetation cover, leaf area index, and minimum stomatalresistance. Both the model and the reference data set havebeen well tested using OAT-like analyses (see [20] for theFIFE results and analysis; and [1,11] for the model schemeunder consideration).
The initial conditions are obtained from the FIFE GoldenDay 2. This is to ensure that the results obtained fromthe statistical analysis are perturbations of a real situationand therefore physically possible, as opposed to a syn-thetic case study. The model was run for a scenario of10 hours from 0700 to 1700 LST with emphasis on theoverall daytime interactions. Figure 1 shows the observedand predicted radiation and surface fluxes. These outcomes

D.S. Niyogi et al. / A dynamic statistical experiment for atmospheric interactions 309
Table 1Input parameters and higher (+) and lower (−) values selected for use
in the factorial designs.
Symbol∗ Input parameter − +
A RGL: threshold radiation value (W m−2) used 60 100in stomatal/surface resistance (Rs) calculation
B Rsmin: minimum stomatal resistance (s m−1) 60 120
C LAI: leaf area index of vegetation present 0.9 2.8
D VEG: amount of vegetal cover over the 0.4 0.9domain
E SWG: surface soil moisture (m3 m−3) 0.16 0.4
G SSWG: subsurface soil moisture (m3 m−3) 0.14 0.25
H z0: surface roughness for momentum (m) 0.065 0.1
I Tg: surface soil temperature (K) 290 300
J ALB: net albedo (foliage and soil) of the 0.15 0.3domain
∗These are the symbols used in the main-effect and Pareto plots resultingfrom the resolution III study.
confirm the ability of the model to simulate observationsclosely.
Following the FF approach outlined earlier, we firstchose the input parameters to be included. We then iden-tified the resolution, choosing a screening-type resolutionIII design. Third, we chose the design FF0916 (FF de-sign for 9 factors with 16 runs, see [8]). Table 1 lists theparameters and their values corresponding to “+” (higher)or “−” (lower) settings used in the FF design. These val-ues were based on the FIFE Golden Day 2 (11 July 1987)observations; additional values for physiological represen-tations (Rsmin, Rgl, emissivity) are from the model initialconditions used for FIFE simulations in the literature [1,7].Finally, we ran the model using the specified inputs andanalyzed the resulting outcomes.
Following discussion of the screening-type experiment,where nine surface input parameters are considered simul-taneously (section 4), a high-resolution analysis of threeoutput parameters (PBL height, ground temperature, andsoil moisture) is addressed in section 5. Section 6 presentsour conclusions.
4. Screening experiment (resolution III design)
We analyzed the FF0916 screening experiment resultsprimarily using graphical outcomes such as main-effect andthe Pareto plots [8]. In our study, the output parametersconsidered are the model-predicted values of surface resis-tance (Rs), net radiation (RN), PBL height (PBL ht), surfacelatent heat flux (LHF), surface sensible heat flux (SHF),ground temperature (Tg), air temperature in the surfacelayer (Ta), specific humidity of air close to the soil sur-face (Qs), surface layer specific humidity (Qa), soil mois-ture content at the surface soil layer (SWG), and soil mois-ture content in the deep reservoir or the subsurface (SSWG).Note that the model has prognostic equations for all theabove mentioned parameters and hence table 1 shows onlythe initial conditions and the data for the interaction study
is the time-varying model predicted outcome (see figure 1as an example for energy fluxes).
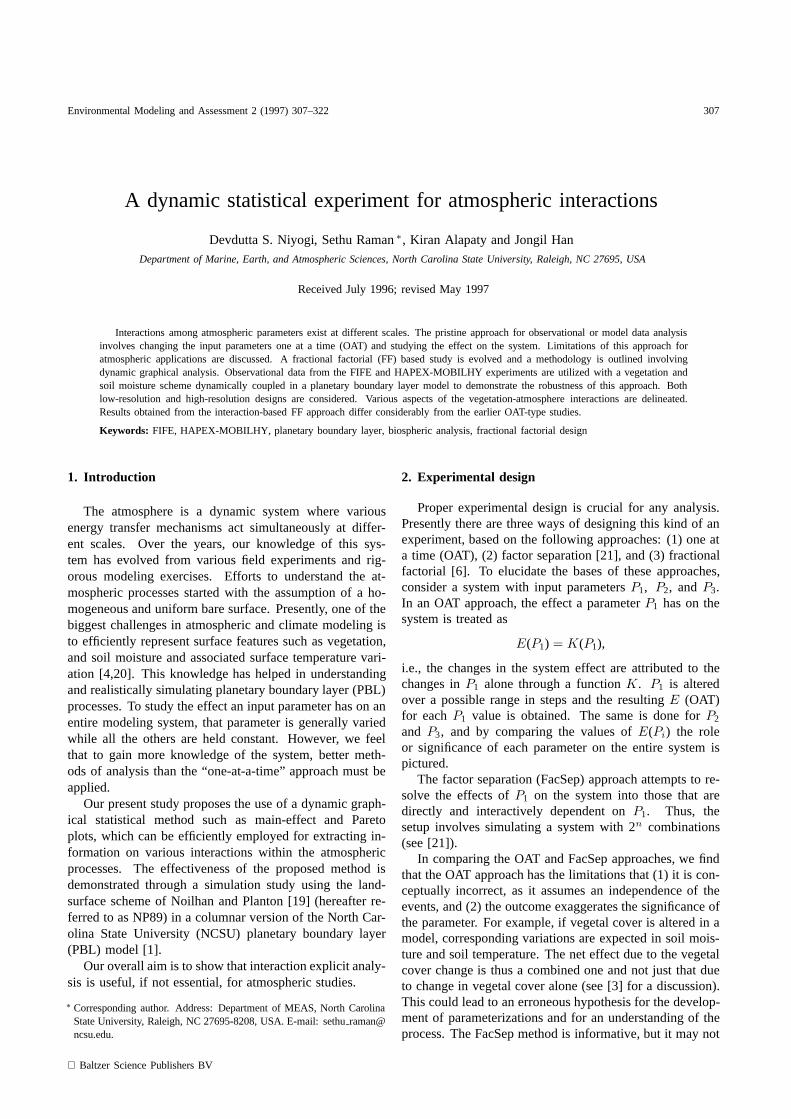
First, some background on our main-effect and Paretoplots. The main-effect plots (figure 2) provide a “meanview” of the changes in the response or effect due tochanges in the input parameters. Pareto plots are basedon the principle that 90% of the effects in a system can beattributable to 10% of the parameters [8]. The terms A–J(barring F, which is reserved for the statistical program-ming logic) represent a model input parameter (table 1)and each takes a higher (+) or a lower (−) value as perthe design FF0916. In main-effect analysis, the interactioneffect is implicit; in Pareto plots (figure 3), however, it isexplicit.
We carried out these analyses for the 11 model predictedoutput parameters (Rs, RN, PBL ht, LHF, SHF, Tg, Ta,Qs, Qa, SWG and SSWG) for 1300 LT. Many interestingfeatures are apparent from the main-effect plots (figure 2)and Pareto plots (figure 3). The subsections below highlightsome of the key findings.
4.1. Radiation limit for photosynthesis (Rgl)
We found that Rgl is quite significant as an interac-tion term (figure 3) for almost every output parameterconsidered. However, even a detailed OAT validation onthis model (JN90) could not identify this term as crucial.The reason our study found it to be important for theNP89 scheme is primarily because of the interactive na-ture of this term. In other words, a high radiation limitby itself does not produce any significant changes in thePBL structure; rather, it is the interaction with other terms,like LAI and surface soil moisture (SWG), that is crucial.
4.2. Soil moisture (SSWG and SWG)
The deep soil moisture (SSWG) plots in figures 2 and 3show that any error in assigning initial subsurface soil mois-ture apparently does not get smoothed out and remains dur-ing the entire run. Looking simply at the sign associatedwith each term (figure 3), (and confirming they are notjust a statistical artifact), it appears that, for longer timeperiods, the surface change, if triggered through vegeta-tive processes, could be more significant than any other.With ground temperature (Tg) as a main effect and thetwo Rgl interactions, we see a tendency toward depletionof deep soil moisture (SSWG). On the other hand, highervegetal cover (VEG) would tend to conserve the deep soilmoisture. In effect, the radiative process seems to have thegreatest effect on the complex deep soil moisture variation,and a strong interaction with vegetation is also important.There appears to be a compensating process among thesurface parameters in the net outcome. Physiological in-teraction depletes the subsurface water content, while thevegetal cover as a main effect conserves it. Thus, as vegetalcover increases, generally the physiological interaction willalso increase, and as the two act in an opposite manner, the

310 D.S. Niyogi et al. / A dynamic statistical experiment for atmospheric interactions
Figu
re2.
Mai
n-ef
fect
plot
sfo
rth
eim
pact
ofth
e9
inpu
tpa
ram
eter
son
the
11ou
tput
para
met
ers
(res
olut
ion
III
expe
rim
ent)
.T
hesy
mbo
lsA
–Jar
ede
fined
inta
ble
1.

D.S. Niyogi et al. / A dynamic statistical experiment for atmospheric interactions 311
Figu
re2.
(Con
tinue
d).
312 D.S. Niyogi et al. / A dynamic statistical experiment for atmospheric interactions
Figu
re3.
Pare
topl
ots
corr
espo
ndin
gto
the
mai
n-ef
fect
plot
sin
figur
e2
(res
olut
ion
III
expe
rim
ent)
.PS
Est
ands
for
pseu
dost
anda
rder
ror.

D.S. Niyogi et al. / A dynamic statistical experiment for atmospheric interactions 313
Figu
re3.
(Con
tinue
d).

314 D.S. Niyogi et al. / A dynamic statistical experiment for atmospheric interactions
net effect may not be as sensational as the OAT variationsgenerally predict.
Interestingly, although closely related to deep soil mois-ture, SWG has a markedly different response to changes insurface features. The major difference occurs for changesin the vegetal cover, which is found to be the most im-portant parameter for both surface and deep soil moisture.For deep soil moisture there is a positive correlation, butfor the surface soil moisture vegetal cover is negativelylinked. However, the Rgl : LAI interaction term showed apositive correlation with surface soil moisture and a nega-tive one with subsurface moisture. This again implies thatthe omission of this interaction would exaggerate the ef-fect of vegetal cover in OAT predictions. Also, a directrelation between albedo and surface soil moisture is seen,and a higher LAI conserves surface moisture. However,surface roughness (z0) depletes and Rsmin restores the sur-face moisture in the scheme. Generally, for a growing crop,both Rsmin and z0 increase [15], so the net effect would beless dramatic than for either parameter considered individu-ally. However, if the fractional vegetal cover also increases,the tendency would be to reduce the surface moisture morerapidly than it could be made up by the restoring capacityof other parameters.
4.3. Surface fluxes (SHF and LHF)
To get a base comparison with other observational andsimulation studies, we compare our results with JN90. In adetailed sensitivity (OAT-type) study, JN90 obtained rela-tive variations of surface latent heat flux (LHF) for differentinput parameters ranging over a −90% to +90% deviationof the base value considered. Their analysis resulted in thefollowing order of significance of the parameters: subsur-face soil moisture, vegetal cover, LAI, Rsmin, and z0 forthe 0 to −90% range and subsurface soil moisture, vegetalcover, Rsmin, LAI, and z0 for the 0 to +90% deviationfrom base value. In our study, considering main effectsalone (interactions implicitly considered) (figure 2), the or-der of importance is surface albedo, Rgl, Rsmin, LAI, veg-etal cover, z0, surface soil moisture, and subsurface soilmoisture, and ground temperature. The Pareto analysisoutcome (figure 3), which considers interactions explicitly,brings out the following order: surface albedo, interactionbetween Rgl and LAI, Rgl, Rsmin, LAI, z0, vegetal cover,surface soil moisture, surface temperature, and subsurfacesoil moisture. There is a remarkable difference in the orderof importance between a study that considers interactionsand a simple OAT experiment that does not.
The difference between this study and the OAT-typeJN90 can be attributed to (1) the sensitivity approach used,and/or (2) the driving PBL model. To examine this, weperformed an OAT-type experiment (as employed by JN90)for LHF. Table 2 lists the OAT quartile ranges for the in-puts. The 1300 LST predictions of LHF from differentruns were compiled and compared with the reference sim-ulation (FIFE observations as input). The order of signifi-
Table 2Parameter ranges for the OAT experiment for LHF predictions.
Input Levels
parameter I II III IV
RGL (W m−2) 60 70 80 90
Rsmin (s m−1) 90 120 150 180
LAI 0.90 1.50 2.00 2.50
VEG 0.10 0.30 0.60 0.90
SWG (m3 m−3) 0.14 0.22 0.32 0.40
SSWG (m3 m−3) 0.16 0.22 0.30 0.35
z0 (m) 0.13 0.19 0.25 0.30
Tg (K) 290 293 297 300
ALB 0.15 0.22 0.27 0.30
Figure 4. An OAT outcome for LHF (W/m2) predictions from the model.“Level” indicates the parameter quartile settings shown in table 2.
cance (figure 4) is subsurface soil moisture, vegetal cover,Rsmin, LAI, and surface albedo. This is quite consistentwith JN90 results. It is therefore clear that the interaction-explicit FF approach alone is responsible for the differencesin the order of significance.
Arguments similar to that presented earlier in this paperand by Alpert et al. [3] highlight the exaggerated impactcaused by OAT variation. Thus, the factorial-based Paretoplot results from the present study should be more accept-able than the JN90 conclusions. Additionally, the “magni-tude” of the effect could be another reason for the alteredorder of the significant variables. Consider the effect ofsurface albedo and surface roughness (z0) (two physicalparameters that are assumed as fairly constant for a givensurface condition) on LHF (figure 3). The value of the ef-fect of ALB (−279) is approximately twice as much as thatof z0 (−117). Translated for the OAT framework, this im-plies that for a consistent effect the range over which albedocould be varied should be half of that for z0; conversely, ifthe range for albedo is set at 40%, then for consistency inperturbation z0 should vary by about 80%. However, this

D.S. Niyogi et al. / A dynamic statistical experiment for atmospheric interactions 315
is not practical because it could involve more speculationregarding the inputs for the sensitivity study than realiza-tion in terms of the interpretation of the output. Hence thepresent methodology and the outcome are probably moreuniversal in nature than the OAT-type studies like JN90.Any study of this nature with an objective of viewing rel-ative variations could benefit more from using the FF ap-proach paired with Pareto plots than from an OAT analysis.
In principle, one would expect the latent heat flux (LHF)to depend primarily on the vegetation. It was therefore in-teresting to see that for LHF, the two vegetation-relatedparameters (LAI and vegetal cover) ranked 5th and 7th re-spectively in their relative significance for LHF. The ra-diation physical parameters such as albedo were the mostsignificant ones. Similarly for sensible heat flux (SHF),the Rgl : LAI interaction and vegetation cover were themost significant parameters, with vegetal cover showinga positive effect while the subsurface soil moisture andRgl : LAI interaction indicated negative effects. Also, itis the LAI rather than the vegetal cover that is directly re-lated to the evaporative flux, that is, for an increasing LAI,the LHF increases while SHF decreases (opposite to theeffect of increasing vegetal cover) for the model. Increas-ing surface roughness decreases both SHF and LHF; theeffect is more dominant for LHF than SHF. Stomatal re-sistance acts in an opposite sense to LAI, but similar tosurface soil moisture in altering the surface heat fluxes.The ground temperature (Tg) and LHF effects are directlyrelated, while for lower Tg higher SHF values are obtained.The Rgl : LAI interaction is one of the most important as-pects deciding the Bowen ratio for the system.
We reviewed these and associated features using fieldobservations from HAPEX-MOBILHY [4] referred toin JN90. Figures 15–17 of JN90 (cases 1–3) show a directrelation between vegetal cover and SHF. For a vegetal coveraround 0.2, the maximum SHF is 100–150 W m−2, whilefor a vegetal cover value around 0.5, it is ∼ 200 W m−2.This should help clear up a possible misconception thathigher vegetal cover alone yields lower sensible heat fluxand enhanced LHF, within the energy transfer process. Theinteractions (particularly for soil moisture and possibly leaftemperature) and their nonlinear propagation in the systemrestrict us from having a straightforward “rule of thumb”of this nature. Though not presented numerically, it canbe inferred that for the same fractional vegetal cover incases 2 and 3 (= 0.2), the maximum SHF for a lower sub-surface moisture is about 25 W m−2 more than that for ahigher subsurface moisture. In another case of JN90, sub-surface moisture is constant, while the fractional vegetalcover changes from 0.5 to 0.7. Our earlier analysis wouldlead us to expect higher SHF values for the VEG = 0.7case. However, the observations indicate a decrease byabout 100 W m−2. This is a clear indication of the domi-nance of the LAI : Rgl interaction over the fractional veg-etal cover as a main effect. The value of the effects fromthe Pareto plot (figure 3) obtained in this study indicatethat the Rgl : LAI interaction (−88.3) is about 1.4 times
more pronounced than the vegetal cover main effect (67.4).Hence, even though the fractional vegetal cover value hasbeen raised from 0.5 to 0.7, an increase in LAI from 1.0 to2.0 decreases the maximum SHF.
4.4. Temperature and humidity (Ta, Tg, Qs, and Qa)
Predicting and understanding the link between tempera-ture, humidity, and soil moisture variation is another chal-lenging aspect for weather forecasting (cf. [5,12] withNP89 scheme).
Figures 2 and 3 show that vegetation is the key fea-ture for all these output parameters (Tg, Ta, Qs, Qa, SWG,and SSWG). Higher vegetal cover, as a main effect alone,yields higher ground temperature (Tg) while the interac-tion between Rgl : LAI and the main effect SSWG bothlower Tg. This is consistent with the SHF results discussedearlier. In addition, we found that Rsmin is positively re-lated while albedo is negatively related to Tg.
For Tg, the order obtained was fractional vegetal cover,Rgl : LAI interaction, subsurface soil moisture, Rsmin, andsurface albedo. While an increase in VEG causes an in-crease in Tg, increased LAI causes decreased Tg; this op-posing behavior between LAI and vegetal cover was alsoseen for both the surface energy fluxes. The Rgl : surfacesoil moisture interaction term is also important, implyingthat the interaction between transpiration and surface soilmoisture increases Tg. For air temperature (Ta), the orderwas fractional vegetal cover, deep soil moisture, interactionbetween Rgl and LAI, deep soil moisture, surface albedo,and Tg.
For the humidities (both near surface and air), the effectof vegetal cover is strong and negative. Deep soil mois-ture availability is positively but less strongly linked. Thevegetation present seems to have an effect similar to thatof Rsmin, which is also negatively related to the humid-ity. Low Rsmin would result in higher diffusion throughvegetation, yielding higher humidities [15]. For higher veg-etal cover, the effect is equivalent to retaining moisture andkeeping it away from the atmosphere. Thus, the moisture-retaining capacity of vegetal cover appears to have an over-riding effect compared to soil moisture for predicting hu-midity.
5. Higher resolution experiment (resolution V design)
Through the screening experiment, we were able to as-sess the performance of the land-surface scheme (NP89)within the NCSU PBL model (columnar version) by simu-lating several features observed in the field. Resolution III(that includes all main effects and some principal two-wayinteractions) outcomes are useful and informative. How-ever, it is also of interest to use a resolution V design, inwhich all interactions and all main effects are explicit. Ad-ditionally, this would help us gather information that maynot have been resolved explicitly in the resolution III de-sign.

316 D.S. Niyogi et al. / A dynamic statistical experiment for atmospheric interactions
Figure 5. Main-effect and Pareto plots for PBL height (resolution V experiment).
Table 3Parameters and design chosen for the higher resolution (resolution V)
experiment.
Predicted output Initial input parameter Designparameter
PBL height VEG, SSWG, ALB, itg FF0416
Tg VEG, SSWG, Rsmin, ALB FF0416
SWG VEG, SSWG FF0204
For our resolution V design, we considered three sampleoutput parameters: PBL height, ground temperature (Tg),and surface soil moisture (SWG). We used our resolutionIII results to choose a subset of principal input parametersfor this experiment (table 3). The specific designs utilizedfor this high resolution analysis are FF0416 (for PBL heightand Tg) and FF0204 (for SWG) (see [14] for design details).The higher (+) and lower (−) values assigned to the pa-rameters are still the same as in table 1. We present andanalyze main-effect and Pareto plots, and draw attention tosome key interactions and model features.
5.1. PBL height
Figure 5 shows the main-effect and Pareto plots forthe output parameter PBL height. The main-effect out-come shows a significant variation in their mean valuesand confirms that all four of the input parameters are im-portant, supporting the hypothesis that the four parameterschosen are appropriate for the analysis. From the plots,larger vegetal cover resulted in a higher PBL height, while
higher deep soil moisture (SSWG) availability leads to alower PBL height. The resolution III experiment indicatedthe moisture retentive tendency of vegetal cover (figures 2and 3). Also, lower albedo causes greater heating whichin turn increases PBL heights, while warmer initial groundtemperature (itg) in the model tends to predict relativelylower PBL heights. This ground temperature related resultis somewhat surprising, but could be due to the increase inlatent heat flux for warmer initial temperatures and conse-quent decrease in sensible heat flux.
The Pareto plot (figure 5) confirms the outcomes fromthe main-effect plot, giving the following order of pri-ority to the input parameters as main effects: vegetalcover (VEG), subsurface soil moisture (SSWG), initialground temperature (itg), and surface albedo (ALB). TheVEG main effect is about 2.5 times higher than thatfor ALB. Also, the VEG : SSWG and VEG : itg interac-tion terms are quite prominent. Note that the importanceof these interactions can also be deduced from the resolu-tion III experiment. Further, it can be seen that none ofthe higher interaction terms, such as the VEG : SSWG : itg(vegetal cover : subsurface soil moisture : initial ground tem-perature) triple interaction, are significant, which confirmsan implicit assumption we had to make when accepting theresolution III design. Thus, the resolution III and resolu-tion V experiments are statistically appropriate in the caseof PBL height, and the conclusions from both supplementthe information obtained about this output parameter.
Both the experiments show the importance of vegeta-tion in determining the PBL structure. However, using acomprehensive vegetation scheme in analysis is computa-

D.S. Niyogi et al. / A dynamic statistical experiment for atmospheric interactions 317
Figure 6. Two-factor interaction plots for (a) deep soil moisture (m3/m3) and vegetal cover interaction, and (b) initial ground temperature (K) andvegetal cover interaction, for PBL height prediction. (Confidence level is ∼ 90% based on pseudo standard error.)
tionally expensive. Therefore, we need an answer to thefollowing question: When can we expect the omission ofvegetation and soil moisture processes to be very signifi-cant? Obviously, we can say that it is not significant whenthe vegetation itself is insignificant. Figure 6 deals with thisaspect, showing how the two-factor interaction between thePBL height changes with (a) variation in deep soil mois-ture (SSWG) and vegetal cover (VEG), and (b) variation ininitial ground temperature (itg) and VEG. The PBL heightoutcome increases with vegetal cover. This increase is in-tense for drier soil moisture cases as against for cases withhigher soil moisture availability. Also it can be inferred,when the vegetal cover is lower, the changes in soil mois-ture alone do not affect the PBL height much. It is alsointeresting to note that when SSWG is high, even a signifi-cant change in vegetal cover does not really seem to affectthe simulation of the PBL depth. The two-factor interac-tion plot for vegetal cover and initial ground temperatureinteraction (figure 6b) confirms the earlier observation thatfor lower initial ground temperatures, the PBL heights gen-erated are consistently higher (for the scheme and the dataconsidered).
Figure 7 shows the half-normal, normal, and active-contrast plots obtained for the output parameter PBL height.These plots are used to confirm (i) the analysis outcomesfrom earlier methods (such as main-effect or Pareto analy-sis), (ii) there are no “outliers” in the dataset, and (iii) allfour of the input parameters considered are statistically sig-nificant. To test representatives of the four parameters ofthe entire system (for the output parameter PBL height), weutilized the analysis of variance (ANOVA) approach [6]
(figure 8). The good fit shown in figure 8 confirms therepresentativeness. However, there is a “fanning” in thescatter plots for residuals (observed minus fitted) indicatingsome nonlinear interactions (Pn1 type) that are not resolvedin the present analysis. Figure 8 confirms our hypothe-sis that the data set generated from the limited parametersis representative of the entire model (for the output para-meter PBL height), so conclusions based on this limiteddata should be statistically and physically relevant for theNP89 scheme (see [14] for details).
5.2. Ground temperature
For Tg, figure 9 shows the main-effect, Pareto, two-factor interaction, half-normal, normal, and active-contrast,and two-factor interaction plots for the high-resolutionanalysis. The main-effect plot shows that deep soil mois-ture (SSWG) is the principal main effect, but minimumstomatal resistance (Rsmin) and surface albedo (ALB) alsohave significant slopes. The Pareto plot reveals that theSSWG : Rsmin interaction is also important. The active-contrast plot supports this conclusion, and confirms thatthe VEG : Rsmin interaction may also be significant. Thenormal and half-normal plots are continuous, without anybreak or abnormality in the center, thus satisfying the datarepresentativeness condition. (The two-factor interactionplot is discussed in depth in the paragraph below.) Thediagnostic plots (not shown) for a reduced model from thecleaned dataset verify the representativeness of both thehigh resolution parameters chosen and the data considered.

318 D.S. Niyogi et al. / A dynamic statistical experiment for atmospheric interactions
Figu
re7.
Hal
f-no
rmal
,no
rmal
,an
dac
tive
cont
rast
plot
sfo
rPB
Lhe
ight
(res
olut
ion
Vex
peri
men
t).

D.S. Niyogi et al. / A dynamic statistical experiment for atmospheric interactions 319
Figu
re8.
Dia
gnos
ticpl
ots
for
chec
king
the
repr
esen
tativ
enes
sof
the
set
offo
urin
put
para
met
ers
chos
enfr
omth
een
tire
mod
elto
repr
esen
tPB
Lhe
ight
outc
ome.

320 D.S. Niyogi et al. / A dynamic statistical experiment for atmospheric interactions
Figu
re9.
Gra
phic
alan
alys
esfr
omgr
ound
tem
pera
ture
data
set
(res
olut
ion
Vex
peri
men
t).

D.S. Niyogi et al. / A dynamic statistical experiment for atmospheric interactions 321
Figure 10. Main-effect plot for surface soil moisture (resolution V exper-iment).
The two-factor interaction plot for SSWG and Rsmin(figure 9) provides additional information. Previous studies(e.g., [2,15,16,18]) have demonstrated that vegetation mod-ules are sensitive to Rsmin specification for PBL and hydro-logical processes. The figure 9 two-factor interaction plotshows that the sensitivity of Rsmin specification increaseswith the deep soil moisture availability. Also, Rsmin spec-ification seems to be affecting the bare soil temperaturethrough an interaction. The resulting change in temper-ature could be due to the net surface (soil and vegetationcombined) temperature representation in NP89. Although alowered SSWG reduces the predicted Tg, the transpirationrate could be more significant than the SSWG change for ashort period. The association of the inputs Tg and Rsminhas attached the interaction term within the stomatal resis-tance estimation to the output parameter Tg. Some triple-order interactions are also seen (figure 9 active contrastplot), such as VEG : SSWG : Rsmin, but they essentiallyhighlight the importance of the Rsmin–Tg association.
5.3. Soil moisture
Figure 10 shows the main-effect plot for surface soilmoisture. The two factors considered result in only a main-effect plot and no Pareto plot. It suggests that higher deepsoil moisture (SSWG) tends to give higher surface mois-ture (SWG) values, and SWG could decrease due to seepagewith the growth in vegetal cover. The slopes in the main-effect plot suggest that SSWG is more significant than VEGfor determining surface soil moisture in the model. Vege-
tation could result in using up the water in the top layer,which is then replenished by the deep soil moisture. Theresolution V result is in congruence with that from the res-olution III design.
6. Conclusions
We have demonstrated the application of a robustmethodology for the analysis of atmospheric data. TheFF-based approach is recommended for model sensitiv-ity and validation studies. With the Noilhan and Plantonscheme [19] and the NCSU 1-D PBL model [1], we havedemonstrated that the approach is particularly useful fordealing with a dynamically interactive system such as theatmosphere.
For the model and the NP89 scheme employed, many in-teresting features are apparent. We found that the term Rgl(radiation limit for initiating photosynthesis) is an importantinteraction term. It was also seen that subsurface soil mois-ture needs to be specified quite accurately, as errors in itsinitial value do not smooth out. Temperature and vegetationgenerally have opposing effects on the surface and subsur-face moisture. With regard to the heat flux output parame-ters, the “ranking” (in order of significance) of the variousinput parameters in this study, which considered interac-tions, was different from that for JN90 [11], which assumedindependence of events or an OAT approach. Radiation-related physical parameters such as albedo were found tobe the most important input parameters for latent heat flux,while for sensible heat flux the vegetation-related parame-ters were important. These features are supported by ob-servations from HAPEX-MOBILHY.
For the vegetation-PBL interaction, subsurface soilmoisture and vegetation cover are identified as crucial inputparameters, with albedo and Rgl being important radiationparameters. For temperature and humidity predictions, veg-etation is the key feature. However, studies that use surfaceparameters in a sequential assimilation method [12] need toconsider interaction as well, as highlighted by this study.For most of the output parameters, LAI and vegetal covershowed opposing tendencies. LAI seems to have a more di-rect impact on the water vapor flux than does vegetal coveralone.
We conducted higher resolution designs to complementthe information from the resolution III design. From thesewe concluded that for high subsurface soil moisture avail-ability, changes in vegetal cover may not significantly af-fect the simulations. Two related hypotheses are suggested:(1) results from earlier sensitivity studies may be biased,and (2) it is possible that the uncertainties in the input para-meters might “correct” each other, with the net effect beingmore acceptable than the individual outcomes (see [18]).Overall, we found that the main effect and the interactionterm tend to produce opposite effects on the outcome forthe vegetative scheme considered.
We found the use of graphical analyses, such as Pareto,main-effect, two-factor interaction, active contrast, and di-

322 D.S. Niyogi et al. / A dynamic statistical experiment for atmospheric interactions
agnostic plots, to be beneficial for interpreting the at-mospheric processes and recommend their use. We alsoshowed that detailed statistical tests are required (even ifthey would provide seemingly redundant information) tocheck data and validate conclusions.
In summary, this study emphasized the role of interac-tions in atmospheric processes and suggested that both themain effects and the interactions should be considered whenevaluating atmospheric data. The data could be from eithersimulations or actual observations. However, this bringsus to some fundamental questions: Have we been able tosuccessfully tackle these interactions in our present para-meterizations? Further, how are interactions different fromthe “feedback” mechanisms? This study suggests that aprognostic feedback process alone does not depict interac-tions. Iterative solutions, empirical equations, and budgetapproach help reduce the errors in an OAT analysis. Butwhen we are now developing models or particularly non-budget equations for physiological-hydrological and climatechange interactions, we need to explicitly consider an inter-action term in the model to realistically simulate the phe-nomenon.
Acknowledgements
The authors would like to gratefully acknowledge thefinancial support of this study in part by the Division of In-ternational Programs (INT-93-00751) and the AtmosphericSciences Division (ATM-92-12636) of the National ScienceFoundation. Many interesting interactions with Drs. PerryHalaand and Mike O’Connel of the Becton Dickinson Re-search Center, and Dr. J.C. Lu of the Statistics Departmentof the North Carolina State University, helped in formulat-ing the experimental design. We also thank Prof. A. Prabhu,Center for Atmospheric Sciences (CAS), Indian Institute ofScience, Bangalore, and Prof. U.C. Mohanty, CAS, IndianInstitute of Technology, Delhi, for their review and com-ments and Ms. Jeanne Eichenger for her editorial assitance.
The statistical analysis was performed using S-PLUSand numerical simulations were performed on a Cray T-90through the North Carolina Supercomputing Center.
References
[1] K. Alapaty, J. Pleim, S. Raman, D. Niyogi and D. Byun, J. Appl.Meteor. 36 (1997) 214.
[2] K. Alapaty, S. Raman and D. Niyogi, Uncertainty in the specifica-tion of surface characteristics: A study of prediction errors in theboundary layer, Bound. Lay. Meteor. 82 (1997) 473.
[3] P. Alpert, M. Tsidulko and U. Stein, J. Atmosph. Sci. 52 (1995) 597.[4] J. Andre, B. Goutorbe and A. Perrier, Bull. Amer. Meteor. Soc. 67
(1986) 138.[5] F. Boultier, J. Mahfouf and J. Noilhan, J. Appl. Meteor. 32 (1993)
1335.[6] G. Box, W. Hunter and J. Hunter, Statistics for Experimenters: An
Introduction to Design, Data Analysis, and Model Building (Wiley,New York, 1978).
[7] J. Dorman and P. Sellers, J. Appl. Meteor. 28 (1989) 833.
[8] P.D. Haaland, Experimental Design in Biotechnology (MarcelDekker, New York, 1989).
[9] P. Haaland and M. O’Connel, Technometrics 37 (1995) 82.[10] T. Holt and S. Raman, Rev. Geophys. 26 (1988) 761.[11] B. Jacquemin and J. Noilhan, Bound. Lay. Meteor. 52 (1990) 93.[12] J. Mahfouf, J. Appl. Meteor. 30 (1991) 1534.[13] G.L. Mellor and T. Yamada, J. Atmosph. Sci. 31 (1974) 1791.[14] D.S. Niyogi, Dynamic interactions in soil–vegetation–atmosphere-
transfer processes, M.S. thesis, North Carolina State University,Raleigh (1997).
[15] D.S. Niyogi and S. Raman, J. Appl. Meteor. 36 (1997) 903.[16] D. Niyogi, S. Raman and K. Alapaty, Interaction between plane-
tary boundary layer and vegetation: philosophy to a paradigm, in:22nd Conf. on Fluid Mech. and Fluid Power (Indian Inst. of Tech.,Madras, 1975).
[17] D.S. Niyogi, S. Raman and K. Alapaty, Towards a dynamic para-meterization of vegetation in PBL models, in: 12th Conference onBiometeorology and Aerobiology, 27 January–2 February, Atlanta(Amer. Meteor. Soc., Boston, 1996).
[18] D. Niyogi, S. Raman and K. Alapaty, Uncertainty in specificationof surface characteristics, Part 2: Hierarchy of interaction – explicitstatistical analysis, Bound. Lay. Meteor. (1997) (submitted).
[19] J. Noilhan and S. Planton, Mon. Wea. Rev. 117 (1989) 536.[20] P. Sellers and F. Hall, J. Geophys. Res. 97(D17) (1989) 19091.[21] U. Stein and P. Alpert, J. Atmosph. Sci. 50 (1993) 2107.