A Dynamic Approach To Sensor Network Deployment For · PDF fileTarget Detection In...
79
A Dynamic Approach To Sensor Network Deployment For Target Detection In Unstructured, Expanding Search Areas by Julio Vilela A thesis submitted in conformity with the requirements for the degree of Master of Applied Science Mechanical and Industrial Engineering University of Toronto © Copyright by Julio Vilela 2015
Transcript of A Dynamic Approach To Sensor Network Deployment For · PDF fileTarget Detection In...

A Dynamic Approach To Sensor Network Deployment For Target Detection In Unstructured, Expanding Search
Areas
by
Julio Vilela
A thesis submitted in conformity with the requirements for the degree of Master of Applied Science
Mechanical and Industrial Engineering University of Toronto
© Copyright by Julio Vilela 2015

ii
A Dynamic Approach To Sensor Network Deployment For Target
Detection In Unstructured, Expanding Search Areas
Julio Vilela
Master of Applied Science
Mechanical and Industrial Engineering
University of Toronto
2015
Abstract
This thesis presents a novel dynamic deployment strategy for a network of static sensors using a
probability model of target motion to detect un-trackable targets. The focus herein is on the
dynamic and optimal deployment of the static sensor network. The network nodes are
determined at regular time intervals throughout the search based on available real-time
information. Optimality is achieved based on maximizing the probability of finding the target
through the use of the novel iso-cumulative curve. It is adaptable to terrain variation, presence of
obstacles, and can be re-calculated whenever target information, like a clue, is found to re-locate
search effort. Simulations showed that the proposed methodology increases the success rate of
target interception and reduces the mean detection time compared to uniform coverage-based
approaches. In addition, the methodology was applied to a wilderness search and rescue scenario,
where static sensors assisted mobile sensors in intercepting a target.

iii
Acknowledgments
The successful completion of this thesis was a result of many hours of doodling, reflection,
programming, dedication to research, and most importantly, the discovery of oneself. However,
this work would not have been accomplished without the crucial help of many individuals, to
whom I would like to thank.
First and foremost, I would like to thank my supervisors, Prof. Beno Benhabib and Prof. Goldie
Nejat. Prof. Benhabib was a continuous presence, source of inspiration, as well as a source of
feedback throughout the last two years. He was there “to protect me from myself”. Without his
ongoing questioning and critiquing of my ideas, none of this work would have been a reality. He
taught me what research is about – an ongoing battle with oneself to obtain answers nobody else
has. The capability to develop a concept, explain it clearly, and validating, is an acquired skill
that I have started to master, and will be taking on beyond my academic life. Prof. Benhabib,
with his joyful persona and rigorous work ethic, has inspired me to become a better researcher. I
tried to enjoy every moment along the way, and he made that possible. I enjoyed doing my
masters. I would also like to thank Prof. Nejat, who also supervised my work and provided
immense feedback while I developed my methodology and while I did paper revisions. Writing
papers with Prof. Nejat is like sculpting with sand: it takes a while to get it done, but the final
result is aesthetically pleasing. I wish both my supervisors great success to their already very
successful careers, and I sincerely hope that future graduate students can experience the same
support and help that I received from them. It was a privilege to have them as my supervisors.
I am eternally grateful to Ashish Macwan, who took his time to explain to me his research. Some
of my work complements his, and without his dedication and answers to my endless questions,
none of this would have been possible. It was a pleasure working alongside him, and assist him
with his work. He was an integral part to my adaptation to graduate school, and I wish him all
the best in his career.
My experience in graduate school was highly influenced by other graduate students, especially
the ones at The Computer Integrated Manufacturing Laboratory at the University of Toronto.
They provided a lively and friendly atmosphere to conduct research, as well as a joyful
playground for discussions and socializing. Many thanks to Evgeny Nuger, Mario Luces,

iv
Bejamin Corcoran, Arta Alagheband, Masih Mahmoodi, Justin Kim, Kerry Zhou, and Mengzhe
Zou. I wish you all the best in your careers, whether they are in academia or in industry. I would
also like to extend my gratitude to Alex Hong, Wey-Hao Chang, Veronica Marin and Pieter
Luitjens from the Autonomous Systems and Biomechatronics Laboratory at the University of
Toronto. They made me laugh. A lot. Thank you.
I would also like to give special thanks to summer students Raymond Ly and Lucas Sardinha De
Arruda. They provided vital help to my research and offloaded a lot of computer programming
tasks, as well as literature review hours, from my shoulders. I am eternally grateful to both of
them, and I wish you both all the best.
I would like to thank Julie Roy, my partner in crime and soulmate. You have been there to
support me and laugh with me. Graduate school, and life, would have never been this joyful and
pleasant without you. Thank you for being there for me.
Last but not least, I would like to thank my family: my sister Joana, my mother Maria de Fátima,
and my father Júlio Jose. You provided continuous moral support throughout my entire life, and
especially while I completed my masters. Today, I am a better person thanks to you. You have
taught me what life is about, and that honesty, hard work, and perseveration, are essential
ingredients to conquer dreams. I know you will always be there for me. I would have never
achieved all my goals without your support. You might live in another city, but your presence is
constant in my heart. Special thanks as well to Joly for her soft furriness and endless positive
energy. Obrigado por tudo.

v

vi
Table of Contents
Acknowledgments ................................................................................................................................ iii
Table of Contents .................................................................................................................................. vi
List of Figures ...................................................................................................................................... vii
Nomenclature and Acronyms ............................................................................................................... ix
Introduction....................................................................................................................................... 1
1.1 Thesis Objectives ...................................................................................................................... 3
1.2 Thesis Organization................................................................................................................... 4
Literature Review ............................................................................................................................. 5
2.1 Static-Deployment Strategies .................................................................................................... 6
2.1.1 Probabilistic .................................................................................................................. 6
2.1.2 Deterministic................................................................................................................. 7
2.1.3 Applications .................................................................................................................. 9
2.2 Dynamic-Deployment Strategies ............................................................................................ 12
2.3 Mobile-Target Behavior .......................................................................................................... 15
Static Sensor Network Deployment ................................................................................................ 17
3.1 Problem Statement .................................................................................................................. 18
3.1.1 The untrackable target ................................................................................................ 18
3.1.2 The static sensors ........................................................................................................ 19
3.1.3 The environment ......................................................................................................... 19
3.2 Methodology ........................................................................................................................... 21
3.2.1 Deployment Planning – Stage I .................................................................................. 22
3.2.2 Deployment Execution – Stage II ............................................................................... 37
3.2.3 Redeployment – Stage III ........................................................................................... 38
3.2.4 Determining the search parameters ............................................................................ 40
3.3 Hybrid deployment strategy .................................................................................................... 42
Performance Studies ....................................................................................................................... 47
4.1 Comparative study .................................................................................................................. 47
4.1.1 Simulated Target ......................................................................................................... 48
4.1.2 Simulated Experiments ............................................................................................... 49
4.2 WiSAR Case Study ................................................................................................................. 54
Conclusions and Recommendations ............................................................................................... 60
References............................................................................................................................................ 63

vii
List of Figures
Fig. 1. Illustration of the iso-cumulative curves. (a) A target PDF along a ray; (b) Iso-probability
curves, at t; and (c) Propagated iso-probability curves, at t+Δt. .................................................. 16
Fig. 2. (a) Google Earth terrain image of Mount Robson Provincial Park, BC, Canada; (b)
Simulated 3D terrain in TerreSculptorTM based on height map data from (a). ............................. 20
Fig. 3. Summary of proposed methodology.................................................................................. 21
Fig. 4. Overview of the deployment planning – Stage I. .............................................................. 23
Fig. 5. Example of a Target CPDF. .............................................................................................. 25
Fig. 6. Cumulative probability of success curves at multiple time instances, t* < t < Tmax. ......... 26
Fig. 7. (a) A target NCPDF along a ray; (b) Iso-cumulative curve, at t*. ..................................... 27
Fig. 8. Outline of iso-cumulative curve generation at deployment time t*. .................................. 27
Fig. 9. (a) Terrain with 4 rays; (b) sNCPDF plots for Tmax = 2.5 h for Rays 1,2 and 3; (c) Several
sCPDF propagations and the sNCPDF plot for Ray 4 in (a). ....................................................... 29
Fig. 10. The iso-cumulative curve at t*=1800 s, effective for the time interval t* < t < Tmax........ 30
Fig. 11. (a) Iso-cumulative curve propagation with obstacle presence. ....................................... 31
Fig. 12. Example of three iso-cumulative curves. ........................................................................ 33
Fig. 13. CPSO algorithm showing the locations of the static sensors for different stages of the
optimization process; (a) N = 1; (b) N = 20; (c) N = 500. ............................................................ 36
Fig. 14. Example of dynamic deployment of static sensors with three propagations of the iso-
cumulative curve, for tmin = 1800 s, tmax = 3000 s, and Δtint = 600 s. ............................................ 37
Fig. 15. An example of network redeployment due to clue find. ................................................. 39
Fig. 16. Hybrid deployment strategy. ........................................................................................... 42

viii
Fig. 17. (a) Originally planned path with no static sensors at time t; (b) Adjusted path with static
sensor avoidance at time t. ............................................................................................................ 44
Fig. 18. State of an example search at t*=2400 s. ......................................................................... 46
Fig. 19. (a) PDF of target travel direction change; (b) Examples of simulated target paths. ....... 48
Fig. 20. Optimal deployment networks; (a) NCPDF vs (b) VFA. ................................................ 49
Fig. 21. (a) Simulated target interception at t = 10382 s with 10 m sensing range; (b) Simulated
target interception at t = 5763 s with 40 m sensing range. ........................................................... 50
Fig. 22. (a) Simulated target without interception with 10 m sensing range; (b) Simulated target
intersection at t = 9155 s with 20 m sensing range. ...................................................................... 50
Fig. 23. (a) Simulated target interception using NCPDF at t = 5914 s; (b) Simulation with no
target interception using VFA. ...................................................................................................... 51
Fig. 24. Improvement of NCPDF over VFA for different search times and sensor detection sizes;
(a) Improvement in success Rate; (b) Reduction in mean detection time. ................................... 52
Fig. 25. Comparing success rate and mean detection time for different search time and varying
sensor detection radii. ................................................................................................................... 53
Fig. 26. Static sensor deployment configuration for the search. ................................................... 55
Fig. 27. Initial state of the search at 1800 s. ................................................................................. 56
Fig. 28. State of the search at 3724 s (clue located at ‘’). ......................................................... 57
Fig. 29. State of the search at 5573 s. ........................................................................................... 58
Fig. 30. Target interception by a mobile sensor at 5543 s. ........................................................... 59

ix
Nomenclature and Acronyms
Latin letters
a First optimal weight parameter
ai First model parameter in the logistic function
a1 Learning factor for local optimal position
a2 Learning factor for global optimal position
b Second optimal weight parameter
bi Second model parameter in the logistic function
cpj,i ith Control point with time j
dclue Distance along a straight line from the clue drop to the LKP
di Distance to a neighboring particle
dj Nearest neighbor distance of a particle
dmax Maximum distance traced by a target along a ray
D100* Location of the iso-probability curve with cumulative probability value of 1
Li Third model parameter in the logistic function
M Number of control points used for interpolation
nt Number of deployment instances
nsc Number of static sensors per curve
N Iteration number
Nnei Number of neighboring particles
Nprop Number of propagations of the CPDF
Nss Number of static sensors available at the start of a search
Nund Number of undeployed static sensors before redeployment
pi ith particle considered for the local optimal position.
pj jth particle considered for the global optimal position.
pnet Global optimal position of a static sensor
pss Local optimal position of static sensor

x
r Position of a target along a ray
rmax Optimal location along a ray
rran1 Random variable for local optimal position
rsens Random variable for global optimal position
t Time instance during a search
ti Time instance of a propagated CPDF
t* Deployment time during a search
tmin Minimum allowed deployment time during a search
tmax Maximum allowed deployment time during a search
Tclue Time of clue find belonging to the target
Tclue_drop Time of the clue drop by the target
Tclue_drop Estimated time of the clue drop by the target
Tmax Search time
T*max Search time for redeployment
THS Head start time
U Uniform distribution
vj Cumulative probability value
vmax Maximum speed of the target
vss Velocity of a particle in the PSO/CPSO algorithm
w Intertia factor
wi NCPDF weight
wini Initial NCPDF weight
wini
Normalized initial NCPDF weight
xss Position of a particle in the PSO/CPSO algorithm
X Random variable representing position of a target along a ray

xi
Greek letters
Δtapp Time intervals between CPDF propagations
Δtint Time interval between static sensor deployment
µν Mean of the nominal target speed PDF
σν Standard deviation of the nominal target speed PDF
Abbreviations
CG Computational Geometry
CPDF Cumulative Probability Density Function
CPSO Constrained Particle Swarm Optimization
GA Genetic Algorithm
GB Gigabyte
GHz Gigahertz
LKP Last Known Position
NCPDF Normalized Cumulative Probability Density Function
OF Objective Function
PDF Probability Density Function
PSO Particle Swarm Optimization
RAM Random Access Memory
UAV Unmanned Aerial Vehicle
UASN Underwater Acoustics Sensor Network
USAR Urban Search And Rescue
UWSN Underwater Sensor Network
VD Voronoi Diagram
VFA Virtual Force Algorithm
WiSAR Wilderness Search And Rescue
WSN Wireless Sensor Network


1
Introduction
Recent development in hardware and software technologies has made the use of sensor networks
more popular in our lives. From mobile phones connecting multiple users, to motion detectors in
the gaming industry, sensors can be found in a very broad range of applications. Various works
have introduced sensor networks to assist humans in various tasks, including environmental
monitoring, border patrol, and target interception and tracking. Within robotics, examples can
also be found in urban search and rescue (USAR) and wilderness search and rescue (WiSAR).
These examples have shown that the presence of small sensing devices with low power
consumption can be of valuable assistance in reducing the human involvement in time-
consuming, and sometimes dangerous tasks.
However, one particular area that has lacked major development is that of the detection of
moving targets, assisted by sensor networks, in unbounded and possibly unstructured
environments. This is a scenario commonly found in WiSAR, where the main goal is to locate a
lost person in a remote area, far from urban settlements. In this case, locating refers to
determining the exact location of the target. In real life, this could be the case of a lost hiker in a
mountain, an elderly who deviated from a trail in a national park, or a child who escaped the
boundaries of a camping ground. Locating a moving target that is untrackable is not a trivial
problem to solve since the area where the target may be found (i.e. the search space), can grow
with time and can be in theory, infinitely large. One can never know in advance the exact motion
of the target, including its direction of travel, how often he/she changes direction, nor the rate at
which the target propagates. As such, a judicious distribution of search efforts must be
strategized to assist with the search. Such deployment should obey a generic motion model of
target motion in order to be resource-efficient and maximize the chances for target interception.
Moving search agents, in the form of humans, robots, or human powered vehicles can be of great
assistance in WiSAR, but they are constrained by their limited availably and often complicated
deployment logistics. Moreover, many WiSAR missions result in long hours of continuous
search. They can become physically demanding and impose psychological stress on human
search agents. Therefore, the help of autonomous robots and sensor networks is desired, as they
can resist better to drastic environmental changes, and provide long-term assistance with lower
performance degradation when compared to humans. Static sensors are small and cost-effective,

2
and can be used at a large scale. In practice, they can be readily positioned (i.e. deployed) within
the search space by, for example, and airplane or unmanned aerial vehicle, at relatively minimal
costs. Although size and sensing range appear to be small, if not insignificant, relative to the
expanding search space, an optimal deployment can provide a meaningful contribution in the
search. In fact, it will be shown in this thesis that the presence of static sensors within the
environment will help to increase the success rate and reduced the mean detection times of target
interception. Since there exist several deployment strategies for only mobile sensors to detect un-
trackable targets, this thesis will focus exclusively on the deployment of static sensors. However,
a simple hybrid deployment strategy based on static and mobile sensors will also be proposed.
The motivation behind static sensors for target interception has been presented, and will be
proceeded by the thesis objectives (section 1.1) and the thesis organization (section 1.2).
Furthermore, a literature review (section 2) will be provided based on relevant research work,
showing that existing efforts to do not fully solve the problem at hand. The rest of the thesis will
focus on a detailed description of the methodology (section 3).

3
1.1 Thesis Objectives
The goal of this thesis is to design a methodology for static sensor network deployment
according to a probabilistic model of target motion to assist with the intersection of an un-
trackable moving target. To achieve this goal, this research will be subdivided into three tangible
objectives: 1) planning the deployment strategy, 2) executing the deployment strategy, and 3)
adapting to events during the search. Each objective will be achieved through a corresponding
stage: the deployment planning stage, the deployment execution stage, and the redeployment
stage.
For the deployment planning stage, the optimal locations and deployment times for the static
sensors will be determined off-line, according to the probabilistic target motion, number of static
sensors available, and type of environment under consideration. Once the optimal solution for
the first instance of deployment is determined, the solution will be propagated with time to
provide optimal deployment locations for future deployment instances. Therefore, each
deployment instance will have a corresponding set of optimal sensor locations.
For the deployment execution stage, sub-sets of static sensors will be ‘dropped’ at their
deployment locations, and only at their planned deployment times. The execution of the
deployment will follow the proposal of the planning stage for the duration of the search, unless
new information of the target becomes available (i.e., a target clue is found).
For the redeployment stage, a new deployment configuration with the remaining static sensors
will be planned and executed given current and possibly new information about the target (i.e. a
target clue found). This stage is a combination of the previous two stages (planning &
execution), and in the case of a clue find, the sensor deployment is centered at the location of the
found target clue.
The final objectives of the thesis are to demonstrate the effectiveness of the proposed
methodology through simulations, prove its superiority over current approaches, and integrate
the proposed strategy within a hybrid sensor deployment that also uses mobile sensors. This is
achieved through simulations for static sensor network deployment in a MATLAB©
environment.

4
1.2 Thesis Organization
The structure of the thesis is as follows:
Chapter 1: This chapter presented the problem under consideration, namely static sensor
deployment, and outlined the objectives and organization of the thesis, was well as the
motivation behind the proposed methodology.
Chapter 2: This chapter presents a detailed literature review, showing that existing efforts do
not fully solve the problem at hand. Namely, they do not consider expanding search areas,
unstructured environments, nor probabilistic target motion.
Chapter 3: This chapter presents a novel methodology for static sensor network deployment for
the intersection of an un-trackable target in unstructured and expanding search areas. This
chapter discusses the off-line deployment planning stage, the on-line deployment execution
stage, as well as the procedure for redeployment upon a target clue find. Furthermore, the
integration of static sensor deployment with mobile sensor deployment is also presented as part
of a hybrid sensor deployment strategy.
Chapter 4: This chapter presents simulation results based on the evaluation of the novel
deployment methodology. The effectiveness of the thesis research work is evaluated in terms of
detection success and detection time, when compared to simpler, and more common deployment
approaches. In addition, a WiSAR case study is described in detail to illustrate the benefit of a
hybrid sensor deployment strategy in detecting an un-trackable target.
Chapter 5: This chapter presents a conclusion to the thesis and discusses future work to be taken
into consideration.

5
Literature Review
The deployment of static sensor networks and/or autonomous teams of mobile sensors (i.e.,
sensors mounted on mobile platforms) has been proposed for a variety of unstructured-
environment exploration applications, including border security, target tracking and localization,
environment monitoring, observation of natural phenomena, such as ocean currents, air/water
pollution, or even seismic activities, and, more recently, for USAR and WiSAR missions. Some
progress has also been reported on the deployment of hybrid networks combining mobile sensors
with static sensor networks. Such hybrid solutions have been gaining popularity due to recent
availability of inexpensive and small wireless sensors.
In general, deployment strategies have either been classified as static, when sensor inter-node
separations remain constant once implemented, or as dynamic, when the network is
reconfigurable over time. In these approaches, two main types of sensor models have been
considered: binary models (i.e., when a sensor detects a target only when the target is within its
sensing range) [1], or probabilistic models (i.e., the probability of detecting a target is a function
of its distance to the sensor) [2,3]. Furthermore, several performance metrics have been proposed
for use in sensor-deployment strategies, which will be discussed in detail in this literature review.
They include, but are not restricted to, energy consumption, network connectivity, and network
coverage.
The main goal of this thesis is, thus, to propose a novel dynamic deployment strategy for a
network of static sensors by using a probability model of target motion. The goal of the network
is to intercept an un-trackable target in an unbounded and growing search space with varying
terrain. In order to show that no current effective solution to this problem exists, a review of the
pertinent literature for the deployment of static sensor networks is presented.

6
2.1 Static-Deployment Strategies
Static deployment approaches refer to strategies where sensor locations (i.e., network nodes) are
planned in advance and, once deployed, these locations do not change with time. Static
approaches have been, typically, classified as probabilistic or deterministic. Probabilistic
deployments are based on stochastic placement of network nodes following a user-defined
probability density function (PDF) that may be uniform, Gaussian, or even Poisson.
Deterministic strategies, on the other hand, consider placement of nodes at fixed locations,
obtained according to some heuristics or objective functions. This sub-section discusses both
types of static deployments, and some applications.
2.1.1 Probabilistic
Probabilistic strategies are recommended for applications where areas of interest are not easily
accessible and/or rapid deployment may be desirable [4-6]. In [4], a methodology was presented
to provide early detection for forest fires using a wireless sensor network. A probability model
for forest fire was obtained and a k-coverage algorithm determined optimal locations for node
placement. In [5], an approach combined Gaussian and Poisson distributions to deploy nodes in
surveillance missions, where the spacing distance between sensor nodes followed any of the
above mentioned distributions. The goal was to efficiently distribute the resources in a uniform
manner while providing emphasis to hot spots that required higher surveillance. In [6], wireless
sensor networks (WSNs) were proposed to track targets in battlefields. Sensors were placed at
strategic locations according to a priori known target-motion models, and the certainty of target
tracking was provided by a Bayesian formulation.
Meanwhile, there are other deployment methods that determine the location of sensors by first
relying on a random distribution. In [7], a virtual force algorithm (VFA) enhanced the coverage
of a sensor network after an initial random distribution, by spacing static sensors away from each
other while maintain a certain maximum separation distance. After the planned locations of the
sensors were finalized, the sensor nodes were deployed. Finally, the sensors would relay
information to each while tracking a target based on a probabilistic localization algorithm used to
determine the likely position of the target. While the work in [8] brought more realism into the
tracking problem by accounting for the effect of varying terrain with VFA, it was shown in [9]
that optimization of sensor placement to maximize coverage constrained by detection

7
imprecisions and terrain properties outperformed the random and uniform placement of static
sensors.
The proposal of hybrid systems, employing both static and mobile sensors, is also found in
methods that use random static sensor deployment, [10-13]. In [10], static sensors were randomly
deployed to perform environmental monitoring and surveillance tasks. More specifically, a
greedy algorithm optimally assigned mobile robots to visit specific static sensors whenever the
static sensors detected events within their sensing range. Meanwhile in [11], the problem of
coverage holes (i.e., unmonitored areas) was investigated. An initial random deployment of static
sensors resulted in holes, and an algorithm based on graph theory dictated the movement of
mobile sensors to fill in the holes. The coverage-healing problem was also investigated in [12],
with the incorporation of a genetic algorithm (GA) to determine both the minimum number of
mobile sensors required to cover holes, as well as their corresponding locations. In [13] however,
the proposed method achieved the same task by re-locating the sensors with the assistance of
Voronoi Diagrams (VDs) and movement-assisted sensor deployment protocols, with the ultimate
goal of spreading static sensors uniformly. Clearly, none of these hybrid methodologies deploy
sensors to locate an untrackable target, with or without the help of a target motion model.
2.1.2 Deterministic
In contrast, deterministic approaches are static approaches that rely on heuristics and/or objective
functions to determine the deployment locations of sensor nodes. The solutions for these
strategies can be based on geometrical patterns, or heuristics and objective functions.
Many approaches have made use of complex geometrical patterns to achieve superior coverage
and network connectivity [14-16]. In [14], a hexagonal-based pattern was used to deploy sensors.
It was shown that, with this geometric approach, the connectivity, coverage and lifetime of the
network was maximized, and the deployment scheme was superior to conventional approaches,
like row spacing. In [15], several geometric deployment strategies for WSNs were compared. It
was shown that a seven-node hexagonal strategy outperformed others, such as square grid and
tri-hexagon tiling, by reducing sensor overlap and resulting in less static sensors needed to
achieve the same area coverage. In [16], given a number of regions, the spatial arrangement of
static sensors was optimized to minimize the number of sensors in order to achieve a connected
network.

8
Meanwhile, sensor power consumption has also been commonly used, together with geometrical
patterns, as a metric for optimal deployment, [17-19]. In [17, 18], different spatial arrangements
based on geometrical patterns were considered: the bounded detection area was discretized into
different patterns (square, triangular, and diamond shapes), and two types of operating modes
(active and sleep) were considered for the sensors so that not all were operating at once.
Meanwhile the survey in [19] evaluated topology control in WSNs, by clustering deployment
techniques based on either network coverage or network connectivity. Methods like blanket
coverage (where every point in a network was covered by at least one sensor), barrier coverage
(covering continuous boundaries with sensor nodes), and sweep coverage (only covering select
points of interest within the network) were compared. When discussing connectivity issues, it
was shown that synchronized protocols were shown to be effective in minimizing network power
consumption, where individual sensors shared their working schedule with neighbors such that
not all sensors were active at once. Important conclusions drawn from this study were that a
simplified design of a sensor network, that is scalable and efficient, was preferred over more
complex integrated systems that attempt to unit several control protocols, and that a balance
between network coverage and network connectivity is not always easily achievable. Eventually,
the final design of a network would have to suit the application at hand, and none of these
applied to target localization according to target-motion models.
Other approaches like the ones in [20, 21] utilized GAs to solve for the optimal deployment of
static sensors according to fitness functions. In [20], a GA was used to optimally place static
sensors in a grid for maximum coverage in an environment with obstacles. Given a probabilistic
sensor model, the optimization was carried out to uniformly place a minimum number of sensors
in the search area. In [21], factors such as terrain features, sensor capabilities, and basic
probabilistic models of target behavior were considered to optimally deploy a network of sensors
in a bounded environment employing a hybrid steady-state GA. This strategy differed from [20]
in the sense that each generation of the algorithm was made up of two components: the steady-
state component replaced only one solution with a new offspring (i.e. another mutated solution),
while the hybrid component improved the offspring through local optimization.

9
2.1.3 Applications
It is also important to discuss the static deployment of static sensors in the context of practical
applications, such as environmental monitoring, robotic related applications like USAR and
WiSAR, as well as underwater sensor networks (UWSNs) and border patrol.
Examples of deterministic, static approaches are found in environmental monitoring [22-24]. In
[22], linear sensor configurations radiating from the center of a volcano were proposed for
monitoring seismic activity. However, deployment of the sensors was based on human
experience and knowledge of volcano sites. In [23], a WSN deployment on redwood trees was
suggested to monitor temperature and humidity levels. The uniform inter-node spacing between
sensors placed along tree trunks captured enough data to accurately perform interpolation
between nodes. In [24], “globally distributed” (i.e. uniformly distributed) stations with GPS and
accelerometer data were used to track the epicenter of earthquakes. The combination of both
types of sensors allowed for a more complete description of seismic-related frequency spectra,
with higher accuracy in magnitude and phase detection. However, no reference was made as to
what spatial arrangement of sensor deployment would achieve better results.
Several deterministic deployment strategies have also been considered for USAR applications,
[25-28], most of which make use of heterogonous groups of agents. In [25], an autonomous
sensor network was deployed to provide support for rescue operations in damaged buildings. The
system, composed of stand alone sensors, gave human rescue agents vital information of the
rescue missions such as localization and mapping through GPS and radio based positioning. In
addition, these low power devices monitored areas around their vicinities and informed mobile
agents of possible threats and hazards areas to avoid. The sensor locations were determined
according to a priori knowledge of the affected building, forming a rectangular perimeter. In
[26], static sensors were manually deployed by mobile agents inside an unknown building to
locate victims. The sensors were placed randomly on the grounds of the collapsed building to
provide real-time path navigation information to mobile sensors through temperature gradients,
as well as assisting with simultaneous location and mapping. The work in [27] differed from [26]
in that light, temperature, and acceleration sensors, in addition to chemical-substance detectors
assisted with path-planning and safe navigation to mobile robots in simulated USAR scenes. The
algorithm combined data from heterogeneous sensors that were placed in a grid-like pattern,

10
hanging from ropes over the scene. In [28], the objective was to optimally deploy sensor teams
comprising of agents with high/low sensing capabilities, as well as enhanced/limited mobility to
maximize area coverage and assist with target localization in USAR environments. Mobile
robots deployed the static sensors according to a hierarchy of behaviors allowing for individual
decision making without compromising computational power. The robots moved around the
environment through a combination of random and uniform distribution based dispersal
algorithms.
Other deterministic strategies extend to WiSAR missions in [29-31]. In [29], a mission planner
was developed for teams of heterogeneous agents to assist with the retrieval of moving hikers. In
[30], static sensors acted as access points by collecting data from mobile agents. They helped
with localization and were strategically placed in locations where hikers were likely to pass by,
like trails and resting areas. However, both WISAR examples in [29, 30] neglected target motion
models to optimize for static sensor deployment for target interception. As another WiSAR
related example, the study in [31] analyzed cognitive tasks during the integration of unmanned
aerial vehicles (UAVs) with WiSAR missions. Emphasis was placed on human operators
enhancing the capabilities of mobile agents to acquire field data, without any consideration for
static sensor deployment through the UAVs. Clearly, there appears to be a gap in the study and
validity of static sensor deployment to support WiSAR missions.
Another area that has received extensive attention is UWSNs. It has been shown that land-based
deployment techniques, such as those discussed above, are not easily transferrable to underwater
cases due to communication constraints and the potential 3D nature of the problems in
underwater environments. UWSNs are, typically, deployed to maximize the efficiency of the
network defined by communication performance, power consumption, network reliability, or
fault tolerance. In [32], coverage optimization for submarine detection using Particle Swarm
Optimization (PSO) was proposed, where the optimal locations of the sensors are determined a
priori based on transmission range, attenuation, and water depth. In [33], various deployment
methodologies for underwater acoustics sensor networks (UASNs) were presented, where static-
based deployments could either be random [34] or deterministic [35]. For example, the work in
[34] placed sensors at different depths for monitoring purposes, where the initial deployment
location was decided based on random deployment and diffusion strategies. The presence of
exogenous forces such as winds and ocean currents rendered the stochastic placement of sensors,

11
proceeded by self-adjustment strategies, preferable. Meanwhile, in the cases were sensor
locations could be achieved with higher accuracy, geometrical strategies like grid-based
approaches in [35] were suggested, achieving minimal coverage overlap in order to track the
movement of a sinking object.
In addition, static sensor deployment has also been used for target tracking and detection [36-39].
In [36], Doppler shifts and radio signals were employed to track a target through nonlinear
observability decomposition, but the deployment locations of the static sensors were assumed to
be known a priori. In [37, 38], static sensors within a WSN were deployed in advance, according
to a 2D uniform random distribution. The network nodes acted as way points for mobile sensors
to navigate through the environment and track a moving target, where navigation was either
based on surface interpolation through radial basis function in [37], or a “pseudogradient” path
planner in [38]. Although a higher density and greater number of static sensors increased
interpolation accuracy and reduced travel distance, the deployment of network nodes was made
randomly and not according to the target’s motion model. Finally, the work in [39] proposed a
deterministic deployment scheme based on line-sets to maximize the likelihood of target
interception, but assumed that targets were moving in straight lines.
Border-monitoring applications have also been explored in [40-42]. In [40] the inclusion of low-
power static sensors reduce false alarm rates, provide higher monitoring resolution through local
vibration measurements, and relay data across the sensor network. Static sensors were deployed
manually or randomly, depending on the easiness to field access, according to a k-barrier
coverage requirement. Meanwhile in [41], a hierarchical network was used for target
localization, where different sensors performed different roles (e.g., basic sensing, relaying, and
dissemination to base stations). In [42], several border surveillance examples with WSNs were
presented, including a “stealth detection” strategy with synchronized cameras along a passage
line, and a target detection methodology based on a Pursuer-Evaders game. However, these
border monitoring methods were restricted by a non-growing detection area, were limited to a
single instance of deployment at the start of operations, and no generic target motion model was
considered to assist with deployment.

12
2.2 Dynamic-Deployment Strategies
Dynamic deployment approaches differ from static approaches in that the networks are
reconfigurable, namely, the locations of the deployed sensors may vary with time. Typically,
dynamic deployments are less common that static deployment strategies, and they determine
deployment locations through either an on ongoing re-adjustment of the system to achieve a
desired configuration, or through re-deployment subject to time-based or event based events.
Whenever an optimal solution is difficult to obtain due to the complexity of the problem, a
deployment strategy that is on-line reconfigurable is preferred, as it allows near-optimal
solutions to be obtained after several iterations. Computational geometry (CG) and VDs are
typical methods used in dynamic strategies for sensor network deployment, [43-45]. In VDs,
sensor locations in 2D space are planned by re-drawing artificial polygons, called Voronoi
polygons, centered on guesses for sensor deployment positions. As sensors move to improved
locations within their polygons, the VDs are updated until no further improvements can be
obtained. For example in [43], VDs were used to deploy sensor nodes in order to maximize
coverage and sensor life, while minimizing for energy use during displacement and data packet
exchange. Meanwhile in [44], the adopted strategy first divided a search region into Voronoi
polygons and, then, a GA placed sensor nodes in each polygon region so as to fill up coverage
holes and avoid overlap with nodes within the same Voronoi polygon and adjacent Voronoi
regions. In [45], an artificial potential field (APF) method adjusted sensor-node positions within
a detection area based on directional sensing models. The positions were iteratively updated to
maximize coverage by concentrating more efforts on hot targets.
Dynamic deployment strategies are also commonly found in situations where global information
of the environment is unavailable, or as part of a distributive system without access to a control
station, or in time-triggered changing scenarios [46-49]. In [46], a fuzzy-logic system (FLS) was
used to improve the coverage of an UWSN after an initial random deployment. Sensors would
re-locate their positions based on the number of and distance to nearby sensors, and the step size
of such re-location would be determined by the FLS. In [47], sensors would first be deployed
along the seabed and their locations, at different depths, would then be optimized by reducing
coverage overlap, performed by clustering sensors and solving the graph-coloring problem. In
[48], sensors were relocated based on time-triggered events due to sensor failure, where

13
redundant sensors were first identified through a Grid-Quorum solution, and then relocated
through a cascaded movement. In [49], routing protocols were evaluated for WSNs, where static
and mobile sensor networks were considered. During data package exchanged, it was concluded
that networks comprising of static sensors outperformed dynamic sensors, since the mobile
sensors induced a higher delay during end-to-end data transfer, as well as a lower data
throughput.
Environmental monitoring applications also make use of dynamic deployment strategies, through
either taking into account environmental factors that can affect unwanted sensor displacement
[50], or through the use of hybrid systems to support mobile sensors [51]. The work presented in
[50] determined deployment locations for sensors subject to external forces, like winds and
currents, which would displace sensors with time. Sensor dynamics and environmental forecasts
were employed to predict sensor displacements, and a near optimal solution for the deployment
locations was obtained through a combination of computational geometry and quadratic
programming. Although the strategy did not re-locate sensors actively, it accounted for the
displacement of the sensors subject to external forces to guarantee deployment optimality.
Differently, in [51], a team of heterogeneous mobile sensors was used to monitor harmful algal
blooms in the ocean. The deployment followed a hierarchical approach, where quadrotors first
scanned target areas and, once certain features were detected, autonomous surface and
underwater vehicles were deployed to collect samples, acting as static sensors. Re-deployment of
surface and underwater sensors continued until sufficient data had been collected by the entire
sensor network.
Examples of dynamic deployments can be also found in UASNs. Besides the static approaches
which were previously discussed, other methods can be further categorized, according to [33], as
“self-adjusted” deployments, or “movement-assisted” deployment strategies. In “self-adjusted”
deployments, sensors changed their depth along the water bed to maintain application
requirements. Uniform coverage based approaches gave equal emphasis to all underwater areas,
like the work in [52] that took into account water currents to deploy sensors using rigidity-driven
mobile strategies. Meanwhile, methods for non-uniform coverage like the ones in [53, 54] were
targeted for event detection. However, in “movement-assisted” deployment strategies,
deployment was assisted by mobile sensors which transported static sensors underwater. These
strategies were meant for monitoring tasks, and were justified by the fact that mobile-sensor

14
assisted deployment was more cost-effective. Examples included autonomous underwater
vehicles driven deployment over predefined trajectories in [55], and data collection with sonar-
equipped underwater sensors in [56] through algorithm variants of NP-complete problems.
Dynamic approaches can also be found in target tracking applications, [57]. In particular, the
authors in [57] developed a strategy where a swarm of mobile targets were tracked by mobile
sensors with finite sensing range. Several cases were explored, where initial deployment was
based on geometrical patterns, and if sufficient tracking sensors existed then handover
techniques were used for tracking. However, the search space was assumed to be finite, and the
targets were assumed to be trackable. Furthermore, in the event that the number of sensors was
insufficient to cover the entire search space, tracking was deemed non-effective.
In the literature, APF-based algorithms are preferred for dynamic deployment problems, where
the environment is unpredictable and individual sensor nodes need self-arrangement to maintain
the optimality of the deployment with time. Alternatively, CG methodologies and VDs are
preferred for applications where sensors may potentially fail or their functionality is impacted by
environmental factors, and they are also used in large search spaces. Compared to grid-based
methods, VD-based strategies remain computationally efficient since they only rely on the
number of sensors in the network, and not on the size of the search space.
It is clear from the literature review that an existing method for sensor deployment to achieve
target localization using a target motion model does not exist, where the method must be scalable
to an expanding search area. The notion of an ever expanding search space is essential for target
localization, since localization is not guaranteed and the exact motion of a target is not known a
priori. Geometrical-based strategies could achieve target localization but they would be
inefficient, since they tend to deploy resources uniformly. Clearly, as the target propagates with
time, the points of interest within the search space would vary, and as such, non-uniform
coverage would be more desirable. Furthermore, to add complexity to the problem, deployment
based on trackable targets is not useful in this thesis since the target is assumed to be non-
trackable. As stated in [19], generic deployment methods are inconvenient since they do not
adapt well to specific applications. Therefore, since no current solution exists, the motivation
becomes to design a methodology that can deploy a sensor network to intercept an un-trackable
target within and expanding search space.

15
2.3 Mobile-Target Behavior
In order to solve the deployment problem, a target motion model needs to be considered. This
target motion model will assist in optimally deploying search resources within the search space.
In order to effectively intercept more than one type of target, a generic model of target motion
that can adapt to the uniqueness of targets, like target physiology and target psychology, must be
used. This sub-section summarizes the chosen target motion model, and explains how the current
search strategy associated with this motion model cannot directly solve for the deployment
problem at hand.
In [58], a target motion model was proposed using the novel concept of iso-probability curves.
These curves defined regional boundaries where the target could be located within with a certain
probability. They were generated according to a PDF that modeled the target behavior, with an
expected propagation speed (i.e., outward motion from the last known position (LKP) with
occasional random motion-direction and speed variations). The estimation of the probabilistic
target behaviour was supported by data from search and rescue (SAR) organizations [59].
For mobile targets, at the start of the search, every possible direction of travel from the LKP was
considered, defined as a straight-line ray, where the target-motion PDF was overlaid over such a
direction. At any given point in time, a distribution for the probable position of the target along
the ray could be obtained. Each cumulative-probability value along the ray was referred to as a
control point. Namely, each control point represented the limit of how far the target could be
located from the LKP corresponding to a (cumulative) probability value. Fig. 1(a) shows an
example PDF along a ray, with several control points. The length of a ray, at a given time t, was
determined by the distance covered by the target, travelling at the maximum outward
propagation rate of vmax. This total length, in turn, has a cumulative probability value of 1.
An iso-probability curve was determined by the collection of all the control points on all possible
rays, emanating from the LKP, with the same cumulative probability value. Due to terrain
variation along any direction, a control point pertaining to the same cumulative probability value
could vary in distance from the LKP. Fig. 1(b) shows an example of five iso-probability curves,
calculated based on a search time of t, which were interpolated from control points found along
12 distinct rays. Each of these curves delimits the region within which we would expect the
target to be with a certain probability, which for this case are 30%, 40%, 50%, 60% and 70%.

16
As the search progresses, however, due to the dynamic nature of the problem, the iso-probability
curves would propagate outwards in order to keep up with the probabilistic target-motion model.
Fig. 1(c) shows the new locations of the five iso-probability curves in Fig. 1(b) after Δt.
Fig. 1. Illustration of the iso-cumulative curves. (a) Target PDF along a ray based on speed
histogram; (b) Iso-probability curves, at t; and (c) Propagated iso-probability curves, at t+Δt.
The iso-probability curves described above could be used to deploy mobile sensors in search of a
mobile target. However, since the curves propagated in time to mimic the target motion, the
deployed mobile sensors needed to propagate forward with them in order to remain optimal over
time. Namely, they would be used to distribute the search effort over space and time in an
optimal way. Such an optimal-deployment strategy for mobile sensors was suggested by in [60].
The strategy selected both the number and positions of the iso-probability curves, as well as the
number of sensors assigned to each curve. The optimization procedure utilized the weighted
contribution of the search-time and success-rate objective functions to determine the optimal iso-
probability curves. After deployment, the mobile sensors remained on their respective iso-
probability curves at all times as the curves were propagated during the search [61]. As the
search progressed, however, new data about the target could become available. In such a case,
for example after finding a verifiable target clue, the optimal re-calculation of the iso-probability
curves and deployment of the mobile sensors would be repeatead as often as necessary.
The strategies in [60, 61] that translate the sensors forward in tandem with the propagation of the
iso-probability curves would not be possible for static sensors. Thus, a new strategy that
principally is based on the use of iso-probability curves needs to be developed for the
deployment of a static sensor network. The main requirement is to maintain the optimality of the
deployed static sensors for as long as possible.
-800 -600 -400 -200 0 200 400 600 800-800
-600
-400
-200
0
200
400
600
800Time = 0hr 30min 0sec
-800 -600 -400 -200 0 200 400 600 800-800
-600
-400
-200
0
200
400
600
800Time = 0hr 30min 0sec
Iso-probability
Curve Control
Point
A ray
LKP
0 200 m 0 200 m
(a) (b) (c)
A ray
LKP
Control
Points
Target

17
Static Sensor Network Deployment
The method for solving a static sensor network deployment during the search for an un-trackable
moving target involves both planning and execution. Deploying static sensors to assist with such
detection within a search area is referred to herein an as the search effort. To assist with this,
first, one must plan the locations for the static sensors to be located during the search in an off-
line fashion, and then, execute the deployment on-line. Since the target to be detected is assumed
to follow a probabilistic location model, which is typically found in the form of a PDF, it follows
that the planning of the deployment locations must adhere to the probabilistic model. Having
said this, the method must be adaptable to unstructured and expanding environments, with
possible terrain variation and presence of multiple obstacles. This guarantees that the deployment
tries to mimic as accurately as possible the target behaviour in the environment. In addition, the
method must be able to re-assign the search effort whenever new information about the target
becomes available, namely, through the detection of a target clue. In such events, a new
deployment scheme with the remaining number of static sensors must be planned and executed.
The proposed methodology in this thesis addresses the static sensor network deployment
problem by determining an optimal spatial configuration of the static sensors that maximizes the
likelihood of detecting an un-trackable target during a time-limited search. This chapter outlines
the details of the deployment methodology and it is presented as follows. The chapter starts with
a description in section 3.1 of the problem that the thesis is attempting to address. Afterwards,
section 3.2 discusses the methodology in detail, which is sub-divided into the deployment
planning stage (sub-section 3.2.1), the deployment execution stage (sub-section 3.2.2), and the
redeployment procedure (sub-section 3.2.3). Meanwhile, section 3.3 explains how the static
sensor network deployment is meant to be incorporated with mobile sensors as part of a hybrid
sensor deployment strategy.

18
3.1 Problem Statement
Before outlining the deployment methodology, a description of the problem the thesis is trying to
address is presented in this section. The problem consists in finding an optimal deployment
configuration for a set of static sensors to detect an un-trackable target. Such deployment must be
optimal in the sense that it maximizes the likelihood of detecting the target during a finite-timed
search, Tmax. The search time, Tmax, is defined herein as the period of time where the sensors are
capable of detecting a target. A detection is successful only when a target is detected by a sensor
during the search. During this time, if a target has been detected (i.e. a target comes in the
vicinity of a sensor), the search is labelled as “successful” and is terminated. However, if the
target is not detected within the time Tmax, the search is terminated and labeled as “unsuccessful”.
The deployment of all static sensors must occur at any point in time, through either one or
multiple instances of deployments of sub-sets of sensors, as long as the deployment times fall
within the starting time for the search, and the defined total search time, Tmax. Therefore, the first
deployment would be at tmin, and the last deployment would be at tmax , where tmax Tmax.
In order to solve this problem, three key factors come into play. These are the untrackable target,
the static sensors to de deployed, and the environment where the target is found. This section
describes all factors and how they shape the deployment problem.
3.1.1 The untrackable target
An untrackable target is an agent that cannot be tracked, i.e., the location of the target is not
known at any point in time. In this thesis, the behavior of a target is assumed to follow a
probabilistic model, in the form of a PDF identical to the one in [58]. According to this model,
the target’s only known previous location is its LKP, given by a 2D coordinate. In addition, a
head start time THS indicates how long ago the target was seen at the LKP. From this, a target-
location PDF is defined in any direction, or ray, emerging from the LKP. Then, the target is
assumed to move away from the LKP (i.e. outward), along any ray, at an outward propagation
rate following a uniform distribution with mean speed µν and standard deviation σν. Although a
typical, realistic target can change heading directions and vary its own moving speed while it
adjusts to its environment, it will still have an overall outward propagation motion radiating
away from the LKP, and its motion still abides by the target-location PDF.

19
Furthermore, it is assumed, in this model, that a target can leave clues behind. A clue is defined
as a piece of evidence, belonging to the target, providing immediate information about the
target’s location. Although in practical cases, clues can be false positives clues (i.e. clues that do
not belong to the target), it is assumed in this research work that the clues do indeed belong to
the right target being searched for. It is envisioned that once a clue location is determined during
the search, the deployment must be re-configured around this new location which estimates the
new and latest known position of the target.
3.1.2 The static sensors
The static sensors are the agents responsible for detecting a target during the search. It is
assumed, in this work, that a total of Nss static sensors are available for deployment, and the
sensors have a binary sensing model, with a radial detection range of size rsens. In a practical
situation, a static sensor would be any piece of stationary hardware that has sensing capabilities
and can detect target motion within a distance rsens. This means that if a target were to step into
the vicinity of a sensor, (i.e. be found within a distance of rsens meters or less away from the
center of a sensor), the sensor would detect the target, and the search would terminate. It is
important to note that, since static sensors can only detect a moving target, and clues are
stationary pieces of evidence, a clue cannot be detected by a static sensor. However, a clue can
be detected by another agent employed in the search such as a mobile sensor.
In addition, static sensors are static in the sense that their locations, once deployed, cannot
change during the search. It is envisioned, herein, that the locations for the deployment of static
sensors be first determined in advance (i.e. off-line), prior to actual deployment execution, which
happens regularly during the search (i.e. on-line). Clearly, if a static sensor’s location has been
planned off-line but its deployment not been executed yet, then its planned location may be
changed, which may be the case during search-effort relocation due to a clue find.
3.1.3 The environment
The environment is defined as the search space under consideration, where the un-trackable
target is found but its exact location unknown, and where static sensors may be deployed. The
environments under consideration have features typically found in the wilderness, such as
unleveled terrain due mountains, valleys, rivers, and trails, as well as obstacles that force the

20
target to make detours, like boulders, swamps, ravines, Fig. 2. In addition to the target-location
PDF, the environment is the only information known a priori that may be used to solve the
deployment problem. Typically, terrain information will be provided in the form of height map
data. Incorporating the terrain information is vital since it affects the way the target behaves and
travels through the environment, and the target-location PDF can be scaled to reflect such
influence. Once the target motion is scaled to the environment under consideration, optimal
deployment locations can be determined for the static sensors.
With time, and as a target moves away from the LKP in any possible direction, the total area
where the target might reside will grow, rendering the search space found within the
environment to be expandable and theoretically infinite. Therefore, it is imperative that the
search time parameter, Tmax, for which a deployment configuration must be obtained, to be
determined at the start of the search. The search time, Tmax, provides an indicator of the total area
under consideration where the target might be found. This is because the maximum possible
distance, dmax, travelled by a target along a ray, can only be achieved by the fastest possible
target, moving at an outward propagation rate of µν+3σν. Since this bound includes
approximately 99% of all targets, it can be taken as the maximum distance where the fastest
target might have travelled (especially since the target’s exact speed is never known). The
approximation was shown to be reasonable in [58], and will therefore be employed herein.
Fig. 2. (a) Google Earth terrain image of Mount Robson Provincial Park, BC, Canada; (b)
Simulated 3D terrain in TerreSculptorTM based on height map data from (a).
(a) (b)

21
3.2 Methodology
The main goal of this thesis is to propose a novel dynamic deployment strategy for a network of
static sensors by using a probability model of target motion. The overall objective of the network
is to intercept un-trackable targets in unbounded and growing search spaces.
The novel static sensor network deployment strategy described herein is real-time dynamic. The
strategy uses as input the mobile-target location PDF, the characteristics and number of the
available static sensors, as well as terrain information for the search area. As the first stage, the
strategy plans the initial optimal deployment of all static sensors at hand. This planning stage
utilizes our originally developed methodology for the deployment and utilization of a team of
mobile sensors in search of a mobile target within an expanding search area in unstructured
environments [58, 60, 61]. The next stage in the deployment of the static sensors comprises the
time-phased ‘dropping’ of sensors at their optimal locations as the search progresses. Finally, as
real-time information about the target becomes available, recalculation of the optimal locations
of the remaining (non-deployed) static sensors is invoked, followed by their deployment. This
three-stage strategy is iterative in nature and continues until the complete network is deployed,
Fig. 3.
As outlined above, the deployment of the reconfigurable static sensor network is dynamic.
Namely, although in order to initiate the network deployment the entire optimal node-placement
process is carried out off-line, the sensors are dropped at the time-phased nodes only at
corresponding time instances. Subsequently, as the search progresses and new information
becomes available, if there are still un-deployed static sensors at hand, a new network is planned
as required for the remaining set of sensors. In addition, the dynamic process of dropping them at
appropriate time instances is re-initiated.
Fig. 3. Summary of proposed methodology.
Plan initial optimal
deployment of all
available static sensors
Execute deployment of
subset of static sensors at
their optimal locations
Recalculate optimal
locations for remaining
static sensors with current
& new available target
data
Stage I Stage II Stage III

22
Since the total search time for successfully locating a target cannot be estimated ahead of time,
the overall time interval during which the static sensors are dropped must be chosen a priori
based on the priority at hand. For example, for time-sensitive cases, the network can be deployed
quickly in the close vicinity of the LKP of the target. For less urgent cases, on the other hand, the
time interval used to drop the static sensors can be longer, allowing for a larger coverage area,
and potentially allowing network reconfiguration based on target data that becomes only
available after the search has started (e.g., clues found in the field by dynamic sensors in a hybrid
system). Thus, a longer time interval could improve the chances of success of finding the target,
though at a cost of longer search time. The deployment of the static sensor network is further
optimal in the sense that the sensor nodes are chosen to maximize the success of finding the
target within a given time interval.
3.2.1 Deployment Planning – Stage I
The first stage of the proposed deployment strategy, planning, is carried off-line. It aims to
identify the locations and the times the static sensors will be deployed, and remain optimal for
the entire search. Planning is subject to several intertwined critical constraints: 1) there exists a
finite number of sensors available for deployment, 2) once deployed the sensor locations cannot
be altered, and 3) the sensors’ effectiveness is a function of their spatial distribution as well as
the overall length of the search time until the target is located.
Since the search time to success (in locating a mobile target) cannot be estimated ahead of time,
the optimal distribution of the static sensors must be based on an a priori chosen time-based
criterion during which the sensors’ effectiveness can be maximized through an optimal
distribution. This time-period limit is chosen herein as a generic value, Tmax. One should note
that, although the static sensors can operate well beyond this point in time, their deployment is
based on Tmax, whose selection is discussed in sub-section 3.2.4.
Determining the locations for deployment of the static sensors given the chosen parameter Tmax is
referred to herein as the “planning” stage of the deployment. It is sub-divided into three sub-
tasks: 1) determining optimal locations along any potential direction of target travel (i.e., ray),
(2) propagating the optimal locations with time, and (3) spatially distributing the static sensors to
achieve a specific configuration that maximizes a coverage-based criterion. Fig. 4 summarizes

23
the planning stage, and the details for the three sub-tasks are found below in sub-sections 3.2.1.1,
3.2.1.4, and 3.2.1.5, respectively.
Fig. 4. Overview of the deployment planning – Stage I.
3.2.1.1 Defining the iso-cumulative probability curve
As part of the proposed dynamic deployment strategy, the static sensors are to be iteratively
deployed as the search progresses – namely, at a discrete number of predetermined time
instances, during a user-specified total deployment period, tmin < t < tmax, where tmin is the first
instance where a subset of static sensors is deployed, and tmax is the last instance by which all
static sensors are deployed. As proposed in this thesis, for the optimal deployment of a subset of
static sensors at any given time instance, t*, tmin < t* < tmax, first the corresponding spatial
potential location/region to deploy the static sensors must be determined, at which the probability
of locating the target, by this specific subset of sensors remains maximum for the entire
(cumulative) interval t* to Tmax.
As per the definition of the iso-probability curve above, let us first consider a single direction of
potential motion of the target – defined here by a straight-line ray. The ray originates at the LKP
(last-known position of the target), at time t = 0, and extends to a maximum distance, dmax, that
could be achieved by the target, if he/she were to travel along the ray at maximum propagation
rate vmax. Therefore, dmax defines the point on the ray corresponding to the 100% iso-probability
curve calculated at any given time t. Herein, we employ the same target location PDF used to
generate the iso-probability curves in [58]:
22
2
2
)(exp
2
1),(
vt
tr
ttrPDF
(1)
where r is the distance from the LKP, and (µν,σν) are the mean and standard deviation of the
nominal mean target propagation speeds PDF, respectively.
Determine optimal
deployment locations
at the current time,
valid until time Tmax
Propagate optimal
solution with time for
future deployment
instances valid until time
Tmax
Distribute static sensors
optimally across the time-
propagated solution

24
Unlike mobile sensors that could remain optimal by staying on their respective iso-probability
curves as these are propagating, static sensors, once deployed, can only remain globally optimal
momentarily. Thus, the definition of optimality is redefined herein, where sensing optimality is
required to be effective for a chosen time interval. For example, a static sensor deployed at time
t*, tmin < t* < tmax, would need to remain optimal from t* until the user-chosen Tmax.
In this thesis, the premise is that the static sensor deployment will remain optimal for a given
time interval, in the sense of maximizing the cumulative probability of success of locating the
target during t* < t < Tmax. Thus, the objective is, for time t* deployment, to search along a
considered single ray for the optimal point to place a static sensor at time t*. In order to
determine this cumulative maximum probability of success of locating the target by a static
sensor placed at a given point on the ray, we make use of Eq. (1).
As the first step, in our quest for the optimal point on the ray to place the static sensor at time t*,
the target PDF, Fig. 1(a), is integrated to yield a cumulative PDF (CPDF) and is superimposed
on the ray, Fig. 5. This CPDF can be used to calculate a metric describing the probability of the
target to be at any distance, r, from LKP (i.e., P(X ≤ r)) during the time interval [0, t*]:
2
)(1
22
1
2
)(exp
2
1
),(),(
*
*
*
0
22
2*
0
**
t
trerf
t
t
tx
t
dxtxPDFtrCPDF
r
x v
r
x
(2)
Where erf is the error function:
z
g
g dgezerf0
21)(
(3)
This metric, thus, represents the approximate (momentary) likelihood associated with locating
the target at t* by a sensor located at r.

25
Fig. 5. Example of a Target CPDF.
However, since the sensor is static, while the target is mobile, we need to consider the
cumulative likelihood associated with locating the target by a sensor which is located at r during
the entire search-time interval t* ≤ t ≤ Tmax. This objective can be achieved by continuously re-
evaluating the CPDF and re-calculating the probability P(X ≤ r). Since this process would be
computationally prohibitive to carry out, a discrete approximation is proposed. Namely, for a
sensor deployed at t*, only a limited number of CPDFs are evaluated at regular intervals of Δtapp
during the period t* ≤ t ≤ Tmax. The first CPDF is for t ϵ [0, t*], the next one is for t ϵ [0, t*+Δtapp],
until the last one is for t ϵ [0, Tmax], Fig. 6 (top three graphs, respectively).
The individual CPDFs need to be weighted, summed up, and normalized to yield a single
normalized CPDF (NCPDF) for t*, Fig. 6 (bottom graph):
),(),(
1
*i
N
i
i trCPDFwtrNCPDFprop
(4)
Where Nprop is the number of discrete intervals being considered, ti ϵ {t*, t*+Δtapp, t* +2Δtapp, … ,
Tmax}, a set of size Nprop, and wi is the normalized weight for the time interval 0 to ti.
The weights, wi, in Eq. (4) must be selected such that rmax is located at the 100% iso-probability
curve at time ti = t*. This would ensure that the first deployment, at time t*, is exactly on the
100% iso-probability curve for time t*. This also ensures that the deployment locations found for
subsequent deployment instances (i.e., for times t > t*) will be within their respective upper
bounds defined by their 100% iso-probability curves. Sub-section 3.2.1.3 outlines the proposed
strategy to select such weights.
0
0.1
0.2
0.3
0.4
0.5
0.6
0.7
0.8
0.9
1
Ta
rge
t C
PD
FDistance from LKP [m] dmax
Ta
rget
CP
DF
Distance from LKP [m]

26
Fig. 6. Cumulative probability of success curves at multiple time instances, t* < t < Tmax.
Since a normal distribution is assumed herein for the target motion, the 50% probability point on
the NCPDF would represent the best sensor location, at rmax, with the highest likelihood
associated with locating the target at t*:
NCPDF(rmax, t*) = 0.5 (5)
As per the above discussion on developing the iso-probability curves, one cannot guess the
direction of travel for the target ahead of time. Thus, at any time instance, t*, the rmax value must
be determined on several distinct rays, chosen in different potential target-motion directions. The
outcome is a set of rays with an optimal sensor location on each for time instance t*. These can
be viewed as the control points on the rays that determine the iso-probability curves. Thus, as in
obtaining the iso-probability curves, these rmax points can be connected, for example, via cubic
spline interpolation, to obtain the corresponding iso-cumulative curve (short for iso-normalized-
cumulative-probability curve) for time instance t*, Fig. 7(b). One should note that, there exists
only a single iso-cumulative curve that is obtained, versus many possible iso-probability curves.
Distance from LKP
C
um
ula
tive
Su
cces
s
CPDF for 0 < t < t*
CPDF for 0 < t < t* + 4Δ tapp
CPDF for 0 < t < Tmax
rmax
NCPDF
0.5

27
An iso-cumulative curve theoretically passes through all the points along all directions where the
likelihood of finding the target is maximum, at t*, for a given search time interval t* ≤ t < Tmax.
Furthermore, as noted above, as terrain may vary along any direction of travel, the target
propagation rate is adjusted uniquely to that ray and it is, therefore, expected that the distance of
the optimal sensor deployment locations from the LKP along any ray would be different. The
process for generating an iso-cumulative curve at deployment time t* is summarized in Fig. 8.
Fig. 7. (a) A target NCPDF along a ray; (b) Iso-cumulative curve, at t*.
Fig. 8. Outline of iso-cumulative curve generation at deployment time t*.
3.2.1.2 Adjusting to terrain and obstacles
Two typical features found in realistic land-based environments are unleveled terrain and
obstacles, which impact the determination of the iso-cumulative curve. This section describes
how these two features are taken into account when calculating and propagating the iso-
cumulative curve.
A ray LKP
NCPDF
rmax
rmax
Iso-cumulative
curve LKP
A ray
(a) (b)
Generate iso-cumulative
curve by connecting all rmax
points using cubic spline
polynomial method
Determine NCPDF
curve along ith Ray
by propagating PDF
for a time interval
t* < t < Tmax
Determine rmax along ith
Ray by solving for

28
3.2.1.2.1 Terrain influence
The terrain variation present in the scene can cause a moving target to both change its traveling
direction and its moving speed. As outlined in [58], the change in terrain, measured by the slope,
can impact the target’s behavior. Therefore, the NCPDF along a ray will look different
depending on which ray is considered.
An effective way of dealing with terrain is the scaling of the NCPDF to generate the iso-
cumulative curve, analogous to the scaling of the control points during iso-probability curve
generation. In particular, the CPDF must be propagated along a ray as outlined in sub-section
3.2.1.1 but scaled according to the target’s response to terrain variation as in [58]. This results in
what is referred to herein as the ‘scaled CPDF’, or sCPDF. Therefore, combining the sCPDF
through Eq. (4) would generate the ‘scaled NCPDF’, or sNCPDF.
However, obtaining an exact solution for the sNCPDF would be computationally prohibitive,
since all infinitesimally-small scaled points would have to be scaled along the ray for each
sCPDF instance, ranging from the LKP, all the way until the maximum distance covered by the
fastest target. Therefore, an approximation is needed to speed up computation. In this thesis, it is
proposed to approximate the sNCPDF by using the scaled control points used for the generation
of the iso-cumulative curve. For each CPDF defined at time ti, the control points for the iso-
probability curve at time ti can be computed and scaled to the current terrain. Since the control
points represent a cumulative probability value, they can be interpolated to form the sCPDF.
Since the target model assumes a normal distribution for the target speed, the sCPDF will
resemble, with some perturbations due to terrain, the cumulative distribution function (CDF) of a
normal distribution. To approximate this distribution, the logistic function is suggested, as it is a
monotonically increasing function, and ranges in the values 0 to 1. Given a finite number of M
control points along a ray at time ti, given by cpj,i for j = 1,2,…M, and each with cumulative
probability values vj, a non-linear regression can be performed to obtain the approximation to the
sCPDF. Namely, the approximation can be given by the logistic function in the form of:
)(
1),(
iibra
ii
e
LtrS
(6)

29
where r is any distance from the LKP along a ray, and {ai, bi, Li} are the model parameters for
time ti estimated with control points cpj,i. We can use Eq. (6) to define the sCPDF:
),(),( ii trStrsCPDF (7)
and consequently, define the sNCPDF for deployment time t*:
),(),(
1
*i
N
i
i trsCPDFwtrsNCPDFprop
(8)
where Nprop are the number of propagations, and wi the weights for the sCPDF propagations. A
height map generated in TerreSculptorTM is shown in Fig. 9(a), with several sNCPDF plotted in
Fig. 9(b), and several sCPDF propagations with the resulting sNCPDF for Ray 4 are in Fig. 9(c).
Fig. 9. (a) Terrain with 4 rays; (b) sNCPDF plots for Tmax = 2.5 h for Rays 1,2 and 3; (c) Several
sCPDF propagations and the sNCPDF plot for Ray 4 in (a).
Ray 2
Ray 1
Ray 3
Distance from LKP [m]
(b)
(a)
Distance from LKP [m]
(c)
Cu
mu
lati
ve P
rob
abil
ity
Valu
e
Ray 4
Cum
ula
tive
Pro
babil
ity
Valu
e
0 500 1000 1500 2000 25000
0.5
1
T = 1800 s
0 500 1000 1500 2000 25000
0.5
1
T = 4200 s
0 500 1000 1500 2000 25000
0.5
1
T = 9600 s
0 500 1000 1500 2000 25000
0.5
1
sNCPDF - Ray 4
0 500 1000 1500 2000 25000
0.25
0.5
0.75
1sNCPDF - Rays 1,2 and 3
rmax
Control
points Logistic
regression
0 1000 m

30
Finally, an illustrative example for the iso-cumulative curve is presented. Consider a target
moving outward from the LKP, with a propagation rate defined by a normally-distributed target
PDF, where the first static sensor deployment is scheduled for t*=1800 s. The problem at hand is
to determine the corresponding rmax values along 12 distinct rays. The sNCPDF along each ray is
obtained by considering 12 distinct sCPDFs, for a search time of Tmax =10800 s. Fig. 10
illustrates the corresponding iso-cumulative curve for the example.
Fig. 10. The iso-cumulative curve at t*=1800 s, effective for the time interval t* < t < Tmax.
3.2.1.2.2 Obstacle influence
In addition to terrain, another factor that influences the computation and propagation of the iso-
cumulative curve is the presence of obstacles within the environment. Obstacles are regions in
space that cannot be physically traversed by the target, like boulders, swamps, and ravines.
It is assumed that since targets cannot pass through obstacles, they will be forced to circumvent
them and follow a path which roughly represents the obstacle perimeter. Therefore, the effect of
obstacles would only be considered when a ray that is used to calculate the NCPDF originates
from the LKP and intersects an area bounded by an obstacle. For these rays in particular, the
NCPDF would wrap around the obstacle to account for the target’s behavior and motion while
circumventing the obstacle.
To accomplish this, and in order for this adjustment to not impact the way terrain influence is
taken into account (see previous sub-section), the modified path due to obstacles will be
interpolated from the control points used to propagate the CPDF. This means that the control
-1000 -500 0 500 1000
-1000
-500
0
500
1000
LKP
Optimal location rmax
along Ray 1
Iso-cumulative
curve
0 200 m
Ray 1
Ray 8 Optimal location
rmax
along Ray 8

31
points will wrap around the obstacle boundary as long as the ray falls within the obstacle
boundary. An example is illustrated below in Fig. 11 where two rays pass through obstacles and
are then adjusted to account for the target behavior along the ray while circumventing the
obstacle. Since the wrapping of control points around obstacles is done together with scaling due
to terrain, as reported in [58], it follows that these new locations serve as interpolation points for
the sCPDF. Therefore, the distance of the control point from the LKP, at time t and used in Eq.
(7), is the distance along the adjusted ray due to the obstacle, where the total length of the ray is
bounded by vmaxt.
Fig. 11. (a) Iso-cumulative curve propagation with obstacle presence.
3.2.1.3 Computing the NCPDF Weights
In order to properly capture the nature of the target location PDF, our methodology proposes a
selection of weights that follows a power relationship in the form of:
bii atw (9)
where a,b ϵ ℝ, b < 0, ti is the time for a CPDF and wi is the corresponding normalized weight for
that distribution. If we refer to the location of the 100% iso-probability curve at time t* as D100* ,
express CPDF(D100
*,ti) as vi, and substitute Eq. (9) into Eq. (4), we obtain:
-400 -300 -200 -100 0 100 200 300 400-400
-300
-200
-100
0
100
200
300
400Time = 0hr 30min 0sec
0 100 m
obstacle
Adjusted ray
Adjusted ray
Control point
Iso-probability
curves
LKP

32
propprop
N
i
ibi
N
i
ii vatvwtDNCPDF
11
**100 5.0),( (10)
This yields our objective function:
prop
N
i
ibi vatOF
1
5.0 (11)
Therefore, in order to determine the weights wi in Eq. (4), all that is required is to determine the
appropriate power model fit, namely, the parameters a and b in Eq. (9). Their numerical values
are the ones that minimize the objective function in Eq. (11). In order to accomplish this goal, the
following is proposed:
1. Obtain an initial guess for the weights of each ith CPDF, named wini . This is carried out in
inverse proportion from the deployment time t* to Tmax. Namely, for every discrete time
interval ti, there is an initial weight wini . For example, the CPDF evaluated for t ϵ [0, t*] is
weighted by [Tmax/t*], the CPDF evaluated for t ϵ [0, t*+2Δtapp] is weighted by
[Tmax/(t*+2Δtapp)], and the last CPDF for t ϵ [0, Tmax] is weighted by [Tmax/Tmax].
2. Normalize the weights such that the sum of all weights is unity (i.e. ∑ winiNprop
i=1=1).
3. Perform a power regression in the form of Eq. (9) on the set of normalized weights of
Step 2, to obtain initial values for a and b.
4. Obtain an initial value for the objective function in Eq. (11).
5. Perform gradient descent to minimize Eq. (11). To achieve this, for example, a can be
fixed, and the expression in Eq. (11) is differentiated with respect to b to yield:
prop
N
i
ibii ttva
db
OFd
1
)ln())(( (12)
6. Once model parameters a and b are determined, the expression in Eq. (9) is sampled at
values of ti and the corresponding weights wi are obtained.
The selection of a power relationship tries to mimic the varying maximum likelihood of target
detection, which changes as a function of the standard deviation of the target-location PDF.

33
3.2.1.4 Propagating the iso-cumulative probability curve
The proposed network deployment strategy requires the static sensors to be dynamically
deployed starting at tmin, every Δtint, for nt time instances, until tmax, for a total search time
considered, 0 < t < Tmax. Since the (optimal) iso-cumulative curve is determined first at t*= tmin, it
is imperative that this curve be propagated with time in order to determine the locations for the
complete set of iso-cumulative curves, for static sensor deployment at t*= tmin, t*= tmin + Δtint, at
t*= tmin + 2Δtint, and so on, until t*= tmax.
Fig. 12 below illustrates three iso-cumulative curves for the example initiated above in Fig. 10,
for 1800 s, 2400 s, and 3000 s, respectively. Herein, propagation refers to the re-calculation of
the optimal iso-cumulative curve at consecutive static sensor deployment instances and not to the
actual physical motion of the sensors (or the curve itself).
Once a complete set of nt iso-cumulative curves is obtained, for the interval tmin < t < tmax, the
available set of static sensors need to be optimally placed on these according to the global
strategy described below in sub-section 3.2.1.5.
Fig. 12. Example of three iso-cumulative curves.
-1000 -500 0 500 1000
-1000
-500
0
500
1000
0 200 m
Iso-cumulative curve at t*=2400 s LKP
Iso-cumulative curve at t*=1800 s
Iso-cumulative curve at t*=3000 s
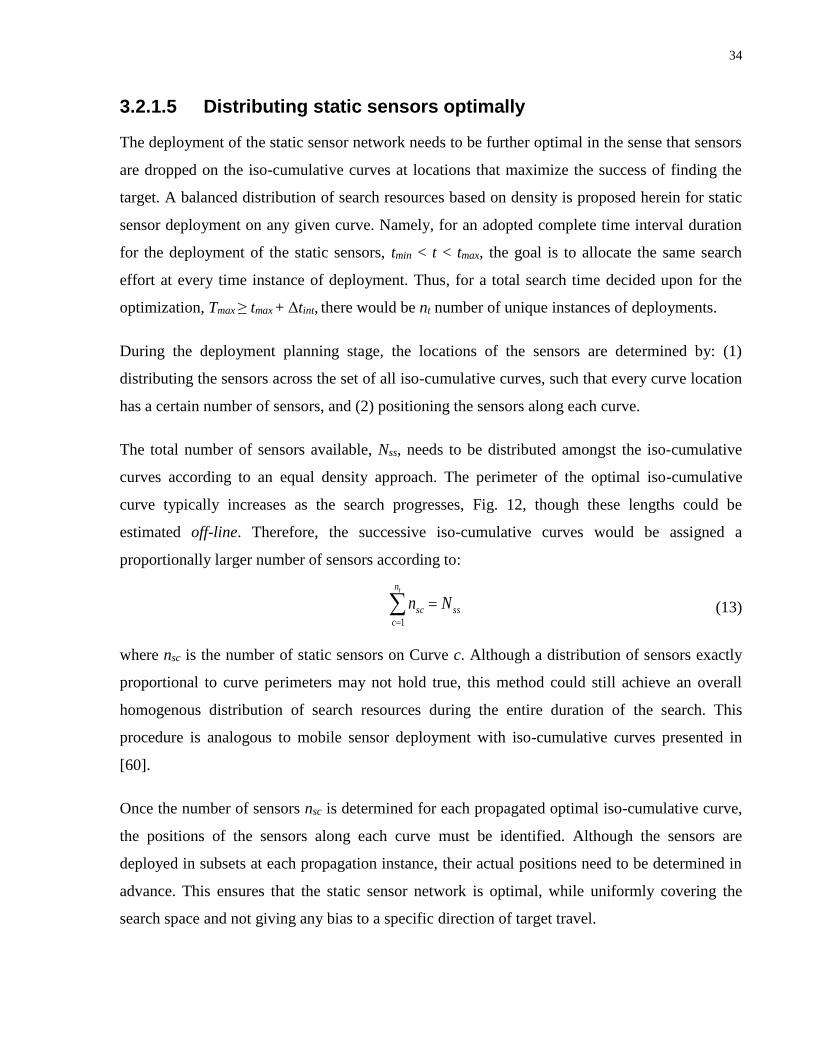
34
3.2.1.5 Distributing static sensors optimally
The deployment of the static sensor network needs to be further optimal in the sense that sensors
are dropped on the iso-cumulative curves at locations that maximize the success of finding the
target. A balanced distribution of search resources based on density is proposed herein for static
sensor deployment on any given curve. Namely, for an adopted complete time interval duration
for the deployment of the static sensors, tmin < t < tmax, the goal is to allocate the same search
effort at every time instance of deployment. Thus, for a total search time decided upon for the
optimization, Tmax ≥ tmax + Δtint, there would be nt number of unique instances of deployments.
During the deployment planning stage, the locations of the sensors are determined by: (1)
distributing the sensors across the set of all iso-cumulative curves, such that every curve location
has a certain number of sensors, and (2) positioning the sensors along each curve.
The total number of sensors available, Nss, needs to be distributed amongst the iso-cumulative
curves according to an equal density approach. The perimeter of the optimal iso-cumulative
curve typically increases as the search progresses, Fig. 12, though these lengths could be
estimated off-line. Therefore, the successive iso-cumulative curves would be assigned a
proportionally larger number of sensors according to:
tn
c
sssc Nn1
(13)
where nsc is the number of static sensors on Curve c. Although a distribution of sensors exactly
proportional to curve perimeters may not hold true, this method could still achieve an overall
homogenous distribution of search resources during the entire duration of the search. This
procedure is analogous to mobile sensor deployment with iso-cumulative curves presented in
[60].
Once the number of sensors nsc is determined for each propagated optimal iso-cumulative curve,
the positions of the sensors along each curve must be identified. Although the sensors are
deployed in subsets at each propagation instance, their actual positions need to be determined in
advance. This ensures that the static sensor network is optimal, while uniformly covering the
search space and not giving any bias to a specific direction of target travel.

35
The use of a PSO strategy [62], for example, can be utilized to position the sensor nodes on the
set of iso-cumulative curves such that distances between nodes are maximized. Just like any
CPSO algorithm, any particle (i.e., static sensor) is positioned at an initial location xss with an
assigned speed vss. The speed dictates the movement of the particle and is updated at each
iteration:
vss= wvss+(1-w)[a1rran1(pss
- xss)+a2rran2(pnet
- xss)] (14)
where
w is the inertia factor that dictates by how much the previous speed of the particle will
influence the next speed.
pss and pnet are the local optimal and global optimal positions, respectively.
a1 and a2 are learning factors associated with local optimal and global optimal positions,
respectively.
rran1 and rran2 are two independent random variables following U(0,1).
Therefore, at each iteration, the particle’s position is updated with its velocity:
xss = xss + vss (15)
Our strategy requires a local and global optimal position for each particle. In our case,
1) The local optimal position (pss) for each particle is the position that maximizes the
summation of all distances to all nearby particles (i.e., distance to other nearby static
sensors). If a particle pj has Nnei static sensors in its vicinity, and the distance of each
neighbor to particle pj is dj, then the following expression must be maximized:
neiN
j
jd
1
(16)
2) The global optimal position (pnet) is the particle position that maximizes the summation of all
shortest-neighbor distances of all particles. If there are Nss particles, and the nearest neighbor
of each particle pi is located at a distance di, the following expression must be maximized:
ssN
i
id
1
(17)

36
3) The unfeasible regions are defined by the segments of the iso-cumulative curve bounded by
obstacles, whereas the feasible regions are all the remaining segments of the curve.
The initial guess is shown in Fig. 13(a) for iteration N = 1, where sensors are equally spaced
within each propagation of the curve (i.e., sensors within the first curve are equally spaced out,
etc.). At each iteration, the particles move along their respective curve, following the defined
local and global optimal positions with some randomness, Fig. 13(b).
Since an iso-cumulative curve is generated based on a finite number of rays, it would be possible
for it to intersect an obstacle present in the scene. In order to account for such unfeasible regions,
where a static sensor cannot be placed within, a constrained-PSO (CPSO) algorithm, for
example, the ‘fly-back mechanism’ in [63], can be used. When a particle is displaced to an
unfeasible region (i.e., to a region within an obstacle boundary), its velocity vss is reduced such
that its final location xss is still found within a feasible region (i.e., outside an obstacle’s
boundary). The CPSO algorithm can run for a pre-defined number of iterations or over a time
period. In this example, it runs until a pre-defined iteration number, N = 500, Fig. 13(c).
It is to be noted that the final solution (i.e., final arrangement of the static sensors) might depend
on the initial guess for the first iteration, and global optima for all particles is not directly
obtained. In order to correct for this, it is suggested for the CPSO to be ran several times, and the
solution to be selected from the final iteration of the best CPSO instance.
Fig. 13. CPSO algorithm showing the locations of the static sensors for different stages of the
optimization process; (a) N = 1; (b) N = 20; (c) N = 500.
-1500 -1000 -500 0 500 1000 1500-1500
-1000
-500
0
500
1000
1500
-1500 -1000 -500 0 500 1000 1500-1500
-1000
-500
0
500
1000
1500
-1500 -1000 -500 0 500 1000 1500-1500
-1000
-500
0
500
1000
1500
(a) (b) (c) 0 500 m Obstacle
Static-sensor
Iso-cumulative
curve LKP
Unfeasible
region

37
3.2.2 Deployment Execution – Stage II
Once the positions of all static sensors are uniquely identified for all the iso-cumulative curve
propagations, the deployment execution can commence. In practical terms, execution refers to
the physical placement of the sensors on the field, at their respective optimal locations. The first
deployment is executed at tmin, while subsequent deployments are executed at time intervals of
Δtint. Finally, the last deployment instance will occur at tmax.
Let’s consider the example for three deployment instances with user-defined parameters, such as
deployment interval 1800 s < t < 3000 s, and Δtint. = 600 s. The sensors corresponding to the first
iso-cumulative curve propagation, at tmin = 1800 s, can be deployed as soon as the search begins,
Fig. 14(a). After Δtint, the next set of sensors can be deployed for the next iso-cumulative curve,
Fig. 14(b). The method continues until the last deployment instance happens at tmax., Fig. 14(c).
The main advantage of employing a dynamic strategy for static sensor network deployment is
that it can easily respond to on-line events, like a clue find. If a piece of evidence is found by a
mobile sensor, the search effort can be relocated and centered at this new LKP. Since the static
sensors are dropped at regular time intervals Δtint, there would be (undeployed) sensors available
as long as we have not reached the end time, tmax. Namely, a redeployment of the static sensors
could be carried out based on a new set of re-computed iso-cumulative curves. It is important to
note that herein, only a high-level deployment process is outlined, and not the specifics for the
deployment implementation. In practice, deployment could be carried out by UAVs using
navigation and localization strategies while ‘dropping’ the sensors on the field, like in [64].
Fig. 14. Example of dynamic deployment of static sensors with three propagations of the iso-
cumulative curve, for tmin = 1800 s, tmax = 3000 s, and Δtint = 600 s.
0 300 m
t*= 1800 s t*= 2400 s t*= 3000 s
(a) (b) (c)

38
3.2.3 Redeployment – Stage III
The third and last stage of the deployment methodology is the redeployment stage, which refers
to the deployment of all remaining search resources centered at a new location. In this thesis, the
methodology instantiates a redeployment event whenever new target information is acquired
during the search. In particular, redeployment occurs upon the retrieval of a clue within one of
the sensor’s sensing range. It is assumed that clue finds are positive finds (i.e. they belong to the
target in question). Clearly, this stage can happen for an infinite number of clue finds, as long as
there are still sensors left to deploy and the last deployment time, occurring at tmax, has not been
reached.
Redeployment implies a re-computation of the location and propagation of the iso-cumulative
curve, as well as the re-calculation of the new optimal positions for the Nund undeployed static
sensors. A redeployment due to a clue find, at time Tclue, would re-initiate the search, where the
first new iso-cumulative curve is now centered at the clue location. This is analogous to the
redeployment of the iso-probability curves due to a clue find in [58]. While the already deployed
sensors cannot change location, the planned locations for the remaining Nund sensors at time Tclue
that have not yet been deployed will have to be re-planned.
In order to re-configure the planning, a new search time parameter used to define the iso-
cumulative curve, T*max, is obtained. In order to do this, one simply re-defines the iso-cumulative
curve for the remaining search time, Eq. (18). The result obtained from Eq. (18) will be the new
Tmax valued used in Eq. (4), that determines the new location of the iso-cumulative curve:
cluemaxmax TTT *
(18)
However, the time values for the deployment times have to be updated in order to take into
account the time it took for the target to drop the clue. Instead of propagating the curve for the
current time, one must propagate the curve for a new deployment time, which is the current time
minus the time of the clue drop. Since the real time of the clue drop by the target is not known
(i.e. Tclue_drop), one must obtain a conservative estimate of this time, Tclue_drop. The conservative
estimate will, in turn, guarantee a prediction of the area that will bound the location of the target.
This time will be used to start propagating the iso-cumulative curve. First, it is assumed that the
target travelled a distance of dclue, which is the distance of a straight path from the LKP to the

39
location where the clue was dropped, Fig. 15. Therefore, if the target travelled at the fastest
possible target speed vmax., this would bound all possible target locations, and represent a
conservative estimate of the time of the clue drop Tclue_drop:
max
cluedropclue
v
dT _ˆ
(19)
Finally, the deployment time corresponding to the curve propagation is updated. If the original
interval for the deployment time was tmin < t < tmax, and the time of the clue find Tclue was in this
time interval (i.e. Tclue ϵ [tmin, tmax]), it follows that the deployment times ti used in Eq. (4) have to
be subtracted by Tclue_drop. The curve is then propagated forward at a rate of Δtint until the updated
tmax is reached and the additional iso-cumulative curve locations are determined.
During deployment execution, the remaining static sensors are deployed at time intervals of Δtint,
where their optimal locations were re-determined according to CPSO strategy formulated in sub-
section 3.2.1.5, while taking into account previously deployed sensors. As an illustrative
example, Fig. 15 displays the first new iso-cumulative curve after redeployment, due to a clue
find at Tclue = 3050 s, as well as two previous iso-cumulative curves prior to the clue find. In Fig.
15, it can be seen that the CPSO places redeployed static sensors (red) in a way that it maximizes
the distance with the respect to the already deployed sensors (orange).
Fig. 15. An example of network redeployment due to clue find.
-1000 -500 0 500 1000
-1000
-500
0
500
1000
First new iso-cumulative
curve centered at the clue
Iso-cumulative
curves centered
at the LKP
LKP
Clue
0 500 m
Static sensors for
post-planning
dclue

40
3.2.4 Determining the search parameters
As previously stated, there were several parameters used during the definition and propagation of
the iso-cumulative curve. These were the total search time Tmax, the time interval between
deployment instances Δtint, and the deployment time interval given by tmin < t < tmax. These user-
defined parameters can be tuned to adapt to different search strategies. This section describes
how they can be modified in order to accommodate real-life search missions, which are typically
planned by a search commander.
Deployment Rate, Δtint
As the first issue at hand, the time interval between deployment instances Δtint must be
determined. This parameter decides on the number of considered propagations of the iso-
cumulative curve, and is dictated by how often the search resources can be deployed in the
search space. In practice, this could be the rate at which an airplane or UAV would deploy the
static sensors along the search space. One must understand that a fast rate will deploy sensors
quickly, but will lead to more deployment instances within the deployment interval, and
therefore, a greater distance between sensor locations. On the other hand, a low rate will dictate a
small number of deployment instances, but there will be more sensors located at each
propagation of the iso-cumulative curve. Values can range from several minutes to few hours.
Deployment Interval, tmin < t < tmax
As the second issue at hand, the search commander needs to deal with deciding on the
deployment interval tmin < t < tmax. This is the period during deployment is planned for, and then
executed. Typically, tmin will be equal to the head start time THS, although it may be set to later in
the search depending on how fast can the first set of static sensors be deployed. Meanwhile, tmax
dictates the final deployment instance and this is usually chosen according to the urgency of the
search. For urgent cases, the static sensor network can be deployed quickly in the close vicinity
of the LKP, meaning that tmax will not be much greater than tmin. However, a quicker deployment
makes the search less flexible, since fewer search resources become available in the event of a
redeployment (sub-section 3.2.3). For less urgent cases, the deployment time interval can be
longer, thus, allowing for a larger coverage area and potentially a network that is dynamically
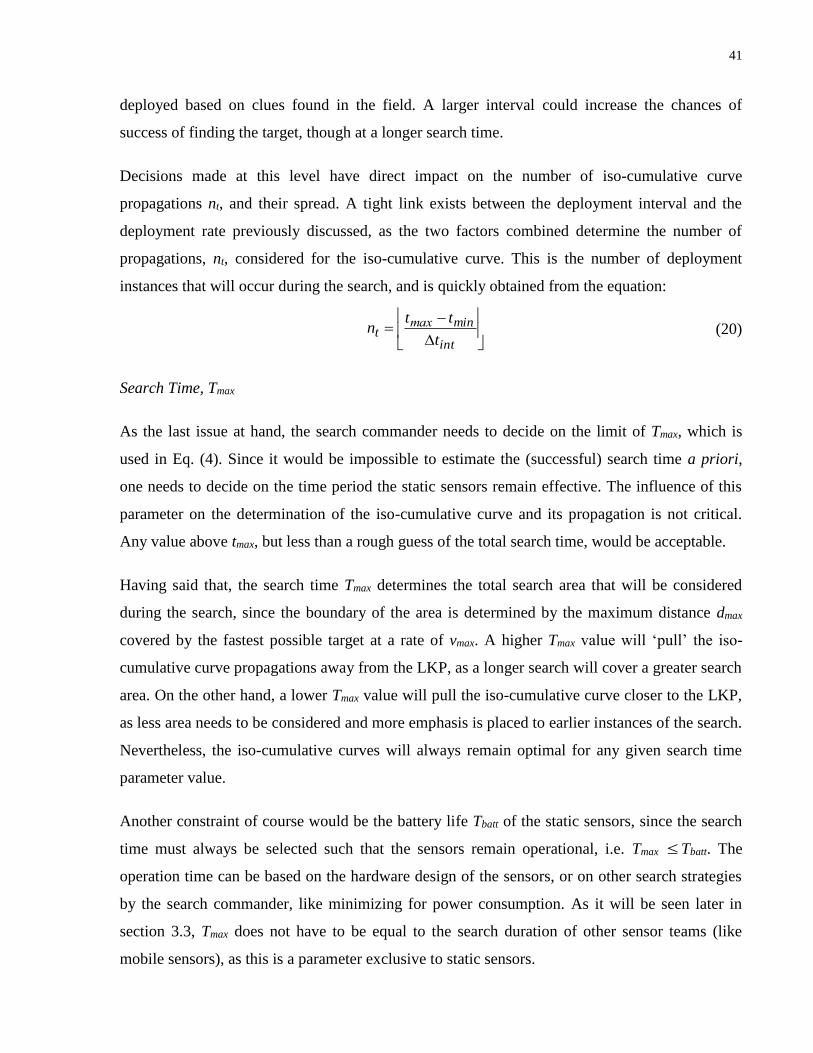
41
deployed based on clues found in the field. A larger interval could increase the chances of
success of finding the target, though at a longer search time.
Decisions made at this level have direct impact on the number of iso-cumulative curve
propagations nt, and their spread. A tight link exists between the deployment interval and the
deployment rate previously discussed, as the two factors combined determine the number of
propagations, nt, considered for the iso-cumulative curve. This is the number of deployment
instances that will occur during the search, and is quickly obtained from the equation:
int
mint
t
ttn max (20)
Search Time, Tmax
As the last issue at hand, the search commander needs to decide on the limit of Tmax, which is
used in Eq. (4). Since it would be impossible to estimate the (successful) search time a priori,
one needs to decide on the time period the static sensors remain effective. The influence of this
parameter on the determination of the iso-cumulative curve and its propagation is not critical.
Any value above tmax, but less than a rough guess of the total search time, would be acceptable.
Having said that, the search time Tmax determines the total search area that will be considered
during the search, since the boundary of the area is determined by the maximum distance dmax
covered by the fastest possible target at a rate of vmax. A higher Tmax value will ‘pull’ the iso-
cumulative curve propagations away from the LKP, as a longer search will cover a greater search
area. On the other hand, a lower Tmax value will pull the iso-cumulative curve closer to the LKP,
as less area needs to be considered and more emphasis is placed to earlier instances of the search.
Nevertheless, the iso-cumulative curves will always remain optimal for any given search time
parameter value.
Another constraint of course would be the battery life Tbatt of the static sensors, since the search
time must always be selected such that the sensors remain operational, i.e. Tmax Tbatt. The
operation time can be based on the hardware design of the sensors, or on other search strategies
by the search commander, like minimizing for power consumption. As it will be seen later in
section 3.3, Tmax does not have to be equal to the search duration of other sensor teams (like
mobile sensors), as this is a parameter exclusive to static sensors.

42
3.3 Hybrid deployment strategy
A hybrid deployment methodology is proposed herein for a set of mobile sensor agents
supported by an on-line reconfigurable network of static sensors in search of a mobile target in a
boundless unstructured environment. The methodology combines the use of iso-probability
curves for mobile sensor deployment, and their guidance, with the use of the above detailed iso-
cumulative curves for dynamic static sensor deployment, Fig. 16. The ultimate goal is increasing
the success rate of the search, as well as decreasing the average search time. The planned and
executed search effort is complementary but not redundant.
Fig. 16. Hybrid deployment strategy.
Integration of static
sensors with mobile
sensors
Deployment planning
of static sensors
Dynamic deployment
execution of static
sensors
Redeployment planning
of static Sensors
Search
End
Yes
No
Yes
No
No
Yes
Deployment
planning of mobile
sensors
Deployment execution
of mobile sensors
Redeployment
planning of mobile
sensors
Target PDF
Terrain
Number of
mobile sensors
Motion planning of mobile
sensors
Target PDF
Terrain
Number of
static sensors
Mobile sensor deployment
Static sensor deployment
Was target
found?
Was there a
clue find?
Is it time to
deploy?

43
It is intended herein, that the deployment of mobile and static sensors to happen concurrently,
and that the search to be executed by both types of search agents, at the same time. Since this
hybrid deployment is based off a centralized system, simple cooperation between search agents,
via the central controller, is possible. Mobile agents can detect the presence of clues dropped by
the target, which leads to the redeployment of both mobile and static agents. The reverse action
(i.e. static sensors detecting target clues) is not considered in this thesis because it is assumed
that static sensors can only detect target motion, but if considered, then, static sensors would also
be able to instantiate redeployment of both agent types.
When incorporating mobile sensors in the search, both deployment and path-planning of the
mobile sensors are required. After their deployment execution through iso-probability curves is
done according to [60], mobile sensors must have individual paths to guide them throughout the
search. These trajectories must maintain the optimal deployment of the search resources.
Namely, the mobile sensors must remain on their respective iso-probability curves at all times as
the curves are propagated during the search. For this goal, a robust path-planning methodology
was introduced in [61] that guided the mobile sensors along their respective iso-probability
curves as the latter were propagated. This path-planning methodology aimed at guaranteeing an
optimal distribution of the mobile sensors throughout the search.
Since the proposed methodology for static sensor network deployment is to be incorporated with
mobile sensors, it is important that coverage overlap by mobile and static sensors be minimized.
Coverage overlap is discouraged as it decreases the efficiency of the search by placing search
resources (i.e. mobile and static sensors) on the area at the same time. In order to achieve this,
mobile sensors are forced to detour around the detection area of the static sensors, considering
them as obstacles to avoid, Fig. 17. This is achieved by wrapping the planned path around the
perimeter of the static sensor sensing range. Since static sensors are assumed to have radial
sensing range, the wrapping can be done according to any standard bug algorithm for obstacle
avoidance, likes the ones presented in [65]. Wrapping the path implies that the destination point
at the destination curve has to be re-adjusted in order to conserve the optimal length of the
planned path.

44
During navigation, i.e. while the mobile sensors traverse their assigned paths to their propagated
iso-probability curves (i.e. destination curves), the mobile sensors should conduct their regular
optimality checks, just like in [61]. These are:
Check #1 - existence of feasible shortest path from next check-point to the destination
curve.
Check #2 - existence of feasible shortest path from current location to the destination curve.
Fig. 17. (a) Originally planned path with no static sensors at time t; (b) Adjusted path with static
sensor avoidance at time t.
Although path re-planning due to static sensors is not strictly mandatory, it can be executed and
still safeguard the optimality of the mobile sensor deployment. However, if the mobile sensors
plan their paths while taking into account the presence of static sensors, and Checks #1 or #2 fail,
then that means the static sensor sensing range is impeding the mobile sensor from remaining
along its optimal path. It is crucial that in this hybrid deployment strategy, for the static sensors
to have no impact on the optimality of the mobile sensor deployment, as it can deteriorate the
(a) (b)
Iso-probability curve of robot at
time t
Destination
curve of
robot at
time t
Originally
planned
path
Original
destination
point on
destination
curve
Static sensor and
its sensing range
Adjusted
path
Adjusted
destination
point
Mobile
sensor

45
performance of the search. In such cases, the destination point along the destination curve must
be re-adjusted iteratively until the checks pass and the optimality of mobile sensor deployment is
maintained.
In the cases where static sensors are significantly large relative to the static sensors (i.e. the
sensing range of static sensors occupies at least 30% of the space between propagated iso-
probability curves), wrapping of the original planned path is not feasible because it will cause the
mobile sensor to be away from its optimal iso-probability curve for a large fraction of its
traveling time. Since this is not optimal, it means that for very large static sensor sensing ranges,
the planned paths for mobile sensors can be re-adjusted so that a fraction of the path may overlap
with the area bounded by static sensors. Therefore, the goal becomes to re-plan the path such that
it minimizes the overlap with the static sensor sensing range, while guaranteeing the arrival of
the mobile sensor to its destination curve in due time. An acceptable level of overlap will not be
evaluated in this thesis, as very large sensors are, in practice, difficult to exist.
For the example initiated above (Fig. 12), Fig. 18 below shows the state of deployment for both
static and mobiles sensors at t*=2400 s. The iso-cumulative curves have been propagated (with
the mobile sensors on them) from the start of the search at 1800 s to the current 2400 s. The first
instance of static sensor deployment is also at time t*=1800 s, while the second instance is at
t*=2400 s, Fig. 18. The target has moved from the LKP outwards, while dropping clues every
600 s that can only be detected by the mobiles sensors. In the figure, the following can be
observed: mobile sensors (blue dots), static sensors (orange dots), target (red cross), clues (purple
triangles), iso-probability curves (black solid lines), and obstacles (green circles).

46
Fig. 18. State of an example search at t*=2400 s.
Time = 0hr 40min 0sec
0 300 m
LKP
Target clues
Target
Mobile sensor
Static
sensor
Iso-cumulative curve at
time t*=1800 s
Iso-cumulative
curve at time
t*=2400 s

47
Performance Studies
This section of the thesis describes the simulations that were performed to: (1) validate the
benefit of the proposed static sensor deployment methodology in comparison to others available
in the literature, and (2) illustrate in detail a WiSAR example based on the proposed hybrid
dynamic and static sensors approach. The simulations were conducted in MATLAB© 2013a,
running on a 64-bit MS-Windows workstation with Intel i7 at 3.40 GHz and 12 GB of RAM.
In order to validate the benefit of the proposed static sensor deployment methodology, a popular
alternative method was selected and modified for fair comparison. The alternative deployment
method is first described below, followed by an overview of the target model used in the
simulations, a description of the environment used, and an analysis of the results emerging from
the comparative study.
4.1 Comparative study
To the best of our knowledge, no other method currently exists in the literature that can deploy
static sensors according to our target location PDF. Therefore, in order to achieve a fair
comparison, we modified a virtual-force-algorithm (VFA) based deployment methodology [7], in
order to adopt the same target location PDF. VFA was selected, as it can scale to large static
sensor networks, as well as to large search spaces, with minimal complexity. It was also used in
[7] to localize a target. VFA is a distributed methodology where attractive and repulsive forces
act on individual nodes in a network to reposition the nodes and achieve an optimal
configuration. The optimal configuration is obtained when the attractive and repulsive forces
reach an equilibrium, whereby nodes do not change locations after several iterations. In our case,
repulsive forces were represented by nodes in close proximity to other nodes, as well as any
obstacles found in the environment. Attractive forces were nodes found far away from other
nodes. The attractive forces were set up such that VFA would achieve a uniform deployment
within the search area, where all nodes are equidistant to nearby nodes.
The search area used by the VFA was determined by employing the target location PDF.
Namely, the 100% iso-probability curve found at the end of the search, Tmax, defined the
bounding area for the deployment of all static sensors. This ensured that the static sensors were

48
deployed in the search space that enclosed 100% of the simulated targets. As the initial planning
stage, all available static sensors, Nss, were deployed at random locations within the search area,
and their final optimal locations were iteratively solved for via the VFA.
Initially, all of the available static sensors, Nss, were deployed at locations determined by a
hexagonal grid pattern within the search area [14] that achieved preliminary uniform coverage.
The final sensor deployment locations were iteratively solved for via the VFA. Although not
considered for this comparison study, VFA can accommodate the presence of obstacles by
considering them as repulsive forces. In theory, in order to achieve a dynamic deployment with
VFA, only sensors found within the area dictated by the 100% iso-probability curve at any
deployment time ti, for tmin < ti < tmax, could be deployed. However, since common VFA methods
do not dynamically deploy static sensors, it was decided that the VFA used herein would deploy
all Nss sensors at the start of the search.
4.1.1 Simulated Target
The simulated target used in the comparative study had a propagation rate represented by a
normal distribution, with a mean of 0.083 m/s, and a standard deviation of 0.028 m/s. The
starting heading angle of travel, emerging from the LKP, was uniformly distributed in the range
[0°, 359°]. At periodic intervals, the target changed its direction of travel that followed an
inverted normal distribution, in the range [-60°, 60°], Fig. 19. For each comparison, 15,000
different target motions were considered.
Fig. 19. (a) PDF of target travel direction change; (b) Examples of simulated target paths.
0 500 m
LKP
(a) (b)
-60 -40 -20 0 20 40 600
0.05
0.1
0.15
0.2
0.25
0.3
0.35
0.4
Target Change in direction of travel [degrees]
PD
F

49
4.1.2 Simulated Experiments
The performances of our proposed deployment strategy (NCPDF) vs the VFA were compared
based on two metrics: success rate and mean detection time. The former represents the
percentage of successful searches that detected a target within the allocated search time Tmax,
whereas the latter is the average time that it took for the target to be found – only for successful
searches. The detection time for successful searches was recorded as the time, to the nearest
second, when a target entered the radial area bounded by a sensor.
The deployment methodologies were compared for three different total search times Tmax: 13500
s, 27000 s, and 45000 s. This resulted in search areas with radial distance of 2250 m, 4500 m,
and 7500 m, respectively. For each total search time, the optimal sensor deployment network
was obtained, for each method, and tested with respect to simulated targets following the
behavior outlined above. Furthermore, different sensor detection radii were used: 5 m, 10 m, 20
m, and 40 m. The number of sensors used was Nss = 148, selected from a uniform distribution
U(120,160). The simulated environment consisted of a flat terrain with no obstacles. Fig. 20
shows the deployment configurations for both methods, where the 100% iso-probability curve
limits the search area in both figures.
Fig. 20. Optimal deployment networks for Tmax = 13500 s; (a) NCPDF vs (b) VFA.
In order to illustrate the effect of sensor size on target interception for the proposed NCPDF
based methodology, several simulation examples out of the 15,000 different cases are presented
below. The example in Fig. 21 shows a simulated target that was intercepted using 40 m sensing
-3000 -2000 -1000 0 1000 2000 3000
-3000
-2000
-1000
0
1000
2000
3000
-3000 -2000 -1000 0 1000 2000 3000
-3000
-2000
-1000
0
1000
2000
3000
0 1000 m
(a) (b)
0 1000 m

50
range at an earlier time when compared to the interception using 10 m sensing range. In Fig. 22,
the target was not intercepted when using 10 m radial sensing range, but interception was
achieved with 20 m sensing range. Note that in both Fig. 21 and Fig. 22 the static sensor sizes
were drawn to scale.
Fig. 21. (a) Simulated target interception at t = 10382 s with 10 m sensing range; (b) Simulated
target interception at t = 5763 s with 40 m sensing range.
Fig. 22. (a) Simulated target without interception with 10 m sensing range; (b) Simulated
target intersection at t = 9155 s with 20 m sensing range.
LKP
Target
path
Static
sensor
Target
Interception
(a) (b) 0 100 m 0 100 m
(a) (b)
Target
Interception
0 100 m 0 100 m
Missed target
by few
meters

51
Another example presented herein shows the two methodologies side by side, as seen in Fig. 23.
In this example, the static sensors were not drawn to scale, but the example illustrates two
important aspects. The first one being that NCPDF achieved target interception for this Tmax = 3
hour search, while VFA did not. In addition, NCPDF achieved target interception using only 52
of the 148 available static sensors, whereas VFA deployed all 148 static sensors with no success.
Fig. 23. (a) Simulated target interception using NCPDF at t = 5914 s; (b) Simulation with no
target interception using VFA.
The overall results for all 15,000 target motions are shown in Fig. 24, where Fig. 24(a) shows an
increase in the relative improvement in success rate of our proposed NCPDF method over VFA,
as the allowed search time grows. In addition, the mean detection time was also reduced for our
method with respect to VFA across all detection radii and allowed search times, Fig. 24(b). More
detailed comparative results for the difference search times and sensor sizes used are given in
Fig. 25. As expected, it can be observed that the success rate increased with sensor detection
radius. Our proposed methodology detected targets consistently more often than VFA for any
detection radius, and this was also true across all total search times.
For example, in best comparative scenario for target-detection success rate, our method
outperformed the VFA by about 45% for detection radius of 5 m and search time of 45,000 s.
Similarly, in best comparative scenario for mean target-detection time, our method outperformed
(a) (b) 0 500 m 0 500 m
Target
Interception

52
the VFA by about 48% for detection radius of 40 m and search time of 45,000 s. In worst
comparative scenario for target-detection success rate, our method outperformed the VFA by
about 12% for detection radius of 40 m and search time of 45,000 s. Similarly, in worst
comparative scenario for mean target-detection time, our method outperformed the VFA by
about 32% for detection radius of 5 m and search time of 45,000 s.
(a) (b)
Fig. 24. Improvement of NCPDF over VFA for different search times and sensor detection sizes;
(a) Improvement in success Rate; (b) Reduction in mean detection time.
Other parameters that were examined included the total number of static sensors deployed Nss, as
well the time interval during which static sensors were deployed Δtint. As expected, greater Nss
yielded higher success rate and a lower mean detection time. Also, as expected, for Δtint, it was
noted that a shorter time interval placed emphasis on trying to find the target more quickly (e.g.,
emphasis on minimizing search time), at the expense of risking overall search success. Namely,
at the extreme case, dropping all the static sensors as soon as the search started on the optimal
iso-cumulative curve helped find the target quickly, when the target was indeed in the vicinity of
the curve. Otherwise, when the target was already beyond this curve, the sensors were wasted.
3.75 7.5 12.50
10
20
30
40
50
60
Search Time [hr]
% I
mpro
vem
ent
in S
uccess R
ate
5m 10m 20m 40m
3.75 7.5 12.50
10
20
30
40
50
60
Search Time [hr]
% R
eduction in D
ete
ction T
ime
5m 10m 20m 40m
% I
mpro
vem
ent
in s
ucc
ess
rate
% R
educt
ion i
n m
ean d
etec
tio
n t
ime
Search time [h] Search time [h]

53
Fig. 25. Comparing success rate and mean detection time for different search time and varying
sensor detection radii.
5 10 20 400
10
20
30
40
50
60
70
80
90
100
Detection Radius [m]
Succ
ess
R
ate
Search Time of 13500 s
VFA NCPDF
5 10 20 400
0.5
1
1.5
2
2.5
3
3.5
4
4.5
5x 10
4
Detection Radius [m]
Me
an D
ete
ctio
n T
ime
[s]
Search Time of 13500 s
VFA NCPDF
5 10 20 400
10
20
30
40
50
60
70
80
90
100
Detection Radius [m]
Succ
ess
R
ate
Search Time of 27000 s
VFA NCPDF
5 10 20 400
0.5
1
1.5
2
2.5
3
3.5
4
4.5
5x 10
4
Detection Radius [m]
Me
an D
ete
ctio
n T
ime
[s]
Search Time of 27000 s
VFA NCPDF
5 10 20 400
10
20
30
40
50
60
70
80
90
100
Detection Radius [m]
Succ
ess
R
ate
Search Time of 45000 s
VFA NCPDF
5 10 20 400
0.5
1
1.5
2
2.5
3
3.5
4
4.5
5x 10
4
Detection Radius [m]
Me
an D
ete
ctio
n T
ime
[s]
Search Time of 45000 s
VFA NCPDF

54
4.2 WiSAR Case Study
In order to illustrate the effectiveness of our proposed hybrid methodology for mobile target
detection, a WiSAR example is included herein. Information about the simulated target,
deployment parameters and configurations, as well as descriptions of events that happened
during the search are presented in detail.
In order to obtain the iso-cumulative curve and deploy the static sensors, it was assumed that the
target (i.e. a lost adult) had a mean outward propagation rate of 0.139 m/s from the LKP. This
was the mean target velocity corresponding to the target PDF, and the iso-cumulative curve was
defined and propagated according to this rate. However, the actual target shown in this example
travelled with an actual propagation rate of 0.119 m/s, which was slower than the rate used for
static sensor deployment. The target travelled with random variations of ±3σ = ±0.0139 m/s and
orientation deviations of ±3σ = ±15o occurring every 120 s. The head-start time THS for the target
was 1800 s, and the target left behind clues every 600 s. Eleven mobile and 148 static sensors,
with binary sensing models, were chosen. The static and mobile sensors had a radial target-
detection radius of 15 m and 10 m, respectively. In addition, the mobile sensors had a 3 m radial
clue-detection radius.
The deployment parameters for the static sensor network were chosen as: tmin= 1800 s, tmax=
7200 s, Δtint= 1800 s, and Tmax= 10800 s. Namely, the network started to be deployed at 1800 s,
with a total of nt = 4 iso-cumulative curves – one every 1800 s. The parameter selection
corresponded to a search with equal emphasis on success of target detection and minimal
detection time. The search region was defined by Tmax= 10800 s, and the initially planned static
sensor network had an optimal configuration of {22, 33, 42, 51} sensors on the four iso-
cumulative curves, respectively (Fig. 26). It can be observed in Fig. 26 that the static sensors
(orange) are located on their respective iso-cumulative curve propagations (blue), but only within
their feasible regions, which are segments outside areas covered by obstacles (green).

55
Fig. 26. Static sensor deployment configuration for the search.
-1000 -500 0 500 1000
-1000
-500
0
500
1000
Horizontal Distance from LKP [m]
Ver
tica
l D
ista
nce
fro
m L
KP
[m
]

56
Meanwhile, the initial optimal mobile-sensor deployment comprised five iso-probability curves,
with a mobile-sensor distribution per curve of {2, 2, 2, 2, 2}, with the 11th center sensor
travelling around the LKP throughout the search. This optimal configuration was achieved
according to the strategy presented in [60]. Fig. 27 below shows the overall deployment of both
static and mobile sensors at the start of the search, i.e., at 1800 s. Detection areas of the sensors
in the figure are exaggerated for illustration purposes, but, their relative positions are to scale:
mobile sensors (blue dots), static sensors (orange dots), target (red cross), clues (purple
triangles), iso-probability curves (black solid lines), and obstacles (green circles).
Fig. 27. Initial state of the search at 1800 s.
Horizontal Distance from LKP [m]
Ver
tica
l D
ista
nce
fro
m L
KP
[m
]
-1000 -500 0 500 1000
-1000
-500
0
500
1000

57
During the search, a clue was found by a mobile sensor at Tclue = 3724 s. After the clue find, all
sensor deployments were re-planned. The locations of the remaining two iso-cumulative curves
for the Nund = 93 static sensors were re-determined, with a new static sensor distribution of {40,
53}, respectively, with the first redeployment scheduled for immediate execution, and the last
(fourth) deployment to occur at 3724 s + Δtint =5524 s. The optimal number and locations of the
iso-probability curves were re-determined, according to [60], as nine, with a new mobile-sensor
distribution per curve being as {1, 1, 1, 1, 1, 1, 1, 1, 2}, respectively, plus the center robot. Fig.
28 below shows the state of the search immediately after re-deployment planning at 3724 s. The
target was eventually intercepted by a static sensor at 5573 s, Fig. 29 (target path shown as a red
line).
Fig. 28. State of the search at 3724 s (clue located at ‘’).
-1000 -500 0 500 1000
-1000
-500
0
500
1000
Ver
tica
l D
ista
nce
fro
m L
KP
[m
]
Horizontal Distance from LKP [m]
Static sensors due
to redeployment

58
Fig. 29. State of the search at 5573 s.
-1000 -500 0 500 1000
-1000
-500
0
500
1000
Ver
tica
l D
ista
nce
fro
m L
KP
[m
]
Horizontal Distance from LKP [m]

59
One must note that, the interception of the target is not guaranteed within the considered search
time of Tmax = 10800 s, neither can one a priori predict interception by a static or a mobile
sensor. For example, when a different target (and initial motion direction) was considered, with
an outward propagation rate of 0.147 m/s, interception was achieved by a mobile sensor at 5543
s, Fig. 30. It can be seen that the deployment of static sensors was efficient since not all static
sensors were needed to achieve target detection.
Fig. 30. Target interception by a mobile sensor at 5543 s.
-1000 -500 0 500 1000
-1000
-500
0
500
1000
Ver
tica
l D
ista
nce
fro
m L
KP
[m
]
Horizontal Distance from LKP [m]

60
Conclusions and Recommendations
This thesis presents a novel approach strategy for the deployment of a network of static sensors
when using a probability model of target motion. The strategy is novel in the sense that it is real-
time dynamic and makes use of the iso-cumulative curve to detect an un-trackable target in
unbounded and growing search spaces with varying terrain. The iso-cumulative curve was
generated to assist with the optimal deployment of the static sensors. The curve was propagated
with time, scaled according to the target’s response to terrain variation, and adjusted to obstacles
present in the scene. Consequently, sub-sets of static sensors were deployed in feasible regions
within the propagated curve in a time-varying dynamic manner.
In the event that new information of the target became available in the search, the deployment of
the remaining sensors could be re-calculated in order to shift the search effort, referred to as
redeployment. This did not only allow for concentrating search efforts closer to the most recent
location of the target, but allowed for search resources to be deployed more efficiently. If all
sensors were initially deployed, and a clue was detected during the search, no remaining sensors
would be available for redeployment.
Simulated experiments were carried out to validate the effectiveness of the proposed static sensor
network deployment strategy, namely showing that it could increase the success rate of a search
and reduce the mean detection time for target localization when compared to uniform coverage-
based approaches, existing in the literature, which did not consider the target-location PDF.
Furthermore, a realistic WiSAR search scenario was presented in detail, where target detection
was achieved through the application of a hybrid methodology that employed both static and
mobile sensor.
The work presented in this thesis served as the first steps for a deployment methodology that is
meant to be implemented in real-life with inexpensive hardware. Although mock searches could
be carried out to show the effectiveness in real-life, the optimal deployment of the sensors and
their impact on target interception was already validated in the simulations sub-section. Of
course, real life implementations would be accompanied with other problems, including how the
static sensors are ‘dropped’ on the field by possibly UAVs, or how the sensors are physically
designed to detect the target. However, the methodology was designed such that it would be

61
independent of the hardware used for deployment, which renders the deployment strategy more
flexible. As long as UAVs or other forms of search assistance physically deploy sensors at the
optimal location for that assigned deployment instance, the deployment would still remain
optimal. In addition, considering non-binary sensing models would have no effect in the
performance relative to other deployment approaches, since both approaches would suffer
equally from probabilistic target detection by static sensors.
However, some topics could be addressed in future work to render the methodology more easily
applied to real-life scenarios. This does not take away from the effectives of the work, but rather
enhances its capabilities and makes it more appealing for implementation. For example, the
target motion model carries a “probable direction of travel” component that was not explored in
this work. This represents a guess for the likelihood of travel direction of the target. Although
terrain and obstacles were considered when propagating the iso-cumulative curve, it was not
shown how the relative likelihood of travel amongst several rays impacted the creation of the
iso-cumulative curve. Having said that, likelihood of travel direction distorts the iso-probability
curves in a similar manner as terrain does, which was shown in [58]. Since the likelihood of
travel direction only impacts the position of the control points, this proposed strategy would
easily adapt to the likelihood of travel direction (if considered) because it would simply use these
same control points to generate the iso-cumulative curves.
Another topic that was not explored in this work was the issue of network connectivity. It was
assumed that the proposed strategy was part of a centralized system, where the main control
station had access to all deployed static sensors, and that target detection would be possible as
long as the target came within the vicinity of one of the static sensors’ sensing range. The data
collected by sensors regarding target detection would be received at the control station
instantaneously. To achieve this, data transfer could be accomplished through cellular networks,
although they are not always available. As an alternative, the network would relay data acquired
by the sensors, from sensor to sensor, until the data reaches the control station. Direct
implementation of data transfer protocols along a network could certainly be integrated with the
proposed strategy, but the data transfer effectiveness would be constrained by the distance
between sensor nodes inherited from the proposed strategy. Therefore, in order to incorporated
network connectivity, static sensors would have to be deployed according to the iso-cumulative
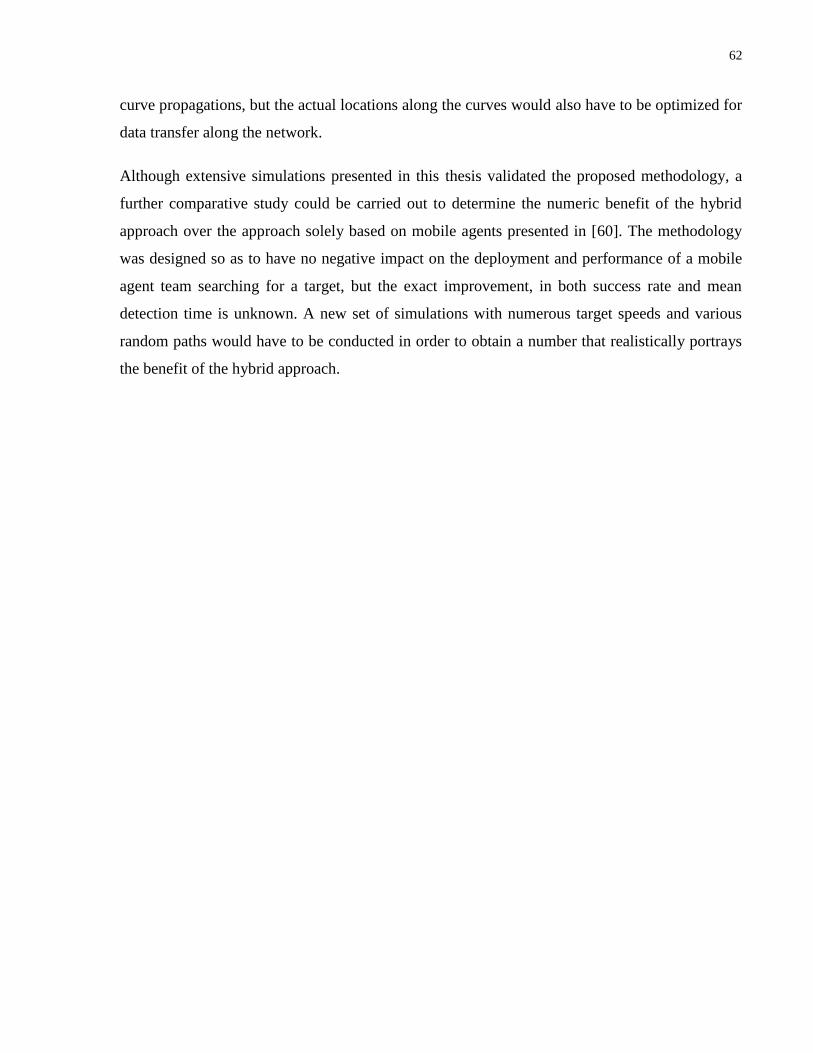
62
curve propagations, but the actual locations along the curves would also have to be optimized for
data transfer along the network.
Although extensive simulations presented in this thesis validated the proposed methodology, a
further comparative study could be carried out to determine the numeric benefit of the hybrid
approach over the approach solely based on mobile agents presented in [60]. The methodology
was designed so as to have no negative impact on the deployment and performance of a mobile
agent team searching for a target, but the exact improvement, in both success rate and mean
detection time is unknown. A new set of simulations with numerous target speeds and various
random paths would have to be conducted in order to obtain a number that realistically portrays
the benefit of the hybrid approach.

63
References
[1] Z. Wang, E. Bulut, and B.K. Szymanski, “Distributed energy efficient target tracking with
binary sensor networks,” ACM Trans. Sensor Netw., vol. 6, no. 4, pp. 32:1–32:32, July
2010.
[2] R. Stolkin, and I. Florescu, “Probability of detection and optimal sensor placement for
threshold based detection systems,” IEEE Sensors J., vol. 9, no. 1, pp. 57–60, Jan. 2009.
[3] L. Laxos, R. Poovendran, and J. Ritcey, “Detection of mobile targets on the plane and in
space using heterogeneous sensor networks,” Wireless Netw., vol. 15, no. 5, pp. 667–690,
Dec. 2007.
[4] M. Hefeeda and M. Bagheri, “Forest fire modeling and early detection using wireless
sensor networks,” Ad Hoc and Sensor Wireless Netw., vol 7, no. 3, pp. 169–224, June
2008.
[5] Y. Wang, M. Wilkerson, and X. Yu, “Hybrid sensor deployment for surveillance and target
detection in wireless sensor networks,” in Proc. 7th Int. Wireless Commun. and Mobile
Comput. Conf., Istanbul, 2011, pp. 326–330.
[6] B. Pannetier, J. Dezer, and G. Sella, “Multiple target tracking with wireless sensor network
for ground battlefield surveillance.” in Proc. IEEE 17th Int. Conf. Inform. Fusion,
Salamanca, 2014, pp. 1–8.
[7] Y. Zou and K. Chakrabarty, “Sensor deployment and target localization based on virtual
forces,” in Proc. IEEE 22nd Ann. Joint Conf. Comput. and Commun., San Francisco, CA,
2003, pp. 1293–1303.
[8] S. Li, C. Xu, W. Pan, and Y. Pan., “Sensor deployment optimization for detecting
maneuvering targets,” in Proc. 7th Int. Conf. Inform. Fusion, Stockholm, 2005, pp. 1629–
1635.
[9] S.S. Dhillon and K. Chakrabarty, “Sensor placement for effective coverage and
surveillance in distributed sensor networks,” in Proc. IEEE Wireless Commun. and Netw.,
New Orleans, LA, 2003, pp. 1609–1614.
[10] B. Coltin and M. Veloso, “Mobile robot task allocation in hybrid wireless sensor
networks,” in Proc. IEEE/RSJ Int. Conf. Intell. Robots and Syst., Taipei, 2010, pp. 2932–
2937.
[11] D.T. Nguyen, N.P. Nguyen, M.T. Thai, and A. Helal, “An optimal algorithm for coverage
hole healing in hybrid sensor networks,” in Proc. 7th Int. Wireless Commun. and Mobile
Comput. Conf., Istanbul, 2011, pp. 494–499.
[12] O. Banimelhem, M. Mowafi and W. Aljoby, "Genetic algorithm based node deployment in
hybrid wireless sensor networks," Commun. and Net., vol. 5, no. 4, pp. 273–279, Nov.
2013.
[13] G. Wang, G. Cao, and T. La Porta, “Movement-assisted sensor deployment,” IEEE Trans.
Mobile Comput., vol. 5, no. 6, pp. 640–652, June 2006.

64
[14] N. Hema and K. Kant, "Optimization of sensor deployment in WSN for precision irrigation
using spatial arrangement of permanent crop," in Prof. IEEE 6th Int. Conf. Contemporary
Comput., Noida, 2013, pp. 455–460.
[15] R.S. Rafi, M.M. Rahman, N. Sultana, M. Houssain, “Energy and coverage efficient static
node deployment model for wireless sensor networks,” Int. J. Sci. and Eng. Res., vol. 4, no.
4, pp. 382–387, Apr. 2013.
[16] K. Kar and S. Banerjee. “Node placement for connected coverage in sensor networks,” in
Proc. WiOpt’03: Modeling and Optimization in Mobile, Ad Hoc and Wireless Netw.,
Sophia Antipolis, 2003, pp.1–2.
[17] K. Yamamoto, H. Ozaki, T. Suzuki, T. Wada, K. Mutsuura, and H. Okada, “Barrier
coverage constructions for border security systems using wireless sensors,” in Proc. 40th
Int. Conf. Parallel Proc. Workshops, Taipei City, 2011, pp. 50–56.
[18] K. Yamamoto, H. Koyamashita, T. Wada, K. Mutsuura, and H. Okada, “Wave-type barrier
coverage for border security in wireless sensor networks,” in Prof. 7th Int. Conf. Comput.
and Convergence Tech., Seoul, 2012, pp. 78–83.
[19] M. Li, Z. Li, and A.V. Vasilakos, “A survey on topology control in wireless sensor
networks: taxonomy, comparative study, and open issues,” Proc. IEEE, vol. 101, no. 12,
pp. 2538–2557, July 2013.
[20] Y. Xu and X. Yao, “A GA approach to the optimal placement of sensors in wireless sensor
networks with obstacles and preferences,” in Proc. IEEE 3rd Consumer Commun. and
Netw. Conf., Las Vegas, NV, 2006, pp. 127–131.
[21] J. Seo, Y. Kim, H. Ryou, S. Cha, and J. Minho, “Optimal sensor deployment for wireless
surveillance sensor networks by a hybrid steady-state genetic algorithm,” IEICE Trans.
Commun., vol. E91–B, no.11, pp. 3534–3543, Nov. 2008.
[22] K. Lorincz, M. Welsh, O. Marcillo, J. Johnson, M. Ruiz, and J. Lees, “Deploying a wireless
sensor network on an active volcano,” IEEE Internet Comput., vol. 10, no. 2, pp. 18–25,
Mar. 2006.
[23] G. Tolle, J. Polastre, R. Szewcyk, D. Culler, N. Turner, S. Burgess, T. Dawson, P.
Buonadonna, D. Gay and W. Hong, “A macroscope in the redwoods,” in Proc. 3rd Int.
Conf. Embedded Netw. Sensor Syst., San Diego, CA, 2005, pp. 51–63.
[24] X. Li, X. Zhang, and B. Guo, “Application of collocated GPS and seismic sensors to
earthquake monitoring and early warning,” Sensors, vol. 13, no. 11, pp. 14261–14276, Oct.
2013.
[25] K. Känsälä and M. Korkalainen, “A versatile sensor network for urban search and rescue
operations,” in Proc. SPIE, 2011, doi:10.1117/12.898149.
[26] G. Kantor, S. Singh, R. Peterson, D. Rus, A. Das, V. Kumar, G. Pereira, and J. Spletzer,
“Distributed search and rescue with robot and sensor teams,” Field and Service Robot., vol.
24, no.1, pp. 529–538, Jul. 2006.
[27] K. Kotay, R. Peterson, and D. Rus, “Experiments with robots and sensor networks for
mapping and navigation,” Field and Service Robot., vol. 25, no. 1, pp. 243–254, Dec. 2006.

65
[28] J. Reich and E. Sklar, “Toward automatic reconfiguration of robot-sensor networks for
urban search and rescue”, in Proc. 5th Int. Conf. Auton. Agents and Multiagent Syst.,
Hakodate, 2006, pp. 18–23.
[29] E. Feo, L. Gambardella, and G.A. Di Caro, “GIS-based Mission Support System for
Wilderness Search and Rescue with Heterogeneous Agent,” in Proc. 2nd IROS Workshop
Robot. and Sensors Integration in Future Rescue Inform. Syst., Vilamoura, 2012, pp. 1–6.
[30] J. Huang, S. Amjad, and S. Mishra, “CenWits: a sensor-based loosely coupled search and
rescue system using witnesses,” in Proc. 3rd Int. Conf. Embedded Netw. Sensor Syst., San
Diego, CA, 2005, pp. 180–191.
[31] J.A. Adams, C.M. Humphrey, M.A. Goodrich, J.L. Cooper, B.S. Morse, C. Engh, and N.
Rasmussen, “Cognitive task analysis for developing unmanned aerial vehicle wilderness
search support,” J. Cognitive Eng. and Decision Making, vol. 3, no. 1, pp. 1–26, Mar. 2009.
[32] R.B. Manjula and S.S. Manvi, “Coverage optimization based sensor deployment by using
PSO for anti-submarine detection in UWASNs,” in Proc. Int. Symp. Ocean Electr., Kochi,
2013, pp. 15–22.
[33] G. Han, C. Zhang, L. Shu, N. Sun, and Q. Li, “A survey on deployment algorithms in
underwater acoustic sensor networks,” Int. J. Dist. Sensor Netw., vol. 2013, pp. 1–11, Nov.
2013.
[34] M.R. Senouci, A. Mellouk, and A. Aissani, “An analysis of intrinsic properties of
stochastic node placement in sensor networks,” in Proc. Global Commun. Conf., Anaheim,
CA, 2012, pp. 494–499.
[35] D. Pompili, T. Melodia, and I.F. Akyildiz, “Three-dimensional and two-dimensional
deployment analysis for underwater acoustic sensor networks,” Ad Hoc Netw., vol. 7, no. 4,
pp. 778–790, June 2009.
[36] G. Battistelli, L. Chisci, C. Fantacci, A. Farina, and A. Graziano, “Distributed tracking with
doppler sensors,” in Proc. IEEE 52nd Ann. Conf. Decision and Control, Florence, 2013, pp.
4760–4765.
[37] N. Deshpande, E. Grant, and T.C. Henderson, “Target-directed navigation using wireless
sensor networks and implicit surface interpolation,” in Proc. IEEE Int. Conf. Robot. and
Autom., Saint Paul, MN, 2012, pp. 457–462.
[38] N. Deshpande, E. Grant, and T.C. Henderson, “Target localization and autonomous
navigation using wireless sensor networks—A pseudogradient algorithm approach,” IEEE
Syst. J., vol. 8, no. 1, pp. 93–103, Aug. 2014.
[39] L. Lazos, R. Poovendran, and J. A. Ritcey, “On the deployment of heterogeneous sensor
networks for detection of mobile targets,” in Proc. 5th Int. Symp. Modeling and
Optimization in Mobile, Ad Hoc and Wireless Netw., Limassol, 2007, pp. 1–10.
[40] Z. Sun, P. Wang, M.C. Vuran, Z.A. Al-Rodhaan, A.M. Al-Dhelaan, and I.F. Akyildiz,
“BorderSense: Border patrol through advanced wireless sensor networks,” Ad Hoc Netw.,
vol. 9, no. 1, pp. 468–477, May 2011.
[41] R. Bellazreg, N. Boudriga, and S. An, “Border surveillance using sensor based thick-lines,”
in Proc. Int. Conf. Inform. Netw., Bangkok, 2013, pp. 221–226.

66
[42] E. Felembam, “Advanced border intrusion detection and surveillance using wireless sensor
network technology,” Int. J. Commun., Netw. and Syst. Sci., vol. 6, no. 5, pp. 251–259,
May 2003.
[43] M.R. Ingle and N. Bawane, “An energy efficient deployment of nodes in wireless sensor
network using Voronoi diagram,” in Proc. 3rd Int. Conf. Electr. Comput. Tech.,
Kanyakumari, 2011, pp. 307–311.
[44] N. Rahmani and F. Nematy, “EAVD: An evolutionary approach based on Voronoi diagram
for node deployment in wireless sensor networks,” in Proc. Int. Conf. Soft Comput. for
Problem Solving, Roorkee, 2011, pp. 121–129.
[45] H. Xiang, L. Peng, G. Liu, and C. Tang, “Multiple target coverage considering area
coverage in visual sensor networks,” Appl. Res. Comput., vol. 29, no. 9, pp. 3428–3431,
Sep. 2012.
[46] R. Mathur, M.K. Sharma, A. Misra, and D. Baveja, “Energy-efficient deployment of
distributed mobile sensor networks using fuzzy logic systems,” in Proc. Int. Conf.
Advances in Comput., Control and Telecomm. Tech., Trivandrum, 2009, pp. 121–125.
[47] K. Akkaya and A. Newell, “Self-deployment of sensors for maximized coverage in
underwater acoustic sensor networks,” Comput. Commun., vol. 32, no.7–10, pp. 1233–
1244, May 2009.
[48] G. Wang, G. Cao, T. La Porta, and W. Zhang, “Sensor relocation in mobile sensor
networks,” in Proc. IEEE 24th Int. Annu. Joint Conf. Comput. and Commun. Societies,
Miami, FL, 2005, pp. 2302–2312.
[49] P.T. Mahida, R. Patel, P. Patel, and S. Mody, “Performance evaluation of dynamic and
static sensor node in wireless sensor network,” Indian J. Comput. Sci. and Eng., vol. 4, no.
1, pp. 23–28, Feb. 2013.
[50] K. Baumgartner, S. Ferrari, and T.A. Wettergren, “Robust deployment of dynamic sensor
networks for cooperative track detection,” IEEE Sensors J., vol. 9, no. 9, pp. 1029–1048,
Sep. 2009.
[51] P. Alvarado, T. Taher, H. Kurniawati, and G. Weymouth, “A coastal distributed
autonomous sensor network,” in Proc. OCEANS’11 MTS/IEEE Conf., Kona, HI, 2011, pp.
1–8.
[52] N. Xia, Y. Zheng, H. Du, C. Xu, and R. Zheng, “Rigidity driven underwater sensor self-
organized deployment,” Chinese J. Comp., vol. 36, no. 3, pp. 494-505, Mar. 2014.
[53] N. Xia, C.S. Wang, R. Zheng, and J.G. Jiang, “Fish swarm inspired underwater sensor
deployment,” Acta Automatica Sinica, vol. 38, no. 2, pp. 295–302, Dec. 2012.
[54] N. Aitsaadi, N. Achir, K. Boussetta, and G. Pujolle, “Differentiated underwater sensor
network deployment,” in Proc. OCEANS’07 IEEE Conf., Aberdeen, 2007, pp. 1–6.
[55] P.V. Teixeira, D.V. Dimarogonas, K.H. Johansson, and J. Sousa, “Event-based motion
coordination of multiple underwater vehicles under disturbances,” in Proc. OCEANS’10
IEEE Conf., Sydney, 2010, pp. 1–6.

67
[56] G.A. Hollinger, U. Mitra, and G.S. Sukhatme, “Autonomous data collection from
underwater sensor networks using acoustic communication,” in Proc. IEEE/RSJ Int. Conf.
Intell. Robots and Syst., San Francisco, CA, 2011, pp. 3564–3570.
[57] A. Shukla, G. Ojha, S. Acharya, and S. Jain, “A customized flocking algorithm for swarms
of sensors tracking a swarm of targets,” in Proc. 2nd Int. Conf. Advanced Inform. Tech. and
App., Dubai, 2013, pp. 171–183.
[58] A. Macwan, G. Nejat, and B. Benhabib, “Target-motion prediction for robotic search and
rescue in wilderness environments,” IEEE Trans. Syst., Man Cybern. B, Cybern., vol. 41,
no. 5, pp. 1287–1298, Oct. 2011.
[59] D. Heth and E.H. Cornell, “Characteristics of travel by persons lost in Albertan wilderness
areas,” J. Environmental Psychology, vol. 18, no. 3, pp. 223–235, Sep. 1998.
[60] A. Macwan, J. Vilela, G. Nejat, and B. Benhabib, “Use of iso-probability curves in multi-
robot deployment for wilderness search and rescue,” Int. J. Robot. and Autom., no. 206–
4366, pp. 1–7, July 2015.
[61] A. Macwan, J. Vilela, G. Nejat, and B. Benhabib, “A multirobot path-planning strategy for
autonomous wilderness search and rescue,” IEEE Trans. Syst., Man Cybern. B, Cybern.,
vol. 45, no. 9, pp. 1784–1797, Nov. 2014.
[62] S. Ding, C. Chen, J. Chen, and B. Xin. "An improved particle swarm optimization
deployment for wireless sensor networks," J. Advanced Comput. Intell. and Intell. Inf., vol.
18, no. 2, pp. 107–112, Mar. 2014.
[63] S. He, E. Prempain, and Q.H. Wu, “An improved particle swarm optimizer for mechanical
design optimization problem,” Eng. Optimization, vol. 36, no. 5, pp. 585–605, Mar. 2004.
[64] G. Tuna, T.V. Mumcu, K. Gulez, V.C. Gungor, and H. Erturk, “Unmanned aerial vehicle-
aided wireless sensor network deployment system for post-disaster monitoring,” Emerging
Intell. Comput. Tech. and Appl., vol. 304, no. 1, pp. 298–305, July 2012.
[65] J. Ng and T. Bräunl, “Performance comparison of bug navigation algorithms,” J. Intell.
Robot. Syst., vol. 50, no. 1, pp. 73–84, Sep. 2007.