
A driver model for vehicle lateral dynamics - KAISTacl.kaist.ac.kr/Thesis/2011_IJVD.pdf · A driver...
32
Int. J. Vehicle Design, Vol. 56, Nos. 1/2/3/4, 2011 49 Copyright © 2011 Inderscience Enterprises Ltd. A driver model for vehicle lateral dynamics Chulwoo Moon* Intelligent System Research Laboratory, Korea Automotive Technology Institute, 74 Yongjung-Ri, Pungse-Myun, Chonan 330-912, South Korea E-mail: [email protected] *Corresponding author Seibum B. Choi Department of Mechanical Engineering, Korea Advanced Institute of Science and Technology, Science town, Daejeon 305-701, South Korea E-mail: [email protected] Abstract: There have been several studies aiming to develop a realistic driver model in accordance with the increased interest in vehicle safety issues and in computer simulation for a vehicle design. This study is especially considering the human driver’s steering process; path planning, feed-forward steering, and preview feedback steering. Important human factors, such as the view angle and the neuromuscular system, are also regarded. The suggested driver model is simulated based on the CarSim vehicle model in a Simulink environment. The simulation results are then compared to the actual vehicle test data and to the driving simulator test data with regard to the four human driver levels. The driver model suggested in this study represents the human steering behaviour and well matches the real vehicle test data. Keywords: driver model; target path planning; human driving behaviour; vehicle lateral dynamics; steering process; neuromuscular system; view angle. Reference to this paper should be made as follows: Moon, C. and Choi, S.B. (2011) ‘A driver model for vehicle lateral dynamics’, Int. J. Vehicle Design, Vol. 56, Nos. 1/2/3/4, pp.49–80. Biographical notes: Chulwoo Moon received a BS in Mechanical Engineering from Hanyang University, Korea, in 2006, and an MS in Automobile Technology from Korea Advanced Institute of Science and Technology (KAIST), Korea, in 2008. Currently, he is with Korea Automotive Technology Institute (KATECH), Korea, where he is working on the development of intelligent vehicle chassis control systems. Seibum B. Choi received a BS in Mechanical Engineering from Seoul National University, Korea, an MS in Mechanical Engineering from Korea Advanced Institute of Science and Technology, Korea, and a PhD in controls from the University of California, USA, in 1993. From 1993 to 1997, he worked on the development of automated vehicle control systems at the Institute of Transportation Studies at the University of California, Berkeley. From 1997 to 2006, he worked on the development of advanced vehicle braking
Transcript of A driver model for vehicle lateral dynamics - KAISTacl.kaist.ac.kr/Thesis/2011_IJVD.pdf · A driver...

Int. J. Vehicle Design, Vol. 56, Nos. 1/2/3/4, 2011 49
Copyright © 2011 Inderscience Enterprises Ltd.
A driver model for vehicle lateral dynamics
Chulwoo Moon* Intelligent System Research Laboratory, Korea Automotive Technology Institute, 74 Yongjung-Ri, Pungse-Myun, Chonan 330-912, South Korea E-mail: [email protected] *Corresponding author
Seibum B. Choi Department of Mechanical Engineering, Korea Advanced Institute of Science and Technology,Science town, Daejeon 305-701, South Korea E-mail: [email protected]
Abstract: There have been several studies aiming to develop a realistic driver model in accordance with the increased interest in vehicle safety issues and in computer simulation for a vehicle design. This study is especially considering the human driver’s steering process; path planning, feed-forward steering, and preview feedback steering. Important human factors, such as the view angle and the neuromuscular system, are also regarded. The suggested driver model is simulated based on the CarSim vehicle model in a Simulink environment. The simulation results are then compared to the actual vehicle test data and to the driving simulator test data with regard to the four human driver levels. The driver model suggested in this study represents the human steering behaviour and well matches the real vehicle test data.
Keywords: driver model; target path planning; human driving behaviour; vehicle lateral dynamics; steering process; neuromuscular system; view angle.
Reference to this paper should be made as follows: Moon, C. and Choi, S.B. (2011) ‘A driver model for vehicle lateral dynamics’, Int. J. Vehicle Design,Vol. 56, Nos. 1/2/3/4, pp.49–80.
Biographical notes: Chulwoo Moon received a BS in Mechanical Engineering from Hanyang University, Korea, in 2006, and an MS in Automobile Technology from Korea Advanced Institute of Science and Technology (KAIST), Korea, in 2008. Currently, he is with Korea Automotive Technology Institute (KATECH), Korea, where he is working on the development of intelligent vehicle chassis control systems.
Seibum B. Choi received a BS in Mechanical Engineering from Seoul National University, Korea, an MS in Mechanical Engineering from Korea Advanced Institute of Science and Technology, Korea, and a PhD in controls from the University of California, USA, in 1993. From 1993 to 1997, he worked on the development of automated vehicle control systems at the Institute of Transportation Studies at the University of California, Berkeley. From 1997 to 2006, he worked on the development of advanced vehicle braking

50 C. Moon and S.B. Choi
control systems. From 2006 to 2008, he worked as an Associate Professor at the Graduate School of Automobile Technology at KAIST. Currently, he is an Associate Professor of the Department of Mechanical Engineering at KAIST.
1 Introduction
Car manufacturers are investing much effort into improving the dynamic behaviour of the vehicles that they manufacture. A virtual driving test consisting of road-vehicle-driver models has been considered cost-efficient replacement or enhancement of the real driving test. The virtual driving test can help automotive researchers analyse general vehicle performance without prototyping and/or actual tests. The increased importance of vehicle safety issues has led automotive researchers to develop greater interest in the virtual driving test. Especially, the interaction between a human driver and a vehicle is one of the most critical elements of driving safety. There is a great demand for a driver model that behaves like a real human driver as it is especially useful for the development of active safety systems or for vehicle limit-performance assessment.
Many studies have been conducted regarding the requirements of a good driver model. The main purposes of studying driver models are to understand human drivers and to reproduce their behaviour. Ashkens and McRuer (1962) and McRuer (1980) have proposed two models: a structural isomorphic model of the man-machine system, and a cross-over model. The structural model of the man-machine system attempts to account for many of the subsystem aspects of the human controller as well as the total input-output behaviour. The cross-over model, on the other hand, points out that a transfer function of a stable closed-loop system will produce a slope of –20 dB/decade around a cross-over frequency. Both these models have guided many researchers in understanding human-driver behaviour. Allen et al. (1987, 1996, 2002) has divided human steering characteristics into pursuit and compensatory behaviour. The pursuit behaviour steering command is determined as the driver recognises a road curvature independent of errors from a desired road, while the compensatory action is related to the efforts at eliminating errors like lane or speed deviation. MacAdam (1980, 1981) has suggested an optimal preview control framework for linear systems. In his model, the steering command, which minimises the quadratic cost function described in equation (1), is solved with respect to the state equation of a vehicle model.
{ }2opt ( ) min [( ( ) ( )) ( )]d .
t Tp
dtu t y y tη η δ η η
+= − − (1)
The model representing normal drivers’ behaviour has been considered as a state-of-the-art driver model and is being implemented in the commercial software CarSim. Ungoren and Peng (2005) have tried to modify the cost function used in such framework. As the driver model is quite flexible, it can represent different driver behaviours. A driver model has been also presented as a transfer function by Hess and Modjtahedzadeh (1990). In his study, he expanded the application of the theoretical model that was first applied to the aerospace research field to include the automotive field. A hybrid model was also proposed by Kiencke et al. (1999), Kiencke and Nielsen

A driver model for vehicle lateral dynamics 51
(2005). This model describes the human-perception process as consisting of discrete events. Since recently, many researchers (MacAdam and Johnson, 1996; Kraiss and Kuttelwesch, 1990, 1992; Fujioka et al., 1991; Shim, 1993) have shown an interest in neural network structures to represent human driving behaviour. Owing to the recognition of the problems of using a single preview point, a two-level control strategy (Donges, 1978; Land and Horwood, 1995; Salvucci and Gray, 2004) has been suggested. In such studies, steering is described as a two-level control strategy that uses both ‘near’ and ‘far’ regions of the road to achieve successful navigation. A multi-preview concept has been presented by Sharp et al. (2000). This model tries to solve the problem of the single preview point approach by using multi-preview points: a short preview distance, which leads to poor control stability, and a long preview distance, which causes excessive tracking errors.
Although many driver models have been developed, no unified driver model exists to this day. For the development of a realistic driver model, the human steering process is analysed in this study. Several requirements are defined to mimic the real human steering process, to consider significant human factors, and to reflect the human steering characteristics at all experience levels. Considering these requirements, real human steering control is defined as the process of target path planning, feed-forward steering, and feedback steering. The human factors (McRuer, 1980; KMCT Research Report, 2001; Cho, 1995) considered in the suggested driver model are the viewing angle and the neuromuscular system response. The combination of the steering process sub-models considering the human factors is simulated with CarSim in a Simulink environment. The simulation results are compared to the actual vehicle test data and to the driving simulator test data for ISO lane change manoeuvre at four different levels of human driving skills: professional, experienced, intermediate, and low skilled. The actual vehicle tests were performed on a proving ground by a professional test driver. For the data regarding normal drivers, a driving simulator was configured, and 21 drivers participated in the simulation. The scope of this study is limited to the development of the driver control model for vehicle lateral dynamics.
2 Human steering process
2.1 Weighting strategy
Most driver models utilise single-preview point information. This particular feature is considered unrealistic and unsatisfactory; the preview information is inappropriate if the preview point is too far from the vehicle, and vehicle control becomes unstable if the preview point is too close to the vehicle. Due to the problems of the single-preview point based steering model, an algorithm using multi-preview points is considered.
This idea departs from the classical method of classifying the skill level using only one preview distance or time. All drivers can take the same visual information, but the more experienced drivers tend to focus more on the father-preview information while the less experienced ones tend to focus more on the closer-preview information (see Figure 1). Therefore, drivers are classified based on the different weighting tendencies of their multi-preview points. The different weighting tendencies can be expressed by the different weighting factors of the multi-preview points. The weighting factors are referred to as Ki. The summation of the Kis must be equal to 1.

52 C. Moon and S.B. Choi
1.n
ii
K = (2)
Although the weighting values for each preview point are given, such values are not always constant for the whole course of driving. The weighting values change in proportion to the road curvature. For example, an experienced driver switches his preview point concentration from the farther to the closer distance if the road curvature becomes larger. This concept is referred to as a weighting strategy and is shown in Figure 2 for each skill level.
Figure 1 Driver preview weighting tendencies (see online version for colours)
Figure 2 Weighting strategy of feed-forward steering for a curve (see online version for colours)
Human drivers’ adaptation characteristics in relation to their perception of curvature variation were also investigated in this study. Human drivers quickly respond to an upcoming curve but are less alert in terms of escaping a curve. This characteristic can be described mathematically as the fast-rising and slow-falling slew rate limitations of the actual curvature variations. The rising slew rate is supposed to be higher than the falling slew rate. There must also be a curvature value threshold since human drivers do not change the weightings infinitely as the curvature becomes higher. The threshold is regarded to apply to abnormal situations. It should be noted that the curvature is sensed at multi-preview points, and that the sensed curvatures are summed up after being weighted. Thus, the weighted curvature affects the weighting strategy.

A driver model for vehicle lateral dynamics 53
2.2 Target path planning
Human drivers do not try to follow the road’s centre line when entering a curve. They immediately plan their own path to follow, called ‘target path.’ After re-planning the path, the target path becomes a new reference to follow. Although the target path should be different for individual drivers, there is a common tendency among drivers to drive through a curve smoothly. This means that drivers not only want to drive with less lateral acceleration but also want to cover the shortest distance when cornering. A highway engineering study (Krammes et al., 1995) reports that drivers control their speed to achieve the acceptable lateral acceleration level of 0.2~0.4 g’s. Another study (Allen et al., 1997) shows that drivers control their acceleration or braking to keep their cornering lateral acceleration within the range of 0.3~0.5 g’s. Therefore, it is clear that there is an effort on the part of drivers to keep their lateral accelerations within the acceptable level. This effort can be referred to as ‘target path planning’ – modifying a given path to make it smoother without speed control. Drivers also want to cover the shortest distance as much as possible. Thus, target path planning can be regarded as a kind of road-smoothing procedure. For path planning, MacAdam (2001) applied a moving average filter. Sharp et al. (2000) estimated the ideal path by starting from a known curvature function of the path and integrating it twice to obtain the other parameters.
In this study, a new road-smoothing concept that is analogous to the target path planning of human drivers is conceived. Figure 3 shows how the target path is defined. Human drivers define their target path based on the condition of the preview location, depicted as B in Figure 3. The preview distance from the driver (A) to the preview point (B) is depicted as L. The preview distance L is not a constant, and is usually defined as a function of the vehicle speed, road curvature and other environmental conditions. For a given preview distance L and the trajectory of point B, which is assumed to follow the centre line of the road, the path of point A is defined. The trajectory made by the path of point A is the shortest travelling distance around the road trajectory under the holonomic constraint that the instant velocity of point A is parallel to the line connecting points Aand B. The result is that point A makes the shortest and smoothest travelling trajectory under the given constraint conditions. The resulting trajectory seems to match well the target path conceived by most human drivers.
Figure 3 Target path planning (see online version for colours)
54 C. Moon and S.B. Choi
Assuming that point B is moving on the road’s centre line at a given speed VB, the trajectory of point A can be calculated as follows. Defining VB and VA as the velocity vectors at the preview (B) and the vehicle (A) points, respectively, and LB and LA as the distances from A and B to an instantaneous centre of rotation, the angular velocity r can be described as follows:
B
B
VrL
= (3)
A
A
VrL
= (4)
under the geometric condition
tan( ).AA
LL
δ= (5)
Since the angle δA formed by LB and LA is equal to θ – ψ, LA can be computed as follows:
1 1
tan{ }
.dtan tan tand
A
B B A
B B A
LL
Ly y yx x x
θ ψ
− −
=−
=−−−
(6)
Under the geometric condition, LB can be represented as follows:
2 2 .B AL L L= + (7)
For a given speed VB, the amplitude of VA can be obtained by combining equations (3) and (4) as follows:
.BA A
B
VV L
L= (8)
Then, VA can be represented as follows:
( ) cos( )A x AV V ψ= ⋅ (9)
( ) sin( ).A y AV V ψ= ⋅ (10)
The path of point A can be obtained by integrating VA as follows:
cos( )dA Ax V tψ= ⋅ (11)
sin( )d .A Ay V tψ= ⋅ (12)
The target trajectory of vehicle A is determined by several given conditions: the velocity at target point B (VB), preview distance L, and the road profiles represented as yB = f(xB).As a result, different target paths can be generated by varying the above parameters.

A driver model for vehicle lateral dynamics 55
The defined target trajectory becomes smoother with a larger L. Here, length L can be a parameter for the classification of individual drivers because more experienced drivers plan smoother target paths than the less experienced ones do. Distance L can be defined as a function of the vehicle speed and preview time, as follows:
( ).pL f V t= ⋅ (13)
After considering the weighting strategy, the target path can finally be defined as follows:
1( , ) { ( , ) }
n
A A i A A ii
x y K x y=
= ⋅ (14)
where (xA, yA)i is a target path defined using the ith preview point. The planned vehicle trajectory is smoother and shorter than the one made by the
road’s centre line. The planned trajectory well represents the driver’s tendency to cover the shortest distance under the moderate and smooth lateral accelerations. This tendency will be examined and verified in Section 4.
2.3 Feed-forward steering
Human drivers estimate the steering wheel angle to control the vehicle based on the visual information regarding the upcoming curves, and the drivers issue a control command in advance. This action can be called ‘feed-forward steering’. The feed-forward behaviour is obviously independent of vehicle tracking errors. Allen et al. (1987, 1996, 2002) called this behaviour ‘pursuit behaviour’. Pursuit behaviour is based on the perception of an upcoming horizontal road curvature, and the driver can match the curvature with the appropriate steering angle command. The feed-forward steering angle for the suggested driver model is represented as follows:
SFF ( )ff APK C a bδ = ⋅ ⋅ + (15)
where KSFF is a feed-forward gain applied to the road curvature, CAP the road curvature at the preview target point, and (a + b) the vehicle’s wheelbase. Donges (1978) also explained this behaviour using a two-level control strategy.
For the feed-forward steering shown in Figure 4, the view angle corresponding to the vehicle speed is considered. A research report by the Korea Ministry of Construction & Transportation (2001) verified experimentally that the view angle is a function of the vehicle speed. In the research report, the view angle is defined as follows:
view 156.17 1.194 .xVθ∆ = − (16)
The report agrees with Kawczynski’s study (1994) on the relations of vehicle speed, view angle, and preview distance. Defining the view angle as ∆θview and vehicle’s yaw angle as
, the x coordinate of the ith preview point can be represented as follows:
viewcos2i o
ix L xn
θ ψ∆= + + (17)
where n is the total number of preview points.

56 C. Moon and S.B. Choi
Figure 4 Vehicle-road geometry for feed-forward steering (see online version for colours)
Once xi is obtained, the y coordinate of the aiming point (yi) corresponding to xi can be found along the road trajectory. If θ i is defined as shown in equation (18), the feed-forward steering angle for the ith preview point can be obtained by subtracting the yaw angle of the vehicle from angle θ i as shown in equation (19):
1tan ii
i
y yx x
θ − −=
− (18)
( ) .ff i iδ θ ψ= − (19)
The total feed-forward angle is determined by the weighted summation of the feed-forward steering angles defined on the multi-preview points:
1{ ( ) }.
n
ff i ff ii
Kδ δ=
= ⋅ (20)
Then, the final feed-forward steering angle input command is determined as shown in equation (21) after being multiplied by the specific steering gear ratio rs of the vehicle:
.ff ff srδ δ= ⋅ (21)
2.4 Feedback steering
No one can follow a designated path using only the estimated feed-forward steering action without an error feedback. Some tracking errors from the target path always exist and human drivers respond to such errors. Allen et al. (1987, 1996, 2002) called this behaviour ‘compensatory action.’ Even though human drivers depend more on feed-forward steering, they try to eliminate the errors recognising these. Feedback control for vehicle lateral dynamics has been studied in the autonomous vehicle research fields. Based on the classical linearised bicycle model shown in Figure 5, Choi (2000) defined a PD type steering controller as follows:
2
1( ) .(2 )f
n n
sV d d
δςω ω
=+
(22)

A driver model for vehicle lateral dynamics 57
Figure 5 Bicycle model of vehicle lateral dynamics
Considering the characteristics of human driving, equation (22) is modified by inserting the following integration term therein:
1( ) Ifb p D
ks k k s d
V sδ = + + (23)
where the lateral offset from the desired path at the ith preview point (di) of the road’s centre line is defined as follows:
1 2 1 2tan( )ii id e L e e L en n
= + ⋅ ⋅ ≅ + ⋅ ⋅ (24)
1 { ( des )}de y V tψ ψ⊥ ⊥= + − (25)
2 des .e ψ ψ= − (26)
Then, the total lateral offset (d) is determined by the weighted summation of the lateral offsets on the multi-preview points:
1{ }.
n
i ii
d K d=
= ⋅ (27)
2.5 The neuromuscular system
The neuromuscular system should be considered because human drivers have control time delay. The dynamic characteristics from visual perception to muscular movement are as illustrated in Figure 6. The neuromuscular system dynamics was modelled using the transfer functions of various orders. McRuer (1980) defined it in the third order, Allen et al. (2002) in the second order, and Cho (1995) further simplified it into the first order. In this study, the neuromuscular system is defined as a third order transfer function with a pure time delay and a phase lag, as follows:
3
neuro 2 2(1 )( 2 1)
T
h w w
Ke dTFT s T s T sς
−
=+ + +
(28)
where Td is the pure time delay, Th the phase lag time constant, Tω the inverse of the natural frequency (T↓w ≡ 1/ω↓n), and the damping coefficient of the system response.

58 C. Moon and S.B. Choi
Figure 6 Reaction process of the neuromuscular system (see online version for colours)
In this study, it is assumed that the neuromuscular system affects only the feedback steering input since the feed-forward steering input should already include the effects of the neuromuscular system response. Consequently, the final feedback steering input is calculated as shown in equation (29).
*neuro .fb fbTFδ δ= (29)
2.6 Concluding remarks
In this section, the human steering process was considered. The target path planning scheme was modelled as the process of searching for the shortest travel distance while satisfying certain holonomic constraints. The feed-forward steering controller was developed by using multi-preview points and considering the driver’s view angle. A PID-type steering controller was considered for the driver’s feedback steering control behaviour. The combination of the developed steering sub-model is as shown in Figure 7. The driver parameters that appear in this section will be considered in the following section (Section 3).
Figure 7 Block diagram of a driver model for lateral dynamics
3 Driver parameters
3.1 Preview time (Tp)
It is widely believed that the preview distance is proportional to the vehicle speed. Thus, the preview distance is often represented as a function of time and speed. Through many

A driver model for vehicle lateral dynamics 59
previous studies, it has been established that a preview time of roughly 0.5–2.0 s is used by most human drivers.
3.2 The neuromuscular system (TFneuro)
A simple driver response test was performed by 11 drivers for the modelling of the neuromuscular system, and each parameter was obtained through the recursive parameter estimation method. The experiment results from the drivers and the response of the corresponding transfer function are shown in Figure 8. Since the variation of each parameter is small, the averaged values are applied to all skill levels: 0.206 for the pure time delay (Td), 0.0668 for the lag constant (Th), 25.55 for the natural frequency (ωn), and 0.7475 for the damping coefficient ( ).
Figure 8 Step responses of drivers and the parameters of the equivalent estimated transfer function (see online version for colours)
3.3 Weighting strategy (Ki and iK )
As discussed in Section 2.2, individual drivers weight the same visual preview information differently. This concept is used to classify general drivers with different driving experience levels. Moreover, the weighting values are changed linearly from Kisto iK s as the road curvature is changed at the farthest preview point. iK s are the gains for a low curvature normal driving condition, and iK s for a large curvature abnormal condition.
3.4 Curvature limit (κlimit)
The curvature limit is the threshold value for the weighting of the multi-preview points. There are two curvature limits: the lower and the upper limits. The lower limit of the curvature is obviously fixed at 0. The upper limit of the curvature is defined as the curvature that is high enough to be declared an abnormal situation. Therefore, the threshold that determines either a normal or an abnormal situation is defined as the upper limit of the curvature for individual drivers.

60 C. Moon and S.B. Choi
limit
limit
i for normal situation if .
ii for abnormal situation if κ κ
κ κ≤
> (30)
3.5 Usage of feed-forward steering (κff)
The usage of feed-forward steering is the most important driver parameter for the classification of the skill level of human drivers in this study. The basic idea of the classification scheme is that the more skilled drivers use feed-forward steering more often than the less skilled ones do. Consequently, the usage of feed-forward steering by the more skilled drivers is expected to be higher than that by the less skilled ones. Once the usage of feed-forward steering is defined, the usage of feedback steering will be automatically determined by the following condition:
1ff fbK K+ = (31)
where Kff and Kfb are the weighting factors between the feed-forward and feedback controls. Therefore, the final steering angle command can be expressed as follows:
(1 ) .ff ff ff fbK Kδ δ δ= + − (32)
The driver parameters of the suggested driver model are listed and described in Table 1.
Table 1 List of driver parameters
Parameter Unit Description Tp sec Preview time for target path planning
Ki – Weightings on the multi preview points for feed-forward steering in a normal situation
iK – Weightings on the multi preview points for feed-forward steering in an abnormal situation
κlimit 1/m Curvature limit for the feed-forward weighting strategy and defining a normal/abnormal situation
Td sec Pure time delay for the neuromuscular system Th sec Time constant for the neuromuscular system
n 1/sec Natural frequency for the neuromuscular system – Damping coefficient for the neuromuscular system
Kff – Weightings on feed-forward steering for the final steering command
4 Experimental verification
4.1 Configuration of the driving simulator
A man-in-the loop driving simulator was configured to investigate the driving characteristics of normal drivers using the commercial software Carsim 6.03-RT for the vehicle model and visualisation, RT-lab and QNX for real-time processing, the NI-6071E PCE board for data acquisition, the CTP position sensor for measuring the steering angle, and an NEC beam projector to display the road profile.

A driver model for vehicle lateral dynamics 61
4.2 Driver response test
Two electric circuit boards are configured to light the LEDs on each side of the 15.4 inch LCD. In this test, the driver did not know when and on which side the LED was to be lighted. Eleven people participated in the experiment. The drivers were supposed to steer from 0 to 90 degrees as soon as one of the LEDs was lighted while driving under normal conditions (see Figure 9).
Figure 9 Driver response test for neuromuscular-system modelling (see online version for colours)

62 C. Moon and S.B. Choi
4.3 Comparison of human drivers and the driver model
In this section, the performance of the developed driver model is compared to that of human drivers. The driver model was implemented in conjunction with CarSim, the reasonably well-validated commercial vehicle dynamics simulation software. This simulation software has the complete model of lateral and longitudinal dynamics, including suspension, engine, and powertrain. In this study, the target vehicle is a typical intermediate-sized sedan included in the CarSim database.
The test courses were for the single- and double-lane-change manoeuvres illustrated in Figures 10 and 11. The vehicle was supposed to enter the test courses at 80 km/h to maintain the same speed for all the courses. These kinds of severe lane-change manoeuvre are often used for the study of environment, vehicle, and driver response interactions. The driver parameters are supposed to be adjusted by examining the sub-models of the steering process: target path planning, feed-forward steering and feedback steering.
Figure 10 Road profile for single-lane-change manoeuvre (see online version for colours)
Figure 11 Road profile for ISO double-lane-change manoeuvre (see online version for colours)
First, the target path planning scheme was examined to vary the preview time. Figure 12 shows the different target paths that are created for the same given road centre line as the preview time Ttarg is varied. It shows that the longer preview time gives a smoother and shorter target path. It should be noted that a single preview point was used for this examination.

A driver model for vehicle lateral dynamics 63
Figure 12 Different target paths obtained by varying the preview time for ISO lane-change manoeuvres (see online version for colours)
Second, the feed-forward steering scheme was examined while applying each weighting strategy, from the low skilled to the experienced. As shown in Figures 13 and 14, the vehicles are tracking the path well, but the steering wheel angle input becomes smoother as the driver preview model concentrated more on the farther distance. This result agrees with the observed tendency of less skilled drivers to steer more aggressively. Even though feed-forward steering can represent human steering behaviour, feedback steering control is necessary since there must be some corrections for abnormal road conditions, such as a banked road surface. As shown in the following figures, a banked road causes tracking offset errors from the target path.
Figure 13 Vehicle trajectories and steering wheel angle input of single-lane-change manoeuvre using only feed-forward steering (see online version for colours)

64 C. Moon and S.B. Choi
Figure 13 Vehicle trajectories and steering wheel angle input of single-lane-change manoeuvre using only feed-forward steering (see online version for colours) (continued)
Figure 14 Vehicle trajectories and steering wheel angle input of double-lane-change manoeuvre using only the feed-forward steering algorithm (see online version for colours)
Third, feedback steering using single-preview point responses was examined for the varying preview distance of 4–10 m at a 2 m interval. As shown in Figures 15 and 16, the vehicle tracks the path well. The longer preview distance makes vehicle control more stable. It should be noted, however, that the steering wheel angle inputs

A driver model for vehicle lateral dynamics 65
of the feedback steering controller are inappropriate for representing human steering behaviour. Moreover, neuromuscular system dynamics is not applied yet in this examination.
Figure 15 Vehicle trajectories and steering wheel angle input of single-lane-change manoeuvre using only the feedback steering algorithm (see online version for colours)
Figure 16 Vehicle trajectories and steering wheel angle input of double-lane-change manoeuvre using only the feedback steering algorithm (see online version for colours)

66 C. Moon and S.B. Choi
Figure 16 Vehicle trajectories and steering wheel angle input of double-lane-change manoeuvre using only the feedback steering algorithm (see online version for colours) (continued)
It is now clear that it is not sufficient to represent human steering behaviour using either only feed-forward or feedback steering. It is also observed that the steering command of feed-forward steering control starts earlier than that of feedback steering control. This means that the feed-forward steering controller is activated prior to the feedback steering controller. The suggested driver model uses both steering commands, with appropriate weighting strategies to represent a realistic human steering behaviour. One of the main objectives of the validation work is to verify that the driver model adjusted to single-lane-change manoeuvre is also appropriate for double-lane-change manoeuvre.
The simulation result of the driver model for the professional level is compared to the actual driving test data for several lane-change manoeuvres. An actual test was performed by a professional test driver, and the test data were taken twice for each manoeuvre. The maximum preview time of 1 s with five multi-preview points was used for the simulation. One weighting strategy is used through target path planning, feed-forward steering control, and feedback steering control. The weighting strategy for the professional level is shown in Table 2. The professional driver’s usage of the feed-forward steering weighting factor is 0.9 as they have taken the test many times and are well aware of how to make the path. The variation of the weightings on the multi-preview points is shown in Figures 17 and 18. The driver model changes the weightings as the weighted road curvature is varied, and the weightings are saturated as soon as the curvature at the farthest-preview point is sensed to be abnormal. The weightings between Ki to iK change quickly when the curvature at the preview point is becoming higher, but they change slowly when the curvature is becoming lower, as human drivers generally do in curves. In this study, the curvature for an abnormal situation, κlimit, is set to be 0.005 (1/m). As shown in Figure 17, the range of the steering wheel angles is from –30 to +30 degrees for single-lane-change manoeuvre. As shown in Figure 18, the actual test data for double-lane-change manoeuvre show the tendency in which the range of the steering heel angles for the first lane change – –40 to +40 degrees – is smaller than the one for the second lane change – –50 to +50 degrees. The suggested driver model represents those tendencies very well. The same driver model tuned for professional drivers is used for both single- and double-lane-change manoeuvres.

A driver model for vehicle lateral dynamics 67
Figure 17 Comparison of the driver model performance and the results of actual tests onsingle-lane-change manoeuvre (see online version for colours)

68 C. Moon and S.B. Choi
Figure 18 Comparison of the driver model performance and the results of actual tests ondouble-lane-change manoeuvre (see online version for colours)
A driver model for vehicle lateral dynamics 69
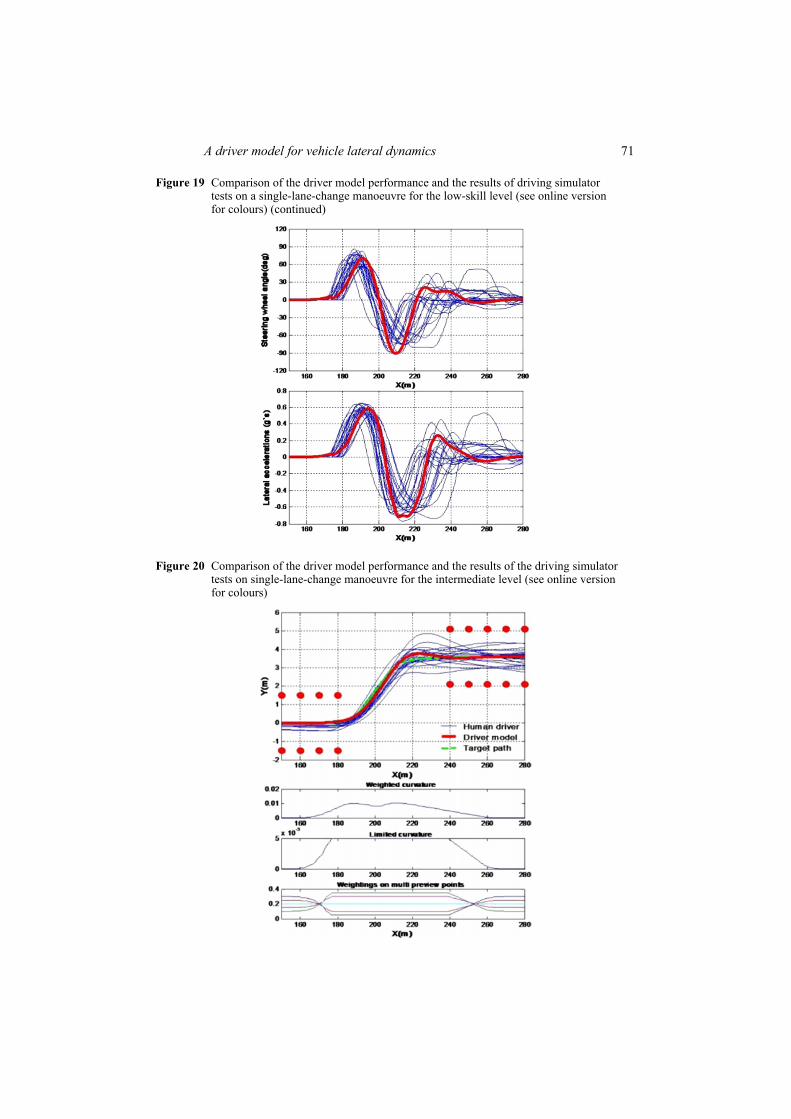
Driving simulator tests were performed with 21 test drivers: seven test drivers each for the less skilled, the intermediate and the experienced levels. The drivers are classified based on their driving experiences: the low skilled, who do not have their own car and who have driven for less than a month; the intermediate, who do not have their own car and who have driven for less than two years, or who own a car and have driven for less than one year; and the experienced, who own a car and have driven for more than one year. For each driver, three times of driving were recorded for each course after 10 times of pre-driving to learn the courses.
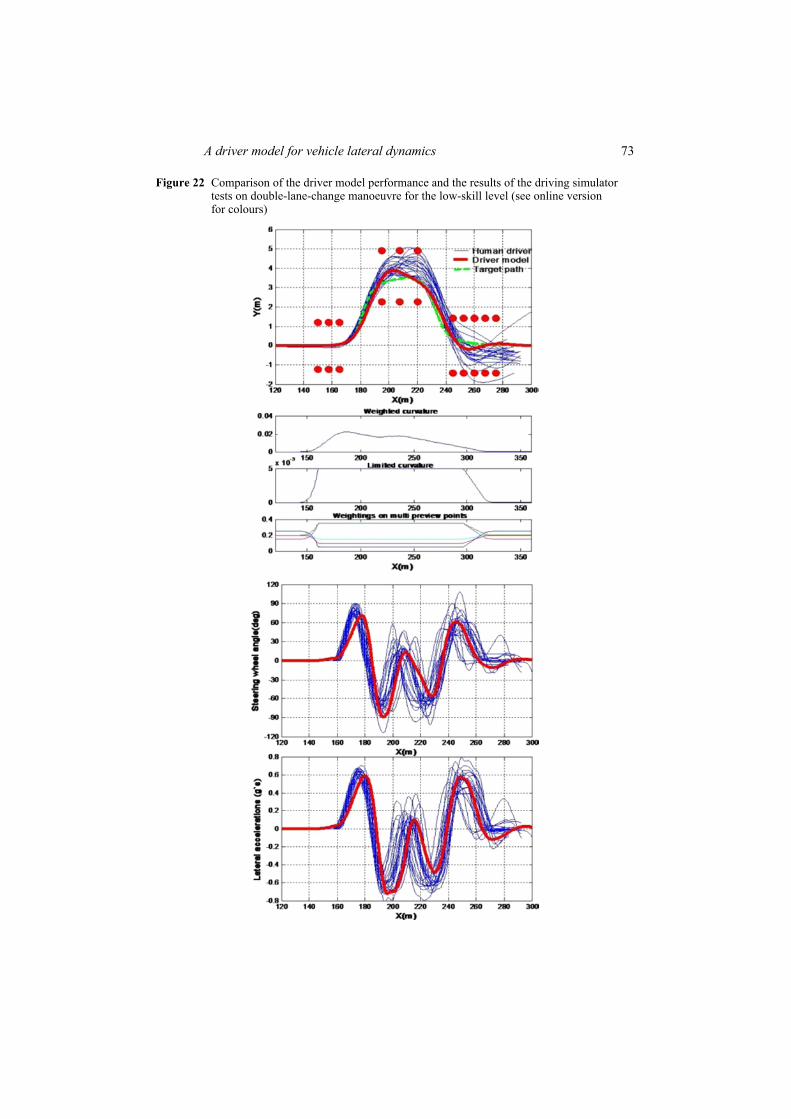
During the driving simulator tests of lane-change manoeuvres, different changing rates were observed. For the single-lane-change manoeuvre, the rate was found to be 0.2[m/m] for the low skilled, 0.14 for the intermediate, and 0.12 for the experienced. For the double-lane-change manoeuvre, the rates for both the first and second lane changes were found to be 0.21 and –0.35 for the low skilled, 0.19 and –0.27 for the intermediate, and 0.18 and –0.25 for the experienced respectively. It was observed that the less experienced drivers came up with higher rates when changing lanes. The weighting strategies were set for each level as shown in Table 2. The usages of feed-forward steering were determined to be 0.75 for the low skilled, 0.8 for the intermediate and 0.85 for the experienced. The other driver parameters were set to be the same as the parameters for the professional test driver. The vehicle trajectories, steering wheel angle inputs, and lateral accelerations are compared with those of the suggested driver model. The results are shown in Figures 19–24. The range of the steering angles of the low skilled drivers level tends to be bigger than that of the experienced drivers. In single-lane-change manoeuvres, the ranges are –90 to +90 degrees for the low skilled, –60 to +60 degrees for the intermediate, and –50 to +40 degrees for experienced level. In the double-lane-change manoeuvres, the ranges are –90 to +90 degrees for the low skilled, –80 to +80 degrees for the intermediate, and –70 to +70 degrees for the experienced, except for a few abnormal cases. For almost all of the cases, the human steering behaviour appeared to be quite stable at the first cornering, and the steering became more unstable at the second cornering and beyond. Differences were observed from the second steering among the driver groups. Especially, differences in steering behaviour were clearly observed while the vehicles were on the second lane during the double-lane-change manoeuvre: the steering angle that is implemented exceeds 0 degree – over the correction point – for the low skilled, is around 0 degree for the intermediate, and is under 0 degree for the experienced. This tendency also causes the overshoot characteristic at the second lane for the low skilled, and thus, the instability of the vehicles for the rest of the course. The experienced drivers steer much less, although most of the human drivers who participated in the driving simulator tests hit cones during-double-lane change manoeuvre. Some of the unrealistic results of the driving simulator tests are related to the simulator scaling issue: On a sub-actual-sized simulator, the drivers tend to respond slowly. Several tendencies of human drivers are observed in the tests, however, and the suggested driver model appears to reproduce those tendencies well.
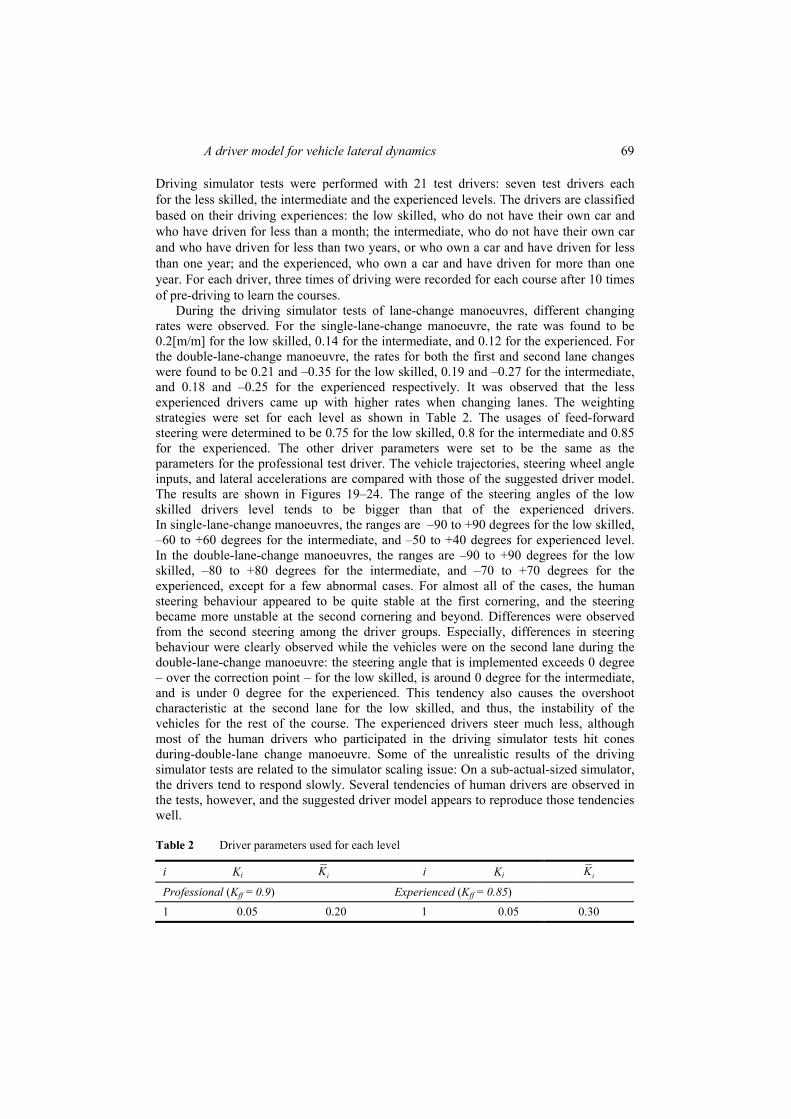
Table 2 Driver parameters used for each level
i Ki iK i Ki iK
Professional (Kff = 0.9) Experienced (Kff = 0.85)1 0.05 0.20 1 0.05 0.30

70 C. Moon and S.B. Choi
Table 2 Driver parameters used for each level (continued)
i Ki iK i Ki iK
Professional (Kff = 0.9) Experienced (Kff = 0.85)2 0.15 0.30 2 0.15 0.25 3 0.20 0.25 3 0.2 0.20 4 0.25 0.15 4 0.25 0.15 5 0.35 0.10 5 0.35 0.10 Intermediate (Kff = 0.8) Low skilled (Kff = 0.75)1 0.1 0.35 1 0.15 0.40 2 0.15 0.30 2 0.2 0.30 3 0.2 0.20 3 0.2 0.20 4 0.25 0.10 4 0.2 0.10 5 0.3 0.05 5 0.25 0.00
Usage of feed-forward steering (Kff) and weighting strategies on each multi-preview point (Ki s and siK ).
Figure 19 Comparison of the driver model performance and the results of driving simulator tests on a single-lane-change manoeuvre for the low-skill level (see online versionfor colours)
A driver model for vehicle lateral dynamics 71
Figure 19 Comparison of the driver model performance and the results of driving simulator tests on a single-lane-change manoeuvre for the low-skill level (see online versionfor colours) (continued)
Figure 20 Comparison of the driver model performance and the results of the driving simulator tests on single-lane-change manoeuvre for the intermediate level (see online version for colours)

72 C. Moon and S.B. Choi
Figure 21 Comparison of the driver model performance and the results of the driving simulator tests on single-lane-change manoeuvre for the experienced level (see online versionfor colours)
A driver model for vehicle lateral dynamics 73
Figure 22 Comparison of the driver model performance and the results of the driving simulator tests on double-lane-change manoeuvre for the low-skill level (see online versionfor colours)

74 C. Moon and S.B. Choi
Figure 23 Comparison of the driver model performance and the results of the driving simulator tests on double-lane-change manoeuvre for the intermediate level (see online version for colours)

A driver model for vehicle lateral dynamics 75
Figure 24 Comparison of the driver model performance and the results of the driving simulator tests on double-lane-change manoeuvre for the experienced level (see online version for colours)

76 C. Moon and S.B. Choi
For the statistical verification of the suggested driver model, several parameters are defined: the mean values of the path error, steering wheel angle input, lateral acceleration, and yaw rate for the whole driving course. Among the parameters, the steering wheel angle input and lateral acceleration are found to be the most correlated in the correlation analysis that was conducted. Thus, the steering wheel angle input and the lateral acceleration for both the single- and double-lane-change manoeuvres averaged for each driver are compared. Figure 25 compares the driver model and the actual driving test data for each skill level. The plot shows the accuracy of the developed driver model as well as the reasonable trend of the expected and actual skill levels.
Figure 25 Steering wheel angle input vs. lateral acceleration plot on (a) single-lane-change manoeuvre and (b) double-lane-change manoeuvre: • is the mean value of the humandata and ° the driver model (see online version for colours)

A driver model for vehicle lateral dynamics 77
5 Conclusions
In this study, a driver model mimicking a real human steering process is developed. The human steering process is defined in three sub-models: target path planning, feed-forward steering, and feedback steering. Then, two important human factors are considered: the viewing angle of a human driver as a function of vehicle speed, and the neuromuscular system dynamics as a third-order transfer function. The parameters of the neuromuscular system dynamics were verified experimentally. Through the actual driving test and driving simulator test, it was verified that the developed driver model is capable of reproducing the real human driving behaviour. Although many driver parameters appear in each sub-model of steering process, only few driver parameters – Ki and Kff – are needed to tune the driving skill level of an individual driver. The other driver parameters are generally set to be unchanged. Three major differences distinguish the suggested driver model from the models in previous works. Unlike many of the driver models that were previously studied, the driver model suggested in this study follows the real human steering process, consisting of target path planning, feed-forward steering, and feedback steering. Moreover, a multi-preview point scheme with a weighting strategy differentiates the method of classifying human drivers’ skill levels employed in this study from the general method by varying the preview distance using a single-preview point. Finally, the driver parameters can be conceptually adjusted since the suggested driver model is based on the human steering process. The driver parameters tuned for single-lane-change manoeuvre works equally well for double-lane-change manoeuvre.
In this study, longitudinal speed control is not considered, and the suggested driver model is evaluated with respect to only single- and double-lane-change manoeuvres. Integration with the speed control driver model and manoeuvres on general road conditions must be investigated in the future.
ReferencesAllen, R.W., Chrstos, J.P., Aponso, B.L. and Lee, D. (2002) Driver/Vehicle Modeling and
Simulation, SAE Paper, No. 2002-01-1568.Allen, R.W., Magdaleno, R.E., Serafin, C., Eckert, S. and Sieja, T. (1997) Driver-Car Following
Behaviour Under Test Track and One-Road Driving Conditions, SAE Paper 970170, Society of Automotive Engineers, Warrendale PA.
Allen, R.W., Rosenthal, T.J. and Hogue, J.R. (1996) Modeling and Simulation of Driver/Vehicle Interaction. SAE Paper, No. 960177.
Allen, R.W., Szostak, H.T. and Rosenthal, T.J. (1987) Analysis and Computer Simulation of Driver/Vehicle Interaction, SAE Paper, No. 871086.
Ashkens, I.L. and McRuer, D.T. (1962) ‘A theory of handling qualities derived from pilot/ vehiclesystem consideration’, Aerospace Engineering, Vol. 21, No. 2, pp.60–61 and 83–102.
Cho, Y.G. (1995) A Study on a Driver Model for Vehicle Steering, MS Thesis, Korea Advanced Institute of Science and Technology, Korea.
Choi, S.B. (2000) ‘The design of a look-down feedback adaptive controller for the lateral control of front-wheel-steering autonomous highway vehicles’, IEEE Transactions on Vehicular Technology, Vol. 49, No. 6, pp.2257–2269.

78 C. Moon and S.B. Choi
Donges, E. (1978) ‘A two-level model of driver steering behaviour’, Human Factors, Vol. 20, No. 6, pp.691–707.
Fujioka, T., Nomura, K., Takubo, N. and Chung, D.H. (1991) ‘A driver model using a neural-network system’, Proceedings of the 6th International Pacific Conference on Automotive Engineering, Seoul, Korea, Vol. 2, pp.931–938.
Hess, R.A. and Modjtahedzadeh, A. (1990) ‘A control-theoretic model of driver steering behaviour’, IEEE Control Systems Magazine, Vol. 10, pp.3–8.
Kawczynski, M. (1994) Design Practice and Highway Aesthetics, Ministry of Transportation and Highways, Highway Engineering Branch, Victoria, British Columbia.
Kiencke, U. and Nielsen, L. (2005) ‘Road and driver models’, Automotive Control Systems for Engines, Drivelines, and Vehicles, Heidelberg, Springer, Berlin, pp.425–464.
Kiencke, U., Majjad, R. and Kramer, S. (1999) ‘Modeling and performance analysis of a hybrid driver model’, Control Engineering Practice, Vol. 7, pp.985–991.
KMCT Research Report (2001) Analysis of Roads to Improve Safety and for the Development of an Automatic Assessment Technology, Ministry of Construction & Transportation, Korea.
Kraiss, K.F. and Kuttelwesch, H. (1990) ‘Teaching neural networks to guide a vehicle through an obstacle course by eliminating a human teacher’, Proceedings of the International Joint Conference on Neural Networks, Washington DC, pp.333–337.
Kraiss, K.F. and Kuttelwesch, H. (1992) ‘Identification and application of neural-operator models in a car-driving situation’, Proceedings of the 5th IFAC/IFIP/IFORS/IEA Symposium on the Analysis, Design, and Evaluation of Man-Machine Systems, The Hague, Netherlands, pp.121–126.
Krammes, R.A., Brackett, R.Q., Shafer, M.A., Ottesen, J.L., Anderson, I.B., Fink, K.L., Collins, K.M., Pendleton, O.J. and Messer, C.J. (1995) Horizontal-Alignment Design Consistency for Rural Two-Lane Highways, FHWA-RD-94-034, Federal Highway Administration, Washington DC.
Land, M. and Horwood, J. (1995) ‘Which parts of the road guide steering?’, Nature, Vol. 377, No. 28, pp.339–340.
MacAdam, C. (2001) Development of a Driver Model for Near/At-Limit Vehicle Handling,The University of Michigan Transportation Research Institute, UMTRI-2001-43.
Macadam, C.C. (1980) ‘Optimal-preview control for linear systems’, Journal of Dynamic Systems,Measurement, and Control, ASME, Vol. 102, No. 3, pp.188–190.
MacAdam, C.C. (1981) ‘Application of optimal-preview control for the simulation of closed-loop automobile driving’, IEEE Transactions on Systems, Man, and Cybernetics, Vol. 11, pp.393–399.
MacAdam, C.C. and Johnson, G.E. (1996) ‘Application of elementary neural networks and preview sensors for representing driver steering control behaviour’, Vehicle System Dynamics, Vol. 25, pp.3–30.
McRuer, D. (1980) ‘Human dynamics in man-machine systems’, Automatica, Vol. 16, pp.237–253. Salvucci, D.D. and Gray, R. (2004) ‘A two-point visual-control model of steering’, Perception, 33,
pp.1233–1248.Sharp, R.S., Casanova, D. and Symonds, P. (2000) ‘A mathematical model for driver steering
control, with design, tuning, and performance results’, Vehicle System Dynamics, Vol. 33, pp.289–326.
Shim, J.S. (1993) Driving Simulation of a Vehicle System with an Artificial Driver,PhD Dissertation, Korea Advanced Institute of Science and Technology, Korea.
Ungoren, A.Y. and Peng, H. (2005) ‚An adaptive lateral-preview driver model’, Vehicle System Dynamics, Vol. 43, No. 4, pp.245–259.

A driver model for vehicle lateral dynamics 79
Nomenclature
A Distance from vehicle C.G. to the front axle (m) ay Vehicle lateral acceleration (m s−2)
meanya Mean lateral acceleration for the course (m s−2)b Distance from vehicle C.G. to the rear axle (m) Cf Cornering stiffness of the front wheels Cr Cornering stiffness of the rear wheels di Lateral offset from the road’s centre line for the ith preview point (m) epath Mean lateral offset for the course (m) g Gravity constant (m s−2)
J Normalised angular momentum kp Proportional gain k1 Integral gain kD Derivative gain Ki Weightings on the multi-preview points in a normal situation
iK Weightings on multi-preview points in an abnormal situation L Preview distance (m)
m Normalised mass
n Total number of preview points N Total number of samples Td Pure time delay (s) Th Phase lag time constant R Curve radius r Vehicle yaw rate (rad s−1)rmean Mean yaw rate for the course (rad s−1)rs Steering gear ratio Tp Preview time (s) TFneuro Transfer function of the neuromuscular system uopt Optimal control input Vx Vehicle longitudinal velocity (m s−1)
β Vehicle side slip angle (radian)
δ Steering wheel angle input (deg)
δmean Mean steering wheel angle input (deg)
δf Steering wheel angle input for the front wheels (deg)
δff Feed-forward steering wheel angle input (deg) *ffδ Total feed-forward angle (deg)
δfb Feedback steering wheel angle input (deg)
fbδ Feedback steering wheel angle without neuromuscular dynamics (deg)
∆θview Driver’s view angle (rad)

80 C. Moon and S.B. Choi
µ Road adhesion factor Damping coefficient
κ Curvature (m−1)
κlimit Curvature limit for an abnormal situation (m−1)
ψ Vehicle yaw angle (rad)
ψdes Desired vehicle yaw angle (rad)
ωn Natural frequency


