1 Bachelor Thesis Creative accounting: A discussion on the tricks ...
Munich Personal RePEc Archive
A discussion on new cultural andaccounting variables and IFRSs’implementation[:] Empirical study on asample of Central and Eastern Europeancountries.
Dima, Bogdan and Dima (Cristea), Stefana Maria
12 May 2009
Online at https://mpra.ub.uni-muenchen.de/27165/
MPRA Paper No. 27165, posted 03 Dec 2010 20:41 UTC
A DISCUSSION ON NEW CULTURAL AND ACCOUNTING
VARIABLES AND IFRSs’ IMPLEMENTATION. EMPIRICAL
STUDY ON A SAMPLE OF CENTRAL AND
EASTERN EUROPEAN COUNTRIES
Bogdan DIMA, PhD Professor
Email address: [email protected]
Ştefana Maria DIMA (CRISTEA), PhD Lecturer
Email address: [email protected]
ABSTRACT
In the context of a growing literature addressing the connection between cultural variables and
accounting regulations, the general objective of this paper is to provide a theoretical discussion
and empirical evidence on the recent trends in financial reporting on a sample of CEE
countries. Thus, the specific objectives of the paper are: 1) to provide an operational definition
of culture; 2) to advance a set of cultural variables that we consider relevant for the
interactions between culture and the implementation of accounting regulations; (3) to
“translate” these variables into a set of specific accounting variables built from a
“functional” perspective; 4) to test four hypotheses based on the empirical pool data. The
dependent variable is a dummy aiming to capture the specificity of IFRSs’ endorsement for
unlisted entities in CEE countries and the explanatory variables are our own accounting
variables based on a set of cultural ones derived from World Values Survey’s questions. The
main output of the paper consists in the thesis that the culture in general and the specific
accounting values in particular are relevant for the national characteristics of IFRSs’
implementation in the sample countries.
KEY WORDS
cultural variables, accounting variables, financial reporting, IFRSs, WVSs, CEE
JEL Classification: C23, M41, M48

INTRODUCTION
Starting with the influential work of Harrison & McKinnon (1986) and Gray (1988), a growing
literature addresses the issue of the connections between culture and accounting regulations and
attempts to explain and predict, by using such variables, the international differences in
financial reporting systems. Several studies have tested Gray's hypothesis including Pourjalali &
Meek (1995) which identifies a match between changes in cultural dimensions and the
accounting environment in Iran following the 1979 revolution. On the other hand, Amat, Blake,
Wraith & Oliveras (1999) link Spain’s national culture to the characteristics of the Spanish
accounting environment; and Dunn (2002) concludes that cultural and political barriers are
some of the most important limitative factors for the international accounting harmonization.
Thus, the general objective of this paper is to provide a simple theoretical framework and some
empirical evidence within the fervent debate over the recent developments in Central and
Eastern European (CEE) countries’ financial reporting. The paper is organized as follows:
Section 1 provides an operational definition of culture as the dominant collective mental model
that distinguishes a society from another through a learning and inter-generational transmission
process. Moreover, this section consists of a literature review on the connection between culture
and accounting and of a discussion on several particularities of IFRSs’ implementation in the
European Union (EU). Section 2 advances a set of cultural variables that we consider relevant
for the interactions between culture and the implementation of accounting regulations in general
and it provides a “translation” of these cultural variables into specific accounting ones from a
functional perspective, by identifying several of their specific determinants. Section 3 attempts
to provide an empirical support for the thesis of significant connections between the accounting
variables and the financial reporting on the sample of CEE countries by identifying some
particularities of the accounting regulations in the sample countries and testing four hypotheses
based on the empirical pool data; Section 4 includes final conclusions consisting in derived
comments, (auto)critic and further research directions.
Therefore, the main output of the paper consists in the thesis that culture in general and the
specific accounting values in particular are relevant for the national characteristics of
International Financial Reporting Standards’ (IFRSs) implementation in the sample countries.
1. THE CONCEPTUAL BACKGROUND
1.1. An Operational Definition of Culture
According to the Merriam-Webster Dictionary, culture is “the act of developing by education,
discipline, and social experience” or “training or refining of the moral and intellectual
faculties”. In a different view, Cozzi (1998) understands by culture a “social asset” whose
acquisition by an agent generates no individual utility but has positive external effects.
UNESCO (1992)i has described culture as follows: "... culture should be regarded as the set of

distinctive spiritual, material, intellectual and emotional features of society or a social group,
and that it encompasses, in addition to art and literature, lifestyles, ways of living together,
value systems, traditions and beliefs". Such definitions are more focused on the static aspects of
culture as given social artifacts. However, cultural characteristic are changing over time; the
content of the shared intellectual products does not remain the same over long time spans.
Societies are reacting to the variation of the external and internal environment. So that, a more
comprehensive view of cultural paradigm admits that its architecture is “stable” only in a “short
enough” time horizon.
Nevertheless, we agree with the definition of cultural paradigm provided in Talpoş et al. (2005:
20): “Through paradigm we understand the dominant collective mental model that
individualizes a society from another. This paradigm represents a societal integration factor, by
offering common values and goals for the members of the society. Also, this represents the
subject of some learning and inter-generational transmission process, which slowly modifies
itself, in <long cycles>”.
Hence, we consider the cultural paradigm as representing much more then a set of “shared
values”. Similarly, one could remark that an interesting definition of culture as “shared values”
was given in 1952 by Kroeber & Kluckhohn (cited in Adler, 1986). According to them, culture
consist of patterns, explicit and implicit of and for behaviors acquired and transmitted by
symbols, constituting the distinctive achievement of human groups, including their embodiment
in artifacts; the essential core of culture consists of traditional (i.e., historically derived and
selected) ideas and especially their attached values; culture systems may, on the one hand, be
considered products of action, on the other conditioning elements of future action.
In consequence, culture is:
♦ Something that is shared by all or almost all members of a social group;
♦ Something that the older members of the group try to pass on to the younger members; and
♦ Something (as in the case of morals, laws and customs) that shapes behavior, or structures
one’s perception of the world.
From this point of view, our vision is much closer to Hofstede (1991) who defines culture as
“the collective programming of the mind which distinguishes the members of one group or
category of people from another”. Like him, we emphasize that culture is, at least partially,
learned, and not only inherited.
The key points of our argumentation may be resumed as follows: (1) the accounting standards
could be seen as “cultural artifacts”; (2) their implementation depends on the specificities of the
“accounting sub-paradigm”.
Accounting is not only a business function but also an expression of the societal concern for the
nature and quality of production and distribution mechanisms as well as for their impact at a
global scale. Therefore, the setting of a given set of financial reporting standards is influenced
by the “institutional” consequences of cultural paradigm such as legal system (especially the

pattern of property rights), the production structures and relationships, the “safety networks”
(such as social security, pensions, etc.) or the social output distribution mechanisms. In other
words, the architecture of the accounting standards will vary over the main societal axes
depending on the society’s approaches to questions like the “natural” or “given” social subjects
rights, the organization of the economic system, the social power relations and the treatments of
marginal/ discriminated / disadvantaged social groups, the social reactions to societal risks and
uncertainty. The adoption of norms, rules and regulations (including the accounting ones) could
be done in a different institutional framework shaped by different societal values and
preferences. Using our own terminology, we could label different approaches to the design this
institutional framework as:
• The leadership case - the regulations are issued under the influence of the societal
leadership centers and reflects their “long term” interests;
• The technocracy case - the regulations are the products of “technocratic” bodies supposed
to control the expertise in the involved fields of social issues;
• The business case - the regulations are business issued and derived directly from the
practice;
• The politic case - the regulations are deriving from the activity of the formal political
legislative and executive centers and they emerge as a result of political consensus /
compromise.
The society will set a certain configuration of the hierarchical relations between these possible
cases and entrust a certain social mandate to the involved bodies according to its specific
cultural values. So, the regulations are linked to the cultural paradigm from the first moment of
their elaboration and issuance.
But such influences of culture on regulatory framework are not limited to the elaboration
processes: thus, they should be equally emphasized in the implementation ones. Since societal
culture as a whole is a collective model adjusted in “long cycles”, the transposition of the
regulations in practice will inter alia depend on the particular “sub-cultures” of the entities
endorsing those regulations. The respective “sub-models” derive from the general paradigm, but
these are more flexible and more predisposed to change under the impact of the current
conditions. For instance, from an institutional and structural perspective, the accounting
standards will be the product of the global cultural values; but their implementation and
functional results will be much more connected to the specific accounting values. In this sense,
each study on the practical use of the standards should include a backward analysis – going
from the functional aspects as they are modeled by the accounting values to the broader
contextual influence of the global cultural values.
With these features, a compact model of the regulation mechanisms could be formally
described as:

( )
( )( ) ( ) ( ) ( )132
1
1
*1
ttttittia
t
jjiiti
ECEkEk
IIEr
ttt
ttt
ελλ
λ
+−+−
−⎥⎥⎦
⎤
⎢⎢⎣
⎡−= ∑
−
=
where ti
r is a state variable which describes the regulatory conditions for a certain issue i in the
current period t; I* is an output index describing the results in the presence of regulations as I
status for the output index in the absence of such regulations; ka are the current adoption costs
for the regulatory set as k describes the imposing/supervising/punishing costs. C is a set of
cultural variables characteristics of the paradigm; ε is a “black box” which counts for the
influence of other “hidden” variables; and λ1, λ2 are the relative sensitivity coefficients.
We assuming that I* could be written as:
( ) ( )2
0
* ∑∞
=++
++=l
iI
iI
il
Ii ltlttII ηφβ
where β is a discount factor, φI is a state effect that captures the role played by “fix” elements
able to affect the regulations’ impact and ηI measures the “omitted” specific factors. As a
further step, we suppose that the expected future output could be predicted inside a mix
mechanism by incorporating both past and current valuesii:
( ) ( ) ( )3ttlt i
rIilIi IcILcIE +=
+
where L is the lag operator.
Similarly,
( ) ( )4
0
∑∞
=++
++=l
ik
ik
il
ki ltlttkk ηφβ
with φk the “fix” component of maintaining the regulations and
( ) ( ) ( )5ttlt i
rkilki kckLckE +=
+
Since cultural variables adjust in “long cycle”, it is possible to consider under a “short enough”
time period that:
( ) ( )6iit CCEt≈
The deviations reflected by εt are a result of the specific particularities on the implementation.
So that:
( ) ( ) ( )7ttt
iS
iit CChE ≈≈ε
where ti
SC describes the “sub-paradigm” of the bodies entrusted with the implementation and
appliance of the standards and h is the “translation function” from “general” to “particular”
(from the characteristics of the general paradigm to the elements of the involved “sub-culture”).
Relations (1) - (7) could be combined in order to obtain:

( ) ( )( )
( ) ( )( )( )83
0
2
1
1
0
1
tt
ltttt
lttt
tt
iS
i
l
ik
tik
ir
kilkl
ktia
t
jji
l
iI
tiI
ir
IilIl
I
i
CC
EkckLck
I
EIcILc
r
+−
−⎥⎦
⎤⎢⎣
⎡++++−
−
⎥⎥⎥⎥⎥
⎦
⎤
⎢⎢⎢⎢⎢
⎣
⎡
−
−+++
=
∑
∑
∑
∞
=
−
=
∞
=
+
+
λ
ηφβλ
ηφβλ
According to relation (8), it could be formulated the next general hypothesis of the proposed
analysis:
H: In caeteris paribus conditions the regulatory status of an individual issue will vary
according with the “sub-paradigm” of the bodies involved in the implementation/application of
the specific standards.
1.2. How Does Culture Interfere with Accounting?
The purpose of this section is to review the main international studies referring to how culture
interferes with financial reporting. Thus, we will make reference to Hofstede’s cultural
dimensions model (Hofstede, 1980, 1991, 2001) and then to Gray’s accounting values.
Hofstede and the key cultural dimensions
Considered to be the father of the cultural dimensions modeling, Hofstede (2001:1) specified
that culture “manifests itself not only in values, but in more superficial ways: in symbols,
heroes, and rituals”. Beginning from such a premise, Hofstede created a model in which cultural
differences and their consequences on national, regional and international level can be
described. Based on an attitude survey of a multinational entity’s employees (IBM) in 66
countries during the 1970s, Hofstede developed country-based indices corresponding initially to
four dimensions of national culture for each and every country surveyed, later on adding a
further dimension (Hofstede & Bond, 1988) – which all were meant to reflect Eastern and
Western values alike.
These key dimensions may be described as follows:
• Power distance - represents the extent to which the less powerful members of a society
accept that power is unequally distributed;
• Individualism - describes individualistic societies as communities where there are few ties
beyond those of the nuclear family, while the opposite societies - collectivist - are
characterized by stronger cohesive in-group ties;
• Masculinity - opposes “masculine” societies and “feminine” societies. In the first case,
men are confident, tough, and more concerned with material and professional success,
while women are modest and more concerned in the quality of life, by being. In the other
case, both men and women are equally concerned with quality of life;
• Uncertainty avoidance – reflects the extent to which people feel threatened by
unknown/uncertain situations;
• Long-term pragmatism - represents the extent to which people favor a pragmatic vision
over a short-term thinking. In order to design this dimension Hofstede undertook a
Chinese Value Survey.
In spite of the long time success of the model and of the numerous business-related and
psychological research studies either based on or validating it (Hoppe, 1990; Sondergaard,
1994; Barkema & Vermeulen, 1997, Ding, Jeanjean & Stolowy, 2004), this cultural dimensions
model has been constantly challenged respectively criticized by several researchers (Bond,
1988; Smith, Dugan, & Trompenaars, 1996 respectively by Gernon & Wallace, 1995;
Baskerville, 2003). For instance, whereas Smith, Dugan & Trompenaars (1996) analyzed the
replicability of Hofstede’s methodologies, Gernon & Wallace (1995) debated over the
application of Hofstede’s cultural dimensions.
Among the criticisms brought to the Hofstede’s approach there are: the survey was referring to
one organization and may not be applicable to other circumstances (Gernon & Wallace, 1995:
85); “the embedded-ness of the four dimensions in the social, political or economic measures
indicates that the dimensions […] describe characteristics of different nations, most of which
could be identified as socio-economic in origin” (Baskerville, 2003); the IBM data are now
obsolete. To the last of these criticisms, Hofstede (2001:73) replied that because the dimensions
were supposed to have centuries-old roots, only the stable data from his surveys had been kept.
Gray and the accounting values
Based on Hofstede’s model, Gray (1988) introduced the first four cultural dimensions into
accounting, by creating the following accounting values:
• Professionalism versus statutory control - refers to a preference for the use of individual
professional judgment and the preservation of professional self-regulation over the option
to comply with the regulatory requirements and statutory control;
• Uniformity versus flexibility - implies a preference for the enforcement of standardized
accounting practices and the consistent use of these over time versus a preference for
flexible practices in accordance with the particular circumstances in which an individual
company may operate;
• Conservatism versus optimism - opposes a preference for a cautious approach to
measurement which will allow a company to handle easier uncertain future events, versus
a risk-taking approach.
• Secrecy versus transparency - describes a preference for disclosure of financial
information only to those closely involved with the management of the respective
company, seldom resulting in a restricted access for the other interested categories as
opposed to a more transparent, open and publicly accountable approach.

1.3. Some of the Particularities of IFRSs’ Implementation in the European Union
The European accountancy undertakes the most significant revolution since the issuance of the
IVth Directive in 1978. Since 2005, IAS Regulation (Regulation No.1606/2002/EC) has required
European companies listed in a European securities market to use International Financial
Reporting Standards (IFRSs) for preparing their consolidated financial statements. This
requirement affected almost 8000 European listed companies. In addition, Article 5 of the IAS
Regulation allows Member States to permit or require the unlisted entities to draw up their
individual and consolidated financial statements according to IAS.
There is no doubt that IAS Regulation and the subsequent Directives on financial reporting
share a common vision on the link between international accounting harmonization/
convergence and globalization. The first concept could be perceived as an internationalization
of accounting by promoting accounting standards in which the global interest prevails in front of
the national one (Volker, 2000; Cooke, 2001). The evolution of an increasingly real and
nominal integrated global economy, the changes in the architecture of the international financial
system, the predominance of multinational entities, the consequences of technological and
informational transfers - all these require an increased harmonization of the accounting
practices. Thus, IFRSs arise as a product of the globalization forces, becoming the best choice
for many national authorities in ensuring transparency and comparability of the financial
information. The main reason for this is the fact that a “symbolic economy” implies uniform
mechanisms for efficiency estimation, since the economic subjects are in a certain sense
“detached” from the objects of their decisions.
Some years ago it became obvious that a choice must be made between US GAAP and,
respectively, IAS/IFRSs. However, in the last decade, IFRSs have gained a wider acceptance,
so that nowadays almost 110 countries around the world have adopted the issued version or plan
to adopt or converge with this set of standards with some different modifications / limitations.
In this context, FASB and IASB are determined to find a mutual compromise of adopting
compatible and high quality solutions for present and future accounting issues. For this purpose,
two memorandums of understanding were signed during the years (2002 – Norwalk Agreement;
2006). Still, the convergence process is far from being complete and there is not a clear short-
run perception for a single international set of standards compatible with both sets of standards.
For the proposed analysis, the identification of IFRSs’ main characteristics is essential. Thus,
we have structured some of the features as follows:
• A formal set of regulations with a clearly structural internal organization of the information
and a uniform prescription of the accounting treatments to be applied;
• A “multi-authority” decisional result since a large number of bodies is involved (IASC
Foundation that names the members of the Board and IFRIC, IASB which issues the
standards, IFRIC responsible with the issuance of standards’ interpretations, SAC which
provides advisory support – all these being separate but interlinked structures; the European

Commission with its entire network of bodies with analysis and advisory duties – EFRAG,
TEG, SARG, ARC, Contact Committee, roundtable; the national regulators and so on);
• A product of a specific cultural and business environment - the Anglo-Saxon one - destined
to be assimilated in various other environments characterized by different cultural
paradigms;
• The IFRSs appliance is a “work in progress” under a significant time horizon so that there
are some limitations of the “short-run” argument.
If these postulates stand, it should be noted that in the particular case of the CEE countries
which are EU Member States, a discriminate analysis is applicable only for domestic unlisted
entities since all the listed companies are required to use IFRSs. In this context becomes obvious
that the decision of the CEE countries - UE Member States – to permit or require the domestic
unlisted entities to draw up their individual financial statements according to IAS/IFRS is still
question to the cultural particularities of each state.
2. BUILDING NEW SETS OF CULTURAL AND ACCOUNTING VARIABLES
2.1. Building a New Set of Cultural Variables
The starting point of our research is represented by the observation that Gray’s accounting
values (1988) have a „structural” nature. More precisely, these describe the organization of the
accounting framework, the institutional network, the accounting regulations and rules’ setting as
well as the relative preferences in accounting treatments, transparency, completeness and risk
aversion.
Due to the complexity and variety of the real situations, such an approach generates difficulties
in the measurement of accounting values and explains the non-homogeneous results of the
different studies carried on this issue.
Since Gray (1988) has linked his accounting values to Hofstede’s cultural dimensions model,
numerous researchers were inspired to find empirical evidence on the subject (Belkaoui, 1989;
Perera, 1989; Perera & Mathews, 1990; Chow, Chau, & Gray, 1995; Hussein, 1996; MacArthur,
1996; Roberts & Salter, 1999). Salter & Niswander (1995) tried to test Gray’s theory on a
sample of 29 countries, but the study revealed serious problems in the measurement of the
accounting values, the results including a negative relationship between uniformity and
uncertainty avoidance, in contrast to Gray’s prediction. On the other hand, Chanchani & Willet
(2004) tested the accounting values on the financial statements’ uses in India and New Zeeland
and their results validated in some way Gray’s hypotheses concerning professionalism and
uniformity.
In this context, a possible alternative approach may consist in the attempt to describe the
accounting values from a functional perspective. In other words, we consider starting not from
the description of the financial reporting system, but from the way it is actually endorsed. This

presumes shifting the focus from norms and institutions to norms’ implementation mechanisms
and the assessment of their relative efficiency. The minimal steps of such an approach include:
1. to identify the common functional characteristics of the contemporary financial reporting
systems;
2. to identify the discriminants which explain the existing differences among these systems;
3. to emphasize the estimation modalities of the informational efficiency of the financial
reporting systems and those of the principles which may lay at the base of the empirical
assessment of these.
It can be noticed that such an approach may imply a high doze of subjectivism, since the
appraisal of the way in which the financial reporting systems are structured and work is shaped
by the set of relative preferences of the standard setters and main financial information’ users.
In consequence, the cultural paradigm in which these systems are conceived and implemented
plays a critical role in their ex ante and ex post assessment. Thus, defining a set of accounting
values must take into consideration the accurate manifestation of the constituents of this
paradigm. Or, the appeal to the cultural dimensions proposed by Hofstede (1980, 1991, 2001)
may generate a series of difficulties among which their Western focused nature and, on the other
hand, the problems associated to their operationalization. A solution to this problem is
represented by the use of World Values Surveys’ (WVSs) data.
In 1981, Jan Kerkhofs and Ruud de Moor - leaders of the European Values Survey group (EVS)
- launched a study which will turn into today’s World Values Surveys. Because of the success
of the EVS’ surveys carried out in ten West European societies, the project was replicated in
fourteen additional countries. The findings of these surveys suggested that “predictable cultural
changes were taking place”.
Nowadays, The World Values Surveyiii is organized as a network of social scientists brought
together by a common interest: “to understand ongoing social changes that are transforming
peoples' worldviews and basic motivations”. It is coordinated by a central body, the World
Values Survey Association, which is a non-profit association seated in Stockholm, Sweden.
Also, the WVSs’ data have become increasingly renowned in recent years, and have been used
in hundreds of publications in more than twenty languages.
To monitor the cultural changes, four waves of Values Surveys were carried out in 1981, 1990-
1991, 1995-1996 and 1999-2001, while a fifth wave took place in 2005-2006. The World
Values surveys were designed to test the hypothesis that economic and technological changes
are changing the basic values and motivations of people. This database allows the examination
of relationships between public values and economic growth; or between environmental
pollution and mass attitudes toward environmental protection; or those between political culture
and democratic institutions. The usefulness of these data has grown as the surveys are now
providing a wider coverage of the world's societies, and as the time coverage increased. The last
wave includes more than 80 independent countries amounting to almost 85% of the world's
population.

Based on the WVSs’ data, we have selected those questions which influence in a direct manner
the financial reporting systems and have subsequently transposed these generic values in
specific accounting values. This approach in three steps has the following advantages:
a. provides a consistent explanation on conceptual level of the way in which the mechanisms
subordinated to the accounting systems are designed;
b. explains how the cultural values adjustable on long cycles are susceptible to influence the
organization and functionality of financial reporting, which is object to much faster
transformations in medium and short cycles;
c. allows the operationalization and testing of explicative models built based on these
values;
d. allows the formulation of normative statements based on emphasizing the best practices.
It is important to emphasize the fact that the translation of the WVSs’ data in accounting values
can be facilitated by a set of “intermediary cultural values” as a result of selecting those cultural
data potentially susceptible to influence the accounting systems. Their nature of “transitional
variables” derives from the fact that these are not actually principles incorporated in the basis of
the financial reporting systems, rather representative descriptors of the configuration of
standard setters’ relative preferences.
Thus, in our paper we have built such a set of transitional variables based on WVSs’ data. In
this matter we are referring to the fourth wave of surveys carried out by WVSs in 1999-2001 in
sixty five societies, many African and Islamic societies being included in the analysis for the
first time.
Insert Table 1
We have grouped these questions according to their specificity, afterwards proceeding at
building a specific set of cultural variables with impact on financial reporting:
1. Freedom of initiative - estimates the relative importance of free individual initiatives on
personal level and within economic structures. The variable is defined as “ the individual
initiative is NOT important” and is measured as:
( )9034
100ln*33.0
016
100ln*33.0
173
100ln*33.0 ⎟
⎠⎞
⎜⎝⎛+⎟
⎠⎞
⎜⎝⎛+⎟
⎠⎞
⎜⎝⎛=
CCAnofreedom
2. Work significance - takes into account the relative importance of work during the
individual life time. It could be noticed that this variable is more focused on importance of
work and less on work ethics. The variable is computed as “work is NOT important”:
( )10005
100ln ⎟
⎠⎞
⎜⎝⎛=
Anowork

3. Social hierarchy significance - describes the relative acceptance of social hierarchy defined
as “In society and in economic entities the hierarchical managerial style DOES NOT
prevail”:
( )11061
100ln ⎟
⎠⎞
⎜⎝⎛=
Cnohierachy
4. Social justice significance - intents to capture the importance that justice and “follow the
rules” behavior have in the social game. The variable is defined as “The social justice and
the social norms and rules are NOT important” and computed as follows:
( )12100
146ln*25.0
100
145ln*25.0
116
100ln*25.0
114
100ln*25.0 ⎟
⎠⎞
⎜⎝⎛+⎟
⎠⎞
⎜⎝⎛+⎟
⎠⎞
⎜⎝⎛+⎟
⎠⎞
⎜⎝⎛=
FF
FFnojustice
5. Risk aversion – describes the attitude towards risk at social and individual level and is
defined as “ The job security and the capacity to improve the immediate family life are
NOT important” being computed as:
( )13163
100ln*5.0
100
013ln*5.0 ⎟
⎠⎞
⎜⎝⎛+⎟
⎠⎞
⎜⎝⎛=
E
Csionnoriskaver
2.2. Building a Correlated Set of Accounting Variables
A subsequent step derives from the necessity to transform these transitional values in
accounting values. Such a procedure must be based at least on the following rules:
• The final outcome has to be a “positive” one and not a normative one. More precisely, it
must be avoided the a priori establishment of those principles which might generate the first
order best solution for the architecture of the financial reporting systems. Instead it must
refer to the main objective - the elaboration of a set of variables whose descriptive capacity
is maximal;
• The final outcome must have a strong operational nature. More precisely, the way in which
the accounting variables are defined must allow their easier assessment and reflect the
possible changes in their value during different periods of analysis;
• The new accounting variables have to be auto consistent, to avoid ambiguities in classifying
the financial reporting systems and maintain a bi-univocal correlation with the transitional
variables which generated them;
• The new accounting values must present a minimal informational discrepancy in
comparison with the cultural paradigm. We must keep in mind that the accounting values
have to allow “cross-system comparisons” among financial reporting systems from distinct
economic, social and cultural environments. Hence, it is essential to pursue the achievement
of a more extensive nature of these values as well as the preservation of their explanatory
potential in comparison with the need to distinguish between “hard” economic and

institutional determinants and respectively “soft” social and cultural determinants which
shape the architecture of the accounting systems;
• The accounting values must focus on emphasizing the functional aspects specific to
financial reporting systems. Of course, it is a less plausible possibility to completely neglect
the institutional aspects and the links between the inherent mechanisms of these systems.
So, this request can be formulated in a weaker version namely as the informational weight
of the functional descriptors in the accounting values to be prevalent.
Such a set of accounting values may be formed of:
1. Functional conformism - the application of norms, regulations and procedures is done
faithfully according to their formal description. This variable is interlinked to freedom of
initiative: the less important the individual initiatives are, the higher the degree of functional
conformism. In this context, the accounting norms will be applied “as such” in a
homogeneous manner and particular situations tend to be avoided;
2. Functional transparency - the application of norms, regulations and procedures is
accomplished with the purpose of gathering, synthesizing and transmitting a greater volume
of financial information. This variable is interlinked to work significance: the more
important the work is, the more profound the tendency to reach a detailed understanding of
the financial statements to the prejudice of rapidity in gathering and use of financial
information.
3. Hierarchical selectivity - the information gathered in a given financial reporting system is
allocated in a partitioned manner according to the existing hierarchical structure. This
variable is interlinked to social hierarchy significance: the more rigid the hierarchy is, the
less transparent the informational circuit; the more synthetic information is reserved to the
higher hierarchical levels;
4. Social subordination – the organization and function of the accounting systems is meant to
facilitate not only the achievement of economic and financial objectives but also the
fulfillment of assumed obligations towards the community in conformity with the corporate
social responsibility. This variable is interlinked to social justice significance: the more
important the respecting of the norms and rules of the “social game” is, the more the
accounting systems must emphasize not only the standard economic performance but also
the impact that the economic entities have on the social environment;
5. Cautious approach - the application of norms, regulations and procedures is done in order
to minimize the risks of producing errors and incomplete, distorted and obsolete/ untimely
information. This variable is interlinked to risk aversion: the deeper the social and
individual tendency to reject risks is, the more focus is on the completeness, accuracy, auto-
consistency and relevance of the output of financial information’s gathering and
administration.
2.3. Identifying the Particularities of the Proposed Accounting Variables
In this paragraph we intend, on one hand, to explain the relative preference for the proposed
accounting variables referring to Hofstede’s cultural dimensions as determinants of this
preference, and on the other to emphasize certain similarities to Gray’s model.
Functional conformism
In general, conformism could be defined as “the inclination of an individual to change
spontaneously (without any order or request by anyone) his judgments and (or) actions to
conform the <socially prevailing> judgments and (or) actions” (Luzzati, 1999, 113). In the
context of our proposed value, conformism could be understood as an auto-limitation of the
accounting practitioners to adopt “independent” attitudes in respect to the regulatory framework
and to exercise their professional judgment to discriminate between the individual cases of
norms, rules and procedures’ applications. This should be seen as a separate issue from the
matter of the extent to which the accounting profession should be subject to a public statutory
control: once the regulations are issued, no matter in what way, a functional conformist attitude
implies an implementation as per se without any “deviations” generated by adaptations to
practical cases.
The degree of conformism decreases with an increase in the social importance of freedom of
initiative: “A preference for independent professional judgment is consistent with a preference
for a loosely knit social framework where there is more emphasis on independence, a belief in
individual decisions and respect for individual endeavour” (Gray, 1988, 9).
However, these two aspects are inter-linked: the more self-regulated the accounting practice is,
the greater the possibilities to adjust the rules to a complex field of application and to exercise
an individual professional judgment.
Currently, there is an important controversy in the developed countries about the limits of the
private self-regulations. For instance, in the Anglo-Saxon area there is a long tradition for the
development of professional associations and a lower level of conformism (our measure
suggests that the degree of conformism is more reduced in United States that in United
Kingdom). But this started to change under the impact of the recent financial instability and as a
response to numerous financial frauds reported after the longest sustained period of economic
expansion of United States economy. As Arthur Levitt, the ex-SEC chairman, had noticed in a
PBS / FRONTLINE 2002 interview a case like Enron “it's symptomatic of a breakdown of the
ethical values of business over a period of perhaps 20 years, a gradual erosion of business ethics
that brought us to an Enron, but might very well bring us to a whole host of Enrons as we move
down the road”.
In this context, The Sarbanes-Oxley Act (2002) created the Public Company Accounting and
Oversight Board (PCAOB) in order to respond to the concerns that self-regulation of the
accounting profession had failed to protect investors from poor quality audits. The objective was
to improve the accounting practices, to strengthen the rules that assured the independence of

corporate auditors, to increase the accountability of company managers and to enhance the
quality of financial reports issued by public companies. After six years, the results are still
mixed, with notable improvements in the financial reports’ quality but with an increase in
associated costs, a larger number of bureaucratic procedures and more frequent restatements.
Furthermore, reviewed firms have advance notice of PCAOB inspections, and as a result they
may still be able to hide deficiencies from the inspectors. It could be predicted that the actual
financial crisis will boost the changes and will lead to an increased importance of the PCAOB
(and others bodies) in the supervisory process. Of course, one of the most important issues will
remain the fact that US GAAP are mainly “rule-based”, being a set of complex and detailed
accounting rules that leave little room for individual judgment, in opposition with more
“principle-based” IFRSs.
In the European Union’s Member States the situation is more heterogeneous, but generally there
is a greater focus on exact implementation of an extended set of prescriptive legal requirements.
Of course, we must consider the harmonization impact exercised by the European Union’s
Directives. Among them, the Markets in Financial Instruments Directive (MiFID - Directive
2004/39/EC) subsequently amended (Directive 2008/10/EC), that provides a harmonized
regulatory regime for investment services across the 30 Member States of the European
Economic Area (the 27 Member States of the European Union plus Iceland, Norway and
Liechtenstein), appears to be the cornerstone of the European Commission's Financial Services
Action Plan. The main objectives of the Directive are to increase competition and customer
protection in investment services and to introduce the concept of “maximum harmonization”
which places more emphasis on home state supervision.
Functional transparency
The participants at a 2002 "Enhancing Financial Transparency” symposium organized by
Federal Deposit Insurance Corporation have argued : “One of the largest problems facing
today's investors is that poor quality financial reports preclude effective, informative
fundamental analysis. The reasons for inaccurate financial reporting are varied - a small, but
dangerous, minority of companies actively intends to defraud the investor, while others may set
forth information that is misleading but technically conforms to legal standards”iv. The
transparency of the financial statements acts on the economic output, social productivity and the
value-added by economic entities and sectors through various channels: (a) investments’
selection - the identification of better resources allocation’ decisions by taking into account the
return to risk ratio; (b) the reduction of informational asymmetry; (c) the accountancy of
managerial decisions from the shareholders and stockholders point of view. In our opinion,
transparency is a multi-level concept connected with: (1) the completeness of data - the volume
of information shared to the public should be as large as possible, the referring time-span should
cover a large enough historical period and the complexity of the financial statements should
ensure the necessary disclosures; (2) the easy access - the information should be provided in
such manner that the public could access it without supporting the supplementary costs
searching for / waiting for / obtaining it; (3) the understandability - the data should be displayed

in the simplest and most logic form, keeping the redundancy and the technical, unnecessary
elements under a “critical level”; (4) the reliability – the accuracy of the data should be
preserved along with their auto-consistency.
Since any economic decision based on financial information will imply the increase of “hidden
costs” and risks of failure with a decrease in transparency, it could be argued that the social
relative preference for improving the transparency of the financial statements will be greater in
countries with a greater preference for uncertainty avoidance. A debatable aspect is the linkage
between transparency and uniformity of accounting standards and reporting procedures: the
existence of a detailed regulatory written set and its rigid application does not necessary mean
that the output will be always complete, easy to access, comprehensible and reliable, if by
construction it is destined to be opaque. And even more, the set may be designed to fulfill the
necessary characteristics to ensure a high degree of transparency however, when transposed in
practice it could be applied formally correct, but denatured or obscure in content. Finally,
functional transparency may be seen as a result of respecting the rules if these rules are built
according to the transparency principle.
The “field situation” varies from one country to another. For instance, the United States can be
described as characterized by a state of “financial reporting complexity” generated by the large
number of different bodies with interest in the elaboration of accounting standards and norms
(Financial Accounting Standards Board - FASB-, Emerging Issues Task Force, US Securities &
Exchange Commission, and American Institute of Certified Public Accountants). Each of these
bodies has its own agenda with some important differences between them. This fact led to the
existence of a large corpus of standards, interpretations, opinions, implementation guides,
industry guides and so on, that range from general to specific and may display some areas of
inconsistency. Or, in Scott Taub’s words: “Those detailed rules, bright lines, and exceptions in
the standards and in subsequent interpretations and rulings have often overwhelmed the basic
principles that underlie many of the accounting standards. Rather than easing implementation
and promoting greater consistency in reporting as intended, detailed rules and bright lines
instead may reinforce a focus on blind adherence without due regard to the principles those
rules are intended to support” (testimony before “The House Financial Services Subcommittee
on Capital Markets, Insurance and Government Sponsored Enterprises”, March 29, 2006)v.
In the European Union, the Transparency Directive (Directive 2004/109/EC) covers a range of
issues including dissemination of financial information, notification of major shareholdings and
new requirements for the content and timing of periodic financial information. The Directive
confirms the "home country principle", prohibiting other Member States from imposing more
stringent disclosure requirements on an issuer than those already imposed in its home Member
State. This is along the same lines as the Prospectus Directive. Still, the Commission’s Action
Plan on Modernizing Company Law and Enhancing Corporate Governance in the EU proposed
that greater transparency should be required from unlisted companies.
However, in developing countries, the costs associated with IFRSs’ implementation, the poor
infrastructure, the lack of accountants’ experience, the power of bureaucracy, the corruption and
the complexity of local situations had determined heterogeneous results in assuring the
functional transparency. For the moment, the efforts of international bodies such as
Intergovernmental Working Group of Experts on International Standards of Accounting and
Reporting (ISAR) are leading only to limited results.
In our opinion, an interesting approach to validating functional transparency is to test it against
another methodology and check for similarities. For instance, the Milken Institute computes an
Opacity Index which measures “the costs and preponderance of high-frequency, low-impact
risks resulting from corruption, a lack of due process, poor regulatory enforcement, and non-
standard reporting practices, each of which adds substantial costs to global business” (Kurtzman
& Yago, 2008:1). The Opacity Index ranges from 1 to 100; the higher a country’s score, the
greater its opacity. Each component of opacity - (C) corruption, (L) legal systems, (E)
enforcement policies, (A) accounting and disclosure standards, and (R) regulatory quality - is
rated separately and contributes to the country’s overall opacity rating. The comparative results
for a common sample of 38 countries (2006-2007 values of the Opacity Index) are displayed in
Table 2.
Insert Table 2
One could notice that the ranks reveal a certain degree of compliance with United Kingdom
appearing as “the most transparent country” and Philippines / Nigeria as “the less transparent
ones”. Also, the rank decreases as the country income declines (Graphic 1), which is consistent
with the predicted relative importance for the existence of necessary resources in the
corresponding standards and mechanisms able to ensure the transparency.
Insert Graphic 1
For European countries, the ranks are quite similar as the Union embraces uniform codes and
streamlined regulations for corporate governance and company laws.
Hierarchical selectivity
This variable has some common characteristics with Gray’s secrecy versus transparency. But
the “secrecy” is linked more to the architecture of the internal / external informational system.
Hierarchical selectivity is related to a partitioned view of the financial information circuit being
a reflection of the principle “you know only what you should know”. As Gray (1988:11) argues:
“secrecy can be linked most closely with the uncertainty-avoidance, power-distance and
individualism dimensions. A preference for secrecy is consistent with strong uncertainty
avoidance following from a need to restrict information disclosures so as to avoid conflict and
competition and to preserve security. A close relationship with power distance also seems likely
in that high power-distance societies are likely to be characterized by the restriction of

information to preserve power inequalities. Secrecy is also consistent with a preference for
collectivism, as opposed to individualism, with its concern for those closely involved with the
firm rather than external parties. A significant but less important link with masculinity also
seems likely”.
In more rigid hierarchical managerial structures, there is a pronounced degree of information
partition: its distribution strictly follows the hierarchical chains; only the chief officers,
significant stockholders and (just in some cases) the public authorities / main creditors are able
to perceive “the whole picture”. As a consequence, the financial information has a higher
asymmetry being less transparent to the personnel, middle and operational management (and to
some extent to the investors). Also, a lower consideration for the individual initiative allowed
the bureaucracy within the companies to have an extended control over the information
distribution process.
The selectivity is determined by the nature, contents and extent of the “management accounting”
/“controlling” norms and procedures. The Institute of Certified Management Accountants
(ICMA) states “A management accountant applies his or her professional knowledge and skill
in the preparation and presentation of financial and other decision oriented information in such a
way as to assist management in the formulation of policies and in the planning and control of
the operation of the undertaking. Management Accountants therefore are seen as the <value-
creators> amongst the accountants. They are much more interested in looking forward and
taking decisions that will affect the future of the organization, than in the historical recording
and compliance (scorekeeping) aspects of the profession”. In the “management accounting” /
“controlling”, information can be gathered from various fields and functions within an
organization, such as information management, treasury, efficiency auditing, marketing,
valuation, pricing or logistics. The question is: How is this information distributed along the
hierarchical chain, what kind of aspects could be known by the operational / middle
management and what aspects are only reserved to senior officers, shareholders / stakeholders,
credit institutions, fiscal authorities and others groups of interests?
The problem could be addressed inside the agent theory framework: what type and how much
information is shared by different substructures of a given entity depends on the “power
balance” between these. Since a company could be seen as a “nexus” of contracts between
stockholders as the principal and the top executives and the tiers as agents, it could be argued
that the so-called Informativeness Principle should be taken into account in establishing the
degree of informational selectivity. When information is imperfect (asymmetric, non-uniform
distributed and costly) this principle states that any measure of performance that (on the margin)
reveals information about the effort level chosen by the agent must be included in the
compensation contract. This includes, for example, Relative Performance Evaluation –
measurement relative to other similar agents, so as to filter out some common background noise
factors, such as fluctuations in demand. By removing some exogenous sources of randomness in
the agent’s income, a greater proportion of the fluctuation in the agent’s income falls under his

control, increasing his ability to bear risk. There is therefore an “optimal quantity” of
information collected in “management accounting” / “controlling” processes that should be
distributed to the different agents depending on their hierarchical position in respect to the
principal. Of course, this “optimal” level of distributed information depends, inter alia, on the
information gathering cost: as this increases, the level of distribution could decrease.
But the new informational technologies change the situation in terms of levels and structures of
such costs. For instance, Mahler & Regan's (2005) study of the effect of an agency’s high
Internet visibility on Congressional oversight was related by the authors to principal-agent
theory. By reducing the costs of information-gathering by the principal because of the Internet,
Mahler & Regan found that the control of the agent - the agencies and their outcomes - became
easier and more effective. Within this framework, a much clearer distinction between selectivity
and transparency could be drawn: since the degree of transparency is established in an
“exogenous” manner, the issue of selectivity could be formulated as a “who is receiving what
type of information” problem.
As Gray (1998: 11) notes: “The extent of secrecy would seem to vary across countries with
lower levels of disclosure, including instances of secret reserves, evident in the Continental
European countries, for example, compared to the U.S.A. and U.K.”. Of course, such an
observation does not directly address the issue of selectivity. But it could be argued that if this is
completed with a relative preference for more rigid hierarchical structures in the continental
countries and for more formal relationships with the companies’ tiers, then it constitutes an
evidence of a higher degree of selectivity. If this statement is true, our measure of selectivity
should be associated with a greater power distance for these countries (and, to completely agree
with the arguments exposed in Gray’s quote, with a higher preference for uncertainty avoidance
and a lower degree for individualism). Some comparative data are reported in Table 3.
Insert Table 3
Surprisingly, these data suggest that the continental European countries display a higher power
distance, but a lower level of hierarchical selectivity comparative to the United States and
United Kingdom cases. One possible explanation consists in the contradictory indication from
the power distance and the “follows the rules” C061 question in the World Values Surveys’
questionnaire which is used to compute our measure of selectivity. More exactly, this question is
formulated as: “C061. - People have different ideas about following instructions at work. Some
say that one should follow one's superior's instructions even when one does not fully agree with
them. Others say that one should follow one's superior's instructions only when one is
convinced that they are right. With which of these two opinions do you agree?” Or, the reported
percentage in the 1999 survey for the “follow instructions without being convinced” answer
against “must be convinced first” was 64.5% for United States, 43.5% for Great Britain and
46.8% for Northern Ireland, compared with 24.8% for Austria, 30.7% for Belgium, 34.6% for
Germany or 33.3% for France. “Power Distance Index - PDI is the extent to which the less
powerful members of organizations and institutions accept and expect that power is distributed

unequally. The PDI represents inequality (more versus less), but defined from below, not from
above. It suggests that a society's level of inequality is endorsed by the followers as much as by
the leaders”vi. Having a lower power distance, but a stronger belief in following the superior’s
instructions, doesn’t seem, at least at an intuitive level, completely consistent; thus, we consider
that an extensive study should be carried on this topic.
Social subordination
This value is a measure of the fitting in the Corporate Social Responsibility paradigm (CSR –
also known as corporate responsibility, corporate citizenship, responsible business and
corporate social opportunity) for the accounting norms, rules, procedures and for their
operational application.
Under the impact of institutional development of the customer’s network, the increased
influence of the pro-environmental groups and the major shifting in socio-politic attitudes, a
significant concern for most businesses may be attributable to the community’s expectation, in
developed countries, for organizations to engage socially beyond the boundaries of their
commercial interests.
The Corporate Social Responsibility Network notes that CSR is “about how businesses align
their values and behavior with the expectations and needs of stakeholders - not just customers
and investors, but also employees, suppliers, communities, regulators, special interest groups
and society as a whole. CSR describes a company's commitment to be accountable to its
stakeholders”vii
In the broader context of the CSR, the Social accounting (SA- also known as social and
environmental accounting, corporate social reporting, corporate social responsibility reporting,
non-financial reporting, sustainability accounting) is the process of communicating the social
and environmental effects of organizations' economic actions to particular interest groups within
society and to society as a whole (Gray et al., 1987: IX). According to the Social Audit
Networkviii social accounting should be:
• Multi-perspective: encompassing the views of people and groups that are important to the
organization.
• Comprehensive: inclusive of all activities of an organization.
• Comparative: able to be viewed in the light of other organizations and addressing the
same issues within same organization over time.
• Regular: done on an ongoing basis at regular intervals.
• Verified: checked by people external to the organization.
• Disclosed: readily available to others inside and outside of the organization.
The development of the CSR / SA could be correlated with the degree of societal femininity: the
societies with a higher concern for “protective” aspects of the social relationships are more
likely to focus on the social and environmental impact of the companies activities that the more
performance-oriented masculine ones. Also CSR / SA could be correlated with the collectivism
degree since societies with higher values of this variable are more interested in the social global
impact of the companies’ activity.
In practice, a number of reporting guidelines or standards have been developed to serve as
frameworks for social accounting, auditing and reporting:
• AccountAbility’s AA1000 standard, based on John Elkingron’s triple bottom line (3BL)
reportingix;
• Accounting for Sustainability's Connected Reporting Framework;
• Global Reporting Initiative's Sustainability Reporting Guidelines;
• Verite's Monitoring Guidelines;
• Social Accountability International's SA8000 standard;
• Green Globe Certification / Standard;
• The ISO 14000 environmental management standard;
• The United Nations Global Compact promotes companies’ reporting in the format of a
Communication on Progress (COP). A COP report describes the company's
implementation of the Compact's ten universal principles;
• The United Nations’ Intergovernmental Working Group of Experts on International
Standards of Accounting and Reporting (ISAR) provides voluntary technical guidance on
eco-efficiency indicators, corporate responsibility reporting and corporate governance
disclosure;
• The FTSE Group publishes the FTSE4Good Index, an evaluation of CSR performance of
companies;
• The Global Reporting Initiative (GRI) produces the world’s de facto standard in
sustainability reporting guidelines. Sustainability reporting is the action where an
organization publicly communicates their economic, environmental, and social
performance. The GRI’s mission is to make sustainability reporting by all organizations
as routinely and comparable as financial reporting. The GRI Guidelines are the most
common framework used in the world for reporting. More than 1000 organizations from
60 countries use the Guidelines to produce their sustainability reportsx.
It is often argued that there is a contrasted approach in the field of CSR / SA between the United
States and the European countries (including United Kingdom as a leading force in this topic).
For instance, as William & Aguilera (2008:9) noticed that a study like Matten & Moon’s (2004)
“has compared CSR in Europe versus in the United States, and has proposed a conceptual
framework of <explicit> versus <implicit> CSR, while recognizing that these are matters of
emphasis, not wholly dichotomous states. They define explicit CSR as that seen in the United
States, where companies volunteer to address important social and economic issues through
their CSR policies, in significant part because of less stringent legal requirements than in
Europe for such things as health care provision, employee’s rights or environmental protection.
In contrast, in Europe and the UK, responsibility for these issues is undertaken as part of a
company’s legal responsibilities, and thus CSR is <implicit> in the way the company does
business”. This argumentation seems to be supported by some empirical evidences as those
revealed for instance by the FTSE4Good indexes series.

Insert Table 4
Our own measure of social subordination suggests that there are some important differences
between United States and United Kingdom with closer values of social subordination to the
continental European countries in the last case.
Insert Table 5
Cautious approach
“Conservatism or prudence in asset measurement and the reporting of profits is perceived as a
fundamental attitude of accountants the world over” (Gray, 1988:10).
The key distinction in defining and measuring a risk is similar to the one between “risk” and
“uncertainty”. “Risk” is the probability to obtain an unfavorable result of an economic
decision. “Unfavorable” means that the result is “positive” but lower then the expected one or
that the result is “negative”. Therefore the risk concept incorporates both the situations of
“unrealized” results and “losses”. “Uncertainty” means that the observable result deviates (in a
“positive” or “negative” sense) from the expected one. “Uncertainty” reflects both the situation
of “unfavorable” results as well as that of “excess results”.
Suppose, for instance, that the returns of a project are “normally” distributed around a certain
“objective” or “subjective” target value. In such case, three main areas can be delimited: Area 1
where the returns are positive but lower that the target value, that can be set based on the
average of the previous values, the average of the sectors’ returns, the “concurrencies average”,
the interest or inflation rate, the growth rate of the financial markets etc. or can be a pure
subjective value; Area 2 where the returns are negative and respectively Area 3 where the
returns are positive and higher that the target value. Area 1 and Area 2 form together the risk
zone, while all three areas reflect the uncertainty zone. However, the relative importance of
Area 1 and Area 2 for the risk definition is not the same: the agent will perceive a higher risk
associated with losses that with values of returns, which are lower that the target but still
positive. Thus, the cautious application of the accounting standards should at least: (1) estimate
in a manner as larger as possible the “objective” and “subjective” material, financial and
informational costs; (2) compute the incomes in a prudent evaluation based on
“base/pessimistic” scenarios; (3) evaluate the market value of the company in the worst possible
conditions; (4) treat adequately the values of the financial assets, the marketable and non-
marketable assets and liabilities; (5) incorporate all the relevant aspects for the weighted /
marginal capital cost estimation; (6) estimate the “fair values” of the receivables and payables.
In the conditions of exponential development of capital markets and intensive financial
innovations many entities have switched de facto from “accrual accounting practices” (in which
transactions are booked at historical costs plus or minus accruals) to an approach based on
“market-values”. So that the accuracy and the capacity to reflect different types of operational
risks of the accounting information becomes more and more critical for the relevance of the
financial statements. The so-called Managerial Risk Accounting is concerned with the
generation, dissemination and use of risk related accounting information to managers within
organizations to enable them to judge and shape different risks.
A recent evolution is the field of risk / uncertainty prevention and management “was the
increased importance of risk management and its integration into general management, which
mainly results from laws and standards concerning internal control systems and requirements
like the German <Gesetz zur Kontrolle und Transparenz im Unternehmensbereich> (KonTraG,
Corporate Sector Supervision and Transparency Act), the US-American Sarbanes Oxley Act
(SOA), or the revised international capital framework (Basel II). For example, the regulations of
the KonTraG require the board of directors of German capital market oriented companies to
<take measures to insure that developments that threaten the continued existence of the
company are recognized early, especially to establish an internal controls system>. This passage
is being interpreted as an obligation to establish working early warning and enterprise risk
management systems in German corporations”(Nakada, 2005).
The cautious approach could be seen in a broader sense not only as the avoidance of
“incomplete”, non-relevant or obsolete financial information, but as the endorsement of
accounting standards in such manner that this application is able to permit an adequate
estimation of the “cost of risk”. Of course, as Nakada (2005) notes: “But the <cost of risk> is
the most complex for several reasons. First of all, thinking of risk as a cost is somewhat abstract.
While most people understand that risk is something to be controlled, or even minimized, it's
not natural to think of it as a cost. Second, risk is not represented in GAAP accounting. There
are no entries in the income statement for <cost of risk> and nothing in the balance sheet that
represents <stock of risk>. Lacking either intuition or accounting principles, it is no wonder that
the cost of risk is left behind”. Still, the pressure of financial instability, the negative
consequences of “window dressing” for the book values, the rapid changes in the market
evaluations for assets and liabilities should lead to the development of new accounting
techniques and methods for risk management.
It is trivial to say that cautious is consistent with uncertainty avoidance: a prudent treatment of
accounting information is consistent with a concern to cope with the uncertainty about current
and future market values of patrimonial and incomes / expenditures elements. At the same time,
it could be argued that there is also a correlation with a degree of conformism: a failure in the
uniform application of the standards has the potential to create uncertainty in the payoffs for the
company and its partners (lenders, shareholders, managers, suppliers and customers).
The situation varies in different countries, according to the differences in the rigidity of their
compliance with the historical cost principle. This leads to various degrees of conservatism in
Gray’s sense in market and book values measures across countries. The data in Table 6 suggest
that the connection between the uncertainty avoidance and our measure of cautious is less clear.
For instance, in the United Kingdom and Ireland a lower level of the first variable may
correspond to a higher degree of cautious than in certain European continental countries (since
the World Values Surveys’ data are not complete for the 1999-2000 survey, we could not
compute this variable for the United States case).
Insert Table 6
Cautious approach is not only an expression of “risk aversion” but rather a “rational” choice in
standards’ implementation: in a context of increasing complexity of business environment, it is
vital for decision makers to benefit from accurate non-distortional information and to formulate
their judgment by evaluating as accurate as possible the different intrinsic and extrinsic risks
associated with their decisions.
If the accounting values are understood as a “sub-product” of the cultural values, then the
changes in their contents take place under the impact of the societal and paradigmatic shifts.
Factors like global competition / real and financial globalization, the new production and
technologic structures typical for the post industrial society, the mutations in national and
international power relationships, the development of the environmental conscience and the new
configurations of the socio-demographic variables act towards modifying all the characteristics
of the accounting values and the way in which the accounting standards are conceived and
transposed in practice.
Resuming, Figure 1 includes the accounting values and their determinants.
Insert Figure 1
In connection to this set of accounting values a series of observations must be made:
• These do not reflect the framework, institutions and implementation mechanisms of
accounting norms, regulations, procedures which are considered as given in an exogenous
manner. Thus, in the situation of applying those in different institutional architectures, it is
possible to notice only the ex post consequences of the way the economic systems work and
not of the determinants of their configuration;
• By definition to every accounting value is assigned a transitional value. However, it is not
clear enough if a change in the transitional values leads automatically to a reconfiguration
of the accounting values;
• Formally, the operationalization of these accounting values’ estimation requires the
adoption of a “translation strategy”: namely a mechanism through which to a certain level
of the transitional values corresponds a certain level of accounting values. The simplest
modality of achieving such a mechanism consists in an attribution at the scale „1/1”: so, for
adopting a ranking procedure of transitional values’ specific levels in a set of observations,
for the highest value of the correspondent transitional value, the accounting value receives

the rank “1” and respectively for the lowest value of this, the accounting value receives the
rank “0”. An alternative consists in adopting a normalization procedure of the transitional
values and, based on that, building the estimators of the accounting values as “fuzzy”
variables. But any of these procedures will imply that the results will be sensitive to the
selection of the observation data set. In other words, these could vary according to the
changes in the set’s structure, so that the accounting values should be seen as “ranks”
(“relative levels”) and not as “absolute levels”. A country will have higher or lower values
for a particular accounting variable in respect only with the other countries included in the
observational set. Of course, at limit, this issue could be, at least hypothetically, addressed
by taking into account a “complete” set of observations. Still, this will not change the fact
that the interpretation of any value attributed to an accounting variable should be done only
in an comparative sense;
• Without a description of cultural paradigms, it is difficult to assess the degree of
informational discrepancy of these accounting values. If it is admitted, for example, that the
description of these paradigms is subordinated to World Values Surveys, it remains to be
tested the way in which the level of the accounting values varies according to the
differences highlighted by the “ensemble” of the elements revealed by the survey;
• In comparison with Gray’s model, there is a focus shift towards the functional aspects
specific to the financial reporting systems. However, the definition of the proposed
accounting values still maintains references to the institutional characteristics - obvious
mainly in the case of the first three values, as well as for the last of the variables. We insist
on the fact that in making these values operational, the estimation methods must focus
above all on the way in which accounting norms and regulations are applied and less on the
formal stipulations of these, on the role of individual professional judgment and degree of
flexibility accepted in their implementation;
• By the functional definition manner, the accounting values do not permit an immediate
estimation of informational efficiency. To increase this possibility, it is necessary to
additionally consider the following: a) to complete with a definition of this type of
efficiency in comparison with the normative aspects that lay at the base of the financial
reporting systems and respectively b) to formulate a testing methodology of the existing
connections between the modifications happened at the level of the accounting variables
and of the proxy variable for informational efficiency;
Beyond these observations, there are two fundamental questions still looking for an answer:
How deep is the de facto difference between our proposed model and Gray’s model? and How
important is the gnoseological contribution of this model?
An easier construction method of accounting variables is represented by the normalization
procedures’ choice of intermediary variables. The implicit idea is that a ranking procedure of
these variables is able to reveal the specific relative differences which appear in the way
financial reporting systems work and explain non homogenous implementation of some given

norms, regulations and procedures in an exogenous manner. For example, it is possible to
estimate the level of the accounting variables accounting according to the following
procedure:
{ }{ } { } ( )14
minmax
min
..1..1
..1
kji
skkji
sk
kji
sksji
sja
XX
XXX
==
=
−−
=
where Xa is the level of the accounting variable j from the set s of such variables built based on
the intermediary variable Xi and:
{ }{ }kj
isk
kji
sk
X
X
..1
..1
max
,min
=
= are the minimum/maximum levels of this set’s components.
This formula can be applied if the intermediary variables are supposed to be directly connected
with the accounting variables. If per a contrario the connection is seen as a inverse one, then
the accounting variable should be computed as:
{ }{ } { } ( )15
minmax
max
..1..1
..1
kji
skkji
sk
sji
kji
sksj
a
XX
XXX
==
=
−−
=
Considering the way in which the intermediary variables are defined, relation (14) stands for
functional conformism and functional transparency; while relation (15) is used to compute the
hierarchical selectivity, social subordination and cautious approach.
In conclusion to this paragraph, we consider that the main differences to Gray’s approach
consist not only in “different labels / different contents” but mainly in the construction of these
variables based on the World Value Surveys’ components - which are significantly less
“Western-centered” than Hofstede’s and more able to capture the “true” universal cultural
dimensions. Of course, this is debatable since IAS/IFRSs and, respectively, US GAAP have
their roots in the “Anglo-Saxon” perspective and both are currently subject to an on-going
convergence process. Still, the importance of having a set of “framework-independent” cultural
and accounting variables consists in an increased capacity of testing how could these be
implemented in “non Anglo-Saxon” (and “non-Western”) cultures.
3. AN EMPIRICAL ANALYSIS: A SAMPLE OF CEE COUNTRIES
In order to include an empirical study case, our paper includes an application of this procedure
that leads at the estimation of the determinants of the current status of IFRSs implementation,
specific to accounting values in a sample of Central and Eastern European countries.
Selecting the sample countries
The role of this section is to provide an empirical explanation on how culture interferes with
individual countries’ decision to permit/require/prohibit IFRSs’ use for the individual financial
statements of the domestic unlisted entities.
The first step in our empirical analysis consisted in determining the sample countries. Since we
have considered the EU membership status as a guarantee of the implementation of the acquis
communitaire, the sample countries were selected amongst the CEE countries, as defined by the
OECDxi, and simultaneously fulfilling the criteria:
• These are all CEE countries and share common socio-economic historical background;
• Each of these countries has national cultural specificity;
• These are all, at the present time, EU Member States;
• There are enough available data for constructing the cultural variables based on World
Values Survey’s questions.
Thus, from the fifteen CEE countries, only nine fulfill the entire set of criteria, as presented in
Table 7:
Insert Table 7
There are some issues we would like do address in order to provide a more meaningful
explanation of our further presented statistical results. Thus, the first issue that we consider
relevant in our analysis is that the evolution of accounting regulations in the sample CEE
countries had suffered external influences determined by other national financial reporting
systems. There can be noticed several external influences, such as:
• Austrian and German commercial code influenced the accounting regulations in Czech
Republic, Hungary and Poland;
• A French influence is obvious in Romania’s case;
• A dual French and German influence is detected in Slovakia’s case (PWC, 2004);
• Latvian accounting was strongly influenced by Danish regulations that meet in general the
EU’s Directives;
• Lithuanian accounting regulations makes reference to IAS version before 2001.
The fact is that all the sample countries have elaborated in the early ’90 national laws on
accounting and auditing separated by the company law. Most of these regulations have been
subject of a series of modifications in order to align them to the political, social and economic
objectives of each country. In the majority of the states the essential changes intervened in 2004
- 2005 as a reflection of the IAS Regulation adopted by the European Union and were
performed by the state through its main representative, the Ministry of Finance.
Actually, nowadays, the Ministry of Finance may take several positions such as (Bogdan &
Cristea, 2008):
° to continue to establish the domestic accounting regulations (like in Romania);
° to decide to issue domestic accounting standards. For example, Czech Accounting
Standards are prepared and published by the Ministry. In this case, the role of the National
Accounting Board is to comment on exposure drafts, provide interpretations and lobby the
relevant parties;

° to delegate some if its responsibilities including that of issuing accounting standards to
independent bodies. For example, Hungarian Accounting Standards Board has recently been
established to take over the responsibility for setting Hungarian Accounting Standards from
the Ministry of Finance. The Board was established by Government Decree 202/2003 under
the authority of the Accounting Act.
Many of the countries in our sample have established an apparently independent body to issue
domestic accounting standards (Czech Republic, Estonia, Hungary, Poland, Latvia and
Lithuania). However, the extent of the accounting profession in the elaboration process is not
quantifiable and some organizations (official website of The Federation of International Trade
Associations) support the idea that in some countries such as Bulgaria, Czech Republic,
Hungary, Poland and Romania the “accountants associations have some difficulties to get
organized, because of the importance of the State in the accounting system”xii.
All these issues reflect the national diversity within the sample countries as well as a possible
qualitative explanation of our cultural variables such as social hierarchy significance, freedom
of initiative and social justice significance.
Hypotheses and statistical results
The next step was that, based on the cultural variables established in the previous section and on
our previous theoretical considerations to test certain hypotheses in regard to the connections
between the accounting variables and the option to use IFRSs in the individual financial
statements of the unlisted entities from the sample countries. These hypotheses could be
summarized as follows:
H1: A higher level of functional conformism is susceptible to stimulate the adoption of IFRS;
H2: A functional transparency is sustained by an “exogenous” implementation of IFRSs;
H3: A more pronounced preference for the hierarchical selectivity is translated in a higher
preference for IFRSs’ adoption;
H4: A superior social justice orientation reflected by a higher social subordination will lead
to a greater preference for IFRSs;
H5: A cautious approach as a rational reaction in the face of markets instability will
encourage the endorsement of uniform standards.
For testing these hypotheses, the methodology implies:
1. The construction of a fuzzy score variable able to capture the “permitted / required” IFRS
adoption of the domestic unlisted companies. A possible codification system for the
construction of this variable is presented in the Annex.
Insert Table 8
This variable takes values in a scale between:
- “0” - meaning that the use of IFRSs is prohibited and
- “2” - reflecting the situation of IFRSs’ requirement;
2. The running of a pool data regression between the score variable as endogenous and the
accounting variables as exogenous ones:
( )16'iiii Xscore εγβ ++=
where X ׀ represent the cultural variables, γi signify the cross-section effects and εi are the error
terms.
The data set with the specific values for the score variable and the cultural ones is presented in
the Annex.
Insert Table 9
The main statistics for the stacked cultural data are displayed in the Annex.
Insert Table 10
The accounting values are reported in Table 11 and their general statistic properties are
displayed in Table 12.
Insert Table 11
Insert Table 12
It can be noticed that these data are covering a quite wide spectrum of values and, as a
consequence, these are describing different situations on the level of IFRSs’ adoption. The
discriminant analysis, along with the scatter plots, suggests that there are some significant
differences between the components of the analyzed sample due to the non-uniform regulatory
policies.
Insert Table 13
Insert Graphic 2
In this context, by applying the above mentioned methodology to the sample countries, we have
obtained the results displayed in the Annex.
Insert Table 14
According to these results, we can draw several conclusions:
All the H1 – H5 hypotheses are confirmed with different degrees of statistical
significance;
According to these results, it can be observed that the accounting values with the highest
explanatory contribution are represented by hierarchic selectivity, social subordination
and functional transparency, while the least explanatory contribution is functional
conformism;
There can be noticed some important differences between the countries in the sample:
a. More exactly, one could distinguish, at one extreme, a sub-group 1 composed by Poland,
and the Baltic countries (especially Latvia and Estonia) - with greater work significance, a
higher freedom of individual initiative, a medium level of social hierarchy significance and
a relative important focus on social justice; and consequently with higher degree of
conformism, transparency (with the significant exception of Poland) and selectivity, a lower
social subordination and a greater cautious approach in IFRSs’ implementation.
For example, Poland – the country with the most developed financial market in the region,
Warsaw Stock Exchange (SE), succeeds in having an almost sixteen times Bulgarian SE’s
market capitalization - is more focused on permitting IFRSs in the individual financial
statements of companies that have applied for stock exchange listing or whose parent uses
IFRSs; by prohibiting the use of IFRSs in the separate financial statements of rest of unlisted
companies. Similar to the other countries entering sub-group 1, Poland has established an
independent body to issue domestic accounting standards: the Polish Accounting Standards
Committee set in 2002 issued until January 1, 2007 three standards and two standpoints (on
accounting for emission rights and on conversion costs for balance sheet valuation).
Alternatively, Latvia has created Latvian Accounting Board which adopted domestic accounting
standards in 1999. Nowadays, there are eight standards in force and all the standards have an
international corresponding standard. The unlisted entities, except the unlisted financial
institutions, are not permitted to use IFRSs and formats of main financial statements are
prescribed by the law.
Thus, Poland and Latvia, by showing more freedom of initiative and a medium level of social
hierarchy significance, intend to create domestic sets of standards for the unlisted entities.
b. At the other extreme, a sub-group 2 - formed by Bulgaria and Slovakia with medium work
significance, lower freedom of individual initiative, greater significance of well-defined
social hierarchies and medium focus on social justice; and with a lower conformism (more
evident in Bulgaria’s case), a medium level of transparency (with very close value for our
measure), a lower level of selectivity, a lower/ medium level of social subordination and
cautious approach.
For instance, Bulgaria requires the use of IFRSs for the unlisted financial institutions and all
large unlisted limited liability entities, while other unlisted entities are permitted to use IFRSs.
The lower freedom of initiative and the greater social hierarchy significance is proven by the
fact that the accountants association (Institute of Certified Public Accountants of Bulgaria –
ICPAB) has some difficulties in getting organized and less opportunities in creating an
independent standard setter.

4. FINAL CONCLUSIONS
The results presented in the previous section reveal that on a “median” level the accounting
variables and the characteristics of the regulatory set for the IFRSs’ adoption are significantly
linked. More generally, the proposed analysis is affected by some important limitations both on
the theoretical as well as on the empirical level. Among these limitations, one could note:
Theoretical “white spots”
• How could be “culture” measured?
The appeal to the Hofstede’s cultural variables could be criticized due to the fact that
these have obviously a certain self-referential in the “occidental” culture and are not able
to sustain a more accurate distinction between the characteristics of the cultural artifacts.
But isn’t the same situation for the World Values Surveys variables? In our opinion, the
fact that the questions are based on a “valorization approach” for some universal human
values, addresses at least partially this issue.
• What is specific for the national differences in the IFRSs adoption?
There are quite few details about the intrinsic mechanisms of adopting / supervising /
punishing the non-followers of the regulations for IFRSs and is not very clearly if in fact
all the required conditions implied by the global decisional framework are fulfilled in this
particular case and, even more, the decisional particularities are not sufficiently
highlighted.
• How feasable is the construction of the accounting variables?
The fact that the “translation strategy”, which converts the cultural variable in the
“accounting” ones, generates different values as the data set is changed arises an
intriguing question on the inter-sets comparison. Does this strategy really generate proper
values for the “accounting” variables? The argument that, inside a given set of
observations, these values appear as “relative” ones and should be interpreted as “ranks”,
does not diminish the fact that in a certain sense these are ad hoc constructions and there
is in fact no clear description of the “translation mechanisms”.
• What is specific for Central and Eastern European countries?
It may be observed that there are relative few details about the institutional regulatory
frameworks and mechanisms of the CEE countries and even less about the linkages
between the proposed set of variables and the specific accounting systems’ architecture.
Empirical estimation problems
Thus, in the present paper may be detected some empirical estimation problems connected with:
• The stability of the regression models and the quality of the results (for instance, in terms
of properties of the residual variables);
• The identification problems for the involved parameters;
• The possible existence of non-linear interactions between the variables and the effects of
such interactions;
• The insufficient number of observations and the absence of an explanation for the
composition of the sample;
• The fact that the pool data are not constructed based on individual time-series so that there
is no possibility for cross-section analysis, etc.
Since the above mentioned limitations leave unsolved a series of issues generated by the
proposed analysis, we consider that a further development of this research is required, mainly on
the following directions:
a) To explain some possible translation mechanisms of the cultural values in accounting
values, by clarifying the relations between the global paradigm and the specific
accounting “sub-culture”;
b) To emphasize the impact of institutional harmonization has on the functional aspects of
the accounting values;
c) To outline an unified framework able to reflect the structural and functional aspects of
accounting values’ determinants and changes.
Therefore, despite all these caveats, we argue that the paper can be seen as a small breakdown
into the usual manner to deal with cultural and accounting variables, related consequences in
general and with the IFRSs topic in particular. The human species is not motivated in its fight
for control over the natural and artificial environment only by “rational” motifs. Instead, the
emotions could balance the logic and fear, solidarity, empathy and hope twins, shaping the way
in which people do business and live together in the same social realm.
REFERENCES Adler, N. (1986) International Dimensions of Organizational Behavior, Kent Publishing Company
Barkema, H. G. & Vermeulen, F. (1997) “What differences in the cultural backgrounds of partners are
detrimental for international joint ventures?”, Journal of International Business Studies, 28(4): 845-864
Baskerville, R. F. (2003) “Hofstede never studied culture”, Accounting, Organizations and Society, 28(1):
1-14
Belkaoui, A. (1989) “Cultural determinism and professional self-regulation in accounting: A comparative
ranking”, Research in Accounting Regulation, 3: 93-101
Bogdan, V. & Cristea, Ş. (2008) “Rules (or Laws) vs. Standards. Research regarding the accounting
regulation trends in Eastern and Central European countries”, Journal of Accounting and Management
Information Systems [OT:Contabilitate şi Informatică de Gestiune], Academy of Economic Studies,
Bucharest, 25: 72-92
Bond, M. H. (1988) “Finding universal dimensions of individual variation in multicultural studies of
values: The Rokeach and Chinese value surveys”, Journal of Personality and Social Psychology, 55(6):
1009-1015
Chanchani, S. & Willet, R. (2004) "An empirical assessment of Gray's accounting value constructs",
International Journal of Accounting, 39(2)
Chow, L. M., Chau, G. K. & Gray, S. J. (1995) “Accounting reforms in China: Cultural constraints on
implementation and development”, Accounting and Business Research, 26(1): 29-49
Cozzi, G. (1998) “Culture as a Bubble”, Journal of Political Economy, 106(2): 376-394
Ding, Y., Jeanjean, T. & Stolowy, H. (2004) "Why do national GAAP differ from IAS? The role of
culture", paper presented at European Accounting Association Congress, Athens
Dunn, P. (2002) “International Accounting Standards”, Journal of Accounting Literature
European Values Study Group and World Values Survey Association. EUROPEAN AND WORLD
VALUES SURVEYS FOUR-WAVE INTEGRATED DATA FILE, 1981-2004, v.20060423,
2006.Aggregate File Producers: Análisis Sociológicos Económicos y Políticos (ASEP) and JD

Systems(JDS), Madrid, Spain/Tilburg University, Tilburg, The Netherlands. Data Files Suppliers:
Analisis Sociologicos Economicos y Politicos (ASEP) and JD Systems (JDS), Madrid, Spain/Tillburg
University, Tillburg, The Netherlands/ Zentralarchiv fur Empirische Sozialforschung (ZA), Cologne,
Germany:) Aggregate File Distributors: Análisis Sociológicos Económicos y Políticos (ASEP) and JD
Systems (JDS), Madrid, Spain/Tillburg University, Tilburg, The Netherlands/Zentralarchiv fur
Empirische Sozialforschung (ZA) Cologne, Germany.
Gernon, H. & Wallace, R.S.O. (1995) “International accounting research: A review of its ecology,
contending theories and methodologies”, Journal of Accounting Literature, 14: 54-106.
Gray, S.J. (1988) “Towards a Theory of Cultural Influence on the Development of Accounting Systems
Internationally” Abacus, 24(1): 1-15
Gray, R.H., Owen, D.L. & Maunders, K.T. (1987) Corporate Social Reporting: Accounting and
accountability, Hemel Hempstead: Prentice Hall, IX
Harrison, G.L. & McKinnon J.L. (1986) “Culture and Accounting Change: A New Perspective on
Corporate Reporting Regulation and Accounting Policy Formulation”, Accounting, Organisations and
Society, 11(3): 233-252
Hirshleifer, J. (2001) The Dark Side of the Force: Economic Foundations of the Conflict Theory,
Cambridge University Press
Hofstede, G. (1980) Culture's consequences, Sage Publications
Hofstede, G. (1991) Cultures and Organizations, Software of the Mind: Intercultural Cooperation and its
Importance for Survival, McGraw-Hill Book Company Europe
Hofstede, G. (2001) Culture's consequences: Comparing values, behaviors, institutions and organizations
across nations, Second, Sage Publications (London)
Hofstede, G. & Bond, M. H. (1988) “The Confucius connection: From cultural foots to economic
growth”, Organisational Dynamics, 16(1): 5-21
Hoppe, M. H. (1990) A comparative study of country differences in work-related values and learning and
their implications for management training and development, University of North Carolina at Chapel Hill
Hussein, M. E. (1996) “A comparative study of cultural influences on financial reporting in the U.S. and
the Netherlands” The International Journal of Accounting, 31 (1): 95-120
Inglehart, R. (2008) Inglehart-Welzel Cultural Map of the World
Kroeber, A.L. & Kluckhohn, C. (1952) “Culture. A critical review of concepts and definitions”, Peabody
Museum Papers, 47(1)
Luzzati, T. (1999) “Economic Theory and Conformism”, in Gallegati M. & Kirman A. (a cura di),
Beyond the Representative Agent, Cheltenham, E.E., September: 113-142
MacArthur, J. B. (1996) “An investigation into the influence of cultural factors in the international
lobbying of the international accounting standards committee: The case of E32, comparability of financial
statements”, The International Journal of Accounting, 31(2): 213-237
Mahler, J. G. & Regan, P. M. (2005) “Agency Internets and the changing dynamics of congressional
oversight”, International Journal of Public Administration, 28(7/8): 553-565
Nakada, P. (2005) "Accounting for Risk: Guidelines for Risk-Adjusting Your Profitability Measures".
Journal of Performance Management, http://findarticles.com/p/articles/mi_qa4148/is_200505/ai_n15743
009 accessed on 02 Nov. 2008, 10 p.m.
Oriol, A. & Blake, J. & Wraith, P. & Oliveras E. (1999), "Dimensions of National Culture and the
Accounting Environment - The Spanish Case", Economics Working Papers 394, Department of
Economics and Business, Universitat Pompeu Fabra
Perera, H. (1989) “Towards a framework to analyze the impact of culture on accounting”, The
International Journal of Accounting, 24: 42-56
Perera, H. (1994) “Culture and international accounting: Some thoughts on research issues and
prospects”, Advances in International Accounting, 7: 267-285
Perera, M. H. B. & Mathews, M. R. (1990) “The cultural relativity of accounting and international
patterns of social accounting”, Advances in International Accounting, 3: 215-251
Pourjalali, H. & Meek, G., 1995, "Accounting and Culture: The case of Iran”, Research in Accounting in
Emerging Economies, Vol. 3: 3-17
PricewaterhouseCoopers (2004) Doing Business and Investing in the Slovak Republic
Roberts, C. B. & Salter, S. B. (1999) “Attitudes towards uniform accounting: Cultural or economic
phenomena?”, Journal of International Financial Management and Accounting, 10 (2): 119-142
Salter, S. B. & Niswander, F. (1995) “Cultural influence on the development of accounting systems
internationally: A test of gray's [1988] theory”, Journal of International Business Studies, 26(2): 379-397
Sondergaard, M. (1994) “Hofstede's consequences: A study of reviews, citations and replications”,
Organization Studies, 15(3): 447-456

Smith, P. B., Dugan, S. & Trompenaars, F. (1996) “National culture and the values of organizational
employees: A dimensional analysis across 43 nations”, Journal of Cross-Cultural Psychology, 27(2):
231-264
Talpoş, I., Dima, B., Mutaşcu, M. & Enache, C. (2005) “Agency, associations and culture: a tale of state
and society”, Public Choice Society Annual Meeting, New Orleans, March 10-13
Williams, C.A. & Aguilera, R. V. (2008) “Corporate Social Responsibility in a Comparative
Perspective”, in Crane, A. et.al., The Oxford Handbook of Corporate Social Responsibility (PDF),
Oxford: Oxford University Press
ANNEX
Table 1: The World Values Survey questions
Code of Question
FORMULATION DATA REPRESENTS
A005 Please say, for each of the following, how important it is in your life-
Work
Very important
A173 Some people feel they have completely free choice and control over their
lives, while other people feel that what they do has no real effect on what
happens to them. Please use this scale where 1 means "none at all" and 10
means "a great deal" to indicate how much freedom of choice and control
you feel you have over the way your life turns out.
None at all
C013 Here are some more aspects of a job that people say are important. Please
look at them and tell me which ones you personally think are important in
a job - Good job security.
Not mentioned
C016 Here are some more aspects of a job that people say are important. Please
look at them and tell me which ones you personally think are important in
a job?-An opportunity to use initiative
Not mentioned
C034 How free are you to make decisions in your job? None at all
C061 People have different ideas about following instructions at work. Some
say that one should follow one's superior's instructions even when one
does not fully agree with them. Others say that one should follow one's
superior's instructions only when one is convinced that they are right.
With which of these two opinions do you agree?
Follow
instructions
E163 Would you be prepared to actually do something to improve the
conditions of Your immediate family?
Absolutely yes
F114 Tell me for each of the following statements whether you think it can
always be justified, never be justified, or something in between, using this
card. Claiming government benefits to which you are not entitled
Never
justifiable
F116 Tell me for each of the following statements whether you think it can
always be justified, never be justified, or something in between, using this
card. Cheating on taxes if you have a chance
Never
justifiable
F145 According to you, how many of your compatriots do the following?-
Claiming state benefits to which they are
Almost all
F146 According to you, how many of your compatriots do the following?-
Cheating on tax if they have the chance
Almost all
Source: http://www.worldvaluessurvey.org/; 2008
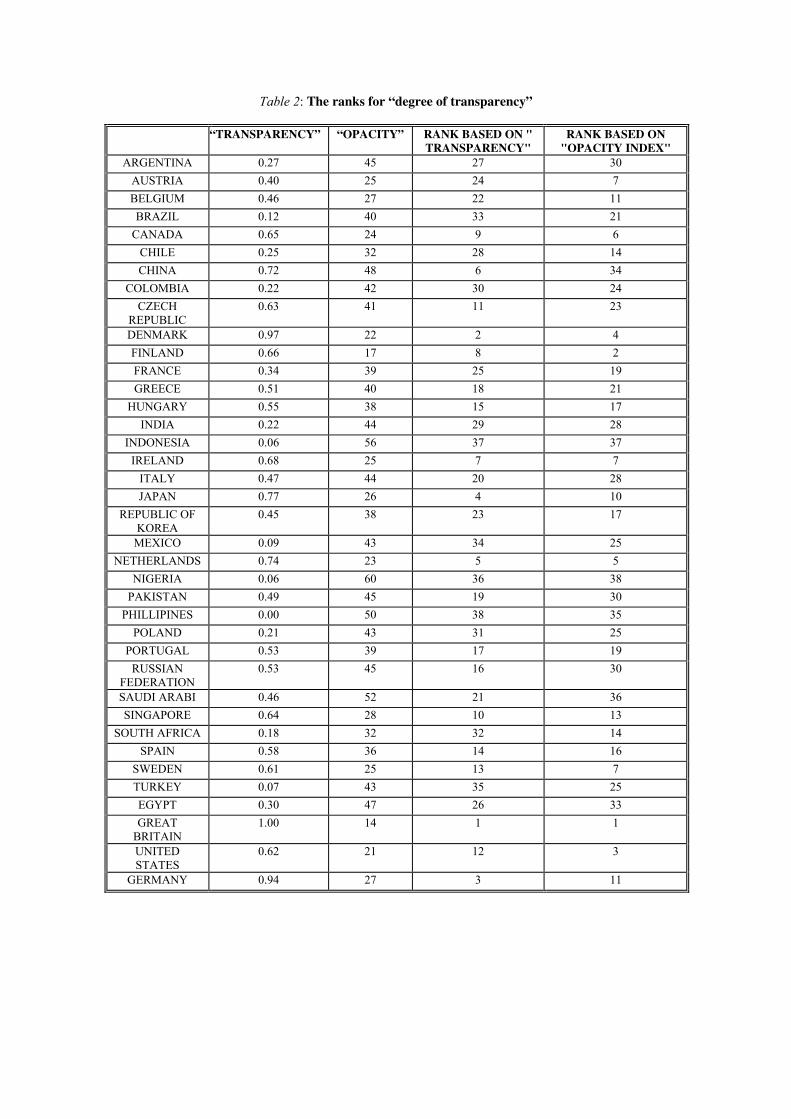
Table 2: The ranks for “degree of transparency”
“TRANSPARENCY” “OPACITY” RANK BASED ON " TRANSPARENCY"
RANK BASED ON "OPACITY INDEX"
ARGENTINA 0.27 45 27 30
AUSTRIA 0.40 25 24 7
BELGIUM 0.46 27 22 11
BRAZIL 0.12 40 33 21
CANADA 0.65 24 9 6
CHILE 0.25 32 28 14
CHINA 0.72 48 6 34
COLOMBIA 0.22 42 30 24
CZECH
REPUBLIC
0.63 41 11 23
DENMARK 0.97 22 2 4
FINLAND 0.66 17 8 2
FRANCE 0.34 39 25 19
GREECE 0.51 40 18 21
HUNGARY 0.55 38 15 17
INDIA 0.22 44 29 28
INDONESIA 0.06 56 37 37
IRELAND 0.68 25 7 7
ITALY 0.47 44 20 28
JAPAN 0.77 26 4 10
REPUBLIC OF
KOREA
0.45 38 23 17
MEXICO 0.09 43 34 25
NETHERLANDS 0.74 23 5 5
NIGERIA 0.06 60 36 38
PAKISTAN 0.49 45 19 30
PHILLIPINES 0.00 50 38 35
POLAND 0.21 43 31 25
PORTUGAL 0.53 39 17 19
RUSSIAN
FEDERATION
0.53 45 16 30
SAUDI ARABI 0.46 52 21 36
SINGAPORE 0.64 28 10 13
SOUTH AFRICA 0.18 32 32 14
SPAIN 0.58 36 14 16
SWEDEN 0.61 25 13 7
TURKEY 0.07 43 35 25
EGYPT 0.30 47 26 33
GREAT
BRITAIN
1.00 14 1 1
UNITED
STATES
0.62 21 12 3
GERMANY 0.94 27 3 11

Graphic 1: The scatterplots for transparency and GNI per capita
0.0
0.2
0.4
0.6
0.8
1.0
8,000 10,000 12,000 14,000 16,000 18,000 20,000
GNI per capita, PPI (current international $)
TR
AN
SP
AR
EN
CY
Note: For GNI data the source is: The World Bank Group (2008)
(http://web.worldbank.org/WBSITE/EXTERNAL/DATASTATISTICS). The data represents non-weighted
averages for 2000-2007
Table 3: Hofstede’s cultural variables and Hierarchical selectivity
Country Power Distance
Index Individualism Uncertainty
Avoidance Index Hierarchical
selectivity
Austria 11 55 70 0.0000
Belgium 65 75 94 0.2233
Czech Republic 57 58 74 0.2061
Denmark 18 74 23 0.3454
Finland 33 63 59 0.1992
France 68 71 86 0.3083
Germany 35 67 65 0.3484
Greece 60 35 112 0.0654
Hungary 46 55 82 0.5487
Italy 50 76 75 0.0614
Netherlands 38 80 53 0.1081
Norway 31 69 50 0.9191
Poland 68 60 93 0.0042
Portugal 63 27 104 0.5537
Spain 57 51 86 0.5105
Sweden 31 71 29 0.4354
Averages for continental European countries
45.69 61.69 72.19 0.30
United Kingdom 35 89 35 0.5879
United States 40 91 46 1.0000
Ireland 28 70 35 0.6644
Romania
Bulgaria
via
Poland
Lithuania
Estonia
Czech
Republic
Hungary
Slovakia

Note: The Hofstede cultural variables values are from: http://www.clearlycultural.com/geert-hofstede-
cultural-dimensions/, (2008)
Table 4: The FTE4Good Index Series (Data as at: 31/10/2008 FTSE4Good Index Series Values)
Index name Index value (LOC)
TRI (LOC) % Change on day
% Change on quarter
FTSE4Good Europe
Benchmark Index
3049.74 3824.25 2.67 -19.73
FTSE4Good Europe 50
Index
2775.51 3516.07 3.02 -17.22
FTSE4Good UK
Benchmark Index
3699.29 4754.62 1.7 -17.44
FTSE4Good UK 50
Index
3742.16 4844.07 1.73 -17.06
FTSE4Good US
Benchmark Index
3561.33 4052.31 1.38 -21.4
FTSE4Good US 100
Index
3429.64 3917.28 1.31 -21.09
FTSE4Good Global
Benchmark Index
4103.58 4866.42 0.19 -29.54
FTSE4Good Global 100
Index
3636.43 4348.31 0.48 -27.32
Source: FTSE Company (2008) - http://www.ftse.com/objects/csv_to_table.jsp?infoCode=NGF4G&these
Filters=&csvAll=&theseColumns=MCwxLDIsMyw0&theseTitles=&tableTitle=FTSE4Good%20Index%
20Series%20Values&dl=&p_encoded=1
Table 5: Hofstede’s cultural variables and Social subordination
Country Masculinity Individualism Social subordination
Austria 79 55 0.1728
Belgium 54 75 0.1349
Czech Republic 57 58 0.1795
Denmark 16 74 0.3067
Finland 26 63 0.1962
France 43 71 0.1366
Germany 66 67 0.1781
Greece 57 35 0.0138
Hungary 88 55 0.0000
Italy 70 76 0.0837
Netherlands 14 80 0.2265
Norway 8 69 0.9937
Poland 64 60 0.1547
Portugal 31 27 0.1184
Spain 42 51 0.9961
Sweden 5 71 0.2134
Averages for continental European countries 45.00 61.69 0.26
United Kingdom 66 89 0.2041
United States 62 91 1.0000
Ireland 68 70 0.1599
Table 6: Uncertainty avoidance and Cautious approach
Country Uncertainty avoidance Cautious approach
Austria 70 0.5718

Belgium 94 0.1983
Czech Republic 74 0.0361
Denmark 23 0.0695
Finland 59 0.2360
France 86 0.1891
Germany 65 0.6735
Greece 112 0.4182
Hungary 82 1.0000
Italy 75 0.3539
Netherlands 53 0.0000
Poland 93 0.6037
Portugal 104 0.3896
Sweden 29 0.2257
Averages for continental European countries 72.7857 0.3547
United Kingdom 35 0.2682
Ireland 35 0.4101
Figure 1: Accounting values and their determinants
Functional
conformism
Functional
transparency
Hierarchical
selectivity
Social
subordination
Cautious approach
Business
ethic
Respect for
the rules
Asymmetric
information
Corporate Social
Responsibility
Financial
instability
Individualism versus
Collectivism
Masculinity versus
Femininity Large versus Small
Power Distance
Strong versus Weak
Uncertainty Avoidance
Societal shifts
New architecture of
power relationships at
national and
international levels
Information
technology;
“Virtual
economic space”
“Environmental
conscience”; Socio-
demographic and
urban changes
Financial
globalization;
”Symbolic “economy
Global competition; New
production structures and
technologies; Resources
issues
Cultural Paradigms
shifts
Work
significance
Social hierarchy
significance
Social justice
significance
Risk aversion Freedom of
initiative

Table 7: The countries’ cross section identifiers set
Bulgaria Hungary Poland
Czech Republic Latvia Romania
Estonia Lithuania Slovakia
Table 8: The codification system for the domestic unlisted companies- the use of IFRSs (Individual financial statements - IFS)
WEIGHT TYPE of entity THE IFRSS ARE:
0.5 Financial institution Required=2 Permitted=1 Not permitted / Not mentioned =0
0.3 Large Required=2 Permitted=1 Not permitted / Not mentioned =0
0.2 Small and medium Required=2 Permitted=1 Not permitted / Not mentioned =0
Source: inspired by Use of IFRS by Jurisdiction updated at 17 June 2008, http://www.iasplus.com/
country/useias.htm
Table 9: The data set- cultural variables
COUNTRY SCORE NOT FREEDOM
NOT WORK
NOT HIERARCHY
NOT JUSTICE
NOT RISK
Bulgaria 1.8 1.847 0.486 1.027 -1.259 -0.715
Czech Republic 0 2.497 0.635 1.187 -1.220 -0.042
Estonia 1.5 2.327 0.666 1.556 -1.030 -0.132
Hungary 1 2.031 0.566 0.844 0.033 -1.038
Latvia 1 1.576 0.361 1.321 -1.577 0.007
Lithuania 1 1.558 0.612 1.650 -1.265 -0.348
Poland 0 2.073 0.247 1.366 -1.051 -0.628
Romania 0 2.034 0.348 1.061 -0.793 -0.407
Slovakia 2 2.182 0.486 1.091 -0.919 -0.507
Table 10: The variables’ statistics for the stacked data- cultural variables
SCORE NOT FREEDOM
NOT WORK
NOT HIERARCHY
NOT JUSTICE
NOT RISK
Mean 0.922222 2.013885 0.489677 1.233750 -1.009052 -0.423319
Median 1.000000 2.034202 0.486133 1.187444 -1.051448 -0.407334
Maximum 2.000000 2.497453 0.665532 1.650260 0.032814 0.007311
Minimum 0.000000 1.557805 0.247180 0.843970 -1.576511 -1.037503
Std. Dev. 0.777460 0.314597 0.145038 0.262046 0.452359 0.341500
Skewness -0.065023 -0.146807 -0.366632 0.239426 1.313631 -0.351029
Kurtosis 1.626039 2.093450 1.841671 2.011332 4.347074 2.213706
Jarque-Bera 0.714256 0.340515 0.704776 0.452537 3.268917 0.416679
Probability 0.699683 0.843447 0.703007 0.797504 0.195058 0.811932
Sum 8.300000 18.12496 4.407089 11.10375 -9.081465 -3.809875
Sum Sq. Dev. 4.835556 0.791772 0.168289 0.549345 1.637026 0.932977
Cross sections 9 9 9 9 9 9
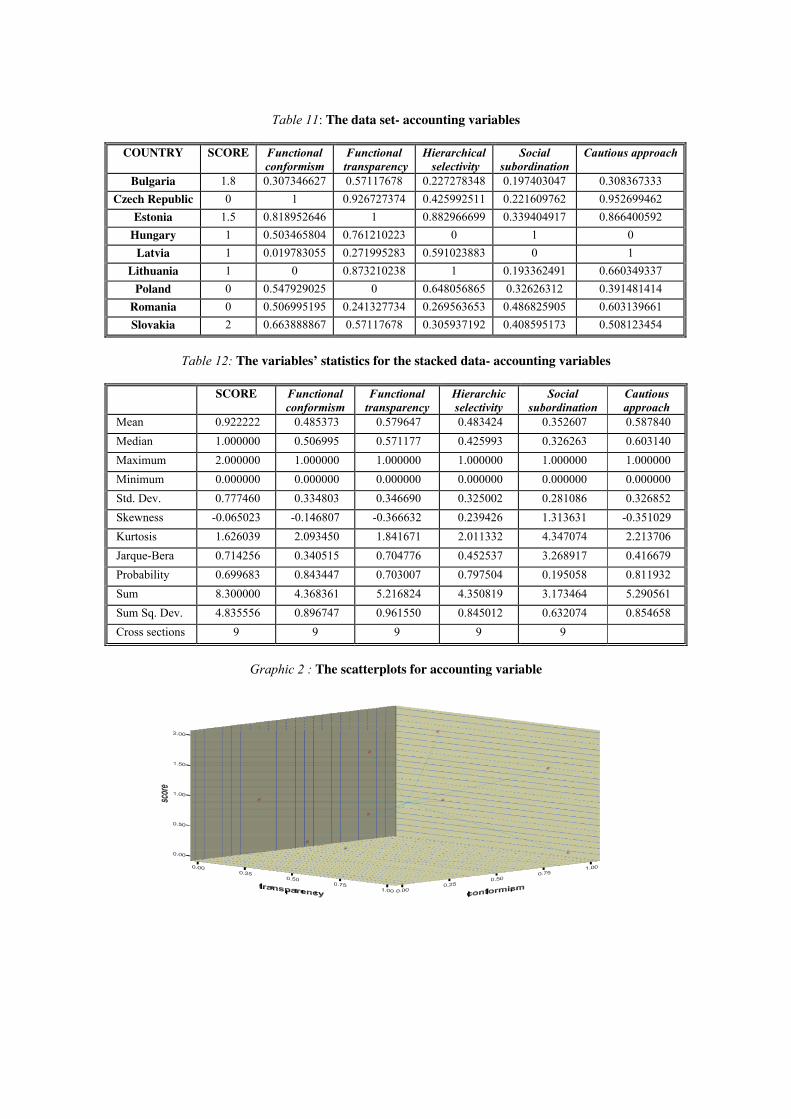
Table 11: The data set- accounting variables
COUNTRY SCORE Functional
conformism Functional
transparency Hierarchical
selectivity Social
subordination Cautious approach
Bulgaria 1.8 0.307346627 0.57117678 0.227278348 0.197403047 0.308367333
Czech Republic 0 1 0.926727374 0.425992511 0.221609762 0.952699462
Estonia 1.5 0.818952646 1 0.882966699 0.339404917 0.866400592
Hungary 1 0.503465804 0.761210223 0 1 0
Latvia 1 0.019783055 0.271995283 0.591023883 0 1
Lithuania 1 0 0.873210238 1 0.193362491 0.660349337
Poland 0 0.547929025 0 0.648056865 0.32626312 0.391481414
Romania 0 0.506995195 0.241327734 0.269563653 0.486825905 0.603139661
Slovakia 2 0.663888867 0.57117678 0.305937192 0.408595173 0.508123454
Table 12: The variables’ statistics for the stacked data- accounting variables
SCORE Functional
conformism Functional
transparency Hierarchic
selectivity Social
subordination Cautious
approach
Mean 0.922222 0.485373 0.579647 0.483424 0.352607 0.587840
Median 1.000000 0.506995 0.571177 0.425993 0.326263 0.603140
Maximum 2.000000 1.000000 1.000000 1.000000 1.000000 1.000000
Minimum 0.000000 0.000000 0.000000 0.000000 0.000000 0.000000
Std. Dev. 0.777460 0.334803 0.346690 0.325002 0.281086 0.326852
Skewness -0.065023 -0.146807 -0.366632 0.239426 1.313631 -0.351029
Kurtosis 1.626039 2.093450 1.841671 2.011332 4.347074 2.213706
Jarque-Bera 0.714256 0.340515 0.704776 0.452537 3.268917 0.416679
Probability 0.699683 0.843447 0.703007 0.797504 0.195058 0.811932
Sum 8.300000 4.368361 5.216824 4.350819 3.173464 5.290561
Sum Sq. Dev. 4.835556 0.896747 0.961550 0.845012 0.632074 0.854658
Cross sections 9 9 9 9 9
Graphic 2 : The scatterplots for accounting variable

0.00 0.25 0.50 0.75 1.00
cautious
0.00
0.50
1.00
1.50
2.00
score
Table 13: The discriminant analysis- score / accounting variables variables
Group Statistics
.6850 .27359 3 3.000
.3894 .48077 3 3.000
.4479 .19019 3 3.000
.3449 .13359 3 3.000
.6491 .28342 3 3.000
.3299 .34453 5 5.000
.6955 .28436 5 5.000
.5403 .42462 5 5.000
.3460 .38499 5 5.000
.5670 .41056 5 5.000
.6639 . a 1 1.000
.5712 . a 1 1.000
.3059 . a 1 1.000
.4086 . a 1 1.000
.5081 . a 1 1.000
.4854 .33480 9 9.000
.5796 .34669 9 9.000
.4834 .32500 9 9.000
.3526 .28109 9 9.000
.5878 .32685 9 9.000
conformism transparency selectivity subordination cautious conformism transparency selectivity subordination cautious conformism transparency selectivity subordination cautious conformism transparency selectivity subordination cautious
score .00
1.00
2.00
Total
Mean Std. Deviation Unweighted Weighted
Valid N (listwise)
Insufficient data a.
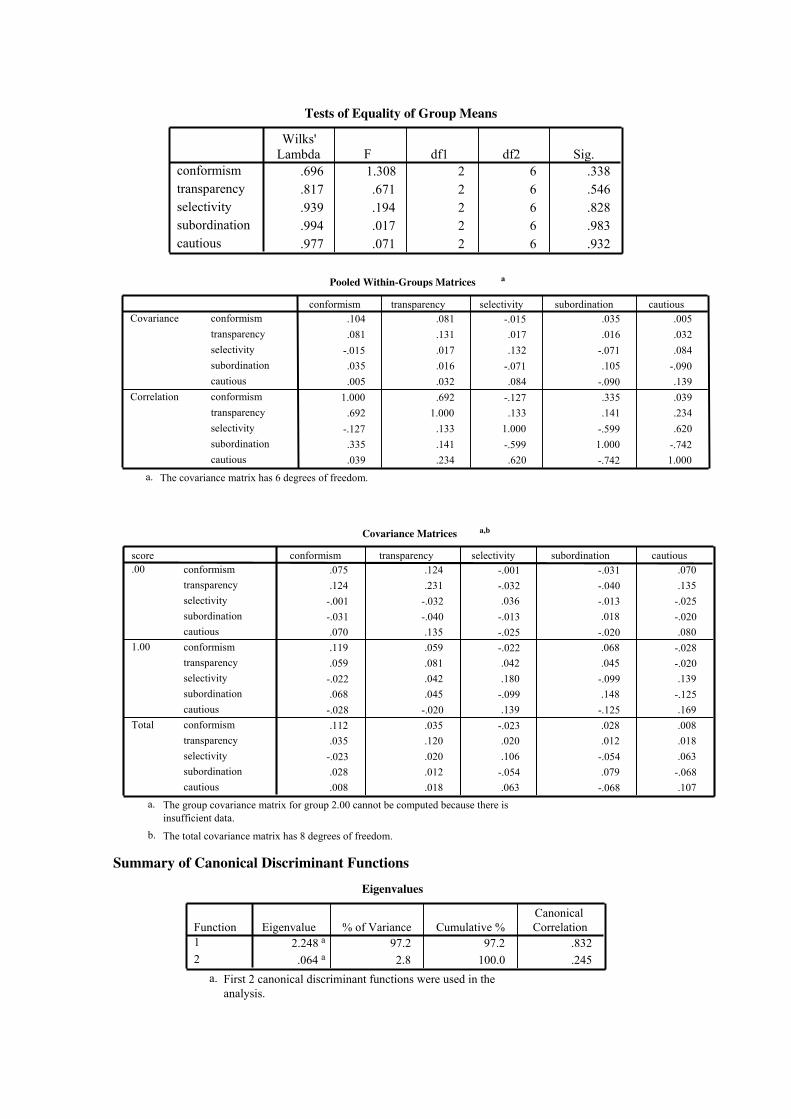
Summary of Canonical Discriminant Functions
Tests of Equality of Group Means
.696 1.308 2 6 .338
.817 .671 2 6 .546
.939 .194 2 6 .828
.994 .017 2 6 .983
.977 .071 2 6 .932
conformism
transparency
selectivity
subordination
cautious
Wilks'
Lambda F df1 df2 Sig.
Pooled Within-Groups Matrices a
.104 .081 -.015 .035 .005
.081 .131 .017 .016 .032
-.015 .017 .132 -.071 .084
.035 .016 -.071 .105 -.090
.005 .032 .084 -.090 .139
1.000 .692 -.127 .335 .039
.692 1.000 .133 .141 .234
-.127 .133 1.000 -.599 .620
.335 .141 -.599 1.000 -.742
.039 .234 .620 -.742 1.000
conformism transparency selectivity subordination
cautious conformism transparency selectivity subordination
cautious
Covariance
Correlation
conformism transparency selectivity subordination cautious
The covariance matrix has 6 degrees of freedom.a.
Covariance Matrices a,b
.075 .124 -.001 -.031 .070
.124 .231 -.032 -.040 .135
-.001 -.032 .036 -.013 -.025
-.031 -.040 -.013 .018 -.020
.070 .135 -.025 -.020 .080
.119 .059 -.022 .068 -.028
.059 .081 .042 .045 -.020
-.022 .042 .180 -.099 .139
.068 .045 -.099 .148 -.125
-.028 -.020 .139 -.125 .169
.112 .035 -.023 .028 .008
.035 .120 .020 .012 .018
-.023 .020 .106 -.054 .063
.028 .012 -.054 .079 -.068
.008 .018 .063 -.068 .107
conformism
transparency
selectivity subordination
cautious conformism
transparency
selectivity subordination
cautious conformism
transparency
selectivity subordination
cautious
score .00
1.00
Total
conformism transparency selectivity subordination cautious
The group covariance matrix for group 2.00 cannot be computed because there is
insufficient data.
a.
The total covariance matrix has 8 degrees of freedom.b.
Eigenvalues
2.248 a 97.2 97.2 .832 .064 a 2.8 100.0 .245
Function
1 2
Eigenvalue % of Variance Cumulative %
Canonical
Correlation
First 2 canonical discriminant functions were used in the
analysis.
a.

Classification Statistics
Wilks' Lambda
.289 4.960 10 .894
.940 .248 4 .993
Test of Function(s)
1 through 2
2
Wilks'Lambda Chi-square df Sig.
1.338 -.321
-1.301 -.560
.029 .827
-.031 1.010
.280 .836
conformism
transparency
selectivity
subordination
cautious
1 2
Function
Standardized Canonical Discriminant Function Coefficients
Structure Matrix
-.121 .707 *.068 .456 *
.434 -.442 *
-.310 -.334 *.009 -.292 *
selectivity cautious conformism transparency subordination
1 2Function
Pooled within-groups correlations between discriminatingvariables and standardized canonical discriminant functionsVariables ordered by absolute size of correlation within function.
Largest absolute correlation between each variable andany discriminant function
*.
Canonical Discriminant Function Coefficients
4.147 -.995
-3.596 -1.546
.078 2.275
-.097 3.122
.751 2.241
-.373 -2.138
conformism
transparency
selectivity
subordination
cautious
(Constant)
1 2
Function
Unstandardized coefficients
Functions at Group Centroids
1.556 .128
-1.072 .038
.692 -.572
score.00
1.00
2.00
1 2
Function
Unstandardized canonical discriminantfunctions evaluated at group means
Prior Probabilities for Groups
.333 3 3.000
.333 5 5.000
.333 1 1.0001.000 9 9.000
score .00 1.00 2.00
Total
Prior Unweighted WeightedCases Used in Analysis
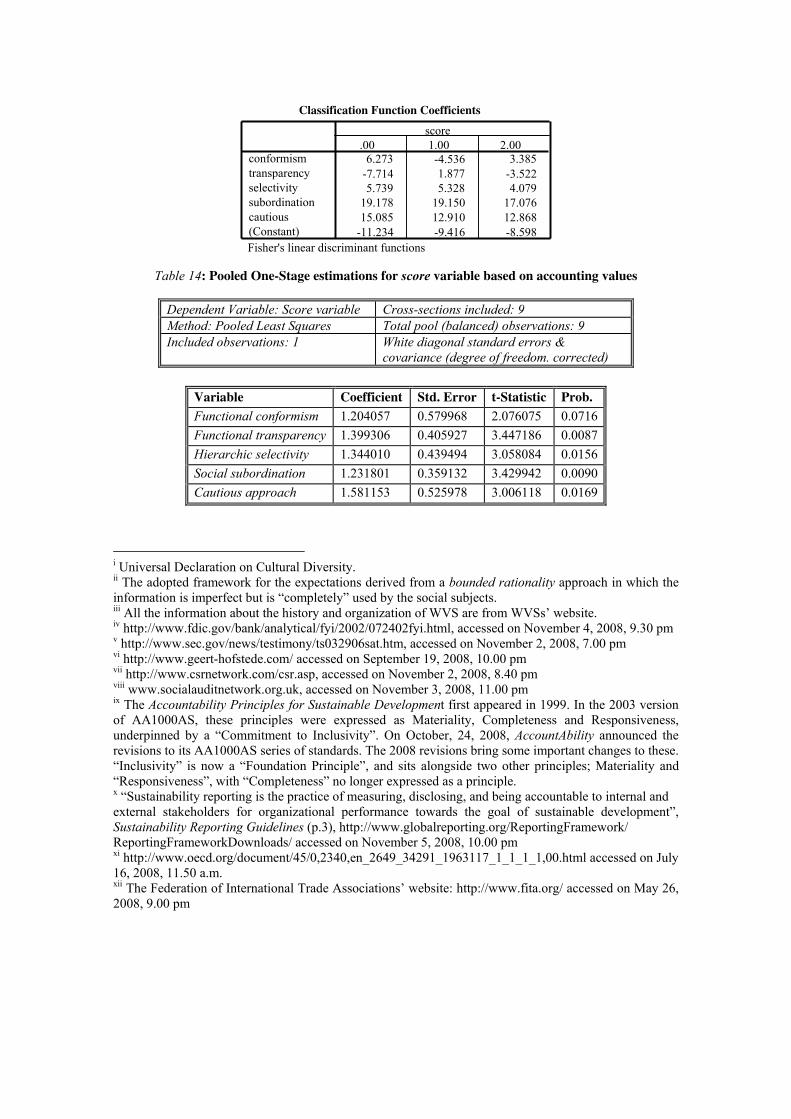
Table 14: Pooled One-Stage estimations for score variable based on accounting values
Dependent Variable: Score variable Cross-sections included: 9
Method: Pooled Least Squares Total pool (balanced) observations: 9
Included observations: 1 White diagonal standard errors &
covariance (degree of freedom. corrected)
Variable Coefficient Std. Error t-Statistic Prob.
Functional conformism 1.204057 0.579968 2.076075 0.0716
Functional transparency 1.399306 0.405927 3.447186 0.0087
Hierarchic selectivity 1.344010 0.439494 3.058084 0.0156
Social subordination 1.231801 0.359132 3.429942 0.0090
Cautious approach 1.581153 0.525978 3.006118 0.0169
i Universal Declaration on Cultural Diversity. ii The adopted framework for the expectations derived from a bounded rationality approach in which the
information is imperfect but is “completely” used by the social subjects. iii All the information about the history and organization of WVS are from WVSs’ website. iv http://www.fdic.gov/bank/analytical/fyi/2002/072402fyi.html, accessed on November 4, 2008, 9.30 pm v http://www.sec.gov/news/testimony/ts032906sat.htm, accessed on November 2, 2008, 7.00 pm vi http://www.geert-hofstede.com/ accessed on September 19, 2008, 10.00 pm vii http://www.csrnetwork.com/csr.asp, accessed on November 2, 2008, 8.40 pm viii www.socialauditnetwork.org.uk, accessed on November 3, 2008, 11.00 pm ix The Accountability Principles for Sustainable Development first appeared in 1999. In the 2003 version
of AA1000AS, these principles were expressed as Materiality, Completeness and Responsiveness,
underpinned by a “Commitment to Inclusivity”. On October, 24, 2008, AccountAbility announced the
revisions to its AA1000AS series of standards. The 2008 revisions bring some important changes to these.
“Inclusivity” is now a “Foundation Principle”, and sits alongside two other principles; Materiality and
“Responsiveness”, with “Completeness” no longer expressed as a principle. x “Sustainability reporting is the practice of measuring, disclosing, and being accountable to internal and
external stakeholders for organizational performance towards the goal of sustainable development”,
Sustainability Reporting Guidelines (p.3), http://www.globalreporting.org/ReportingFramework/
ReportingFrameworkDownloads/ accessed on November 5, 2008, 10.00 pm xi http://www.oecd.org/document/45/0,2340,en_2649_34291_1963117_1_1_1_1,00.html accessed on July
16, 2008, 11.50 a.m. xii The Federation of International Trade Associations’ website: http://www.fita.org/ accessed on May 26,
2008, 9.00 pm
Classification Function Coefficients
6.273 -4.536 3.385
-7.714 1.877 -3.522
5.739 5.328 4.079
19.178 19.150 17.076
15.085 12.910 12.868
-11.234 -9.416 -8.598
conformism
transparency
selectivity
subordination
cautious
(Constant)
.00 1.00 2.00
score
Fisher's linear discriminant functions


![Sparrow hospital cultural competency discussion series – lgbt slideshow upload [autosaved]](https://static.fdocuments.net/doc/165x107/55cc9316bb61eb67578b484a/sparrow-hospital-cultural-competency-discussion-series-lgbt-slideshow-upload.jpg)