
A desynchronised recovery: Global economic outlook · Schroders Insurance Asset Management...
43
November 2014 | For professional investors only. This material is not suitable for retail clients Schroders Insurance Asset Management Investment Seminar 2014 A desynchronised recovery: Global economic outlook Keith Wade | Chief Economist and Strategist
Transcript of A desynchronised recovery: Global economic outlook · Schroders Insurance Asset Management...

November 2014 | For professional investors only. This material is not suitable for retail clients
Schroders Insurance Asset Management
Investment Seminar 2014
A desynchronised
recovery: Global
economic outlook
Keith Wade | Chief Economist and Strategist

Global recovery – can the world resynchronise?
US – recovery and Fed on track?
Eurozone – turning Japanese?
UK – how long will the boom last?
Japan – is “Abenomics” working?
Emerging markets – will China crash?
Markets in 2015
Asset allocation – the return of “irrational exuberance”?
Key issues Macro and market outlook?
1
Outline

Global recovery What happened?

Recovery recap – real GDP since the crisis began US bounces back, but Japan and Germany falter in Q2 and Q3
UK
US
Spa
EZ
Ger
Ita
Jap
90
92
94
96
98
100
102
104
106
108
110
2008 2009 2010 2011 2012 2013 2014 2015
Index (100 = 2007 Q4)
3
Source: Thomson Datastream, Schroders at 14 November 2014
01/12/2014 17:49:02

Emerging markets not sharing in developed world recovery
EM beta to global growth has fallen
4
Source: Thomson Datastream at 19 November 2014

Global trade has not recovered from the crisis Trade-orientated emerging markets are struggling
-40
-20
0
20
40
60
1970 1975 1980 1985 1990 1995 2000 2005 2010
Recession World exports y/y%, LHS Average trade growth, RHS
5
Source: Thomson Datastream, Schroders at 4 November 2014
y/y%

An era of USD strength? The return of currency wars?
6
Source: Thomson Datastream, Schroders at 19 November 2014
USD trade-weighted index: breakdown JPY since Abenomics

G7 headline CPI and GS commodity prices
Fall in commodity prices will drive inflation lower
Should we worry?
7
Source: Thomson Datastream, Schroders at 19 November 2014

US Recovery and Fed on
track?
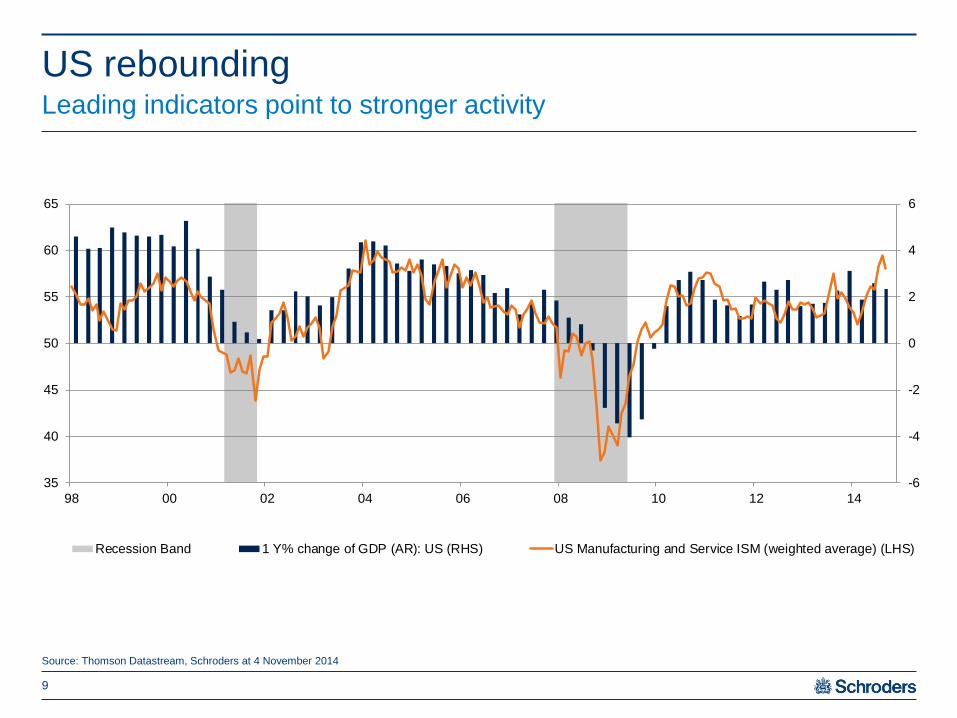
US rebounding Leading indicators point to stronger activity
9
Source: Thomson Datastream, Schroders at 4 November 2014
-6
-4
-2
0
2
4
6
35
40
45
50
55
60
65
98 00 02 04 06 08 10 12 14
Recession Band 1 Y% change of GDP (AR): US (RHS) US Manufacturing and Service ISM (weighted average) (LHS)
1.5
2.0
2.5
3.0
3.5
2010 2011 2012 2013 2014 2015
2011 2012 2013 2014 2015
%
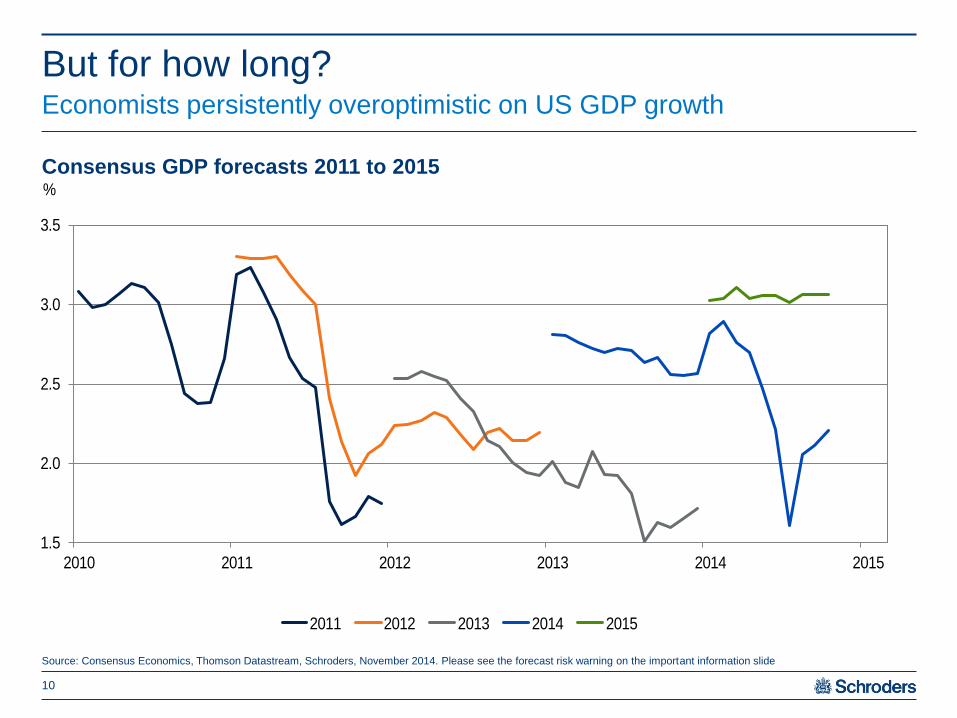
Consensus GDP forecasts 2011 to 2015
But for how long? Economists persistently overoptimistic on US GDP growth
10
Source: Consensus Economics, Thomson Datastream, Schroders, November 2014. Please see the forecast risk warning on the important information slide

US debt levels – deleveraging to continue Households continue to de-lever, but corporate and public debt has increased
11
Source: Thomson Datastream, Schroders at 8 September 2014
30
40
50
60
70
80
90
100
1960 1965 1970 1975 1980 1985 1990 1995 2000 2005 2010
Households Corporates (Non Financial) Government
% of GDP

Sign of secular stagnation?
Trend productivity slows after boost from internet
12
Source: Thomson Datastream, Schroders at 19 November 2014
01/12/2014 17:49:03
y/y%

48
50
52
54
56
58
60
62
64
66
68
70
0
2
4
6
8
10
12
14
16
18
20
22
55 60 65 70 75 80 85 90 95 00 05 10 15
NBER defined US recessions Unemployment rate (%), lhs
Participation rate (%), rhs
4.5% 5.0% 5.5% 5.8%*
62.0%* 118k 56k -5k -42k
62.5%* 213k 151k 89k 51k
62.8%* 270k 207k 145k 107k
63.0%* 307k 245k 182k 145k
Participation
rate
Unemployment rate
Unemployment to fall faster than Fed expects Fall in participation rate is more structural than cyclical
13
1Source: Thomson Datastream, Schroders at 11 November 2014 2Source: Atlanta Federal Reserve, Schroders at 9 October 2014 3Denotes current participation and unemployment rate. NBER – The National Bureau of Economic Research
Change in payrolls needed to achieve U/E
rate in 1year2
The Federal Open Market Committee (FOMC) projects the
unemployment rate to be between 5.4 and 5.6% in Q4 2015 and 5.1 –
5.4% in Q4 2016 (September 2014 projections). The current 3 month
average payroll print is 224k
Fall in the participation rate key to fall in
U/E rate1

US wages rise as labour market tightens Another prop to consumer spending, but concern for the Fed
14
Source: Thomson Datastream, Schroders at 19 November 2014
y/y % %

Eurozone –
turning Japanese?
“They make a desert and
call it peace” – Tacitus

Eurozone outlook Not a lot to smile about
16

Eurozone recovery shows signs of fatigue Eurozone GDP vs BNB survey
17
Source: Thomson Datastream, Markit, Belgian National Bank, Eurostat, Schroders at 4 November 2014
-30
-25
-20
-15
-10
-5
0
5
10
-6
-4
-2
0
2
4
6
2002 2004 2006 2008 2010 2012 2014
Eurozone GDP growth, Y/Y % (lhs) Belgian National bank survey (rhs)
y/y %

Key difference between US and Europe US banking sector is lending again, Eurozone yet to turn positive
-15
-10
-5
0
5
10
15
92 94 96 98 00 02 04 06 08 10 12 14
US Commercial bank lending y/y% Eurozone bank lending y/y%
18
Source: Thomson Datastream, Schroders at 4 November 2014
y/y%

Out of the woods? Eurozone needs to pull clear of deflation
19
Source: Thomson Datastream, Eurostat, Schroders at 4 November 2014
-1.5%
-1.0%
-0.5%
0.0%
0.5%
1.0%
1.5%
2.0%
2.5%
3.0%
3.5%
4.0%
4.5%
2005 2006 2007 2008 2009 2010 2011 2012 2013 2014
Y/Y
Core Energy Food incl. alcohol & tobacco Headline

-1.0
-0.5
0.0
0.5
1.0
1.5
2.0
2.5
3.0
3.5
4.0
4.5
2004 2005 2006 2007 2008 2009 2010 2011 2012 2013 2014
Minimal Low Moderate High CPI, Y/Y% (lhs)
IMF deflation vulnerability
indicator reconstructed and
updated to flag risk of deflation
Currently estimates a 14%
chance of deflation two years
from the point of entering the
moderate risk category (down
from 25% in the high risk
category)
ECB responded in June with
cut in deposit rate and
announced new bank funding
(TLTROs). Then cut again in
September, and announced
asset-backed security
purchases
Market inflation expectations
remain very low
Eurozone deflation Risk moderates after fall in EUR
20
Source: IMF, Thomson Reuters Datastream, Schroders Economic Group at 9 September 2014. Vulnerability indicator at Q2 2014
-1.0
-0.5
0.0
0.5
1.0
1.5
2.0
2.5
3.0
3.5
4.0
4.5
04 05 06 07 08 09 10 11 12 13 14
Eurozone CPI %YoY and Deflation Vulnerability Indicator
Minimal Low Moderate High CPI %YoY (LHS)
Eurozone CPI % Y/Y and Deflation Vulnerability Indicator

UK
How long will the boom
last?

UK economic growth close to peak GDP growth vs Schroders Activity Index
-3.0%
-2.5%
-2.0%
-1.5%
-1.0%
-0.5%
0.0%
0.5%
1.0%
1.5%
2.0%
2.5%
97 98 99 00 01 02 03 04 05 06 07 08 09 10 11 12 13 14
Q/Q
GDP Growth Schroders Activity Index
22
Source: ONS, Markit, CBI, Schroders at 4 November 2014
01/12/2014 17:49:03

-30%
-20%
-10%
0%
10%
20%
30%
40%
50%
05 06 07 08 09 10 11 12 13 14 15
Halifax 3m/3m (AR)
New buyers - New instructions (6m lead)
-20%
-15%
-10%
-5%
0%
5%
10%
15%
05 06 07 08 09 10 11 12 13 14
House prices (Y/Y)
Range of houseprices Average of surveys
House price growth appears to be peaking Leading indicators softening
23
Source: Thomson Datastream, Halifax, Nationwide, Rightmove Hometrack, LSL/Acadametrics, ONS, Schroders at 29 September 2014
01/12/2014 17:49:03

UK fiscal policy will continue to weigh on activity Policy to tighten further to meet government targets
24
Source: OBR, Schroders at 2 April 2014. Forecast risk warning: Please refer to the important information slide at the end of the presentation
-4
-3
-2
-1
0
1
2
3
4
97
/98
98
/99
99
/00
00
/01
01
/02
02
/03
03
/04
04
/05
05
/06
06
/07
07
/08
08
/09
09
/10
10
/11
11
/12
12
/13
13
/14
14
/15
15
/16
16
/17
17
/18
18
/19
Forecast Change in cyclically adjusted primary balance
% of GDP
Fiscal tightening
Fiscal stimulus
In years

Japan
Is Abenomics working?
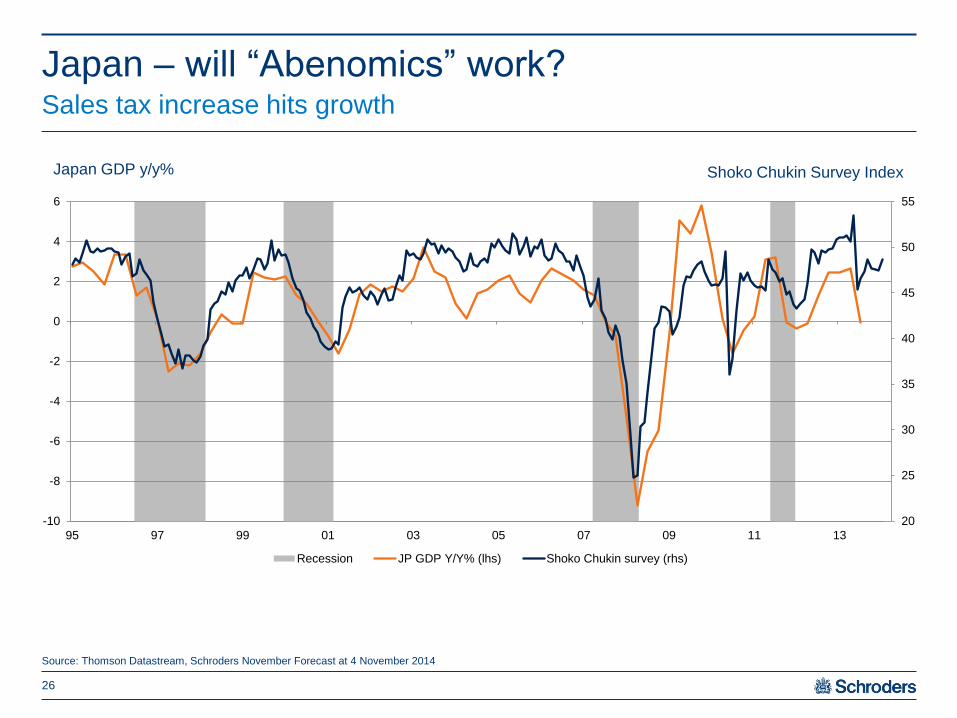
Japan – will “Abenomics” work? Sales tax increase hits growth
26
Source: Thomson Datastream, Schroders November Forecast at 4 November 2014
20
25
30
35
40
45
50
55
-10
-8
-6
-4
-2
0
2
4
6
95 97 99 01 03 05 07 09 11 13
Recession JP GDP Y/Y% (lhs) Shoko Chukin survey (rhs)
Japan GDP y/y% Shoko Chukin Survey Index

Pick up in worker earnings offset by higher inflation Lower real wages will slow consumption
27
Earnings are calculated by summing the six month moving average y/y% changes of wages per hour, hours per worker and the number of workers
Wage inflation shows the Y/Y% change in contract cash earnings
Source: Thomson Datastream, Morgan Stanley, Schroders at 4 November 2014
-6
-4
-2
0
2
4
6
8
10
1991 1993 1995 1997 1999 2001 2003 2005 2007 2009 2011 2013
CPI inflation Contracted wage inflation Earnings inflation (incl. bonuses)
y/y%

Emerging
markets
Will China crash?

China slowdown to continue Expect China to lower the growth target in 2015
29
Source: Thomson Datastream, Schroders at 4 November 2014
4
6
8
10
12
14
16
-20
0
20
40
60
80
100
02/06 02/07 02/08 02/09 02/10 02/11 02/12 02/13 02/14
Casino revenue - Macau, LHS Chinese GDP Y/Y%, RHS
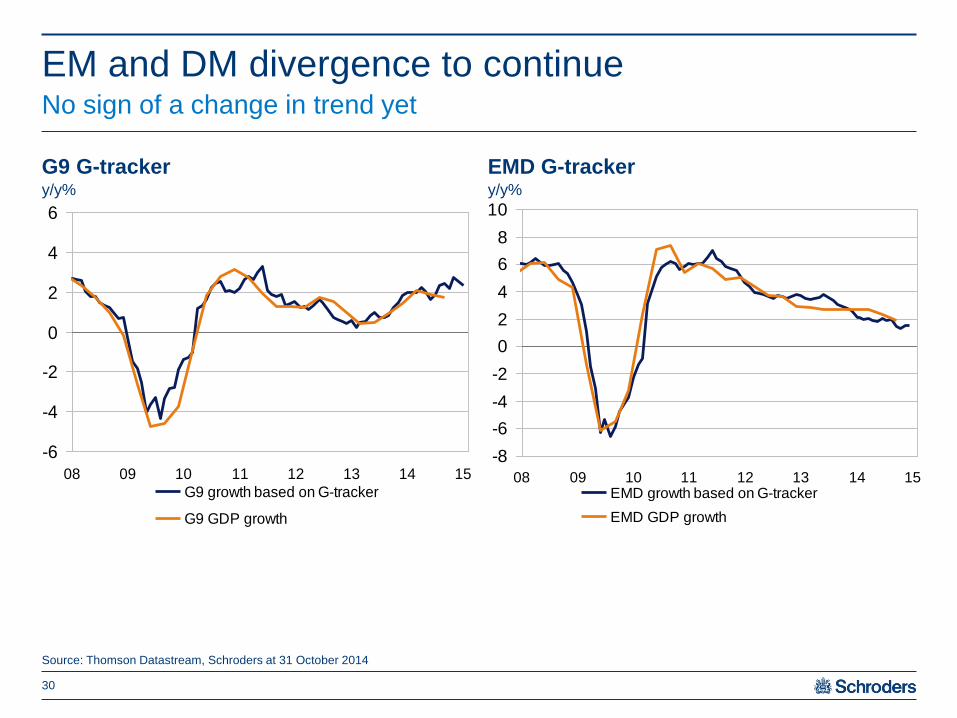
EM and DM divergence to continue No sign of a change in trend yet
30
Source: Thomson Datastream, Schroders at 31 October 2014
G9 G-tracker EMD G-tracker
01/12/2014 17:49:03
y/y%
-6
-4
-2
0
2
4
6
08 09 10 11 12 13 14 15
G9 growth based on G-tracker
G9 GDP growth
-8
-6
-4
-2
0
2
4
6
8
10
08 09 10 11 12 13 14 15EMD growth based on G-tracker
EMD GDP growth
y/y%
0
0.1
0.2
0.3
0.4
0.5
0.6
0.7
0.8
0 0.05 0.1 0.15 0.2 0.25
Competition index
Exports to Japan as share of total
Philippines
Indonesia
Malaysia
Thailand
Vietnam
Chile
China
South Korea
Peru
Russia
India
Brazil
Germany
US
EMEAColombia
Mex
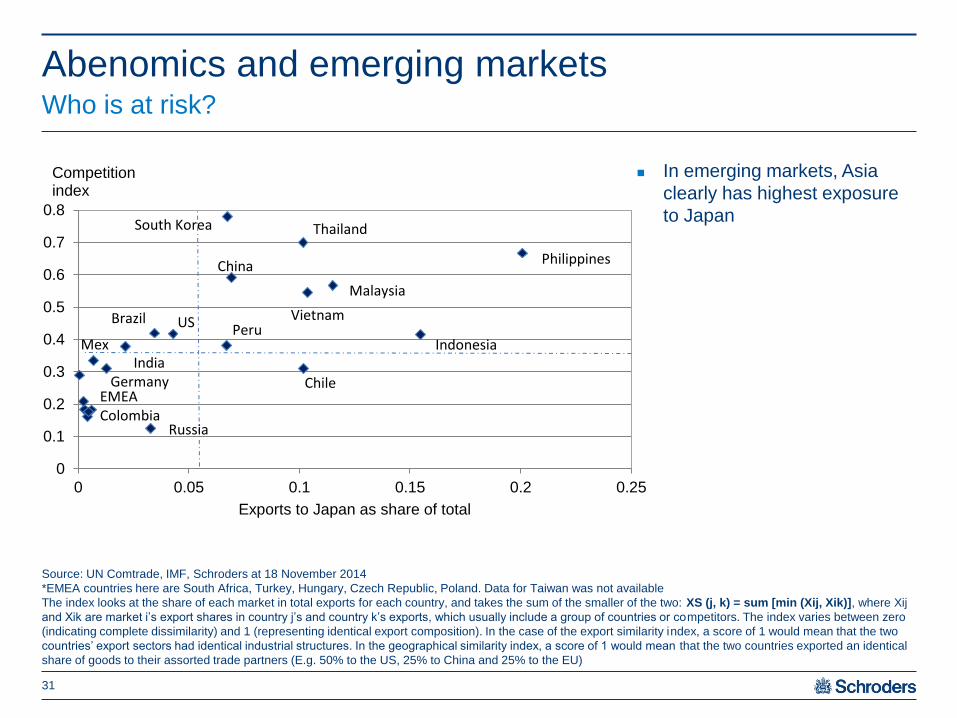
Abenomics and emerging markets Who is at risk?
In emerging markets, Asia
clearly has highest exposure
to Japan
31
Source: UN Comtrade, IMF, Schroders at 18 November 2014
*EMEA countries here are South Africa, Turkey, Hungary, Czech Republic, Poland. Data for Taiwan was not available
The index looks at the share of each market in total exports for each country, and takes the sum of the smaller of the two: XS (j, k) = sum [min (Xij, Xik)], where Xij
and Xik are market i’s export shares in country j’s and country k’s exports, which usually include a group of countries or competitors. The index varies between zero
(indicating complete dissimilarity) and 1 (representing identical export composition). In the case of the export similarity index, a score of 1 would mean that the two
countries’ export sectors had identical industrial structures. In the geographical similarity index, a score of 1 would mean that the two countries exported an identical
share of goods to their assorted trade partners (E.g. 50% to the US, 25% to China and 25% to the EU)
01/12/2014 17:49:03

Fed tightening and emerging markets Problems remain despite adjustments
Source: IMF, Bank for International Settlements (BIS), World Bank Joint External Debt Hub (JEDH), Bloomberg, Schroders, September 2014
0
100
200
300
400
500
600
2013 Q3 2013 Q4 2014 Q1
32
Gross external financing requirement (GEFR) as % reserves

Markets in 2015

Liquidity is everywhere What price? Napoleon’s hat, the stars and stripes, Elvis
34
Source: BBC, The Telegraph, The Guardian

Thanks to central banks How much money has been printed?
0
2
4
6
8
10
12
14
16
18
2005 2006 2007 2008 2009 2010 2011 2012 2013 2014
Value of assets in central banks' balance sheets (Trillions of USD)
Eurozone Japan Switzerland China US UK
35
Source: Thomson Datastream, Schroders at 7 November 2014
01/12/2014 17:49:03
$9.7
Trillion

Equity and bond markets have parted company Higher equity markets and lower bond yields since 2012
36
Source: Thomson Datastream, Schroders at 19 November 2014
Index

Rally begins to stretch some markets Equity market valuations (10-year history)
0
5
10
15
20
25
30
35
40
Russia(Micex)
China (Hshares)
MSCI EM Brazil(Bovespa)
UK (FTSE) Korea(Kospi)
Germany(DAX)
Japan(Topix)
MSCI DM France(CAC)
India(Nifty)
US (S&P) Eurostoxx
Current PE Mean Last year
PE ratio
Based on a 10 year history
37
The “box” in the box and whisker plot represents the interquartile range of data points and the “whisker” represents the maximum and minimum range over the past 10 years
Source: Thomson Datastream, Schroders at 6 November 2014
01/12/2014 17:49:03

Dollar strength creates emerging markets trouble The stronger USD will weigh on emerging vs developed equity performance
38
Source: Thomson Datastream, Schroders at 19 November 2014
01/12/2014 17:49:03

2015 surprise? USD strength may hold the Fed back US$ will weigh on inflation in the US
-15
-10
-5
0
5
10
15
20-10
-8
-6
-4
-2
0
2
4
6
8
10
96 98 00 04 06 08 10 12 14
Recession Import Prices exc Oil USD Broad Index 3m lead (rhs, inverted)
39
Source: Thomson Datastream, Schroders at 4 November 2014
01/12/2014 17:49:04
y/y, % y/y, %
-15
-10
-5
0
5
10
15
20-10
-8
-6
-4
-2
0
2
4
6
8
10
'96 '98 '00 '02 '04 '06 '08 '10 '12 '14
Import Prices exc Oil USD Broad Index 3m lead (rhs, inverted) Recession
y/y, % y/y, %
Asia crisisAsia crisis

Asset allocation views November 2014
40
Key: +/- market expected to outperform/ underperform (maximum +++ minimum ---) 0 indicates a neutral position
The above asset allocation is for illustrative purposes only. Actual client portfolios will vary according to mandate, benchmark, risk profile and the availability and riskiness of individual
asset classes in different regions. Source: Schroders Global Market Perspective Q4 2014
Equity + Bonds 0 Alternatives 0 Cash - Currency
By region By Sector By Sector USD +
US + Government 0 Commodities 0 JPY --
Europe ex UK 0 Inflation-linked 0 UK Property + EUR -
UK 0 Investment
grade
- GBP 0
Pacific ex Japan
(Australia, New
Zealand, Hong
Kong and
Singapore)
0 Emerging
market debt
0 AUD -
Japan + High yield - CHF 0
Emerging
Markets
0 EM 0
Gold 0

Global recovery remains de-synchronised reflecting policy
differences and structural headwinds
Lower commodity prices driven by supply as much as demand, will
support growth in 2015
US: most advanced in cycle, growth on a sustainable path, policy
rates to rise in 2015. USD to strengthen further
Eurozone: sluggish growth, but deflation should be avoided. ECB
will keep monetary policy loose
UK: the boom is fading, political risk will hamper growth in H1 2015
delaying Bank of England rate rise until H2
Emerging markets: vulnerable to tighter Fed policy. China growth
to remain tepid, but hard landing should be avoided
Macro risks skewed to downside/deflation
Back to “irrational exuberance” for markets?
Summary Global outlook and risks
41

For professional investors only. This material is not suitable for retail clients
The views and opinions contained herein are those of the Schroders Economics Group, and may not necessarily represent views expressed or reflected
in other Schroders communications, strategies or funds
This presentation is intended to be for information purposes only and it is not intended as promotional material in any respect. The material is not intended as an offer
or solicitation for the purchase or sale of any financial instrument. The material is not intended to provide, and should not be relied on for, accounting, legal or tax
advice, or investment recommendations. Information herein is believed to be reliable but Schroders does not warrant its completeness or accuracy. No responsibility
can be accepted for errors of fact or opinion. Reliance should not be placed on the views and information in the document when taking individual investment and/or
strategic decisions
Third party data is owned or licensed by the data provider and may not be reproduced or extracted and used for any other purpose without the data provider's
consent. Third party data is provided without any warranties of any kind. The data provider and issuer of the document shall have no liability in connection with the
third party data. The Prospectus and/or www.schroders.com contains additional disclaimers which apply to the third party data
Past performance is not a reliable indicator of future results, prices of shares and the income from them may fall as well as rise and investors may not get back the
amount originally invested
Forecast risk warning: The forecasts included in this presentation should not be relied upon, are not guaranteed and are provided only as at the date of issue. Our
forecasts are based on our own assumptions which may change. We accept no responsibility for any errors of fact or opinion and assume no obligation to provide
you with any changes to our assumptions or forecasts. Forecasts and assumptions may be affected by external economic or other factors.
Issued in November 2014 by Schroder Investment Management Limited, 31 Gresham Street, London EC2V 7QA. Registered No: 1893220 England. Authorised and
regulated by the Financial Conduct Authority. UK08460
Important information
42