A Decision Analytic Framework for Considering the Economic Value of Improved Risk Assessment Data...
32
A Decision Analytic Framework for Considering the Economic Value of Improved Risk Assessment Data Eric Ruder Henry Roman Industrial Economics October 12, 2011
-
Upload
ira-francis -
Category
Documents
-
view
214 -
download
1
Transcript of A Decision Analytic Framework for Considering the Economic Value of Improved Risk Assessment Data...

A Decision Analytic Framework for Considering the Economic Value of
Improved Risk Assessment Data
Eric Ruder Henry Roman
Industrial Economics
October 12, 2011

IEcOverview of Presentation
• Objective: Explore the potential value of improved risk assessment data in the context of environmental regulation and research priority setting (both public and private sector)
• Nature of the problem
• Analytical framework.
• Examples• Results of Case Studies: Lead regulation and mobile
source related air toxics requirements
• Hypothetical scenario of research to support product development
• Implications2

IEc
3
Nature of the Problem – Evaluating Improvements in Risk Assessment
• There are numerous sources of uncertainty in risk assessment that may be addressed (at least partially) by improved risk assessment methods and/or data:• Improving methods for evaluating the potential risks of
chemicals. • Identifying susceptible populations and characterizing factors
that may place them at higher risk. • Understanding how chemicals move and change along
pathways from sources to potentially exposed populations.
• Advances in these areas seems of obvious value in the field of risk assessment and the protection of human health and the environment, but are there quantifiable net benefits for society or economic benefits for the private sector?

IEcValue of Information Analysis
• Value of information (VOI) represents the improvement in the expected value of a decision outcome that would result from collecting additional information about one or more factors affecting a decision.
• Decision analysis approaches can quantify the value of collecting additional information before making a specific decision.
• Involves comparison of the expected outcomes of a suite of alternative regulatory choices made with and without information believed critical for the issue.
4
IEcWhy is VOI Important?
• Structuring decision helps decision-makers make better decisions• identifies key decision inputs• helps minimize expected loss / maximize expected
gain• increases chances of good outcome• makes explicit the "costs" of uncertainty
• Results provide a measure of social willingness-to-pay for new research
• Helps prioritize competing research opportunities to allocate resources efficiently
5

IEcEvaluations of VOI as a Tool
• NRC’s Science and Decisions: Advancing Risk Assessment (2009) • Discusses VOI as a tool for understanding the
tradeoffs between timely decision-making and the desire to refine the underlying science.
• Barriers to applying formal VOI broadly• Underlying concepts and structure still valuable:
linkages between information, decision-maker behavior, and decision making objectives
• Recommends informal VOI or value of methods analyses to inform risk assessment design.
6
IEcEvaluations of VOI as a Tool (cont’d)
• 2010 Report of EPA’s Board of Scientific Counselors (BOSC) decision analysis workshop with ORD/NRMRL• VOI can be valuable, but is challenging to implement
• Need extensive data, including probabilities for decision options & how p’s change conditional on new information
• Nonetheless, group mentions VOI as possible method to inform several case studies – e.g., regulations of chemicals with biomarker data, prioritizing IRIS evaluations
• Key to consider benefits as the net improvements in decision outcomes minus the costs of obtaining improved information.
7

IEc
8
VOI Analytic Framework• Decision analysis approaches can quantify the value of
collecting additional information before making a specific decision.
• Involves comparison of the expected outcomes of a suite of alternative regulatory choices made with and without information believed critical for the issue.
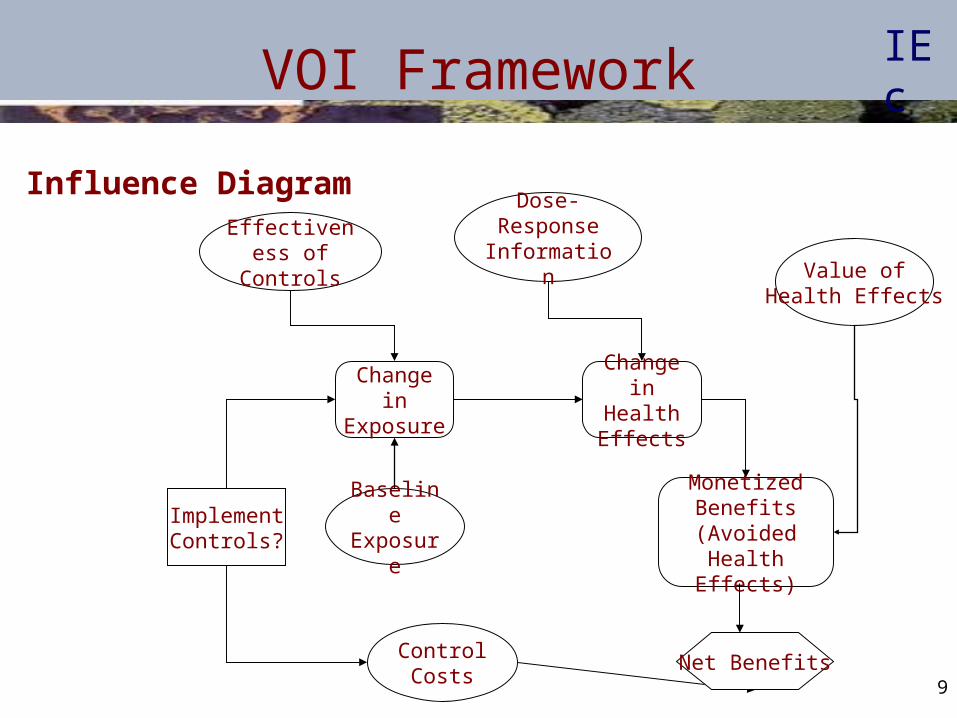
• Framework in a regulatory context can be illustrated using two diagrams:• Influence diagram - showing the role of exposure data and
other inputs in estimating NSB.• Decision tree - depicting a choice among:
• Taking no further regulatory action.• Instituting additional control measures based on current information.• Collecting additional exposure information prior to deciding whether to
institute new controls.
IEc
9
VOI Framework
Implement Controls?
Effectiveness of
Controls
Monetized Benefits (Avoided
Health Effects)
Change in Health Effects
Baseline Exposur
e
Change in
Exposure
Net Benefits
Value ofHealth Effects
Dose-Response
Information
Control Costs
Influence Diagram

IEcVOI Framework (continued)
10
Hypothetical Decision Tree: VOI = $500 - $437.5 = $62.5
Collect ExposureInformation
High.25
Medium.5
Low.25
No Controls
Controls
No Controls
Control Decision Net Social BenefitsExposure Distribution
Controls
High.25
Medium.5
Low.25
Controls
No Controls
Controls
No Controls
$0
$1,000
$500
$-250
$0
$1,000
$0
$500
$0
$-250
Policy Decision
[$437.5]
[$500]
All values in millions of $

IEcVOI Framework (continued)
• Variations in complexity of analysis:• Value of perfect information -- assumes that
collection of information will eliminate all uncertainty in exposure.
• Value of imperfect information -- examines the potential that addition of information will resolve some, but not all of the uncertainty in exposure.
• Value of partial information -- considers the impact of uncertainty in other inputs to the decision (e.g., toxicity).
11

IEc
12
Summary of Case Study Results
• Lead Case Study• There are significant benefits of improving data ($13.2 billion to $24.3
billion).• This value is robust when we consider potential delay in obtaining
exposure data and the magnitude of uncertainties in other inputs.• Conclusion depends on the ability to resolve the uncertainty regarding
lead uptake, especially among the highly exposed (i.e., children).
• Mobile Source Air Toxics Case Study• There are potential benefits to improving exposure data, up to $45
million annually.• This value decreases substantially when we consider the larger
uncertainty in toxicity for these compounds.

IEc
13
Background
• Decision we analyzed: regulating lead in residences under TSCA Section 403.
• Rule sets three standards: floor dust loading (µg/ft2); window sill dust loading (µg/ft2); and soil concentration (ppm). Violation triggers abatement.
• Economic and risk analysis supporting the rule looked at 1000 combinations of these three standards.
• Risk and economic estimates based on two alternative models for relationship between environmental lead and children’s blood lead:• IEUBK: more sensitive, says regulate stringently• The “Empirical” model: much less sensitive, says do not
regulate• November 1998 proposed standards reflect EPA’s balancing of
these two exposure outcomes.
IEc
14
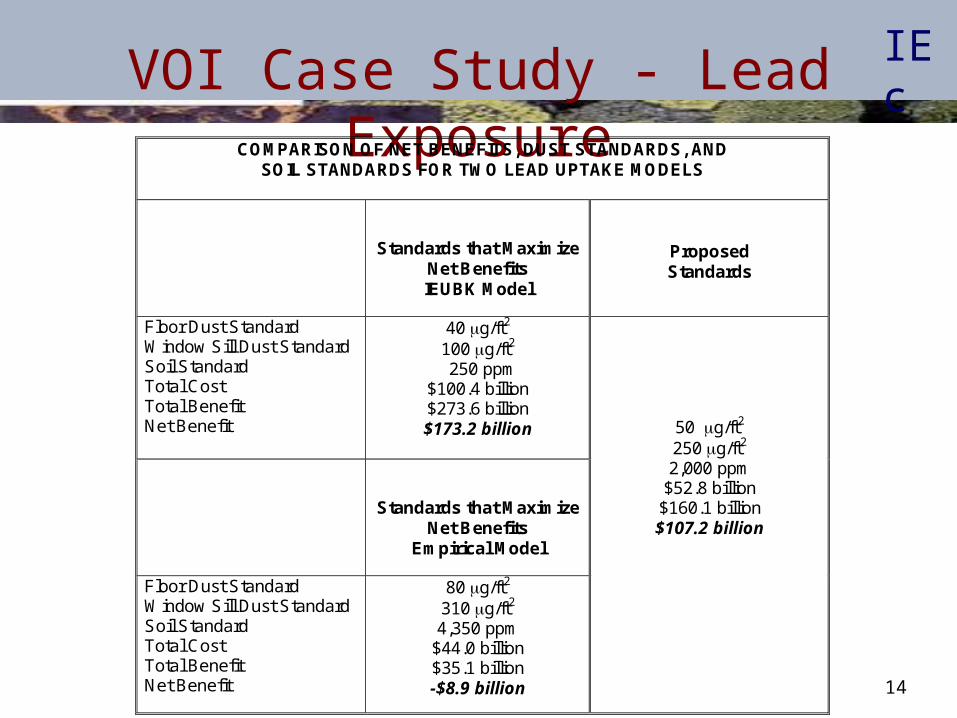
VOI Case Study - Lead ExposureCOMPARISON OF NET BENEFITS, DUST STANDARDS, AND
SOIL STANDARDS FOR TWO LEAD UPTAKE MODELS
Standards that Maximize Net Benefits IEUBK Model
Proposed Standards
Floor Dust Standard Window Sill Dust Standard Soil Standard Total Cost Total Benefit Net Benefit
40 g/ft2
100 g/ft2
250 ppm $100.4 billion $273.6 billion $173.2 billion
50 g/ft2
250 g/ft2
2,000 ppm $52.8 billion
$160.1 billion $107.2 billion
Standards that Maximize Net Benefits
Empirical Model
Floor Dust Standard Window Sill Dust Standard Soil Standard Total Cost Total Benefit Net Benefit
80 g/ft2
310 g/ft2
4,350 ppm $44.0 billion $35.1 billion -$8.9 billion

IEcLead Rule RIA Influence Diagram
15
LEAD RULE REGULATORY IMPACT ANALYSISINFLUENCE DIAGRAM
ImplementAbatementActions?
Lead AbatementEffectiveness
(Adjustment Factors)
MonetizedBenefits (Avoided
IQ Changes)
Change inPersons with
IQ<70
Change in IQ(points/person)
BaselineExposure (HUD
Survey Data)
Change inExposure (BloodLead Distribution)
Net Benefits
Value of IQ Changes
Lead UptakeEfficiency
Lead Dose-Response Function
Abatement Costs

IEcDecision Tree for Lead Regulatory Decision
16
No_Controls 0
[0]
IEUBK $173.2
.250 Empir
$-34.9 .750
HighControls [$17.1]
IEUBK $107.2
.250 Empir
$-10.4 .750
Medium_Controls [$19]
IEUBK $77.9 .250 Empir
$ -8.9 .750
Low_Controls [$12.8]
High_Controls $173.2
Medium_Controls $107.2
Low_Controls $77.9
No_Controls $0
IEUBK
.250
[$173.2]
High_Controls $-34.9
Medium_Controls $-10.4
Low_Controls $-8.9
No_Controls $0
Empir
.750
[$0]
Exposure_Data [$43.3]
VOI = $43.3b - $19b = $24.3b

IEc
17
Effect of Delay on VOI
• Delay scenarios assume: • Benefits are delayed if “collect exposure
data” option is chosen.• Discounted over delay period at 3 percent
annually.
• Results: • Perfect VOI, no delay: $24.3 billion• Perfect VOI, five-year delay: $18.4 billion• Perfect VOI, ten-year delay: $13.2 billion.

IEc
18
Value of Imperfect Information
• Value of imperfect information analysis asks: What if improved data cannot completely resolve uptake uncertainty?
• Looked at best and worst case scenarios for power of NHEXAS-like data to resolve IEUBK/Empirical uncertainty (from 50 percent predictive accuracy to 90 percent predictive accuracy).
• Results show VOI remains substantial when improved data achieves a high level of predictive accuracy and the prior likelihood that IEUBK is correct is less than 50 percent.

IEcExpected Value of Imperfect Lead Exposure Information
19
0
2
4
6
8
10
12
14
16
18
0.5 0.6 0.7 0.8 0.9
Predictive Power of Improved Exposure Data
EV
I (B
illio
ns
of
$)
0.1
0.2
0.3
0.4
0.5
0.6
0.7
0.8
0.9

IEc
20
Conclusions of Lead Case Study
• Value of exposure information could be very high; under best case conditions, a national exposure survey could have value in the tens of billions of dollars.
• Effect of delay in provision of information is to reduce VOI, but value of perfect information remains substantial even with 10-year delay.
• Improved exposure information must achieve a predictive accuracy of 80 to 90 percent certainty in forecasting the "correct" lead uptake model for VOI to remain substantial (e.g., no more than a 20 percent chance of predicting IEUBK if the empirical model is correct); lower levels of certainty quickly erode VOI.

IEc
21
VOI Case Study: Mobile Air Toxics
• Retrospective analysis of VOI of exposure data for benzene and 1,3-butadiene, two air toxics regulated under the 1990 CAAA.
• Developed estimates of exposure and risk in 2000 both with and without control programs -- based on information available as rules were promulgated.
• Other inputs: control costs (over $2 billion annually); other benefits of air toxics reductions (about $850 million annually).
• Estimate value of improved information for mobile source air toxics relative to improvements in other key uncertain inputs (e.g., toxicity).

IEc
22
Mobile Source Air Toxics - Exposure Uncertainty
Alternative Exposure/Distributions for 1,3-Butadiene
0%
5%
10%
15%
20%
25%
30%
0.0 0.5 1.0 1.5 2.0 2.5 3.0
Concentration (ug/m3)
Pe
rce
nt
of
Po
pu
lati
on
5th
25th
50th
75th
95th

IEcCalculation of Net Social Benefits
23
Exhibit 2
CALCULATION OF NET SOCIAL BENEFITS
1 This includes characterizing the uncertainty in the exposure description.
Baseline(No-Control)
ExposureDistribution1
(g/m3)
Post-ControlExposure
Distribution1
(g/m3)
BaselineRisk
BaselineRisk
BaselineHealth
Damages
Post-ControlHealth
Damages
Other Healthand WelfareBenefits of
ControlMeasures
Cost ofControl
Measures
Direct HealthBenefits
Net SocialBenefits ofEmissionControls
Potency
Potency
HealthEffects
Valuation
HealthEffects
Valuation
ExposureCharacterization
Estimation of Direct Health BenefitsOther Benefits and
Control Costs

IEcDecision Tree for Motor Vehicle Air Toxics
24
No_Control [0]*
Control [$103]
But_exp
N5th
.15
[$141]
But_exp
N25th
.225
[$160]
But_exp
N50th
.25
[$187]
But_exp
N75th
.225
[$220]
No_Control
Control
$435
$0
Decision2
N5th
.15
[0]
No_Control
Control
-$240
$0
Decision2
N25th
.225
[0]
No_Control
Control
$901
$0
Decision2
N50th
.25
[$190]
No_Control
Control
-$13
$0
Decision2
N75th
.225
[$435]
No_Control
Control
$190
$0
Decision2
N95th
.15
[$901]
But_exp
N95th
.15
[$281]
Collect_Exposure_Data Benz_exp
[$196]
Decision_1
VOI = $93 million (in 1995 $)
* Numbers in brackets are expected values of net social benefits at decision or chance nodes.

IEc
25
Conclusions of Mobile Sources Case Study
• Expected value of perfect information = $93 million.
• Explored value of partial information by considering impact of uncertainty in toxicity of 1,3-butadiene and benzene.
• Value of exposure information decreases to $9 million.
• Value of toxicity information is greater, $118 million.
• Explored impact of varying dollar value of a statistical life (VSL).
• Exposure information has value across a wide range of VSL (approximately $3 million to $7 million).

IEc
26
• Studies are routinely performed to better understand exposure and toxicity prior to making a product development decision in the private sector, but these are usually still uncertain elements, and there may be concerns about study assumptions or study quality that can compound this uncertainty.
• What is the value of research that improves both our fundamental understanding of exposure and toxicity and the methods used to assess these important decision elements? Improved methods can lead to increased confidence and reduced uncertainty in results that will help inform firm decision-making and regulators.
Estimating the Economic Value of Research in the Private Sector – Product Decision

IEc
27
Influence Diagram for Estimating the Economic Value of Research
Produce Chemical?
Price
Demand/Volume
Sold
Profit
ExposureCancerPotency
Revenue
RegulatoryAction
Cost
Research
ExposureStudy
ToxStudy
ExposureStudy
ToxStudy
RegulatoryAction

IEc
28
MOA__1__High -100 .50
MOA__2__Low 200 .50
Toxicity Yes [50]
No 0 [0]
Yes -100
No 0
Produce_Chemical2 MOA__1__High .500
[0]
Yes 200
No 0
Produce_Chemical2 MOA__2__Low
.50 [200]
Toxicity Research [100]
Produce_Chemical_ [100]
Example: Bioassays for compound X in two different animal species suggest two possible modes of action (MOAs) with very different implications for cancer potency, and hence for regulatory action and/or consumer demand and, ultimately, potential profit. Each MOA appears equally plausible at present. The firm can proceed with production or abandon the chemical. However, additioanl research may help to resolve which MOA is relevant for humans at expected ambient levels and lead to a better informed decision. (Note: This example assumes exposure is well known.)
In the ideal case, research fully resolves the uncertainty. The value of this “perfect” information is the difference between the expected value of the Research branch ($100 million) and the next best alternative, the Yes branch ($50 million) = $50 million. This represents an upper bound estimate on the value of research on toxicity.
Values in millions of dollars. Bracketed numbers represent expected values for the outcome measure.
Value of Perfect Toxicity Information
.50

IEc
29
MOA__1__High
-100 .50 MOA__2__Low
200 .50
Toxicity Yes [50]
No
0
[0]
MOA__1__High
-100 .80 MOA__2__Low
200 .20
Toxicity_Given_High_Result Yes [-40]
No
0
[0]
Produce_Chemical2 MOA__1__High
.50
[0]
MOA__1__High
-100 .20 MOA__2__Low
200 .80
Toxicity_Given_Low_Result Yes [140]
No
0
[0]
Produce_Chemical2 MOA__2__Low
.50
[140]
Study_Prediction LRI_Study [70]
Produce_Chemical_ [70]
Value of Imperfect Toxicity Information
Research is unlikely to fully resolve uncertainty, yet It may still be valuable if it reduces the level of uncertainty. In the bottom branch following the study prediction, there is still some residual uncertainty about the MOA. However, if the study (e.g., PBPK modeling for MeCl2) is viewed as highly credible, the uncertainty in the MOA, given the study prediction, could be significantly reduced (80/20 in favor of the study prediction in this hypothetical example).
In this case of “imperfect” information, the research would still be worth pursuing, though the value would be less ($70 million - $50 million = $20 million). When using this type of VOI tool it is possible to explore ranges of values associated with different levels of confidence in the predictive power of LRI studies (or their likelihood of influencing regulatory decisions and customer demand).
Values in millions of dollars.Bracketed numbers represent expectedvalues for the outcome measure.

IEcApplications / Requirements
• VOI framework can be applied to variety of issues (pollutant regulation, global warming) and focus on different inputs (exposure, toxicity, economic valuation).
• Key constraint is data availability.• Need to be able to estimate outcomes (ideally, net social
benefits) in dollars
• Need to quantitatively characterize decision inputs (e.g., costs, population exposure levels, toxicity, non-health effects, benefit values)
• Need to quantify uncertain elements either discretely or using distributions (e.g., lognormal) pre- and post-information -- may require expert elicitation
30

IEc
31
Identifying Decisions Where VOI May be High
• Stakes are high; divergent outcomes• Decision expected to be sensitive to health
outcomes and not dictated by non health-related factors
• Uncertainty can be represented using small number of scenarios (e.g., alternative MOAs) and associated probabilities
• Additional basic research can change beliefs about these states (e.g., improved PBPK modeling, interpretation of biomarker data, MOA research)
• Uncertainty in other decision inputs not significantly greater than uncertainty in input of interest.

IEcINDUSTRIAL ECONOMICS, INCORPORATED
Eric Ruder, Principal [email protected]
Henry Roman, Principal [email protected]\
617.354.0074