A DATA DRIVEN ANOMALY BASED BEHAVIOR DETECTION …
82
A DATA DRIVEN ANOMALY BASED BEHAVIOR DETECTION METHOD FOR ADVANCED PERSISTENT THREATS (APT) A thesis presented to the Department of Computer Science African University of Science and Technology, Abuja In partial fulfillment of the requirements for the award MASTER OF SCIENCE DEGREE IN COMPUTER SCIENCE By EZEFOSIE NKIRU Supervised by: Dr. Ekpe Okorafor African University of Science and Technology www.aust.edu.ng P.M.B 681, Garki, Abuja F.C.T Nigeria JUNE, 2016
Transcript of A DATA DRIVEN ANOMALY BASED BEHAVIOR DETECTION …
A DATA DRIVEN ANOMALY BASED BEHAVIOR DETECTION METHOD FOR
ADVANCED PERSISTENT THREATS (APT)
A thesis presented to the Department of Computer Science
African University of Science and Technology, Abuja
In partial fulfillment of the requirements for the award
MASTER OF SCIENCE DEGREE IN COMPUTER SCIENCE
By
EZEFOSIE NKIRU
Supervised by: Dr. Ekpe Okorafor
African University of Science and Technology www.aust.edu.ng
P.M.B 681, Garki, Abuja F.C.T Nigeria
JUNE, 2016
ii
CERTIFICATION
A DATA DRIVEN ANOMALY BASED BEHAVIOR DETECTION METHOD FOR
ADVANCED PERSISTENT THREATS (APT)
By
Ezefosie Nkiru
A THESIS APPROVED BY THE COMPUTER SCIENCE DEPARTMENT
RECOMMENDED:
________________________________
Supervisor, Dr. Ekpe Okorafor
________________________________
Head, Department of Computer Science
APPROVED:
________________________________
Chief Academic Officer
________________________________
Date
iii
ABSTRACT
Advanced Persistent Threats (APTs), represent sophisticated and enduring network intrusion
campaigns targeting sensitive information from targeted organizations and operating over a long
period. These types of threats are much harder to detect using signature-based methods. Anomaly-
based methods consist of monitoring system activity to determine whether an observed activity is
normal or abnormal. This is done according to heuristic or statistical analysis, and can be used to
detect unknown attacks. Despite all significant research efforts, such techniques still suffer from a
high number of false positive detections. Detecting APTs is complex because it tends to follow a
“low and slow” attack profile that is very difficult to distinguish from normal, legitimate activity.
The volume of data that must be analyzed is overwhelming. One technology that holds promise
for detecting this kind of attack that is nearly invisible is Big data analytics. In this work, I propose
a data-driven anomaly based behavior detection method which aims to leverage big data methods,
and capable of processing significant amounts of data from diverse or several data sources. Big
data analytics will significantly enhance or improve the detection capabilities, enabling the
detection of Advanced Persistent Threats (APTs) activities that pass under the radar of traditional
security solutions.
Keywords: Big data, Advanced Persistent Threats, Big data analytics, Network intrusion,
Hadoop

iv
ACKNOWLEDGEMENTS
I would like to express my appreciation to my supervisor, Dr. Ekpe Okorafor who guided me
throughout this work. I also wish to thank our Head of Department, Prof. Mamadou Kaba
Traore, for his sound advice and scholarly assistance. In addition, I thank all the faculties who
taught me during my 18months program at the African University of Science and Technology. A
lot of transformation has taken place in my life through your efforts.
To the sponsors of my MSc. Program at AUST, the African Capacity Development Foundation,
thank you for offering me such an opportunity, it was challenging but worth it. I lack words to
express my profound gratitude, thank you.
A big thank you to my lovely husband, Mr. Noel Ezefosie for his support and encouragement,
and also to my lovely children, David Tobenna, Adaolisa Mmesomachukwu and Favour Obioma
for their understanding, as well as my husband’s niece Mmesoma Ezeibe. You all have been a
source of inspiration and support to me.
Finally, to all who contributed in one way or the other to the success of the program thank you.
May God richly pour his blessing on you.

v
DEDICATION
I dedicate this work to God Almighty whose infinite mercies saw me through,
And to my husband and children who stood by me throughout this program.
Thank you!

vi
TABLE OF CONTENTS
CERTIFICATION ...................................................................................................................................... ii
ABSTRACT ................................................................................................................................................ iii
ACKNOWLEDGEMENTS ...................................................................................................................... iv
DEDICATION............................................................................................................................................. v
LIST OF ABBREVIATIONS .................................................................................................................... x
LIST OF FIGURES AND TABLES ......................................................................................................... xi
CHAPTER ONE ......................................................................................................................................... 1
INTRODUCTION ....................................................................................................................................... 1
1.1 Background of the study ............................................................................................................... 1
1.2 Objective of the research .............................................................................................................. 4
1.3 Research statement ...................................................................................................................... 4
1.4 Structure of the work .................................................................................................................... 4
CHAPTER TWO ........................................................................................................................................ 5
LITERATURE REVIEW .......................................................................................................................... 5
2.1. What is an Advanced Persistent Threat? ........................................................................................... 5
2.1.1. What actually differentiates APT from other non-targeted threats? ................................... 6
2.1.2. Terminology ......................................................................................................................... 6
2.1.3. Common Goals of APT Attack [51] ................................................................................... 7
2.1.4. Other Attacks Related to APT [51] ................................................................................... 8
2.1.5. The Relationship between APT, AET and Botnet [51] .................................................... 9
2.2. Tools and Methods used by the attackers .................................................................................... 9
2.2.1. Malware ............................................................................................................................... 9
2.2.1.1. Malware capabilities ................................................................................................... 9
2.2.1.2. How does malware infiltrate a computer? .............................................................. 10
2.2.2. Phishing and other e-mail attacks ................................................................................... 11
2.3. Traditional Security solutions ..................................................................................................... 13
2.3.1. Antivirus software ............................................................................................................. 13
2.3.1.1. Ways to get rid of viruses [26] .................................................................................. 14
2.3.1.2. Limitations of antivirus software ............................................................................. 15
2.3.2. Firewalls ............................................................................................................................. 16
2.3.3. Intrusion Prevention Systems .......................................................................................... 16
vii
2.3.4. Web filters .......................................................................................................................... 17
2.3.5. Spam filters ........................................................................................................................ 17
2.4. APT Life Cycle .............................................................................................................................. 17
2.5. Model of operation of APT malware .......................................................................................... 21
2.6. Command & Control Channels (C&C) ......................................................................................... 22
2.6.1. Malware C&C Network Protocol Usage ......................................................................... 23
2.6.2. Detection and Reaction ..................................................................................................... 24
2.6.3. C&C Channel Detection Techniques .............................................................................. 25
2.6.3.1. Blacklisting ................................................................................................................ 25
2.6.3.2. Signature based ......................................................................................................... 25
2.6.3.3. DNS protocol based ................................................................................................... 25
2.6.3.4. IRC protocol based ................................................................................................... 25
2.6.3.5. Peer to peer protocol based ...................................................................................... 26
2.6.3.6. HTTP protocol based ................................................................................................ 26
2.6.3.7. Temporal-based ......................................................................................................... 26
2.6.3.8. Anomaly detection ..................................................................................................... 27
2.6.3.9. Correlation based ...................................................................................................... 27
2.7. Research Direction ...................................................................................................................... 27
2.8. Related work ............................................................................................................................... 28
CHAPTER THREE .................................................................................................................................. 29
METHODOLOGY ................................................................................................................................... 29
3.1. Big data and Big data analytics ................................................................................................... 29
3.1.1. Big Data .............................................................................................................................. 29
3.1.2. Big Data Analytics ............................................................................................................. 29
3.1.3. Some Big Data Technologies ............................................................................................ 30
3.1.3.1. Hadoop ....................................................................................................................... 30
3.1.3.2. MapReduce and Distributed Computing Using Spark .......................................... 31
3.1.3.3. Spark Ecosystem ....................................................................................................... 32
3.1.3.4. What are the benefits of Spark? .............................................................................. 32
3.1.3.5. Resilient Distributed Datasets .................................................................................. 33
3.1.3.6. Predictive Modeling and Analytics .......................................................................... 33
3.1.3.7. Types of Machine Learning Models ........................................................................ 34
3.1.4. Machine Learning and Big Data Analytics ..................................................................... 34
viii
3.1.5. Benefits of Big Data Analytics in APT attack detection ................................................ 35
3.2. Methodology ............................................................................................................................... 37
3.2.1. What is Anomaly Detection? ............................................................................................ 37
3.2.2. The Components of a Data-driven Anomaly-based Behavior Detection method for
Advanced Persistent Threats (APT) ................................................................................................ 39
3.2.2.1. Data Collection .......................................................................................................... 41
Data preprocessing ................................................................................................................ 41
3.2.2.2.............................................................................................................................................. 41
3.2.2.3. Model Creation via classification ............................................................................. 44
3.2.2.4. Model Selection ......................................................................................................... 46
3.2.2.5. Model Prediction and Evaluation ............................................................................ 46
CHAPTER FOUR ..................................................................................................................................... 49
IMPLEMENTATION AND EVALUATION ......................................................................................... 49
4.1. Big Data Analytics (Machine learning) based on network traces with full payloads .................. 49
4.2. Big Data Analytics (Machine Learning) based on HTTP traffic .................................................... 49
4.3. Environment for the Implementation ......................................................................................... 50
4.4. IMPLEMENTATION STAGES ......................................................................................................... 50
4.4.1. Data Collection .................................................................................................................. 50
4.4.2. Data Preprocessing ........................................................................................................... 53
4.4.2.1. Load and Analyze data ............................................................................................. 53
4.4.2.2. Feature Extraction .................................................................................................... 53
4.4.2.3. Data Cleaning ............................................................................................................ 56
4.4.2.4. Feature Engineering and Transformation .............................................................. 56
4.4.3. Model Creation via classification ..................................................................................... 58
4.4.3.1. Create Pipeline .......................................................................................................... 58
4.4.4. Model Selection ................................................................................................................. 59
4.4.4.1. Tuning the pipeline using a CrossValidator ........................................................... 59
4.4.5. Model Prediction and Evaluation .................................................................................... 60
CHAPTER FIVE ...................................................................................................................................... 65
CONCLUSIONS ....................................................................................................................................... 65
5.1. Summary ..................................................................................................................................... 65
5.2. Challenges ................................................................................................................................... 65
5.3. Future Work ................................................................................................................................ 66

ix
REFERENCES .......................................................................................................................................... 67
x
LIST OF ABBREVIATIONS
AET Advanced Evasion Technique
APT Advanced Persistent Threat
C&C Command and Control
DDoS Distributed Denial of Service
DNS Domain Name System
FTP File Transfer Protocol
HTTP Hypertext Transfer Protocol
IDS Intrusion Detection System
IP Internet Protocol
IRC Internet Relay Chat
IT Information Technology
SID Structured Intrusion Detection
SMTP Simple Mail Transfer Protocol
TLS Transport Layer Security
VPN Virtual Private Network
WAF Web Application Firewall
xi
LIST OF FIGURES AND TABLES
Table 1:Http traffic features .......................................................................................................... 56
Table 2: Network traces result ...................................................................................................... 61
Table 3: Results for HTTP Traffic. ............................................................................................... 62
Figure 1 [24] Example of Phishing email. .................................................................................... 12
Figure 2: The APT life cycle ........................................................................................................ 18
Figure 3: Spark Ecosystem. .......................................................................................................... 32
Figure 4: Big data five stages process by (Labrinidis &Jagadish, 2012) ..................................... 38
Figure 5: High level architecture for an intelligent distributed machine learning system for the
classification and prediction of Command and Control traffic. .................................................... 40
Figure 6: The Pipeline overall flow. ............................................................................................. 48
Figure 7: Training dataset botnet distribution . ............................................................................. 51
Figure 8: Test data botnet distribution .......................................................................................... 52
Figure 9: Network traces result Pie chart ...................................................................................... 61
Figure 10: ROC curve for Network traces. ................................................................................... 62
Figure 11: Pie chart result for HTTP traffic.................................................................................. 63
Figure 12: ROC Curve for HTTP Traffic ..................................................................................... 63
1
CHAPTER ONE
INTRODUCTION
1.1 Background of the study
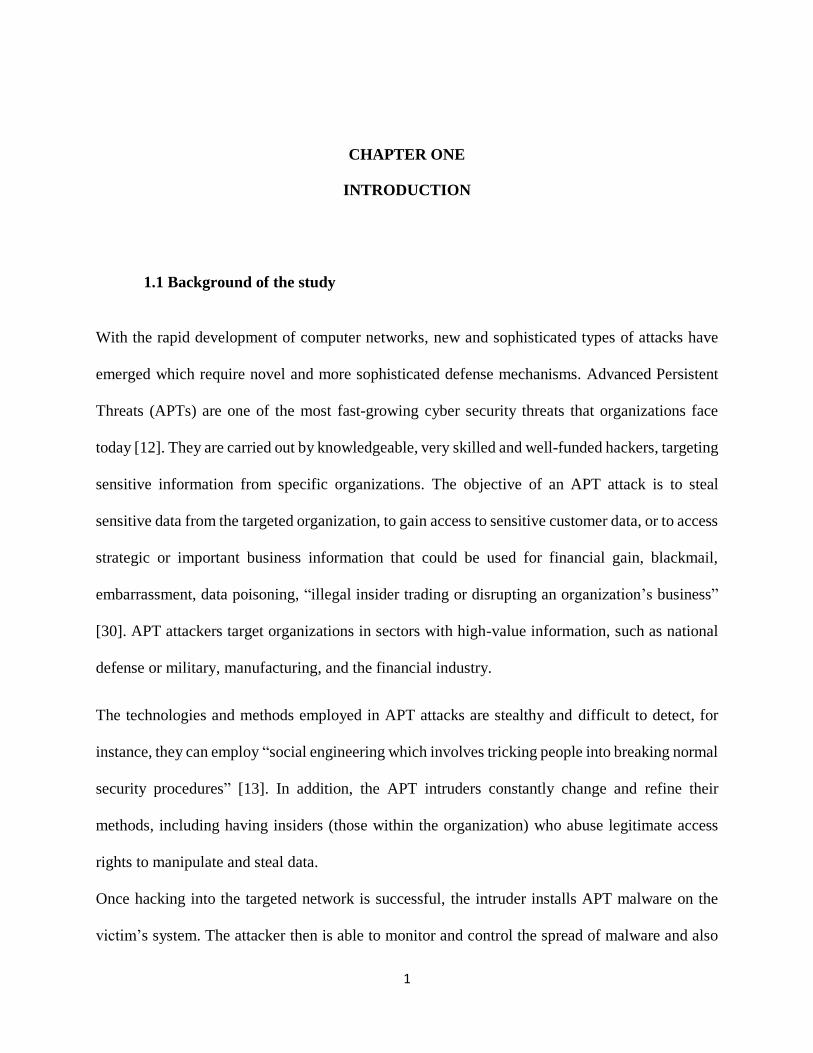
With the rapid development of computer networks, new and sophisticated types of attacks have
emerged which require novel and more sophisticated defense mechanisms. Advanced Persistent
Threats (APTs) are one of the most fast-growing cyber security threats that organizations face
today [12]. They are carried out by knowledgeable, very skilled and well-funded hackers, targeting
sensitive information from specific organizations. The objective of an APT attack is to steal
sensitive data from the targeted organization, to gain access to sensitive customer data, or to access
strategic or important business information that could be used for financial gain, blackmail,
embarrassment, data poisoning, “illegal insider trading or disrupting an organization’s business”
[30]. APT attackers target organizations in sectors with high-value information, such as national
defense or military, manufacturing, and the financial industry.
The technologies and methods employed in APT attacks are stealthy and difficult to detect, for
instance, they can employ “social engineering which involves tricking people into breaking normal
security procedures” [13]. In addition, the APT intruders constantly change and refine their
methods, including having insiders (those within the organization) who abuse legitimate access
rights to manipulate and steal data.
Once hacking into the targeted network is successful, the intruder installs APT malware on the
victim’s system. The attacker then is able to monitor and control the spread of malware and also
2
remotely control the infected systems. This opens a channel through which they steal sensitive
information from the victim’s system unknowingly to the owner, over a long period of time except
if the malicious activity is detected. After the information of interest has been found the attacker
gives a command to exfiltrate the information. This is usually done through a channel separate
from the Command and Control (C&C) channel. To maintain access to the network the attacker
continuously rewrites codes and employs sophisticated evasion methods. The frequency or the rate
of such attacks and breaches highlights the fact that even the best Information Technology (IT)
network perimeter defenses or traditional security solutions, including proxy, firewall, VPN,
antivirus, and malware tools are unable to prevent the intrusions [Craig Richardson (http://data-
informed.com/use-data-analytics-combat-advanced-persistent-threats)]. The data breach
investigation report stated in Verizon [14] confirmed that, in 86% of the cases, evidence about the
data breach was recorded in the organization logs but the traditional security solutions failed to
raise security alarms. This is a signal that there is a need for other forms of security solutions in
addition to the existing ones that would be better able to detect the activities of APTs. Detecting
APTs is complex because it tends to follow a low and slow attack profile that is very difficult to
differentiate from normal, legitimate activity. Thus, detection of this kind of attacks relies heavily
on heuristics or human inspection.
The best way to achieve this detection is by examining communication patterns over many nodes,
over an extended period, which is better than the micro-examination of specific packets or protocol
patterns for malware which tend to generate too many false positive detections. Though, as pointed
earlier, differentiating normal legitimate activity from malicious APTs is difficult, nevertheless,
certain aspects of APT behavior can be detected by observing trends over periods of time (days or
weeks) to spot unusual patterns.
3
An approach that can connect different low-level events to each other to form an attack scenario
can possibly detect APTs attack [15] [16] and reduce false positives. The correlation of recent and
historical events of network traffic logged data from many numbers of diverse data sources can
help detect APT malware. According to Jared Dean [31], “Anomaly detection should detect
malicious behaviors including segmentation of binary code in a user password, stealthy
reconnaissance attempts, backdoor service on a well-known standard port, natural failures in the
network, new buffer overflow attacks, HTTP traffic on a non-standard port, intentionally stealthy
attacks, variants of existing attacks in new environments, and so on”. Accurate anomaly detection
of these malicious behaviors has several challenges due to the huge volume of data that must be
analyzed. Big Data storage and analysis techniques can be a solution to this challenge. The
advantage of big data tools is that they can assist to handle the large volumes and semi-structured
data formats involved in monitoring large networks [32]. Big data helps to collect and analyze
terabytes of data collected from diverse sources and in addition, such correlation helps to lower
false positive alerts. It helps to increase the quantity and scope of data over which correlation can
be performed. Big data analytics significantly enhance the detection capabilities, enabling the
detection of APT activities that are passing under the radar of traditional security solutions.
This work presents an intelligent distributed Machine Learning System that detects APT activities
based on examining communication patterns registered in Network traffic and logs, over multiple
nodes and over an extended period. The proposed system leverages big data Machine Learning
methods to identify the necessary features to identify APT commands, Command channels and
with the extracted features, a model is created to detect malicious traffic. The Classification method
was used to create the models, and the detection accuracy of the created model was evaluated. The
4
evaluated results show that the models are capable of detecting malicious attack with high accuracy
and low false positive rates.
1.2 Objective of the research
The goal of this research work is to leverage big data methods and explore new detection algorithm
capable of processing significant amounts of data from diverse data sources, to detect APT
activities that are passing under the radar of traditional security solutions.
1.3 Research statement
Focusing on Advanced Persistent Threat (APT) intrusion detection systems, and intrusion
prevention systems which, according to various reports, are not capable of protecting systems
against APT attacks because there are no signatures. Therefore, to overcome the issue of APTs
which is a challenging and persistent problem to security communities, a new model which
leverages big data technologies to detect APTs attacks is proposed.
1.4 Structure of the work
This work is organized as follows: Chapter One has a background of study, the objective of the
research and research statement. Chapter Two has literature review and related work. Chapter
Three presents our methodology and the approach used. Chapter Four contains the Implementation
of the APT model proposed in Chapter Three. The work is concluded in Chapter Five.

5
CHAPTER TWO
LITERATURE REVIEW
In this chapter, we explained the Advanced Persistent Threat (APT), its mode of operations, and
different types of detection techniques in full detail.
2.1. What is an Advanced Persistent Threat?
From Wikipedia – An Advanced Persistent Threat (APT) is a set of stealthy and perpetual
computer hacking processes, often orchestrated by human(s) targeting a particular entity. APT
normally targets organizations and/or nations for business or political motives. APT processes
require a high degree of covertness over a drawn out stretch of time. The "advanced" process
denotes sophisticated techniques utilizing malware to exploit susceptibilities in systems. The
“persistent” process suggests that an external command and control system is perpetually
monitoring and extracting data from a particular target. The "threat" process shows human
contribution in arranging the attack. [7].
Definition from WhatIs.com – An Advanced Persistent Threat (APT) is a kind of network attack
in which an unapproved individual accesses a network and stays there undetected for a drawn out
stretch of time. The goal of an APT attack is to steal intellectual property rather than to cause
damage to the network or organization. APT attackers target organizations in sectors with high-
value information, such as military, manufacturing and the financial industry [6].
6
The Advanced Persistent Threat from the definitions given above can be summarized to be a
serious threat which has the capability and intent to wage a prolonged campaign against a specific
organization in order to steal some vital information or influence the behavior of the organization.
2.1.1. What actually differentiates APT from other non-targeted threats?
An APT attack targets a specific organization for a specific purpose.
APTs always make use of zero-day exploitation or modify/obfuscate known ones, and as
a result, they are able to remain undetected by the majority of signature-based end points
and intrusion detection solutions [30].
The attack is usually spread over a long period of time and thus is always outside the limited
detection/correlation window of these systems [30].
The attack is slow and strategic.
An APT attack uses specially chosen tools and techniques to attack.
2.1.2. Terminology
Precise definitions of what an APT is can vary, but can be summarized by their named
requirements below: [19] [20] [21]
Advanced – Attackers behind the threat have a full range of intelligence-gathering
strategies available to them. These may incorporate computer intrusion technologies and
methods, additionally they stretch out to routine intelligence-gathering strategies, for
example, telephone interception technologies and satellite imaging. While singular
components of the attack may not be classed specifically as "advanced" (e.g. malware
components engendered from commonly available do-it-yourself malware construction
kits, or the utilization of facilely procured exploit materials), their operators can typically

7
access and develop more advanced implements as required. They usually combine multiple
targeting methods, tools, and strategies in order to reach and compromise their target, and
maintain access to it. Attackers may demonstrate a deliberate fixation on operational
security that differentiates them from "less advanced" threats.
Persistent – The attackers give priority to a particular task, rather than opportunistically
seeking information for financial or other gain. This distinction implicatively insinuates
that the attackers are guided by external entities. The targeting is conducted through
perpetual monitoring and continuous interaction in order to achieve the defined objectives.
It does not mean a barrage of steady attacks and malware updates. As a matter of fact, a
low and slow approach is customarily more successful. If the attacker loses access to their
target they conventionally will reattempt access and most often, they will be successful.
One of the attacker's objectives is to maintain long-term access to the target, which
differentiates it from non-targeted threats which only need access to execute a particular
task.
Threat – APTs are threats because they have both capability and expectation. APT attacks
are executed by coordinated human actions, as opposed to thoughtless and automated
pieces of code. The attackers have a particular objective and are gifted, spurred,
incentivized, organized and well-funded.
2.1.3. Common Goals of APT Attack [51]
Theft – Stealing of Intellectual property.
Fraud.
Distributed Denial of Service (DDoS) and Sabotage.
Criminals Action (e.g. Theft, Fraud, Cyber-Extortion, Spam, and so on.)
8
Impact on the decision-making process (e.g. Integrity Violation, Data Manipulation, and
so on)
Deterrence and Intimidation.
Economic Apocalypse.
Cyberwar.
Display capabilities.
Just for Fun.
Waiting for a New Task (e.g. backdoor).
2.1.4. Other Attacks Related to APT [51]
Botnet: This is a network made up of a remotely controlled set of computers or bots. The
computers are remotely controlled because they have been infected with malware. The bot is a
short form of a robot also known as a zombie. The attack distributes malware that can turn a
computer into a bot, when this happens, the computers perform some automated task over the
internet without the knowledge of the owner. The attack, in turn, uses the bots to infect large
numbers of computers and form a network known as a botnet. The attackers use the botnet to send
out spam email messages, distribute viruses, attack computers, and servers, and commit fraud and
all manner of crime.
Advanced Evasion Technique (AET): Is a type of attack that combines different known evasion
methods to produce a new method used across several layers of the network at once. The AET
code is not necessarily malicious; but the dangerous issue about it is that, it provides the hackers
or attackers with undetectable access to the network.
9
2.1.5. The Relationship between APT, AET and Botnet [51]
AET- This sort of intrusion technically gives a higher achievement rate. This technic is used to
bypass most of the security protection layers that organizations use for security measures.
Botnet – This is the most commonly used attack tool. As earlier discussed, the AET technic
might be utilized to inject the Botnet in a stealth mode into any target organization.
APT – using some sophisticated technics like AET to inject hacking tools like Botnet’s into the
target organization, as well APT can be equally injected using other means as will be discussed
later.
2.2. Tools and Methods used by the attackers
In this section, we will discuss the various tools and methods used in APT attacks [22]:
2.2.1. Malware
Malware is a short form for malicious software. It is a common term used to describe any software
used to disrupt computer operations, collect sensitive information, gain access to private computer
systems, or display unwanted advertising [22].
Malware may be stealthy and intended to steal information or spy on a user’s computer for an
extended period without their cognizance, an example is Regin, or it might be intended to cause
harm, usually as sabotage (e.g. Stuxnet), or to extort payment(CryptoLocker) [22].
2.2.1.1. Malware capabilities
Malware uses many techniques to spread itself, infect computers, stay hidden, and fulfill its
objectives [23]. The capabilities include the following:

10
Viruses: viruses are code fragments that attach themselves to legitimate computer
programs, hard drive boot sectors and document macros, and are triggered when the objects
they’re attached to are activated.
Trojan horses: They are normally standalone programs that pretend to be something they
aren’t and usually a victim is tricked into running the Trojan horse believing that the
program will fulfill some other purpose.
Worms: worms are programs that have the ability to spread from system to system with
little or no help from people.
Ransomware: These are programs which restrict access to programs or data on a system,
and demand that the victim pays a ransom in order to restore proper function.
Rootkits: These are malicious programs which include mechanisms designed to evade
detection — way more than other types of malware.
Malicious plug-ins: These malicious plug-ins are malignant software extensions which are
intended for browsers, word processing programs, spreadsheet programs, and so on.
Extensions are a popular way of adding functionality to popular programs, and they’ve
caught the attention of malware producers as a means to spread malware easily.
Keyloggers: Keyloggers are programs that record a victim’s keystrokes and mouse
movements and send them to the key logger’s owner, who can use captured login
credentials to perpetrate fraud.
All types of malware have a common goal: to deceit, disrupt, and steal of information.
2.2.1.2. How does malware infiltrate a computer?
Malware gets into the target computer through the following ways:
11
Vulnerability: Malicious software always exploits a vulnerability in the target
system, once it gets the opportunity it installs itself or performs whatever function
it was built for.
Tricking: Tricking a user into clicking and executing a malicious program which
will be installed in the system.
Some malware can combine both ways to get into the target system.
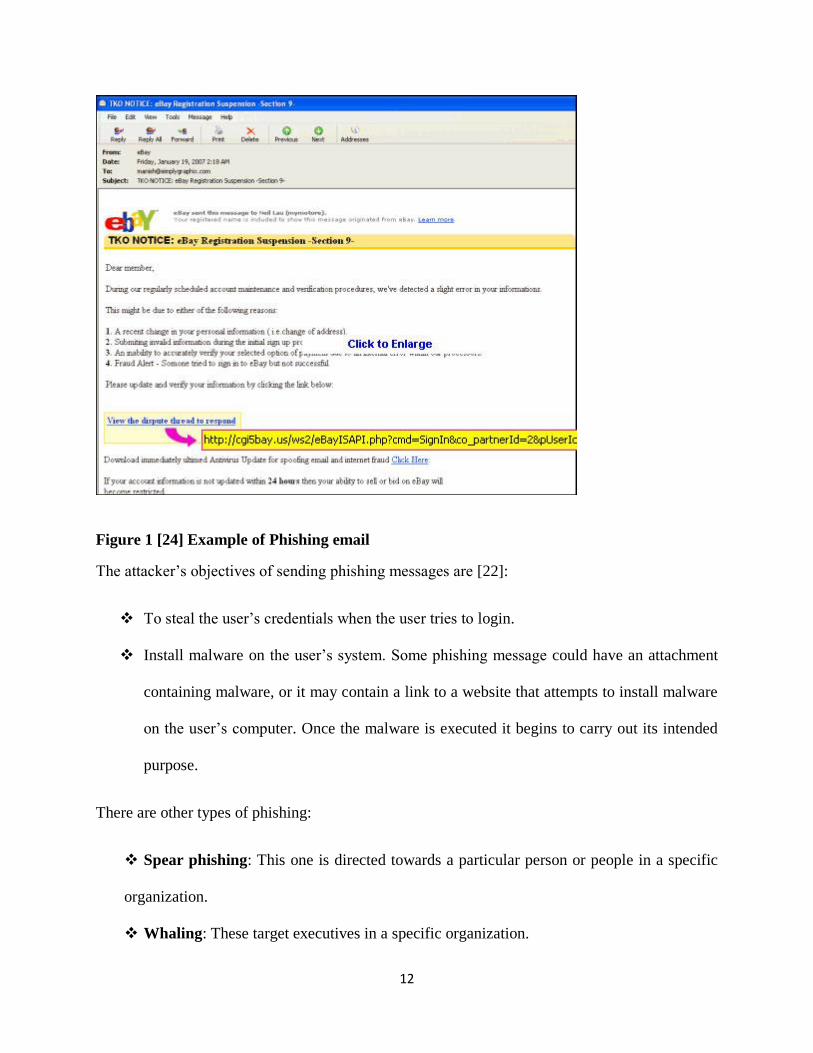
2.2.2. Phishing and other e-mail attacks
Phishing – is a kind of fraudulent practice of sending emails pretending to be from reputable
companies with the intention of inducing individuals to reveal personal information, such as
passwords and credit card numbers online, and these will be used for identity theft. Phishing emails
normally direct users to click and visit a website where the users are asked to update their personal
information or data, such as a password, credit card number, bank account numbers, that the
reputable company already has. It is a kind of social engineering, which is described as one of the
various techniques used to trick people into carrying out some activities that will help an attacker
achieve their objectives. An example of such an email is shown in the figure below:
12
Figure 1 [24] Example of Phishing email
The attacker’s objectives of sending phishing messages are [22]:
To steal the user’s credentials when the user tries to login.
Install malware on the user’s system. Some phishing message could have an attachment
containing malware, or it may contain a link to a website that attempts to install malware
on the user’s computer. Once the malware is executed it begins to carry out its intended
purpose.
There are other types of phishing:
Spear phishing: This one is directed towards a particular person or people in a specific
organization.
Whaling: These target executives in a specific organization.
13
2.3. Traditional Security solutions
In the previous section, the tools and methods used by the attackers to launch their threat were
looked into, while in this section we will discuss the traditional security solutions available for
combating network intrusions including APT. It is good to understand traditional security solutions
because some of them are needed in building well-secured environments. As the network develops
rapidly, adversaries are coming up with great innovations of potent and stealthy threats than ever
before, thereby making the traditional security solutions to not always be effective in detecting
threats.
The traditional solutions are explained below:
2.3.1. Antivirus software
It is also known as anti-malware, it is software designed to prevent, detect and remove a potential
computer virus or malicious software. While intruders have become very skilled and stealthy in
their spread of malware, traditional antivirus is being developed with more advanced techniques
and features. Antivirus is important because it offers multi-layered protection to computers.
From Wikipedia [25], Antivirus software was initially created to detect and remove computer
viruses. Resultantly, the multiplication of different sorts of malware led to the antivirus software
providing protection from other computer threats. Specifically, present day antivirus software can
shield from malignant Browser Helper Objects (BHOs), Ransomware, Trojan horses, backdoor,
browser hijackers, rootkits, malicious LSPs, worms, dialers, spyware, adware, and fraud tools.
Some products likewise incorporate protection from other kinds of computer threats, for example,
spam, infected and malicious URLs, trick and phishing assaults, social engineering methods,

14
online identity theft (privacy), Advanced Persistent Threat (APT), botnet DDoS assaults and online
banking attacks.
2.3.1.1. Ways to get rid of viruses [26]
Signature-based detection
Heuristic-based detection
Behavioral-based detection
Sandbox detection
Data mining techniques
2.3.1.1.1. Signature-based detection
According to [26], It is the most common method used by most antivirus software, it checks all
the executable files (.EXE) against an already validated known list or signatures of viruses, and
other types of malware. In addition, it checks if the unknown executable files show any sign as
unknown viruses through its behavior. It scans files, programs, and applications when they are in
use and also scans any downloaded executable files for malware immediately [26].
A major disadvantage of this method is that, by itself, this method is unable to detect malicious
files for which signatures have not yet been developed or added to the list of viruses. Modern
attackers know this, which is why they frequently create new malicious software with new
functionality and different file signatures [26].
2.3.1.1.2. Heuristic-based detection
It is used together with signature-based detection. It aims at generally detecting new malicious
software by checking the files for suspicious behavior without a correct signature match. It is
deployed with the intention of helping antivirus software to detect new, or variant, or an altered
15
version of malware. It is designed to detect the viruses even in the absence of the latest virus
definitions.
Antivirus software makes use of this by running any suspicious code or program on it, within a
runtime virtual environment. This prevents the vulnerable program from contaminating the real
world environment.
A single suspicious characteristic is not sufficient to flag the file as malicious [27]. On the other
hand, several such characteristics might exceed the expected risk threshold, making the tool
classify the file as malware. The biggest limitation of heuristics is it can ignorantly flag legitimate
files as malicious.
2.3.1.1.3. Behavioral-based detection
This aim at detecting the behavior of the malware during execution is mostly used in intrusion
detection systems. It detects malware through its action when in execution.
2.3.1.1.4. Sandbox detection
It works like the behavioral based detection method. It uses a virtual environment in the execution
of any application in order to track the kind of actions it performs. Checking the actions of the
program that are logged in, it can detect whether if it is malicious or not.
2.3.1.1.5. Data mining techniques
This is the most recent trend in detecting malware. It involves using a set of file features that are
extracted from the file in use, by using machine learning algorithms and data mining techniques.
The behavior of the file can be classified as either malicious or not.
2.3.1.2. Limitations of antivirus software
Research wizard Peet Morris gave his personal view on antivirus.

16
He explained that an antivirus program cannot really protect you and, at worst, lure you into a
mendacious sense of security. You'll be shielded against one infection, yet another will hit your
machine or system before the antivirus has even been considered.
Anti-virus software, especially free ones are limited in their functions reason being they
can protect computers from certain kinds of viruses, but will not protect computers in case of
more advanced malware.
Antivirus software is not powerful in detecting new viruses, even the non-signature-based
methods that are designed to detect new viruses. The reason is that the virus designers are
smart, they test their new virus on the major anti-virus software to make sure that it cannot be
detected with those antiviruses before releasing it.
2.3.2. Firewalls
Firewalls can be a hardware or software system that prevents unauthorized access to, or from a
network, based on the originating and destination IP address and port number. They still do their
work quite well just that most threats have moved to the inside of network packets and traditional
firewalls were not designed to look inside packets to detect malware.
There are other types of firewalls for instance next generation firewalls that can do deep packet
inspection and examine the contents of each packet for malicious patterns. The other type is the
Web Application Firewall (WAF), is designed to inspect the contents of packets flowing in user’s
browsers and web servers.
2.3.3. Intrusion Prevention Systems
Intrusion detection systems can only generate alerts if they detect malicious traffic, but with the
help of intrusion prevention systems configured, they can either permit or block network packets
based on their origin, destination, and particularly, their contents.

17
2.3.4. Web filters
Are programs that can screen web pages and find out if a user is permitted to view the page based
on the organizational policy. Web filters designed from study claimed that it reduces recreational
internet browsing among employees and secured networks from web-based threats [28].
2.3.5. Spam filters
Are programs that are used to detect unsolicited and unwanted emails, and prevent the messages
from reaching a user’s inbox. Spam filters can block over 99 percent of the spam when properly
configured. It may not be able to block spear phishing attacks, and resultantly messages with
malicious intent will still get to their target [22].
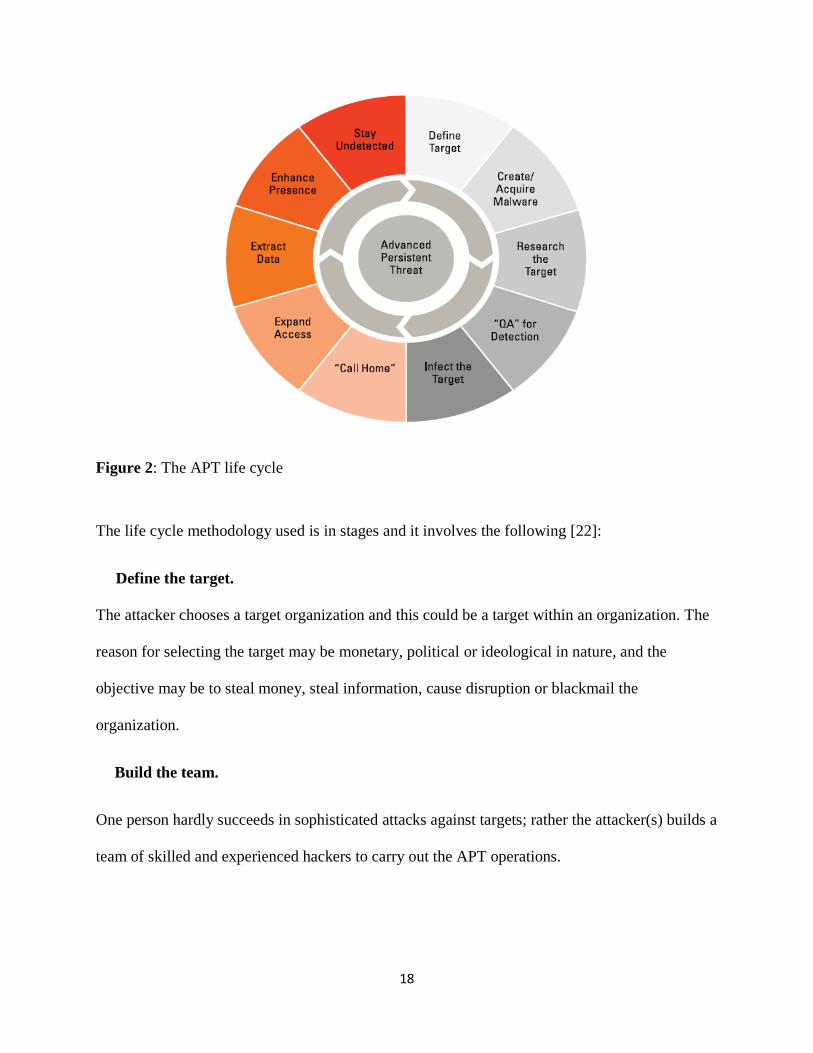
2.4. APT Life Cycle
In order to achieve our objective which is to detect the activities of APTs, it is necessary and
helpful to understand the APT lifecycle. This will help in knowing their method of operation and
tactics. The life cycle is shown in Figure 2[22].
18
Figure 2: The APT life cycle
The life cycle methodology used is in stages and it involves the following [22]:
Define the target.
The attacker chooses a target organization and this could be a target within an organization. The
reason for selecting the target may be monetary, political or ideological in nature, and the
objective may be to steal money, steal information, cause disruption or blackmail the
organization.
Build the team.
One person hardly succeeds in sophisticated attacks against targets; rather the attacker(s) builds a
team of skilled and experienced hackers to carry out the APT operations.

19
Build or acquire necessary tools.
At this stage, the attacker has known the nature of the target and also knows the right tools needed
to carry out the reconnaissance as well as the main attack. The attacker builds or purchases the
tools.
Conduct research and reconnaissance.
The attacker begins to study the target and tries to have a very close relationship with the people,
processes, and technologies which are associated with the actual target. The attackers conduct
research to learn how the target systems work so they can easily identify the specific system that
contains the data they want.
Response testing.
The attackers first carry out initial attacks to see if the organization can detect them and respond.
Based on the outcome, this will determine whether they carry on or change their strategy.
Deploy tools.
At this stage, they start to set up their systems, tools and all they intend to use for the attack.
Make the initial intrusion.
This is the start of the actual attack operation. They may use any of the tools that were discussed
above.
Initiate the outbound connection.
If the intruders succeed in the attack, this means they have finally compromised a system inside
the organization’s network, through which they initiate a communication channel to a system
controlled by them. Since they are very smart in their operations, they try as much as possible to

20
remain undetected. They use another compromised system as another end of their communication
so that outbound connection of their activities is not traced to them by security engineers or law
enforcement investigators.
Going through the step depends on what their intentions are, if it is to disable the target system,
this may be a step that can be skipped. Everything depends on the tools and tactics set out for the
attack.
Expand access or Move further.
After they have established their foothold, they may go back to research and reconnaissance, this
helps them to further understand the organization’s internal network and systems architecture.
With this, they can locate the specific system having the data or information they want to steal or
disable, it all depends on their objectives.
This step can include other things, for example, they may want to find out if their operation has
been detected by testing, as well as acquiring other tools they didn’t anticipate initially that will
help them at this stage to accomplish their objectives.
Collection and exfiltration data.
Once the intruders have pointed out the system that has the actual data or information they want
to steal, the next thing is to perform whatever steps that can help them collect the data and move
it out through the outbound connection they have already established earlier.
This step is not as easy as it sounds. For the intruders to remain undetected, it may be necessary
for them to extract the data slowly. If they are stealing the data by sniffing they may slowly collect
and exfiltrate the data, or they may allow the target data to accumulate over a long period of time
which could be months or more, and eventually they move it in bulk unnoticed.

21
Cover your tracks and remain undetected.
All depends on the nature of the APT operation, the attacker may wish to watch for a while because
they know as time passes there is a likelihood that their activities may be noticed.
The important action to take after the operation is to cover every evidence of the intrusion and
subsequent operations. For example, if it is not possible for them to disable logging, they may
ensure that the log data does not betray their operation. They may decide to inject meaningless
data into the logs in order to fill them up more quickly, or in some cases, it may cause overwritting
of older data.
2.5. Model of operation of APT malware
From the APT lifecycle, we can summarize that, the operations can be divided into two phases:
The Infection phase and working phase.
Infection phase: This phase requires malicious codes to be installed on at least one target
system or just a single compromise. Intruders have different means to achieve this. One of the
methods that have been successful is tricking users into clicking or executing the malicious
programs. They can even send the malicious codes through mail attachments, and once the
user clicks and downloads the attachment, the malicious code is triggered, causing the
malware to automatically install in the user system.
Working Phase: Once the malware has been installed, the computer has become infected, the
next phase is the working phase. At this stage, the malware needs to contact the Command
and Control Server (C&C) to register or to inform the server that it has been successfully
installed and receives a new instruction. The malware will keep on contacting the C & C server
22
on a regular basis for new instructions or sending the results of the previous instruction or
command received.
2.6. Command & Control Channels (C&C)
It is common practice to be more concerned with inbound traffic than outbound traffic, but from
the study of malware, using outbound traffic as channels for C&C as well as exfiltration is
important. A clear understanding of C&C channels is essential to effectively detect, contain,
analyze and remediate APT malware attacks. Attacks use these channels to remotely control
infected systems. This control functionality can be used to infect other systems or search for
documents the attacker is interested in. After the information of interest has been obtained, the
attacker gives the command to exfiltrate the data [33]. The exfiltration normally happens through
a channel separate from the C&C channel.
The point to note here is malware C&C channels are known to follow similar traffic patterns [32]:
Registration of a new infection or resumption of an existing infection session
Transfer of new commands to be executed
Exfiltration of outcome or results from any commands executed.
Steps 2 and 3 are repeated until their activities are detected and removed, or the attacker has
achieved his goal, has been satisfied, and decides to either remove the compromised data or leave
as a future back-door.
Detecting and disrupting C&C channels can help combat the threat posed by their activities.
Detecting C&C traffic channels is quite difficult because it uses normal protocol for
23
communication as normal traffic, and the traffic volume is less compared to other non-target attack
traffic because the malware is sent only to the targeted system.
2.6.1. Malware C&C Network Protocol Usage
Command and Control channels have a different level of complexity, and the control infrastructure
can vary from simple HTTP requests to a malicious domain, to more advanced approaches which
involve the use of resilient peer-to-peer technologies that do not have a centralized server and are
harder to analyze. According to Bayer et. al. [34] the most used protocols by malware are
Hypertext Transfer Protocol (HTTP), Internet Relay Chat (IRC), and Simple Mail Transfer
Protocol (SMTP). SMTP is commonly used to send spam, while HTTP and IRC are mostly used
for C&C. Symantec also reported in 2010, of all command & control servers detected that 10%
use IRC channels and 60% use HTTP. From the report, HTTP is the most used C&C protocol
currently.
HTTP and IRC are known to be plaintext protocols, but malware may encrypt the data before
sending it in a protocol compliant message and this makes it hard to analyze what is being sent
over the network.
Just a small group of the malware uses a Transport Layer Security (TLS) which is used to encrypt
the communication. From the study, it is noted that the malware actually does not implement TLS
but only communicates with the port which is normally used for TLS connections [33]. Usage of
TLS has been reported in APT attacks. From Mandiant [35] the most common methods for data
exfiltration are through File Transfer Protocol (FTP) or HTTPS. The HTTPs connection uses
anything from self-signed, stolen through legitimate certificates [37].

24
2.6.2. Detection and Reaction
This attack can be detected at two different levels, the network level or at the host level. The
advantage the network level has over the host level is that the detection can be handled or managed
at a central point, instead of managing detection software on all the networked systems. During
the working phase, the malware is best detected at network level because all the malware has to
use the same kind of protocol to communicate with a C & C server. Detecting it at host level and
at working phase is difficult because, the malware would have packed the code differently, using
random file names or using another trick method to evade detection.
Once malware is detected, the next thing is to remove it from the infected systems with specialized
removal tools and reinstalling the computer to protect the user and the network. In addition, further
actions can be taken to remedy any further attempts by the attacker. To summarize the stages, the
flow is as follows:
• Detect,
• Contain,
• Investigate,
• Eradicate, and
• Recover.

25
2.6.3. C&C Channel Detection Techniques
Listed below are some examples of C&C channels and the techniques to detect them [33].
2.6.3.1. Blacklisting
This is a simple method that blocks access to Internet Protocol (IP) addresses and domains known
to be used by C&C servers.
2.6.3.2. Signature based
This method uses a list of signatures in the database to detect unwanted network traffic, it is known
as a signature based Intrusion Detection System (IDS). This is good if the malware researchers
have created a signature for the known malicious threats but cannot be used to detect novel attacks.
2.6.3.3. DNS protocol based
This is based on the DNS information generated by the malware because malware needs to know
the IP address of the C&C infrastructure to communicate regularly. Intruders can decide to hard
code the address or retrieve it from a domain name. Using the domain name gives them more
opportunity to change it regularly. The disadvantage of DNS protocol based is it can only detect
domains based the C&C server.
2.6.3.4. IRC protocol based
Internet Relay Chat (IRC) was a channel used to establish central command and control
infrastructure by first generation malware. The malware connects to the IRC servers and channels
that have been selected by the attackers and waits for further instructions. It is good to detect IRC
botnet but it is becoming less popular.

26
2.6.3.5. Peer to peer protocol based
Attackers seeing that the IRC botnet has a centralized server and can be detected and shut down
once detected, to overcome this issue, the attacker sends a command to one or more bots, and they
deliver it to their neighbors. This is can distinguish and separate P2P networks but there is no
generic way to distinguish legitimate traffic from P2P C&C channels.
2.6.3.6. HTTP protocol based
From study [33], an implementation that leverages a P2P botnet is somehow difficult and complex
to bridge the attacks that have started to use the centralized C & C model again, but HTTP based,
the attackers publish the commands on certain servers. From the report stated in [33] several of
the malware examined is using HTTP as the C&C server. According to Mandiant’s report, 83% of
all backdoors used by APT attackers are outgoing sessions to TCP port 80 or 443, only a few of
them use TLS to communicate with the C&C server. The malware allows connections to the server
with an invalid certificate and this can be used to detect them.
Several of the examined malware from the report uses HTTP-based C&C channels. The HTTP
request generated as examined from these malware samples are normally GET requests with a
spoofed User-Agent. Most of the malware spoofs the User-Agent of the Installed Internet Explorer
version. Consequently, detecting the spoofed User-Agents might provide a method for C&C
channel detection.
2.6.3.7. Temporal-based
A bot frequently needs to send traffic to the C&C server with the goal of receiving new instructions
that need to be executed. Such traffic is usually sent automatically and is done on regular basis.
27
The behavior of traffic generated by bots is usually more regular than the behavior of user-
generated traffic, with this pattern the bots might be detected by measuring their regularity. [33]
2.6.3.8. Anomaly detection
This is based on the assumption that it is possible to build a model of legitimate traffic content
which would be used to differentiate malicious ones. It is a very powerful tool to detect command
control channels, the only challenge is for it to be most effective, and the baselining which is
defining what is good about the network should occur before the first compromise [33].
2.6.3.9. Correlation based
This is a method that helps to reduce the number of false positives for malware detection, it requires
correlation of several events before raising an alert. This allows the system to use events with high
false positive rates and multiple events, the system will be able to filter out most of the false
positive rates.
2.7. Research Direction
We noted in this chapter that the C&C channel is the strength of the attackers. Attackers can
remotely control computers and infect other systems. Additionally, we noted that, detecting C&C
channels is the best possible way to detect the APT activities. Various C&C channel detection
techniques were also discussed. Based on this, the focus of this research work was derived. We
focused on detecting C&C channels since all the APT malware uses these channels to contact a C
&C server on a regular basis, as a means of detecting APT activities. From the detection technique,

28
it is noted that the anomaly detection system might be able to detect all the C&C channels, so this
work used the anomaly detection technique.
2.8. Related work
This section presents some of the work done in this area and their outcomes.
Ping Chen; Lieven Desmet; Christophe Huygens; (2014), “A study on Advanced Persistent
Threats.” APTs are sophisticated, specific and evolving threats, yet certain patterns can be
identified in their process. In this paper, the writers focused on the identification of these
commonalities. Traditional countermeasures are needed but not sufficient for the protection
against APTs. In order to mitigate the risks posed by APTs, defenders have to gain a baseline
understanding of the steps and techniques involved in the attacks and develop new capabilities that
address the specifics of APT attacks [5].
Bhagyashree S Jawariya; (2014),” Detecting Unknown Attacks Using Big Data Analysis.” In
this paper, a Big Data System Model for reacting to previously unknown cyber threats is proposed.
Big data analysis techniques that can extract information from a variety of sources to detect future
attacks were suggested.
Xiaohua Yan; Joy Ying Zhang; (2013),” Early Detection of Cyber Security Threats using
Structured Behavior Modeling.” In this paper, the writers proposed an effective early intrusion
detection system called the Structured Intrusion Detection (SID) system based on structured
modeling of cyber-attack behavior. The system aimed to discover the underlying high-level
behavioral patterns within network traffic that are likely to be early signs of cyber-attacks [1].
.

29
CHAPTER THREE
METHODOLOGY
In this section, big data and its tools are briefly explained, before we delve in full detail the
approach used in this work. .
3.1. Big data and Big data analytics
3.1.1. Big Data
According to Wikipedia [38], Big data is a broad term used for data sets that are so large or
complex and exceed the capability of traditional data processing applications. Big Data has three
attributes that differentiate it from traditional data processing technologies. These include:
The Volume of data,
the velocity or rate of data generation and transmission,
and the variety of data, both structured and unstructured.
The term always refers basically to the use of predictive analytics or other certain advanced
techniques to extract values from data, and not often to a particular size of data set. Accuracy in
big data might lead to more confidence in making the right decision, and making better decisions
can mean greater operational efficiency. [38].
3.1.2. Big Data Analytics
This can be defined as the process of examining or analyzing large data sets containing a variety
of data types such as big data - to reveal hidden patterns, market patterns or trends, not known
30
correlations, customer preferences and other useful or important business information [39]. In
short, it is the process of analyzing and mining Big Data. The necessity to analyze and leverage
trend data collected by businesses is one of the core drivers for Big Data analysis tools. With the
recent beneficial progression of technology in storage, and processing, analysis of Big Data is
made possible because of the following:
The fast rate at which the cost of storage CPU power is decreasing in recent years;
Recent trends in technology, pliability, and cost-effectiveness of setting up data
centers, storage and cloud computing for elastic computation.
The recent development of new frameworks such as Hadoop, which gives users the
ability to take advantage of these distributed computing systems storing a large
volume of data through flexible parallel processing [2].
These progressions in technology have created diverse differences between traditional analytics
and Big Data analytics.
3.1.3. Some Big Data Technologies
Explaining Big Data technologies in detail is out of the scope of this work, but we provide an
overview of some of the technologies, especially the one used in this work.
3.1.3.1. Hadoop
Hadoop can be defined as an open-source framework that is used or allows to store and process
big data in a distributed environment, over or across clusters of computers using simple or basic
programming models. It is designed or built to scale up from single servers to thousands of
machines, each of them offering local computation and storage [40].
31
Hadoop is made up of two main components: a distributed processing framework named
MapReduce (now supported by a component called YARN) and a Hadoop distributed file system
(HDFS).
An application or software that is running on Hadoop gets its work shared or divided among the
nodes in the cluster, and HDFS stores the data that is being processed. A Hadoop cluster spans
thousands of machines, where HDFS store data and MapReduce jobs do their processing near or
close the data, which keeps I/O costs quite low [40].
Hadoop cluster is a kind of computer cluster, used for computational processing or purposes. In a
computer cluster, several computers (compute nodes) can split or share computational workloads
and take advantage of, or benefit from a very large aggregate bandwidth across the cluster. Hadoop
clusters consist of a few master nodes, their core function is to control the storage and processing
systems in Hadoop, and many slave nodes which store all the cluster’s data and processes the data.
So far three companies stand out as Hadoop distribution: Cloudera, MapR, and Hortonworks.
3.1.3.2. MapReduce and Distributed Computing Using Spark
As we discussed in the last section, MapReduce is part of the Hadoop framework used for
implementing distributed computing and it provides an approach for working with extremely large
datasets distributed over or across a network of machines. Spark is a latest implementation of this
conception which endeavors to keep computations in the aggregate memory of the network of
machines to speed up computations, particularly iterative algorithms [41].
Spark extends the popular MapReduce to efficiently support more types of computations,
including stream processing and interactive queries.
Spark is a powerful open source computation or processing engine built around speed, ease of use,
and advanced or sophisticated analytics.
32
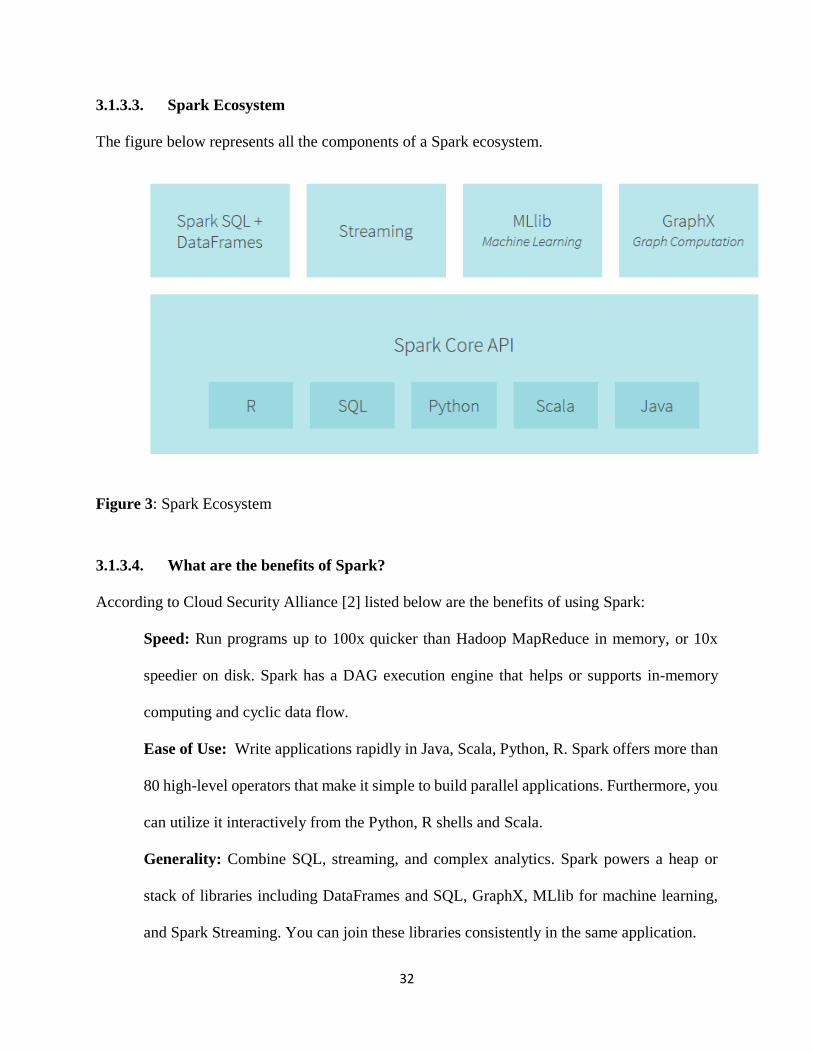
3.1.3.3. Spark Ecosystem
The figure below represents all the components of a Spark ecosystem.
Figure 3: Spark Ecosystem
3.1.3.4. What are the benefits of Spark?
According to Cloud Security Alliance [2] listed below are the benefits of using Spark:
Speed: Run programs up to 100x quicker than Hadoop MapReduce in memory, or 10x
speedier on disk. Spark has a DAG execution engine that helps or supports in-memory
computing and cyclic data flow.
Ease of Use: Write applications rapidly in Java, Scala, Python, R. Spark offers more than
80 high-level operators that make it simple to build parallel applications. Furthermore, you
can utilize it interactively from the Python, R shells and Scala.
Generality: Combine SQL, streaming, and complex analytics. Spark powers a heap or
stack of libraries including DataFrames and SQL, GraphX, MLlib for machine learning,
and Spark Streaming. You can join these libraries consistently in the same application.
33
Runs Everywhere: Spark runs on Mesos, Hadoop, standalone, or in the cloud. It can
access data from diverse data sources including HDFS, Cassandra, HBase, and S3. You
can run Spark utilizing its standalone cluster mode, on Hadoop YARN, on EC2, or on
Apache Mesos. It can access information in HDFS, Cassandra, HBase, Hive, Tachyon, and
any Hadoop data source.
In this work we used Hadoop, Spark, and HDFS distributed by Cloudera.
3.1.3.5. Resilient Distributed Datasets
The core of concept in Spark is the use of Resilient Distributed Datasets (RDD). RDD are defined
as a collection of records (objects of some type) that are distributed or partitioned across multiple
nodes in a cluster. The characteristics of Spark RDD is fault-tolerant; which means if a node in the
cluster or job fails during execution (for any reason other than error in user code, hardware failure,
loss of communication etc.), the RDD can automatically be reconstructed on the remaining nodes,
and the job execution will still continue and complete [44].
3.1.3.6. Predictive Modeling and Analytics
Predictive analytics can be defined as the process of extracting information from a dataset in order
to determine patterns and make predictions on future outcomes and trends. It is used to analyze
current data and historical data in order to better understand the data and identify the pattern in the
data. It uses statistical algorithms and Machine Learning techniques.
Predictive modeling is the concept of building a model that is capable of making predictions. This
model includes a Machine learning algorithm that learns certain properties from a training dataset
in order to make those predictions [54].
Machine Learning is always used to build predictive models, it does this by extracting patterns
from large datasets. The models created are used for making predictions.

34
3.1.3.7. Types of Machine Learning Models
Machine Learning, as discussed in predictive analytics is a method of data analysis that automates
analytical model building. Machine Learning can be defined as a science of training a system to
learn from data and act. The concept behind Machine Learning-based systems is they are not
explicitly programmed but learned from data. Machine Learning blends Artificial Intelligent
heuristics with advanced statistical analysis. Machine learning uses algorithms that iteratively
learn from the dataset and allow computers to find hidden insights without being explicitly
programmed on what to do. The interactive aspect of it is important because as models are given
new data or exposed to new data, they are able to independently adapt. They learn from previous
computations to produce dependable, repeatable decisions and results [45].
The Two main categories of machine learning are:
Supervised learning: These types of machine learning models use labeled data to learn. It
requires a labeled data set.
Unsupervised learning: This model does not require a labeled data set. These types of
models try to learn or extract some underlying structure in the data or reduce the data down
to its most important features [44].
3.1.4. Machine Learning and Big Data Analytics
Big data is all about gathering and maintaining large collections of data from disparate data
sources, while big data analytics is about extracting useful information from these collections to
make predictions.

35
Big data analytics can be said to be predictive analytics. Big data changes the tools used for
predictive analytics because the traditional analytics tools are dominated by trial-and-error
analysis, and these are not well suited when datasets are large and heterogeneous. The volume of
data is too large for comprehensive analysis, and the wide range of potential correlations and
relationships between disparate data sources are too much for any data analyst to test all hypotheses
and extract all the value hidden in the data. In addition to this, when the volume of data is too large,
this leads to fewer options in constructing predictive models because there are few tools that allow
processing huge or large datasets in a good amount of time.
Machine learning is a good alternative that overcomes these problems, it is ideal for exploiting the
opportunities hidden in big data. Machine learning techniques use a set of generic methods that
are different from traditional statistical techniques to extract values from big and disparate data
sources, with far less dependence on human direction. ML is data driven, runs at machine scale,
well suited to handle the complexity of disparate data sources and a huge variety of variables and
amounts of data involved [55].
3.1.5. Benefits of Big Data Analytics in APT attack detection
Putting into consideration the unique characteristics of APT attacks and more so the inability of
the current network security solutions to detect the attack effectively, there is a serious need to
change the manner security solutions are operated.
As seen, APT attackers are willing to spread their action over a long period with their slow and
low manner in order to avoid detection. Consequently, there is a need to shift focus from real-time
detection, which hinders the analysis/correlation capabilities, to focusing on full packet capture,
and deep packet inspection, in order to monitor network behavior and discover any attempt of
compromise.
36
Using Big data analytics enables the use of more advanced algorithms for analysis and correlation,
and discovering the hidden pattern of the network traffic behavior which will help mitigate any
evasion attempt.
Moreover, the correlation of events across large timescales and from many sources (e.g. analysis
of network traffic, event logs etc.) is needed for the detection of sophisticated attacks like APT.
To note, even when the traditional network solution cannot detect their activities, the attackers
generate subtle attack indicators (attack metadata) while accessing or exploiting the network.
Indicators like an increase in network traffic from a particular node (s), failed login attempts,
abnormal resource utilization and running or execution of unknown processes can all be correlated
together and identified as an indication of compromise, even when they are spread over an
extended period.
Big data analytics focuses on the mentioned needs above, and facilitates APT detection by
supporting:
Dynamic and managed collection, correlation, and consolidation of data from several data
sources, such as network traffic, operating system artifacts and event log data.
Incorporating several data from diverse data sources helps to have a holistic view of the
infrastructure which enables the defenders to correlate low and slow events as a result of
APT attack. When compared with modern SIEM systems, it does not have a limited
window of time that the correlation can be done [29].
Anomaly detection, which focuses on the correlation of recent and historical events, and
helps to limit the number of false positive alerts. For instance, an increase in the Domain
Name System traffic from a particular system for a short period of time can be considered

37
normal, but if such a pattern continues for a number of days, that could be a possible
indication of malicious activity like covert data exfiltration. [29].
3.2. Methodology
Considering the unique characteristics of APT activities which are stealthy and hard to detect, (but
the command and control traffic associated with APT can be detected [43]), the approach used in
this work is on leveraged big data methods to detect APT malware Command and Control
Channels using Anomaly detection methods.
3.2.1. What is Anomaly Detection?
Anomaly detection is the identification of those events that do not conform to an expected
pattern of other items in a dataset. The main aim of anomaly detection is to target any event
falling outside of a predefined set of normal behaviors. Machine-learning techniques play
important roles in building normal profiles and that is why they are used in intrusion detection in
anomaly detection systems.
There are supervised and unsupervised anomaly detection techniques. Unsupervised anomaly
detection techniques require an unlabeled test data, under the assumption that many of the
instances in the dataset are normal by looking for instances that seem to fit least to the remainder
of the data set. While supervised anomaly detection techniques require a labeled data set that has
been labeled as “normal” and “malicious”, and involves training a classifier. It involves building
a model with a labeled data set and then testing the model prediction capabilities with a test data.
In this work, Big data analytics advanced machine learning algorithm is used to design a high-
level architecture, intelligent distributed machine learning system for the classification and
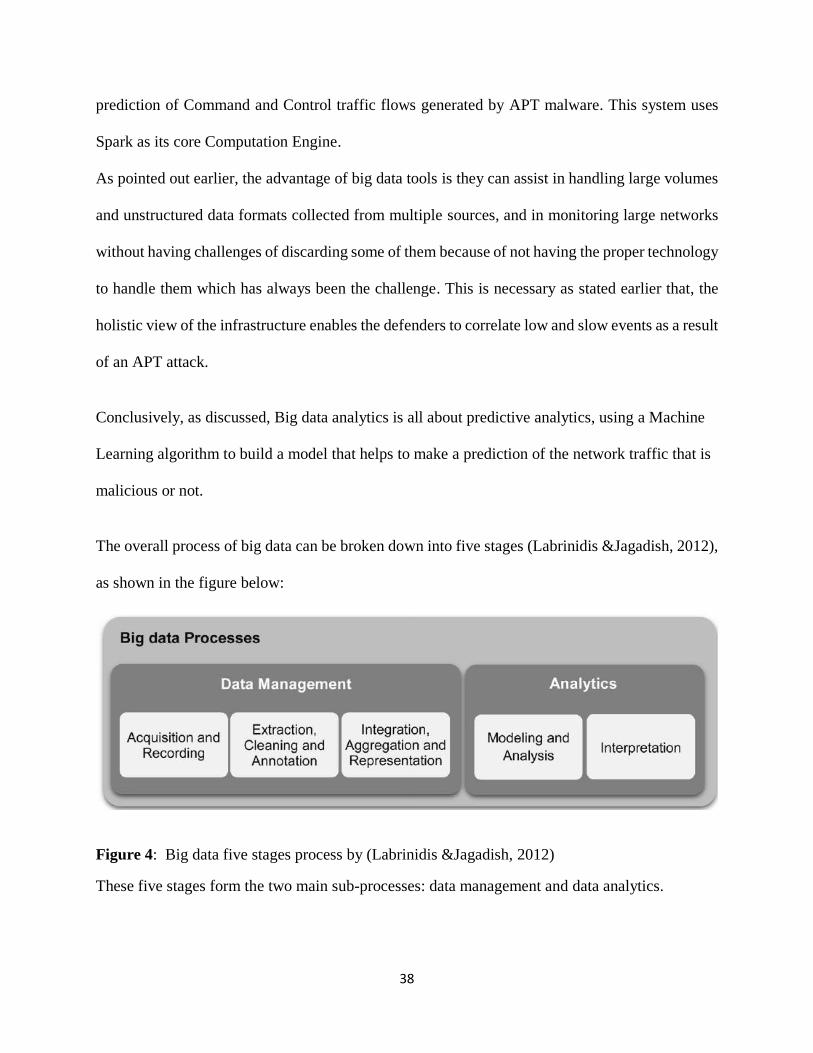
38
prediction of Command and Control traffic flows generated by APT malware. This system uses
Spark as its core Computation Engine.
As pointed out earlier, the advantage of big data tools is they can assist in handling large volumes
and unstructured data formats collected from multiple sources, and in monitoring large networks
without having challenges of discarding some of them because of not having the proper technology
to handle them which has always been the challenge. This is necessary as stated earlier that, the
holistic view of the infrastructure enables the defenders to correlate low and slow events as a result
of an APT attack.
Conclusively, as discussed, Big data analytics is all about predictive analytics, using a Machine
Learning algorithm to build a model that helps to make a prediction of the network traffic that is
malicious or not.
The overall process of big data can be broken down into five stages (Labrinidis &Jagadish, 2012),
as shown in the figure below:
Figure 4: Big data five stages process by (Labrinidis &Jagadish, 2012)
These five stages form the two main sub-processes: data management and data analytics.
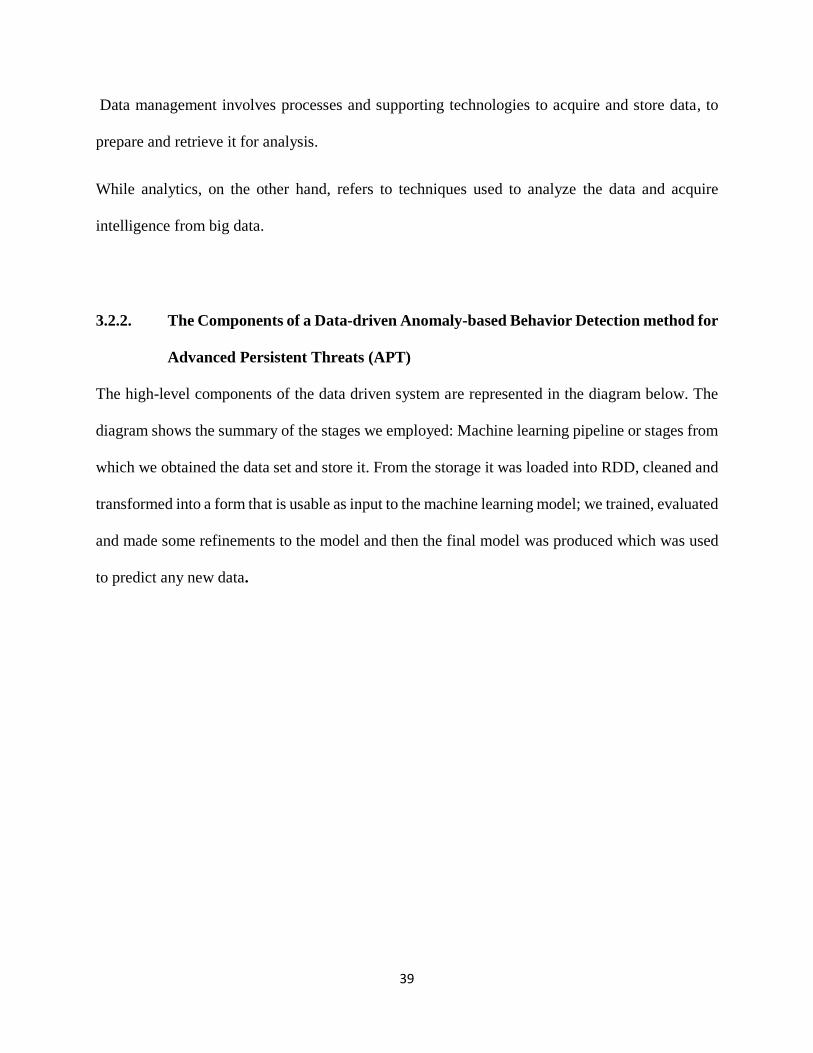
39
Data management involves processes and supporting technologies to acquire and store data, to
prepare and retrieve it for analysis.
While analytics, on the other hand, refers to techniques used to analyze the data and acquire
intelligence from big data.
3.2.2. The Components of a Data-driven Anomaly-based Behavior Detection method for
Advanced Persistent Threats (APT)
The high-level components of the data driven system are represented in the diagram below. The
diagram shows the summary of the stages we employed: Machine learning pipeline or stages from
which we obtained the data set and store it. From the storage it was loaded into RDD, cleaned and
transformed into a form that is usable as input to the machine learning model; we trained, evaluated
and made some refinements to the model and then the final model was produced which was used
to predict any new data.
40
Figure 5: High level architecture for an intelligent distributed machine learning system for the
classification and prediction of Command and Control traffic.
Below is the step by step description of what was done at each stage:
1. Data collection.
2. Data preprocessing
The Feature extraction
Data cleaning
Feature engineering and transformation
Normalizing and standardizing features
4. Model creation via Classification.
Analytics Network Packet
and Log Capture
IDS
Signatures
Packet Contents:
DNS
Packet Contents:
TCP
Packet Contents:
HTTP
Packet Contents:
ICMP
Data Repository
Preprocessing Process
Feature Extraction
Cleaning
Integration
Aggregation
Normalization
Model
Creation
Machine
Learning
Model Detection
Prediction
Evaluation
Interpretation
Visualization
ALERT

41
5. Model Selection
6. Model Prediction and Evaluation.
3.2.2.1. Data Collection
As previously noted, attack is best detected at the network level, so the focus in the data collection
for this research paper was to collect network traffic packet and log event data from various
sources, based on full data capture. The collected data had both normal and malicious traffic. In
the implementation phase we used a supervised learning algorithm, the data set collected was
labeled.
The dataset was collected and stored in Hadoop HDFS.
3.2.2.2. Data preprocessing
At this stage the data collected in step one was processed into a format that could be input into the
big data analytics advanced algorithm (Machine learning algorithm). Machine learning models
operate on features, which are numerical representations of the input variables, these were used
for the model creation. The data collected in stage one was in raw form and was loaded from HDFS
into Spark RDD for preprocessing.
The first step at this stage was to analyze and understand the data that had been collected, to know
which of the features were numerical, categorical, string, date etc. This helped in knowing the
different kinds of transformation that were needed to be performed on the available features to
make it fit for building the model.
42
3.2.2.2.1. Feature Extraction
Once the data was analyzed, the next thing was feature selection. At this point the features that
were relevant for building the model were selected from the whole features.
This played an important role in the classifier model building. Distinctive features that could assist
in predicting APT malware were extracted from the datasets and transformed.
3.2.2.2.2. Data Cleaning
In order to use the raw data, it needed to be cleaned first. At this stage, we decided what to either
drop the rows having empty values or fill them with N/A (if the feature was a string) for the missing
values.
3.2.2.2.3. Feature Engineering and Transformation
In feature engineering, we derived some new features from existing ones that could help in
attaining a high classification accuracy.
During feature transformation, existing features were transformed for building the model.
Pipeline Components
Spark ML Pipeline normally have a series of Pipeline Components. There are two components
types used in ML Pipeline: Transformers and Estimators
Transformers
It transforms the input Dataframe into a new data frame by calling the transform () method.
Estimators
This fits a model to data by calling the fit () method and then transforms it.

43
StringIndexer
In order to build a model in Pyspark, the extracted features must be in Double type. Pyspark
provides a Feature Transformer called StringIndexer which can be used for this transformation. It
has both the fit () and transformer () method.
The Fit method of StringIndexer converts the feature column to StringType if it is not a string, it
then counts the number of occurrence of each word. Finally, it sorts the words in descending order
of the number of occurrences and assigns an index to each word. StringIndexerModel.transform ()
assigns the generated index of fit () to every value of the column in the DataFrame given.
Term Frequency-Inverse Document Frequency (TF-IDF)
This is another Feature Transformer that helped us to transform our text data into a vector. It had
both the fit () and transformer () method. Our methods were not termed fit () or transformer ()
because this was taken care of by the Pipeline. The Pipeline handled each stage and passed the
output to the next stage. At each stage, either a Transformer Pipeline called transform () or if it
was an Estimator, the Pipeline called fit () first, and then called transformer (). Although the final
stage was an Estimator, it was not called a transformer ().
Vector Assembler
This is normally used to assemble all the features into a vector. All the columns for building the
model were passed to the VectorAssembler () and VectorAssembler ()created a new vector column
with them.
Normalizer
To ensure all the different input variables or features had a consistent scale for the model,
normalization was necessary depending on the algorithm used. Normalizer is a transformer that
transforms each feature to have a unit standard deviation and/or zero mean.

44
3.2.2.3. Model Creation via classification
A classification method is a systematic approach to build a classification model using the selected
features. The aim of the classification machine learning algorithm is to create models that can
accurately predict a class label for unknown data. The process of creating model is also known as
training.
The data used for training is called training data, it usually consists of a set of training examples
(labeled data). The labeled data was used to learn features of malware traffic and normal traffic.
Supervised learning used available malicious and normal data set to determine the difference to a
baseline. Any behavior that was not consistent with the normal base line was considered
anomalous.
The classification model was built with Random forests which are a supervised learning algorithm.
3.2.2.3.1. Random Forests Algorithm
The Random forest is an ensemble of decision trees that can be thought of as a form of nearest
neighbor predictor. Ensembles are a divide and conquer approach used to improve performance.
The major or main idea behind the ensemble method is that, a group of “weak learners” can come
together to form a strong learner [48].
Trees and Forests. The Random forest started with a standard machine learning method called a
decision tree which, in ensemble terms, can be said to be our weak learner. In a decision tree
algorithm, an input is entered at the top (i.e. apex) and as it traverses down the tree the data gets
bucketed into smaller and smaller sets. The random forest takes this concept to the next level by
combining trees with the idea of an ensemble. Consequently, in ensemble terms, the trees are
referred to as weak learners and the Random forest is a strong learner. [48]

45
3.2.2.3.1.1. Training
Random forests as explained earlier train a set of decision trees separately, with this concept the
training can be done in parallel. The algorithms introduced randomness into the training process
which made the decision tree a bit different from the other.
Joining the predictions from each tree reduced the variance of the predictions, and improved the
performance of test data [53].
3.2.2.3.1.2. Prediction
To make predictions on a test data, Random forests combines the predictions from its set of
decisions trees.
Random Forest hyperparameters
Random forest tree has some parameters when tuned can improve model performance. We just
discussed two parameters which are most important here [53]:
numTrees: Number of trees in the forest. Increasing this will decrease the variance in
predictions and improve the model’s test time accuracy. This can increase training time linearly
in the number of trees.
maxDepth: Maximum depth of each tree in the forest. Increasing this makes the model
expressive and powerful but deep trees take longer time to train.
3.2.2.3.2. Create Pipeline
A Pipeline object was created with all the components defined earlier. As already noted, a Pipeline
has a series of stages, and every component we added was a stage within the Pipeline, and the
Pipeline processed each of the stages one after the other. Passing the result of each stage to the
next one.
46
3.2.2.4. Model Selection
This is the process of selecting the best performing model, to achieve this we used a
CrossValidator
3.2.2.4.1. Tuning the Pipeline using a CrossValidator
Spark Machine Learning (ML) algorithms have several hyperparameters that must be tuned, it is
worth to note that an optimal model performance is dependent on the parameters tuning. We built
a CrossValidator with the following:
1. The Pipeline that was created.
2. MulticlassClassificationEvaluator () or BinaryClassificationEvaluator ()
3. A ParamMap that represents the hyperparameters that we tuned to get a better result.
4. The number of folds to evaluate the model.
The CrossValidator, this divided the training sets into a set of folds which were used separately
to train and test the model, and it iterated through the set of ParamMaps given.
The model that gave the best evaluation metric was determined by the
MulticlassificationEvaluator or BinaryClassification which finally fit over the entire data set.
3.2.2.5. Model Prediction and Evaluation
Finally, we carried out the prediction by giving the model a new data set that it had not seen before,
this data set is referred to as a test data. Later the result of the prediction was evaluated using the
Spark ML inbuilt library for Evaluation known as Evaluation Metrics. The essence of the
evaluation was to determine the performance of the model in predicting an accurate result, based
on the labeled data set.

47
In classification models which are typically Supervised Learning, there exists a true output and a
model-generated predicted output for each data point. Apparently, for this reason, in evaluation,
the results for each data point can be assigned to one of four categories:
True Positive (TP) - means the label is positive and prediction is also positive
True Negative (TN) – means the label is negative and prediction is negative
False Positive (FP) - means the label is negative but prediction is positive
False Negative (FN) – means the label is positive but prediction is negative
In Spark the Evaluation Metrics available are:
ROC curve can be created by taking a binary classification predictor that uses a threshold value
to assign labels given at predicted continuous values. ROC curve is a plot of the true positive rate
against the false positive rate for the different possible cutpoints of a diagnostic test [49]. This
line created by ROC curve cuts the unit square into two equally-sized triangles so that the area
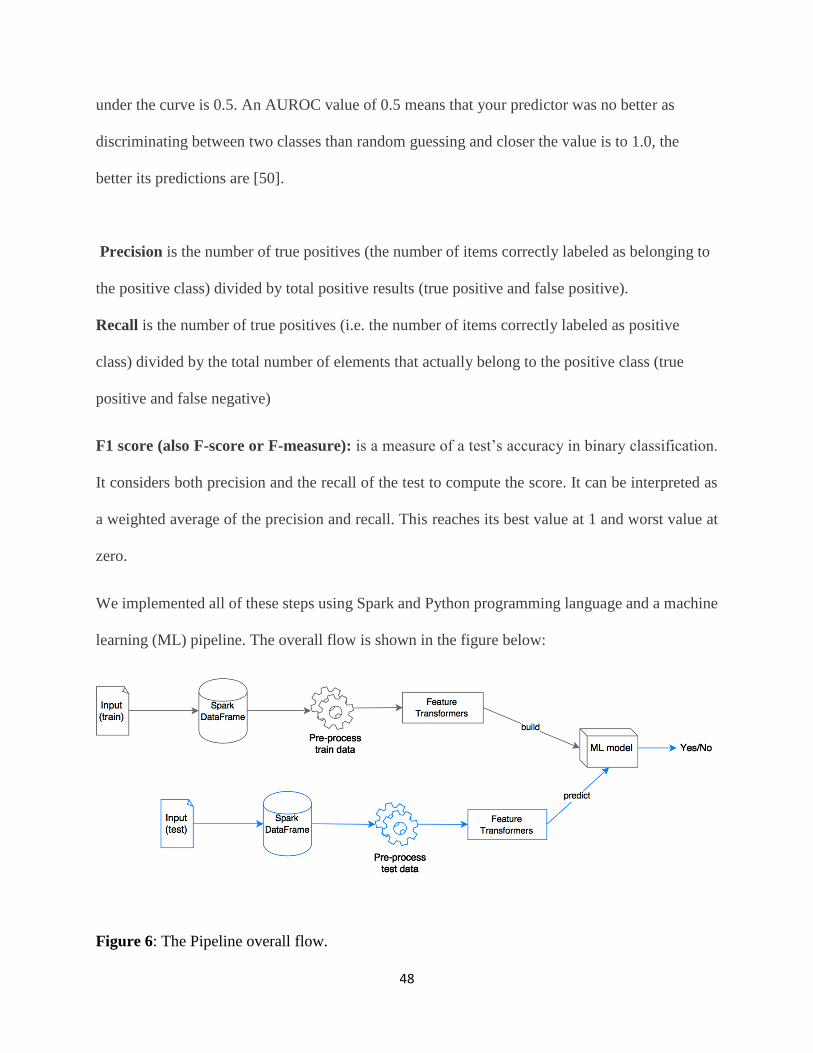
48
under the curve is 0.5. An AUROC value of 0.5 means that your predictor was no better as
discriminating between two classes than random guessing and closer the value is to 1.0, the
better its predictions are [50].
Precision is the number of true positives (the number of items correctly labeled as belonging to
the positive class) divided by total positive results (true positive and false positive).
Recall is the number of true positives (i.e. the number of items correctly labeled as positive
class) divided by the total number of elements that actually belong to the positive class (true
positive and false negative)
F1 score (also F-score or F-measure): is a measure of a test’s accuracy in binary classification.
It considers both precision and the recall of the test to compute the score. It can be interpreted as
a weighted average of the precision and recall. This reaches its best value at 1 and worst value at
zero.
We implemented all of these steps using Spark and Python programming language and a machine
learning (ML) pipeline. The overall flow is shown in the figure below:
Figure 6: The Pipeline overall flow.
49
CHAPTER FOUR
IMPLEMENTATION AND EVALUATION
In this section, we discuss the implementation of the proposed model and the evaluation of the
model.
We decided to implement it in the following ways based on, full data capture of Network traces
including full packet payloads and HTTP traffic.
4.1. Big Data Analytics (Machine learning) based on network traces with full payloads
The focus of this is to collect the whole network traffic packets and log data from various sources
for the Implementation. It is based on both packet header information and payload information.
The technique combines both protocol analysis and content analysis. Machine learning techniques
are effective and automatically learn from labeled training data by taking intelligent hints from the
data and with this, predict accurately. The information used to detect C&C traffic are the duration
of the flows, the source byte, and destination byte, the number of packets in subsequent flows, flag
and so forth. Based on the listed features under feature extraction, a model was created using the
Machine learning algorithm.
4.2. Big Data Analytics (Machine Learning) based on HTTP traffic
This focused on HTTP traffic information. HTTP traffic information was extracted from the
network traces collected. The information used to detect C & C traffic were a user agent (it is noted
that HTTP request generated by malware are usually GET requests with a spoofed user-agent), the
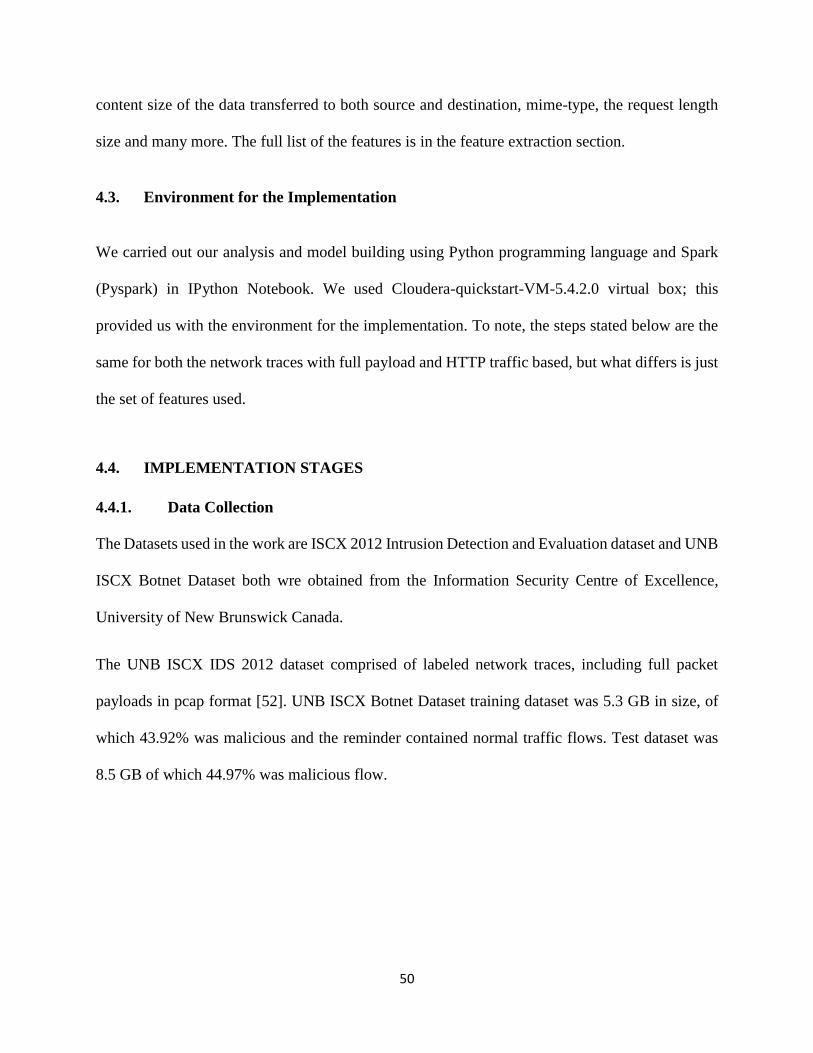
50
content size of the data transferred to both source and destination, mime-type, the request length
size and many more. The full list of the features is in the feature extraction section.
4.3. Environment for the Implementation
We carried out our analysis and model building using Python programming language and Spark
(Pyspark) in IPython Notebook. We used Cloudera-quickstart-VM-5.4.2.0 virtual box; this
provided us with the environment for the implementation. To note, the steps stated below are the
same for both the network traces with full payload and HTTP traffic based, but what differs is just
the set of features used.
4.4. IMPLEMENTATION STAGES
4.4.1. Data Collection
The Datasets used in the work are ISCX 2012 Intrusion Detection and Evaluation dataset and UNB
ISCX Botnet Dataset both wre obtained from the Information Security Centre of Excellence,
University of New Brunswick Canada.
The UNB ISCX IDS 2012 dataset comprised of labeled network traces, including full packet
payloads in pcap format [52]. UNB ISCX Botnet Dataset training dataset was 5.3 GB in size, of
which 43.92% was malicious and the reminder contained normal traffic flows. Test dataset was
8.5 GB of which 44.97% was malicious flow.

51
The distribution of botnet types in the training dataset are shown in the figure below.
Figure 7: Training dataset botnet distribution
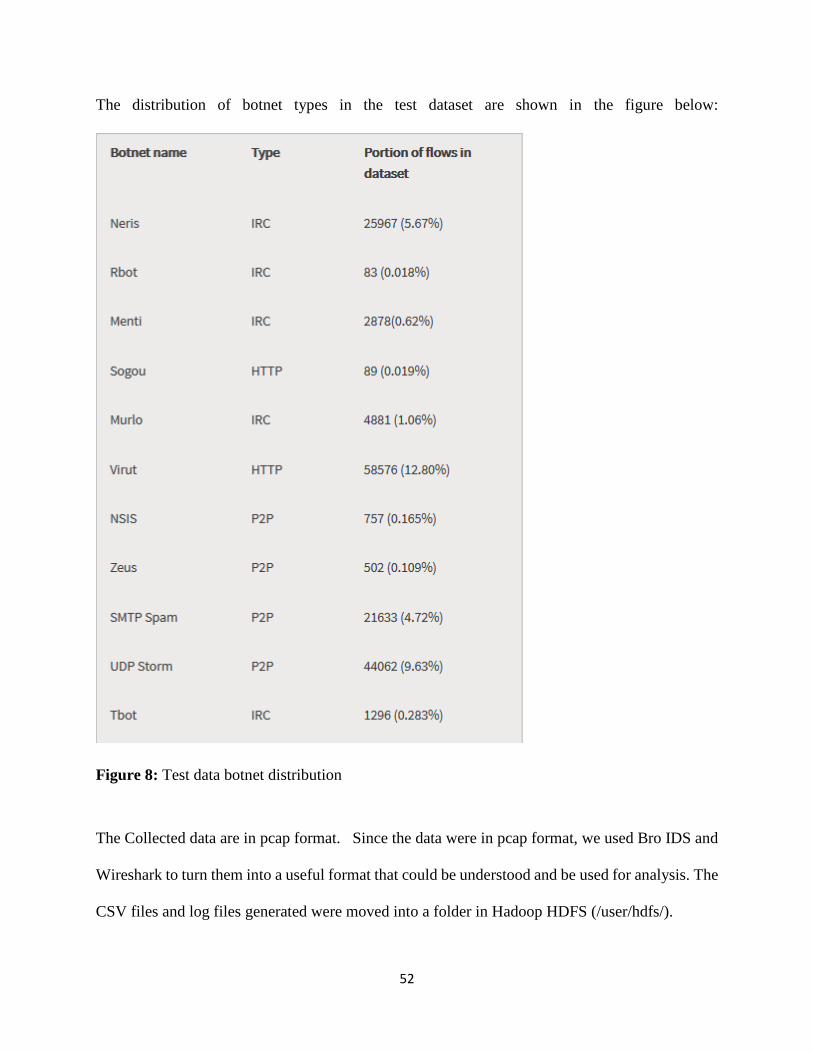
52
The distribution of botnet types in the test dataset are shown in the figure below:
Figure 8: Test data botnet distribution
The Collected data are in pcap format. Since the data were in pcap format, we used Bro IDS and
Wireshark to turn them into a useful format that could be understood and be used for analysis. The
CSV files and log files generated were moved into a folder in Hadoop HDFS (/user/hdfs/).
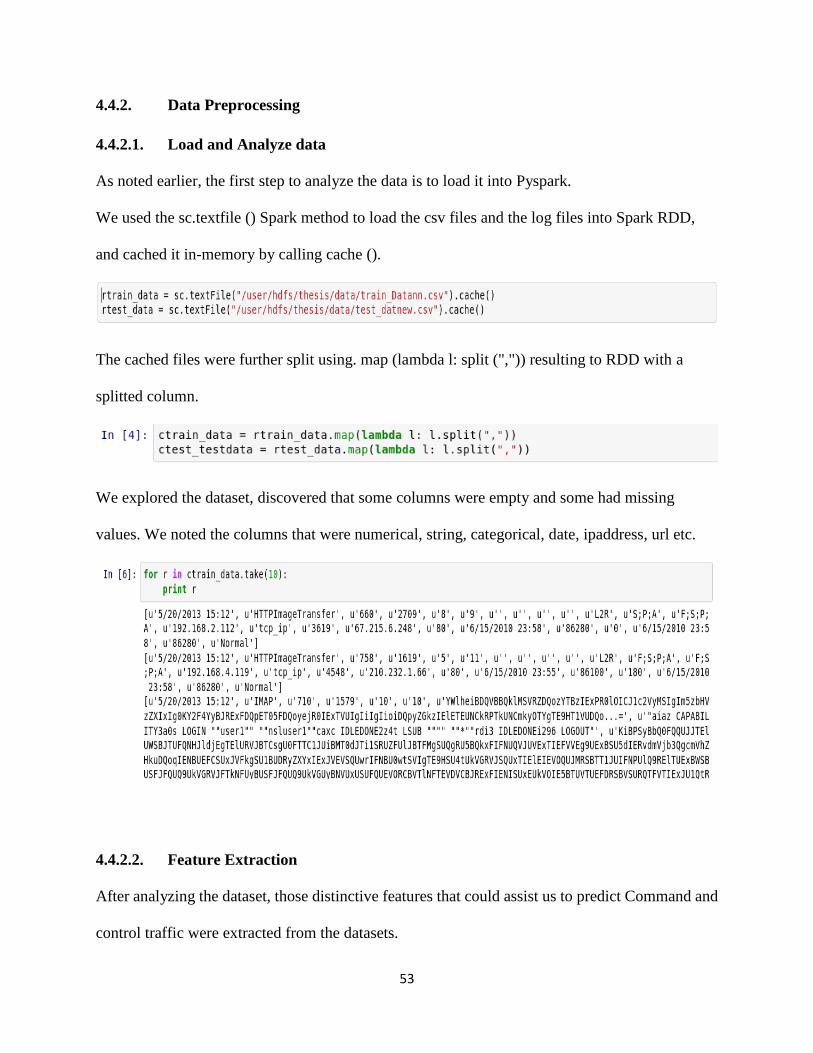
53
4.4.2. Data Preprocessing
4.4.2.1. Load and Analyze data
As noted earlier, the first step to analyze the data is to load it into Pyspark.
We used the sc.textfile () Spark method to load the csv files and the log files into Spark RDD,
and cached it in-memory by calling cache ().
The cached files were further split using. map (lambda l: split (",")) resulting to RDD with a
splitted column.
We explored the dataset, discovered that some columns were empty and some had missing
values. We noted the columns that were numerical, string, categorical, date, ipaddress, url etc.
4.4.2.2. Feature Extraction
After analyzing the dataset, those distinctive features that could assist us to predict Command and
control traffic were extracted from the datasets.

54
4.4.2.2.1. Big Data Analytics (Machine learning) based on network traces with full
payloads
The features selected included:
1. Start time: it defined the start time of each flow.
2. Stop time: it marked the time a particular flow end. The start time and Stop time can be
used to find out the regularity of a connection.
3. Duration: it indicated the total time taken to complete the particular flow.
4. Byte rate per second: It defined the amount of byte that was transferred by a particular
connection every second.
5. Packet rate per second: It defined the amount of packets transferred by a particular
connection every second.
6. Total Source Byte: Defined the total bytes of data sent from the source.
7. Total Destination Byte: Defined the total bytes of data sent from the Destination
8. Total Source packet: Defined the total packets sent from the Source
9. Total Destination packet: Defined the total packets sent from the destination.
10. sourcePayloadAsBase64: This describes the full packet payloads for the source in base64.
11. DestinationPayloadAsBase64: This describes the full packet payloads for the destination
in base64.
12. DestinationPayloadAsUTF: This describes the full packet payloads for the destination in
as UTF.
13. SourcePayloadAsUTF: This describes the full packet payloads for the source in asUTF.
14. Direction: this defined the direction of the flow.
15. Source TCP flag: It defined the Source TCP flag.
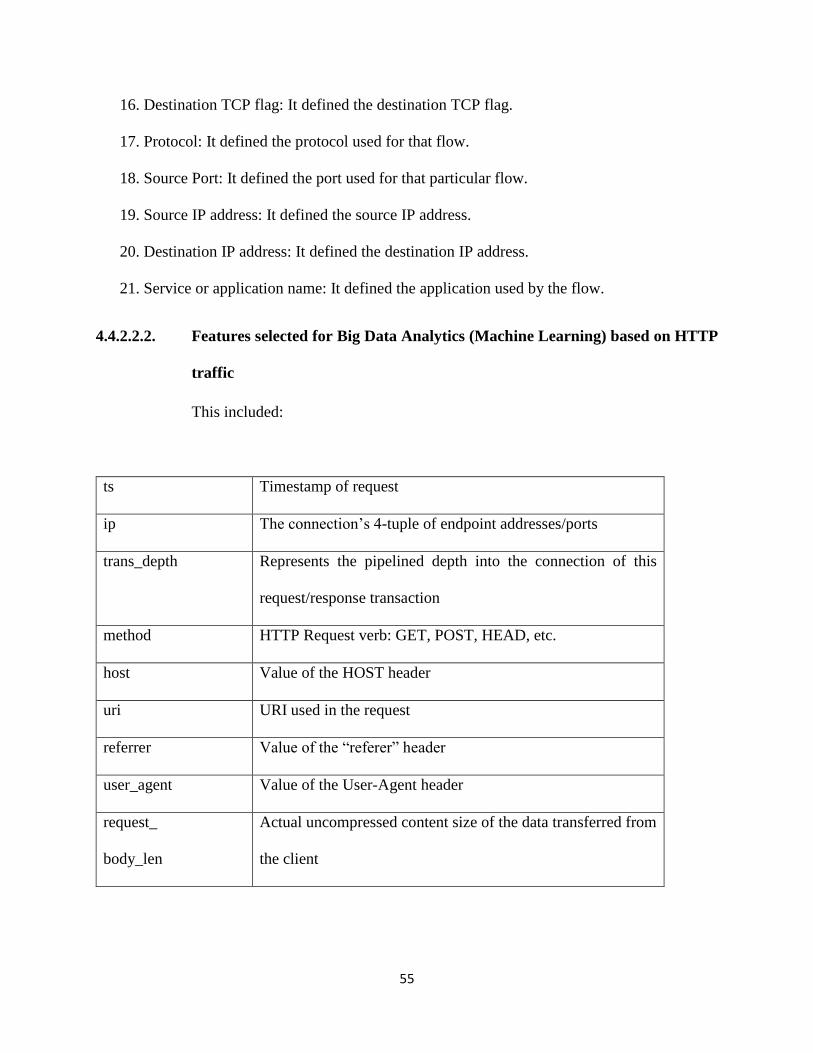
55
16. Destination TCP flag: It defined the destination TCP flag.
17. Protocol: It defined the protocol used for that flow.
18. Source Port: It defined the port used for that particular flow.
19. Source IP address: It defined the source IP address.
20. Destination IP address: It defined the destination IP address.
21. Service or application name: It defined the application used by the flow.
4.4.2.2.2. Features selected for Big Data Analytics (Machine Learning) based on HTTP
traffic
This included:
ts Timestamp of request
ip The connection’s 4-tuple of endpoint addresses/ports
trans_depth Represents the pipelined depth into the connection of this
request/response transaction
method HTTP Request verb: GET, POST, HEAD, etc.
host Value of the HOST header
uri URI used in the request
referrer Value of the “referer” header
user_agent Value of the User-Agent header
request_
body_len
Actual uncompressed content size of the data transferred from
the client
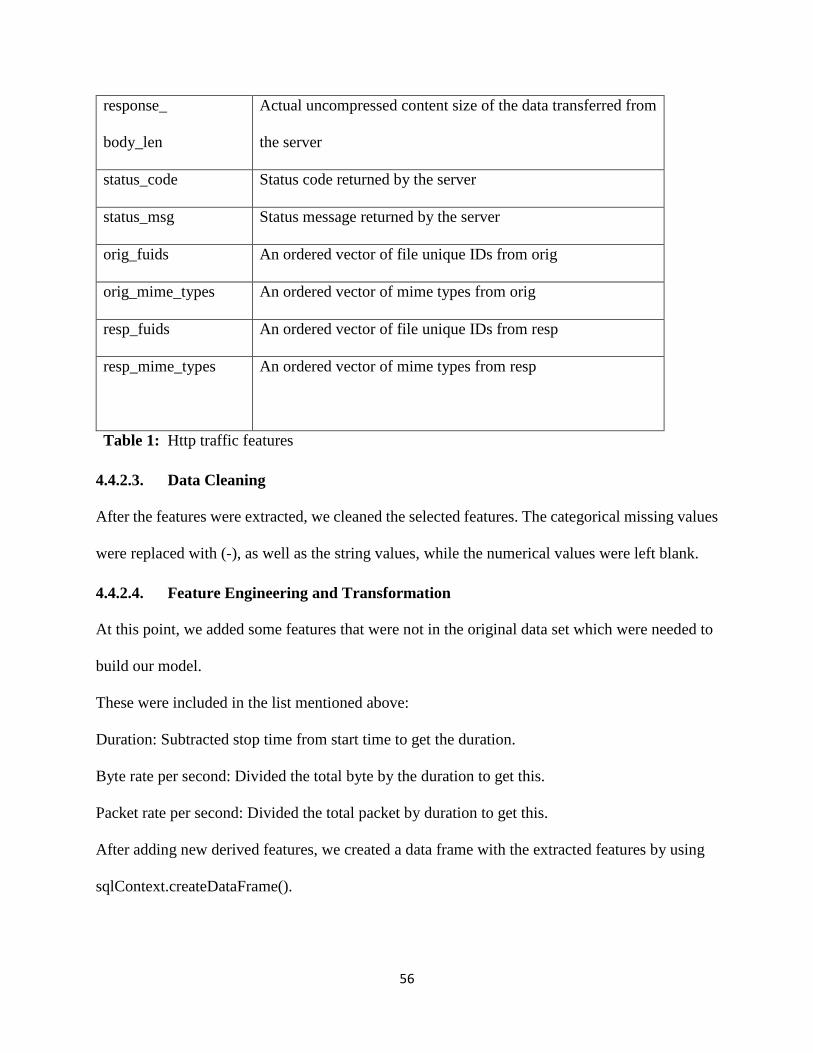
56
4.4.2.3. Data Cleaning
After the features were extracted, we cleaned the selected features. The categorical missing values
were replaced with (-), as well as the string values, while the numerical values were left blank.
4.4.2.4. Feature Engineering and Transformation
At this point, we added some features that were not in the original data set which were needed to
build our model.
These were included in the list mentioned above:
Duration: Subtracted stop time from start time to get the duration.
Byte rate per second: Divided the total byte by the duration to get this.
Packet rate per second: Divided the total packet by duration to get this.
After adding new derived features, we created a data frame with the extracted features by using
sqlContext.createDataFrame().
response_
body_len
Actual uncompressed content size of the data transferred from
the server
status_code Status code returned by the server
status_msg Status message returned by the server
orig_fuids An ordered vector of file unique IDs from orig
orig_mime_types An ordered vector of mime types from orig
resp_fuids An ordered vector of file unique IDs from resp
resp_mime_types An ordered vector of mime types from resp
Table 1: Http traffic features
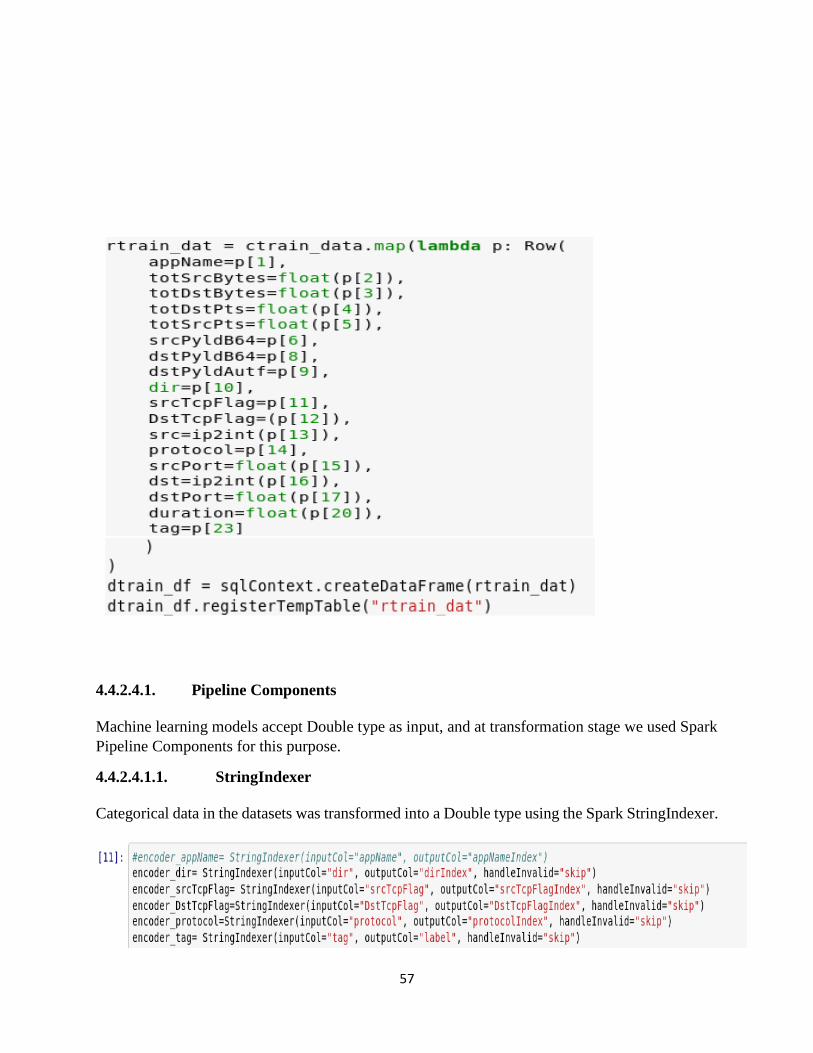
57
4.4.2.4.1. Pipeline Components
Machine learning models accept Double type as input, and at transformation stage we used Spark
Pipeline Components for this purpose.
4.4.2.4.1.1. StringIndexer
Categorical data in the datasets was transformed into a Double type using the Spark StringIndexer.
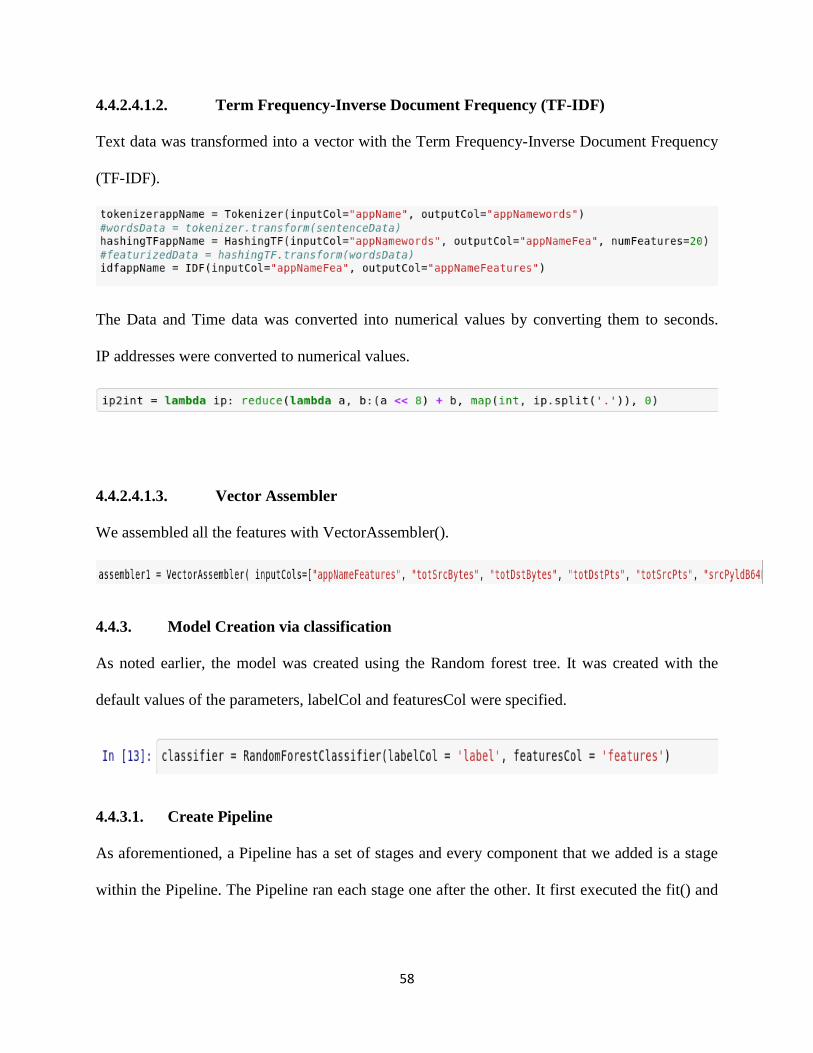
58
4.4.2.4.1.2. Term Frequency-Inverse Document Frequency (TF-IDF)
Text data was transformed into a vector with the Term Frequency-Inverse Document Frequency
(TF-IDF).
The Data and Time data was converted into numerical values by converting them to seconds.
IP addresses were converted to numerical values.
4.4.2.4.1.3. Vector Assembler
We assembled all the features with VectorAssembler().
4.4.3. Model Creation via classification
As noted earlier, the model was created using the Random forest tree. It was created with the
default values of the parameters, labelCol and featuresCol were specified.
4.4.3.1. Create Pipeline
As aforementioned, a Pipeline has a set of stages and every component that we added is a stage
within the Pipeline. The Pipeline ran each stage one after the other. It first executed the fit() and
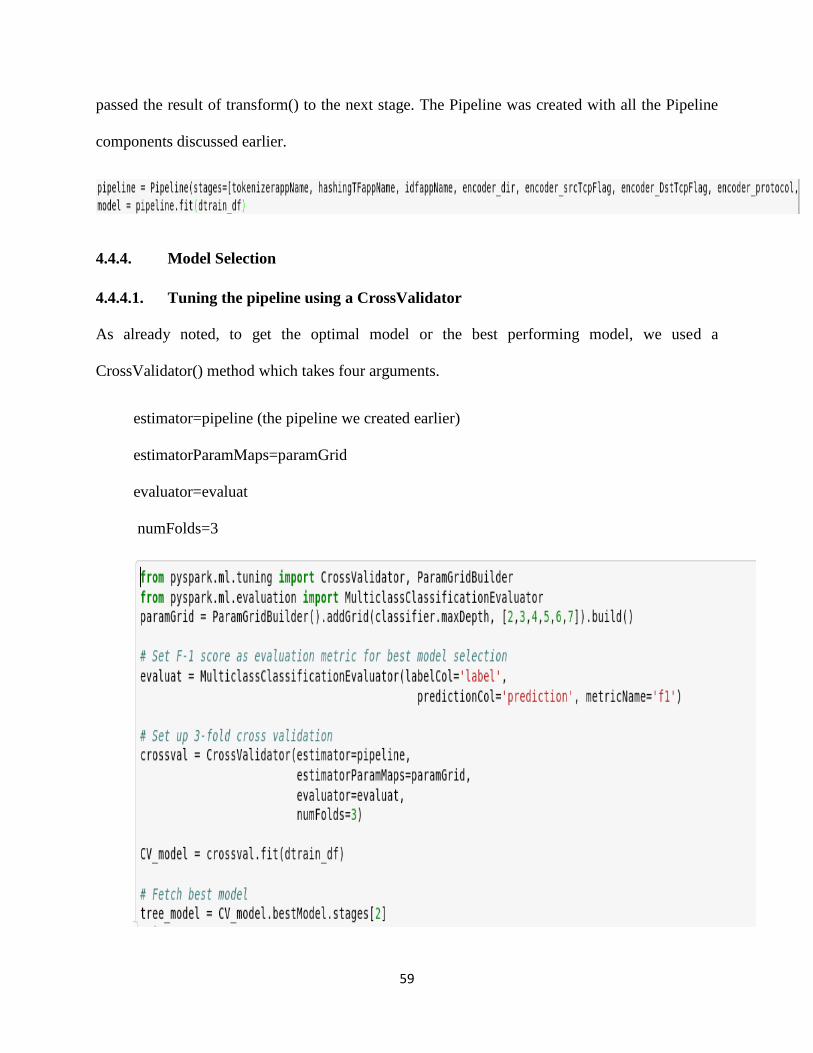
59
passed the result of transform() to the next stage. The Pipeline was created with all the Pipeline
components discussed earlier.
4.4.4. Model Selection
4.4.4.1. Tuning the pipeline using a CrossValidator
As already noted, to get the optimal model or the best performing model, we used a
CrossValidator() method which takes four arguments.
estimator=pipeline (the pipeline we created earlier)
estimatorParamMaps=paramGrid
evaluator=evaluat
numFolds=3
60
4.4.5. Model Prediction and Evaluation
In this phase, we tested the performance of the model by giving it a new set of data called a test
data.
After the prediction had been done by the model, we evaluated the result. During evaluation, for
each data point, the predicted values were compared with the actual values, and the results for
each data point was assigned to any of this as we mentioned before:
True Positive (TP)
True Negative (TN)
False Positive (FP)
False Negative (FN)
We calculated the ROC, PR and F1 scores and the result for both the
The ROC, PR and F1 scores were calculated and presented in the table below:
The evaluation results:
Big Data Analytics (Machine learning) based on network traces with full payloads
Metrics Scores
ROC Curve 0.9998823480575615.
True negative rate 80.930348817%
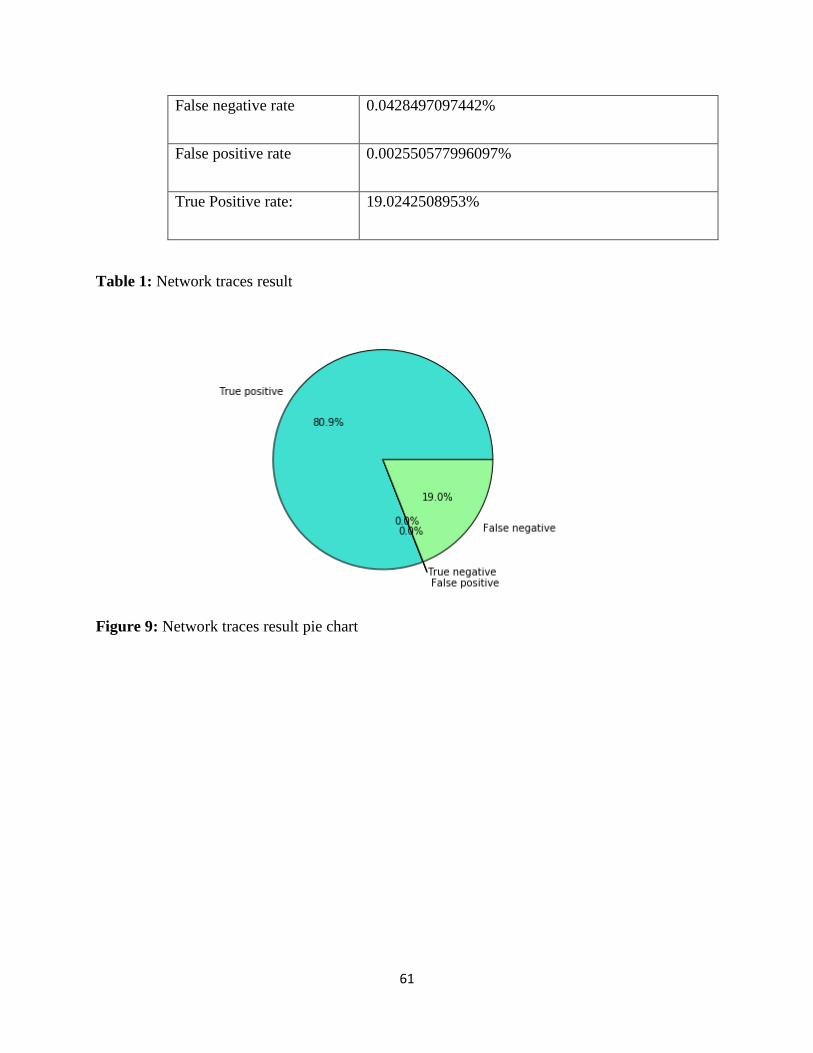
61
False negative rate 0.0428497097442%
False positive rate 0.002550577996097%
True Positive rate: 19.0242508953%
Table 1: Network traces result
Figure 9: Network traces result pie chart
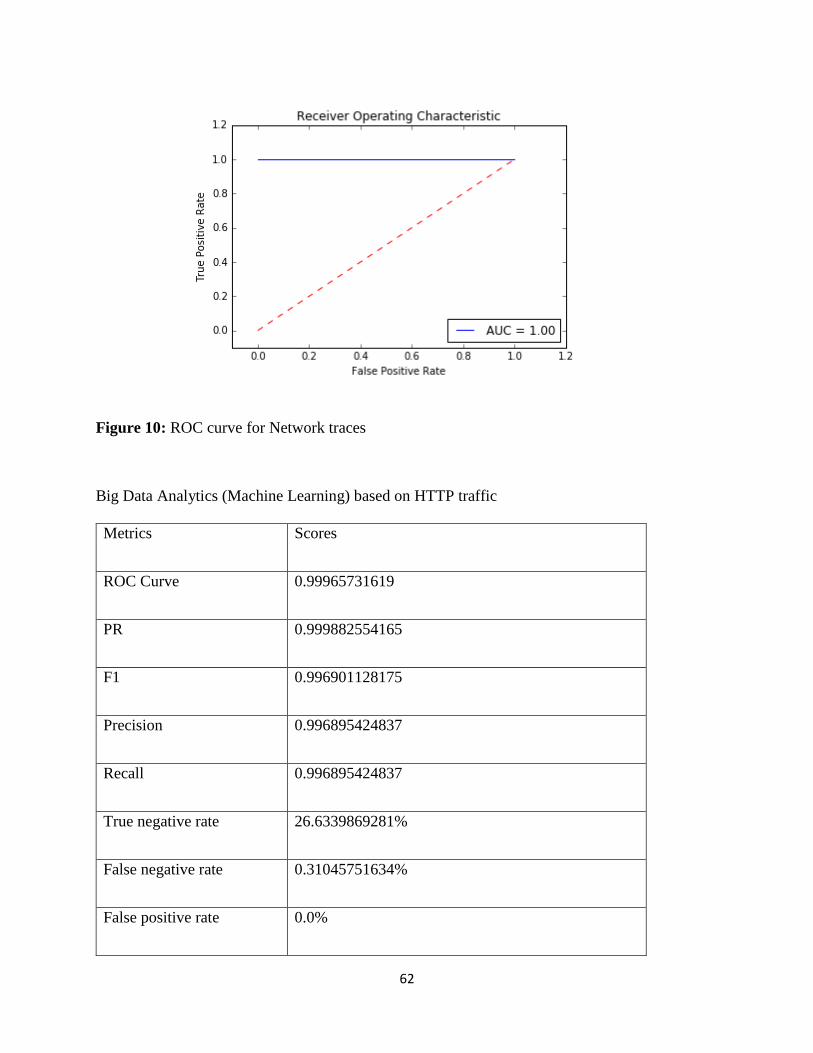
62
Figure 10: ROC curve for Network traces
Big Data Analytics (Machine Learning) based on HTTP traffic
Metrics Scores
ROC Curve 0.99965731619
PR 0.999882554165
F1 0.996901128175
Precision 0.996895424837
Recall 0.996895424837
True negative rate 26.6339869281%
False negative rate 0.31045751634%
False positive rate 0.0%

63
True Positive rate: 73.0555555556%
Table 2: Results for HTTP Traffic
Figure 11: Pie chart result for HTTP traffic
Figure 72: ROC Curve for HTTP Traffic

64
From our evaluations results we can conclude that our models are capable of detecting malicious
attacks with low false positive rates, the key is the quality of dataset which affects the prediction
accuracy.
65
CHAPTER FIVE
CONCLUSIONS
5.1. Summary
APTs are sophisticated and difficult to detect because of their slow and low manner of operation,
yet certain patterns can be identified in their process. The best way to achieve detection is by
examining communication patterns across many nodes over an extended period. Thus, correlation
of recent and historical events of network traffic logged data from diverse data sources can help
detect APT malware activities, as well reducing false positives. Considering the volume of data
that is required to be analyzed, both structured and unstructured data, Big data analytics is the only
solution to the problem. Big data analytics is a good technique to analyze such volume of network
traffic datasets because it provides a distributed environment. From the result obtained from the
analysis, we conclude that Big data analytics can significantly enhance the detection of APT
command and control channels.
5.2. Challenges
We faced the following challenges in the course of this work:
1. Unavailability of dataset: Getting a good data set was a big challenge to this work.
2. Computing environment: We needed a distributed environment for the training and testing
of the data set.

66
5.3. Future Work
We suggest that the analysis should be carried out with real APT malware, real life dataset and
real-time detection with the trained model.
67
REFERENCES
1. Xiaohua Yan; Joy Ying Zhang; (2013), Early Detection of Cyber Security Threats
using Structured Behavior Modeling.
2. Cloud Security Alliance; (September 2013); Big Data Analytics for Security
Intelligence.
3. Randy Franklin Smith; Brook Watson;(2013), 3 Big data security analytics
techniques you can apply now to catch advanced persistent threats
4. Judith S. Hurwitz, Alan F. Nugent, Fern Halper, PhD, Marcia A. Kaufman;(2013),
Big data for dummies.
5. Ping Chen, Lieven Desmet, and Christophe Huygens ;( 2013), A study on Advanced
Persistent Threats.
6. What is advanced persistent threat (APT)? Definition from whatis.com
http://searchsecurity.techtarget.com/definition/advanced-persistent-threat-APT
7. Intrusion detection system - Wikipedia, the free encyclopedia.htm
8. A b c d e f g h I j k Nitin.; Mattord, Verma (2008). Principles of Information Security.
Course Technology. pp. 290–301. ISBN 978-1-4239-0177-8
9. Eric Hutchins, Michael Clopper, and Rohan Amin. ;(2011). Intelligence-Driven
Computer Network Defense Informed by Analysis of Adversary Campaigns and
Intrusion Kill Chains. In 6th Annual Conference on Information Warfare and
Security.
10. Bhagyashree S Jawariya; (2014). Detecting Unknown Attacks Using Big Data
Analysis

68
11. Labrinidis, A., & Jagadish, H. V. ; (2012). Challenges and opportunities with big
data. Proceedings of the VLDB Endowment, 5(12), 2032–2033.
12. Paul Giura, Wei Wang, AT&T Security Research Center, New York, NY; (2012).
Using Large Scale Distributed Computing to Unveil Advanced Persistent Threats
13. http://searchsecurity.techtarget.com/definition/social-engineering.
14. Verizon;(July 2010).2010 Data Breach Investigations Report
15. P. Ning, Y. Cui and D. Reeves, "Constructing attack scenarios through correlation of
intrusion alerts," in Proceedings of the 9th ACM conference on Computer and
communications security, New York, 2002.
16. S. Cheung, U. Lindqvist and M. Fong, "Modeling Multistep Cyber Attacks for Scenario
Recognition," in Proceedings of the DARPA Information Survivability Conference and
Exposition, Washington, 2003.
17. J.A. de Vries; (July 5, 2012). Towards a roadmap for development of intelligent data
analysis based cyber-attack detection systems.
18. Dr. Sam Musa. ; (March 2014). "Advanced Persistent Threat - APT"
https://www.academia.edu/6309905/Advanced_Persistent_Threat_-_APT.
19. Command Five Pty Ltd.; (Retrieved 2011-03-31). Are you being targeted by an
Advanced Persistent Threat?
20. Command Five Pty Ltd.; (Retrieved 2011-03-31). The changing threat
environment ...
21. "What's an APT? A Brief Definition". Damballa. January 20, 2010. Archived from the
original on 11 February 2010. Retrieved 2010-01-20.
22. Malware - Wikipedia, the free encyclopedia.htm
69
23. Peter Gregory ;( 2013). Advanced Persistent Threat Protection For Dummies®,
Seculert Special Edition Published by John Wiley & Sons, Inc. 2013 by John Wiley
& Sons, Inc., Hoboken, New Jersey
24. http://www.webdevelopersnotes.com/articles/ebay_phishing_email1.html
25. https://en.wikipedia.org/wiki/Antivirus_software
26. https://antivirus.comodo.com/how-antivirus-software-works.php
27. http://searchsecurity.techtarget.com/tip/How-antivirus-software-works-Virus-
detection-techniques
28. http://searchsecurity.techtarget.com/definition/webfilter
29. What is spam filter? - Definition from whatis.com
30. Nikos Virvilis, CISA, CISSP, GPEN, Oscar Serrano, CISA, CISM, CISSP, Luc
Dandurand; (2014). Big Data Analytics for Sophisticated Attack Detection Isaca
Journal Volume 3, 2014
31. Datamining and machine learning in cybersecurity. Page 86
32. Command & Control: Understanding, denying, detecting QinetiQ Ltd 2014
33. https://nigesecurityguy.wordpress.com/2014/04/03/apt-detection-indicators-part-3/
34. U. Bayer, I. Habibi, D. Balzarotti, E. Kirda, and C. Kruegel. A view on current
malware behaviors. In Proceedings of the 2nd USENIX conference on Large-scale
exploits and emergent threats: botnets, spyware, worms, and more, pages8–8.
USENIX Association, 2009.
35. F. Giroire, J. Chandrashekar, N. Taft, E. Schooler, and D. Papagiannaki. Exploiting
temporal persistence to detect covert botnet channels. In Recent Advances in
Intrusion Detection, pages326–345. Springer, 2009.

70
36. R. Kazanciyan. The state of the hack. Tampa Bay ISSA InfraGard, December
2010
37. Martin warmer. Detection of web based command and control channels. Universite
Twente.
38. https://en.wikipedia.org/wiki/Big data
39. http://searchbusinessanalytics.techtarget.com/definition/big-data-analytics
40. http://www.tutorialspoint.com/hadoop/index.htm
41. http://statistics.berkeley.edu/computing/spark
42. https://spark.apache.org/
43. https://en.wikipedia.org/wiki/Advanced_persistent_threat
44. Nick Pentreath. Machine Learning with Spark. February 2015.
45. http://www.sas.com/en_id/insights/analytics/machine-learning.html
46. http://spark.apache.org/docs/latest/ml-features.html#standardscaler
47. http://www.rtcmagazine.com/articles/view/102912
48. https://citizennet.com/blog/2012/11/10/random-forests-ensembles-and-performance-
metrics
49. http://gim.unmc.edu/dxtests/roc2.htm
50. https://blog.cloudera.com/blog/2016/02/how-to-predict-telco-churn-with-apache-
spark-mllib/
51. Yuval Sinay - CISSP, MVP Enterprise Security DC9723: Common Techniques To
Identify Advanced Persistent Threat (APT) 20.05.201 Meeting
52. Information Security Center of excellence: University of New Brunswick.
http://www.unb.ca/research/iscx/dataset/iscx-IDS-dataset.html

71
53. https://spark.apache.org/docs/latest/mllib-ensembles.html
54. http://www.sebastianraschka.com/Articles/2014_intro_supervised_learning.html
55. http://www.skytree.net/machine-learning/why-do-machine-learning-big-data/