
A Current State Assessment-Finalv2 384036 7
238
Engagement: 330002080 — Final Version © 2012 Gartner, Inc. and/or its affiliates. All rights reserved. Gartner is a registered trademar k of Gartner, Inc. or its affiliates. Information, Communications and Technology (ICT) Strategy Technical Advisory Services State of Michigan Department of Technology, Management and Budget Prepared for Deliverab le A — Current State Assessment and Maturity Analysis 20 January 2012
-
Upload
daniel-wood -
Category
Documents
-
view
220 -
download
0
Transcript of A Current State Assessment-Finalv2 384036 7

8/9/2019 A Current State Assessment-Finalv2 384036 7
http://slidepdf.com/reader/full/a-current-state-assessment-finalv2-384036-7 1/238
Engagement: 330002080 — Final Version
© 2012 Gartner, Inc. and/or its affiliates. All rights reserved.Gartner is a registered trademark of Gartner, Inc. or its affiliates.
Information, Communications and Technology (ICT) Strategy Technical Advisory Services
State of MichiganDepartment of Technology, Management and Budget
Prepared for Deliverable A — Current State Assessmentand Maturity Analysis
20 January 2012

8/9/2019 A Current State Assessment-Finalv2 384036 7
http://slidepdf.com/reader/full/a-current-state-assessment-finalv2-384036-7 2/238
1
Engagement: 330002080 — Final Version
© 2012 Gartner, Inc. and/or its affiliates. All rights reserved.Gartner is a registered trademark of Gartner, Inc. or its affiliates.
Table of Contents
■ Executive Summary
■ Current State Assessment and Maturity Analysis Approach
■ Current State Assessment and Maturity Analysis
– CIO — Business Alignment and Effectiveness
– CIO — Operations Management
– Applications
– Program and Portfolio Management
– Business Intelligence and Performance Management
– Enterprise Architecture
– Infrastructure and Operations
– IT Sourcing and Vendor Management
– Security and Risk Management

8/9/2019 A Current State Assessment-Finalv2 384036 7
http://slidepdf.com/reader/full/a-current-state-assessment-finalv2-384036-7 3/238
2
Engagement: 330002080 — Final Version
© 2012 Gartner, Inc. and/or its affiliates. All rights reserved.Gartner is a registered trademark of Gartner, Inc. or its affiliates.
Executive Summary

8/9/2019 A Current State Assessment-Finalv2 384036 7
http://slidepdf.com/reader/full/a-current-state-assessment-finalv2-384036-7 4/238
3
Engagement: 330002080 — Final Version
© 2012 Gartner, Inc. and/or its affiliates. All rights reserved.Gartner is a registered trademark of Gartner, Inc. or its affiliates.
Executive SummaryBackground and Overview
■ For the State of Michigan (SOM), Information, Communications and Technology (ICT) is a pivotal
area in the transformation of State operations, as well as for the State itself. As such, the Stateseeks to ensure alignment of its ICT assets, business model, operations and strategy with currentand future needs. To this end, the State engaged Gartner to review, assess, evaluate and makerecommendations for improvement. This engagement is in light of the anticipated opportunities andneeds of Michigan’s citizens and businesses, the corresponding Executive Office goals, and relevantactions planned across agencies and programs statewide.
■ Michigan, along with other states, is faced with new challenges and opportunities that call for
revisiting the expectations about government goals, policies, strategies, operations andperformance, and the role that ICT plays in enabling and driving government functions and services.State organizations and jurisdictions have found that they cannot avoid sometimes radical changeand innovation. They cannot avoid risk by standing still or doing nothing, as inaction entails as muchor more risk than action.

8/9/2019 A Current State Assessment-Finalv2 384036 7
http://slidepdf.com/reader/full/a-current-state-assessment-finalv2-384036-7 5/238
4
Engagement: 330002080 — Final Version
© 2012 Gartner, Inc. and/or its affiliates. All rights reserved.Gartner is a registered trademark of Gartner, Inc. or its affiliates.
Executive SummaryBackground and Overview (continued)
■ The State seeks to maximize its assets, enhance shared services and cross-boundary partnerships,
reduce the cost of operations, and improve customer service over the short and long run.Specifically, the intended outcomes of this initiative are to:
1. Improve customer service;
2. Implement a successful, sustainable and innovative governance model;
3. Reduce Michigan’s cost of procuring, implementing, operating, upgrading and replacing ICT infrastructureproducts, applications and services;
4. Increase attraction, retention and development of the SOM ICT workforce;
5. Enable cost savings and better government through shared solutions and cross-boundary partnerships; and
6. Implement best-practice ICT solutions and technologies.

8/9/2019 A Current State Assessment-Finalv2 384036 7
http://slidepdf.com/reader/full/a-current-state-assessment-finalv2-384036-7 6/238
5
Engagement: 330002080 — Final Version
© 2012 Gartner, Inc. and/or its affiliates. All rights reserved.Gartner is a registered trademark of Gartner, Inc. or its affiliates.
Executive SummaryBackground and Overview (continued)
■ The State of Michigan partnered with Gartner to ensure alignment of its ICT assets, business model,
operations and strategy with current and future needs.
■ In order to expeditiously gather information on the current state, Gartner executed six major threadsof activity to obtain data about the current environment:
– Series of interviews with each State of Michigan agency, representative counties, the DTMB liaisons who interactwith customers (i.e., IOs, CSDs) and the various DTMB teams that provide services to those customers.
– Series of interviews with DTMB leadership executives and a review of DTMB’s strategic plan and statewide goals.
– Infrastructure Benchmark to determine cost levels and personnel productivity of providing infrastructure servicesin comparison to peer organizations.
– Applications Benchmark to understand cost levels and personnel productivity of supporting existing end-userapplications in comparison to peer organizations.
– Skills Assessment to determine the skills and competencies that DTMB personnel currently possess vis-à-vis theexpected level of qualifications relative to their role and seniority within the DTMB organization.
– IT Business Effectiveness Survey to understand customer satisfaction with the services DTMB currently provides,as well as DTMB alignment with its customers’ priorities and strategic objectives.

8/9/2019 A Current State Assessment-Finalv2 384036 7
http://slidepdf.com/reader/full/a-current-state-assessment-finalv2-384036-7 7/238
6
Engagement: 330002080 — Final Version
© 2012 Gartner, Inc. and/or its affiliates. All rights reserved.Gartner is a registered trademark of Gartner, Inc. or its affiliates.
Executive SummaryBackground and Overview (continued)
■ Gartner assimilated the information gathered to render a maturity level for each of the nine role
perspectives (e.g., CIO: Business Alignment and Effectiveness, Applications, etc.) across eachdimension of the TOPSS model: technology, organization, process, strategy and service levelexhibited in the graphic below.
– The maturity scale is developed on an idealized basis, meaning that a Level 5 is the absolute best practice in theindustry for that activity. Relatively few organizations make the investment to become Level 5 in all the areas,because it would be prohibitively expensive to do so without a commensurate return on investment.
– Target states were determined using a combination of feedback from DTMB customers’ stated needs, and DTMBleadership’s stated goal of becoming a best-in-class service provider. If achieved, the target states chosen willvery highly likely exceed the performance of the vast majority of (if not all) public sector organizations.

8/9/2019 A Current State Assessment-Finalv2 384036 7
http://slidepdf.com/reader/full/a-current-state-assessment-finalv2-384036-7 8/238
7
Engagement: 330002080 — Final Version
© 2012 Gartner, Inc. and/or its affiliates. All rights reserved.Gartner is a registered trademark of Gartner, Inc. or its affiliates.
Executive SummaryPrimary Themes
The Current State Assessment revealed a number of primary themes that span the nine IT roles. The
themes are listed below and are substantiated and described in greater detail in the subsequent pages:
■ Customer Alignment and Relationship Management is Challenged — The introduction of theInformation Officer (IO) model to provide dedicated liaisons to agencies is a positive development,but DTMB must significantly improve customer alignment and relationship management to addresscustomer dissatisfaction.
■ Unclear Business Value of DTMB Services — Agencies understand the technical importance ofDTMB support, but DTMB does not clearly communicate the business value of it services tocustomers.
■ Cost Control and Efficiency Opportunities Exist — Although DTMB is established as a cost-recovery organization and has standardized budgeting and financial processes in place, DTMBneeds to move to a portfolio management approach for DTMB assets to more effectively managecosts. DTMB exhibits characteristics that indicate opportunities for additional operational efficiencies.
■ Innovation Successes Lay Foundation for Future Improvements — DTMB has been nationally
recognized for several past innovations, but it must enhance its understanding of customer businessneeds and apply that understanding to future innovative efforts in a consistent, formalized manner.
■ Skilled, But Sub Optimally Utilized Workforce — DTMB must address skills gaps in specificcategories, misaligned titles and duties, and create formal accountability within DTMB.

8/9/2019 A Current State Assessment-Finalv2 384036 7
http://slidepdf.com/reader/full/a-current-state-assessment-finalv2-384036-7 9/238
8
Engagement: 330002080 — Final Version
© 2012 Gartner, Inc. and/or its affiliates. All rights reserved.Gartner is a registered trademark of Gartner, Inc. or its affiliates.
Executive SummaryPrimary Themes (continued)
■ Procurement and Vendor Management Issues Impact Efficiency — Many baseline procurement
organizational/functional units are not established, leading to inefficiencies and delays; vendormanagement is not currently practiced by DTMB.
■ continued Improvement of Strong Management and Protection of DTMB Assets — DTMB isnationally-renowned for cybersecurity and data protection and touts effective operational capabilities,but can strive to keep improving. For example, DTMB can increase focus on privacy managementand data security management to more effectively articulate rules and regulations that govern datasharing across state and federal agencies.

8/9/2019 A Current State Assessment-Finalv2 384036 7
http://slidepdf.com/reader/full/a-current-state-assessment-finalv2-384036-7 10/238
9
Engagement: 330002080 — Final Version
© 2012 Gartner, Inc. and/or its affiliates. All rights reserved.Gartner is a registered trademark of Gartner, Inc. or its affiliates.
Executive SummaryKey Findings By Theme
Customer Alignment and Relationship Management is Challenged
■ DTMB is not viewed by many of its customer agencies as a customer-service-oriented organizationand may be failing to incorporate business needs into the IT strategy.
– Bottom Line: Only 16% of agencies that participated in the ITBE survey reported that they viewed DTMB as astrategic partner that is fully aligned with their agency strategy and an integral part of their business.
■ Partnership opportunities with local government agencies could be greatly improved.
– Bottom Line: Local governments are finding DTMB services prohibitively expensive (e.g., 800 MHz dispatchsystem) as a result of offerings not meeting their business needs, and express that DTMB does not effectively
partner with them to understand customer requirements.
Unclear Business Value of DTMB Services
■ Metrics and Service Level Agreements (SLAs) provided to DTMB customers are not descriptive anddo not meet customer needs; many customers are unaware of SLAs.
– Bottom Line: DTMB needs to improve SLAs to demonstrate value and meet customer needs. Furthermore, DTMBneeds to provide consistent metrics on SLA performance and communicate those with customers.
■ Overall, Infrastructure and Operations (I&O) maturity is high, but is hampered by technology takingprecedence over business alignment. Each technology platform has a unique service catalog.
– Bottom Line: Strong technology alignment and multiple service catalogs make it more difficult to workcollaboratively across Infrastructure Services in a coordinated and organized manner.

8/9/2019 A Current State Assessment-Finalv2 384036 7
http://slidepdf.com/reader/full/a-current-state-assessment-finalv2-384036-7 11/238
10
Engagement: 330002080 — Final Version
© 2012 Gartner, Inc. and/or its affiliates. All rights reserved.Gartner is a registered trademark of Gartner, Inc. or its affiliates.
Executive SummaryKey Findings By Theme (continued)
Cost Control and Efficiency Opportunities Exist
■ The DTMB annual budget is not composed of specific initiatives and projects.
– Bottom Line: This prevents DTMB from achieving the granularity it needs for scheduling, resource allocation, andprioritization of activities. Without this information, DTMB cannot work with the agencies to prioritize resources ormanage expectations, which results in customer frustration.
■ DTMB has limited enterprise insight into demand/resource management and benefits realization.
– Bottom Line: DTMB is unable to effectively perform portfolio and investment management and maximizeenterprise value.
■ Infrastructure Services is a consolidated and centralized IT infrastructure organization that is workingon adopting and implementing industry-leading trends.
– Bottom Line: Consolidation and centralization lead to optimization and standardization. Efficiencies fromconsolidation places the State of Michigan better than the peer average for I&O costs.
■ There are numerous programming languages and development tools in place that are notstandardized across development teams.
– Bottom Line: Platform complexity is driving higher costs and the need for more programmers.
■ Application Portfolio Management (APM) is still in its infancy, which limits the ability to proactivelyretire older technology platforms.
– Bottom Line: The lack of APM results in reactive, tactical decisions for applications on older platforms that cannotbe modified in order to avoid very difficult-to-resolve outages.

8/9/2019 A Current State Assessment-Finalv2 384036 7
http://slidepdf.com/reader/full/a-current-state-assessment-finalv2-384036-7 12/238
11
Engagement: 330002080 — Final Version
© 2012 Gartner, Inc. and/or its affiliates. All rights reserved.Gartner is a registered trademark of Gartner, Inc. or its affiliates.
Executive SummaryKey Findings By Theme (continued)
Innovation Successes Lay Foundation for Future Improvements
■ Enterprise Architecture (EA) is viewed as a burdensome process focused on technical compliance.Key EA domains of Business Architecture, Information/Data Architecture, Integration Architectureand Solution Architecture are not managed at this time.
– Bottom Line: Not managing key EA functions is an area of high risk, especially considering the federated nature ofthe Agencies. It is also an area of discontent for customers, who desire more solution design earlier in therequirements definition process.
■ No centralized Business Intelligence (BI) center of excellence (COE) exists to coordinate BI and
corporate performance management (CPM) activities across DTMB. – Bottom Line: Performance Management is not connected to BI, which is not connected to Enterprise Information
Management and Master Data Management, rendering citizen-centric government very difficult.
Skilled, But Sub Optimally Organized and Utilized Workforce
■ Varying degrees of project management skill exist within various IO units.
– Bottom Line: Varying skill levels of project managers result in wide gaps in customer satisfaction. Additionally,agency customers often view DTMB as unable to deliver large or innovative projects on-time and on-budget.
■ The organizational structure of DTMB limits the authority, oversight and executive reportingresponsibility of the ePMO.
– Bottom Line: The ePMO is severely limited in its ability to effectively perform enterprise program and portfoliomanagement because it reports to a single IO in Agency Services. For example, although DTMB hasstandardized on the SUITE methodology for project management, it has been inconsistently adopted.

8/9/2019 A Current State Assessment-Finalv2 384036 7
http://slidepdf.com/reader/full/a-current-state-assessment-finalv2-384036-7 13/238
12
Engagement: 330002080 — Final Version
© 2012 Gartner, Inc. and/or its affiliates. All rights reserved.Gartner is a registered trademark of Gartner, Inc. or its affiliates.
Executive SummaryKey Findings By Theme (continued)
Procurement and Vendor Management Issues Impact Efficiency
■ Many baseline procurement organizational functions found in peers are missing — the procurementorganizational structure seems unique to Michigan.
– Bottom Line: The dispersion of procurement functions across organizational components adds complexity, whichresults in bottlenecks that lengthen the procurement process.
■ The sourcing strategy is not integrated with the strategic technology planning, which results in delaysand divergent priorities on what to bid and when.
– Bottom Line: Lack of integration with strategic planning results in procurement being viewed as an inhibitor, anddiminishes the DTMB’s ability to enable strategic sourcing.
Continued Improvement of Strong Management and Protection of DTMB Assets
■ DTMB is using the right tools, supports a mature architecture, and is involved in all the traditionalsecurity processes.
– Bottom Line: This is a good foundation to improve security management processes.
■ DTMB lacks a strong focus on privacy management and data security management.
– Bottom Line: Privacy management is an increasingly important area in the industry. Lack of privacy managementincreases overall risk to the State.
■ DTMB is not leveraging all capabilities of tools, or protecting the entire infrastructure consistently.
– Bottom Line: Advanced threats through desktop applications can cause security breaches.

8/9/2019 A Current State Assessment-Finalv2 384036 7
http://slidepdf.com/reader/full/a-current-state-assessment-finalv2-384036-7 14/238
13
Engagement: 330002080 — Final Version
© 2012 Gartner, Inc. and/or its affiliates. All rights reserved.Gartner is a registered trademark of Gartner, Inc. or its affiliates.
Executive SummaryInfrastructure Benchmark Key Takeaways
■ DTMB Infrastructure Services generally performs at approximately the average vs. peers in terms ofcost efficiency and staff productivity, which is considered good, since DTMB has not performed thiskind of benchmark in the past. Gartner would generally expect a new benchmarking client to performsomewhere near the 75th percentile. A 75th percentile ranking is paramount to a spending cost in thetop 25% of comparable peers).
■ The State of Michigan spends $15M less than the peer group for infrastructure. Spending is lowerthan the peer group in all functional areas. Drivers of the variance include lower spending inhardware, personnel, transmission and occupancy.
■ Michigan spends more than the peer group in the software category for Help Desk, Unix, Internetand Storage. Wintel server software is lower than the peer group.
■ Total staffing is lower than the peer group, with Michigan at 616 and the peer group at 626.
– Michigan utilizes fewer FTEs in some areas, such as Client and Peripheral, Unix and Data Networking, but moreFTEs than the peer group in Wintel and Voice.
– The cost per FTE is lower at Michigan compared to the peer group.
– Michigan and the peer group utilize a similar number of external staff resources. Michigan utilizes morecontractors than the peer group, at 40 vs. 26.4, but the peer group uses more outsourcing, with 28 FTEs.
– Per-capita spending on contractors is generally higher at Michigan, with the exception of the Help Desk andStorage.
Bottom Line: Overall DTMB spending on infrastructure is slightly lower than average ($15M) in comparison topeers, and overall cost efficiency and staff productivity is in line with peers, despite slightly lower staffing.However, DTMB spends more on certain software categories (Help Desk, Unix, Internet Storage) than peers.
8/9/2019 A Current State Assessment-Finalv2 384036 7
http://slidepdf.com/reader/full/a-current-state-assessment-finalv2-384036-7 15/238
14
Engagement: 330002080 — Final Version
© 2012 Gartner, Inc. and/or its affiliates. All rights reserved.Gartner is a registered trademark of Gartner, Inc. or its affiliates.
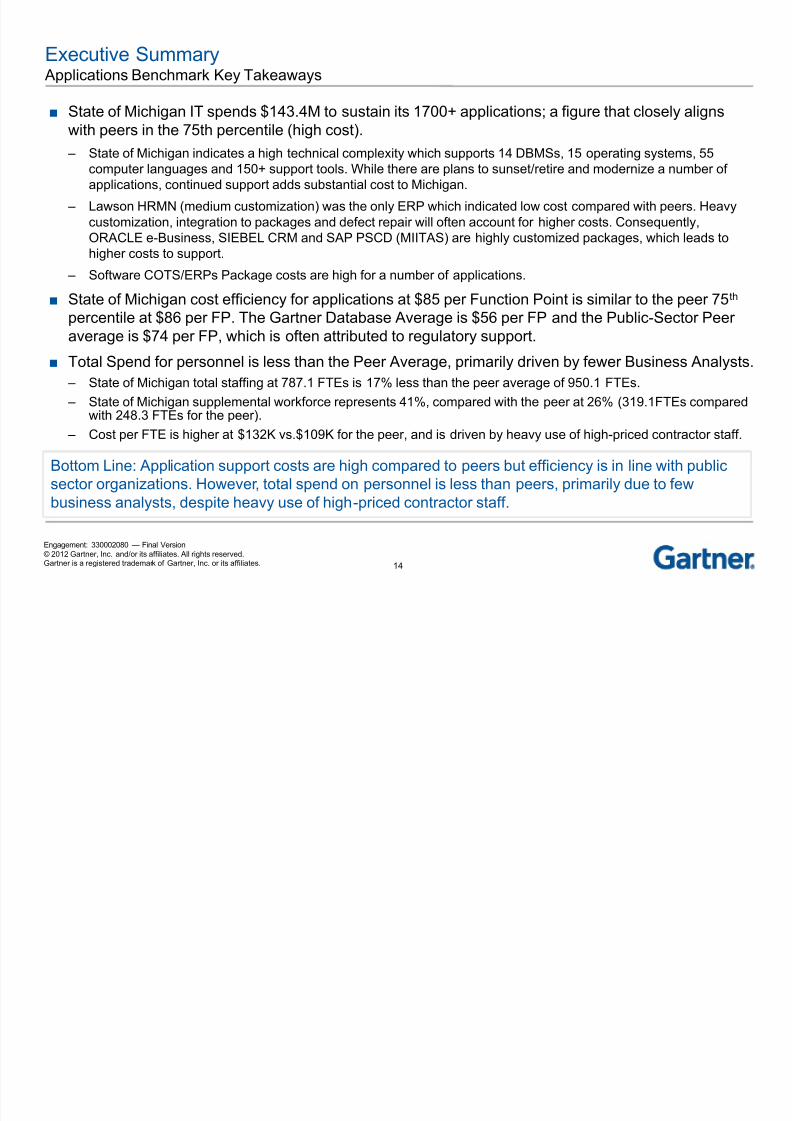
Executive Summary Applications Benchmark Key Takeaways
■ State of Michigan IT spends $143.4M to sustain its 1700+ applications; a figure that closely alignswith peers in the 75th percentile (high cost).
– State of Michigan indicates a high technical complexity which supports 14 DBMSs, 15 operating systems, 55computer languages and 150+ support tools. While there are plans to sunset/retire and modernize a number ofapplications, continued support adds substantial cost to Michigan.
– Lawson HRMN (medium customization) was the only ERP which indicated low cost compared with peers. Heavycustomization, integration to packages and defect repair will often account for higher costs. Consequently,ORACLE e-Business, SIEBEL CRM and SAP PSCD (MIITAS) are highly customized packages, which leads tohigher costs to support.
– Software COTS/ERPs Package costs are high for a number of applications.■ State of Michigan cost efficiency for applications at $85 per Function Point is similar to the peer 75th
percentile at $86 per FP. The Gartner Database Average is $56 per FP and the Public-Sector Peeraverage is $74 per FP, which is often attributed to regulatory support.
■ Total Spend for personnel is less than the Peer Average, primarily driven by fewer Business Analysts.
– State of Michigan total staffing at 787.1 FTEs is 17% less than the peer average of 950.1 FTEs.
– State of Michigan supplemental workforce represents 41%, compared with the peer at 26% (319.1FTEs compared
with 248.3 FTEs for the peer). – Cost per FTE is higher at $132K vs.$109K for the peer, and is driven by heavy use of high-priced contractor staff.
Bottom Line: Application support costs are high compared to peers but efficiency is in line with publicsector organizations. However, total spend on personnel is less than peers, primarily due to fewbusiness analysts, despite heavy use of high-priced contractor staff.

8/9/2019 A Current State Assessment-Finalv2 384036 7
http://slidepdf.com/reader/full/a-current-state-assessment-finalv2-384036-7 16/238
15
Engagement: 330002080 — Final Version
© 2012 Gartner, Inc. and/or its affiliates. All rights reserved.Gartner is a registered trademark of Gartner, Inc. or its affiliates.
Executive SummarySkills Assessment Key Takeaways
■ With 38% of critical skills at ‘Advanced’ or ‘Master’ levels, DTMB indicates an above average overallskill maturity level. As a rule of thumb an IT organization should have 30% of critical skills at theselevels.
■ IT staff is stronger in competencies associated with performing IT work and weaker in competenciesassociated with business alignment and customer interaction.
■ Current DTMB titles are not meaningful and job titles do not describe what people do.
■ DTMB has lower staffing levels in Client and Peripheral Support, Voice Network, and Data Networkas compared to Gartner’s IT Key Metrics Data for State and Local Governments.
■ There is no clear explanation of why Desktop Support numbers are lower in DTMB survey. Peoplemay have misclassified themselves or the people who did not take survey tended to be desktopsupport personnel.
■ DTMB shows the highest level of capabilities in Desktop Support and most infrastructure jobfamilies. Individuals in Relationship Management and Project Management show lowest capabilityrelative to other job families.
■ There exists significant “bench strength” across DTMB. Individuals in different job families havemany skills needed to perform other roles. DTMB should identify these individuals as part of theirsourcing strategy and succession planning.
Bottom Line: In aggregate, DTMB exhibits high skill levels but is lacking in some key areas such asrelationship management, and job titles do not align with actual duties. In addition, there is significant “benchstrength” within DTMB that can be tapped to fill key roles.

8/9/2019 A Current State Assessment-Finalv2 384036 7
http://slidepdf.com/reader/full/a-current-state-assessment-finalv2-384036-7 17/238
16
Engagement: 330002080 — Final Version
© 2012 Gartner, Inc. and/or its affiliates. All rights reserved.Gartner is a registered trademark of Gartner, Inc. or its affiliates.
Executive SummaryIT Business Effectiveness Survey Key Takeaways
■ There are several criteria of high importance to customers that, if
addressed, could provide significantly increased alignment andeffectiveness.
– Bottom Line: Cost, Service Quality, System Integration areprimary targets for improvement.
■ Key areas such as Project Management, Contract Managementand Leadership/Innovation were rated as lowest importance bycustomers.
Customer Quote: “Alot of SLA performancereports will have N/A inplace of an actual metricsreport. That isunacceptable.”
– Bottom Line: Some core DTMB functions are not viewed as valuable by customers, but arecritical to delivering high-quality, cost-effective services to customers.
■ While only 16% of customers viewed the IT relationship as a partnership, and more than 2/3 are notaware of IT’s goals and strategies, customers feel their dependence on IT will increase in future.
– Bottom Line: DTMB’s strategic goals are either misaligned to or misunderstood by customeragencies, resulting in a large opportunity for DTMB to improve strategic alignment.
■ Approximately 71% of customers said they have SLAs, but only 66% of that group know what theyare, and only 10% say they meet needs.
– Bottom Line: Roughly 7% of DTMB customers believe that current SLAs meet their needs.

8/9/2019 A Current State Assessment-Finalv2 384036 7
http://slidepdf.com/reader/full/a-current-state-assessment-finalv2-384036-7 18/238
17
Engagement: 330002080 — Final Version
© 2012 Gartner, Inc. and/or its affiliates. All rights reserved.Gartner is a registered trademark of Gartner, Inc. or its affiliates.
Current State Assessment and Maturity Analysis Approach

8/9/2019 A Current State Assessment-Finalv2 384036 7
http://slidepdf.com/reader/full/a-current-state-assessment-finalv2-384036-7 19/238
18
Engagement: 330002080 — Final Version
© 2012 Gartner, Inc. and/or its affiliates. All rights reserved.Gartner is a registered trademark of Gartner, Inc. or its affiliates.
Current State Assessment and Maturity Analysis Approach
RFP Section 1.301— Project Plan
and Management
RFP Section 1.104 A, B, C and D —
Data Collection, Assessments and Gap AnalysisRFP Section 1.104 G
—Final Report
RFP Section 1.104 E and F —Recommendations
and Road Map
Project Planningand Orientation
Project Kickoff
Data CollectionPlanning andTools Overview
Finalize ProjectWork Plan
Finalize ProjectCommunicationand
Administrative Activities
Develop FinalReport
DevelopRecommendationsSummaryPresentation
DevelopCommunicationsPlan
Develop ChangeManagement Plan
ConductExecutivePresentation
Define viable business, services andtechnology improvement scenarios
Identify potential risks and mitigationstrategies
Analyze improvement scenarios againstMI requirements to determine viability
Identify shared-services opportunities
Identify Business, Service and
Technology Opportunities Initiate data-collection instruments
(surveys, BM templates,documents)
Conduct business and ITinterviews
Understand MI ICT’s vision, andservice and operating models
Document Current-StateEnvironment Report
Understand Current IT Services
Integrate comprehensive analysis andassessments (benchmark, services,etc.)
Evaluate IT capabilities against peersutilizing benchmarking analysis forTechnology, People and Processes,and Capabilities
Evaluate IT capabilities to meet State
business direction, vision and goals
Assess Maturity and Gap Analysis
Review current and future ICTneeds and priorities based oncurrent-state evaluation andanalysis of ICT strategies and ITleaders’ future vision
Aggregate and summarizebusiness and technology
interviews into business needs Develop State Business Needs
Report
Identify Business Needs
Develop Business Modeland Technology Solutionsrecommendations
– Organization Model
– Strategies for enterpriseshared services andintra-governmentalcollaboration
– Strategies for
technology services
– Areas of innovation
Expand recommendationsand provide additionaldetail and due diligence
Review recommendationswith Governor’s office,DTMB and IT advisors
Develop implementationstrategy and plan
Develop Recommendations
and Road Map
RFP Section 1.104 A and B— Evaluate Current State
and Business Needs
RFP Section 1.104 C and D —Opportunities and Maturity and
Gaps Analysis
Deliverable C: Identification ofBusiness, Services and TechnologyOpportunities
Deliverable D: Maturity and Gap Analysis
Final Project Plan
Project StatusReports (ongoing)
Deliverable A: Evaluation ofCurrent-State Environment
Deliverable B: Evaluation of theState’s Business Needs
Deliverable G:Final Report andExecutivePresentation
Deliverable E:Recommendations forBusiness Model Alternatives
Deliverable F: Road Map toImplementation
C r i t i c a l
D e l i v e r a b l e s

8/9/2019 A Current State Assessment-Finalv2 384036 7
http://slidepdf.com/reader/full/a-current-state-assessment-finalv2-384036-7 20/238
19
Engagement: 330002080 — Final Version
© 2012 Gartner, Inc. and/or its affiliates. All rights reserved.Gartner is a registered trademark of Gartner, Inc. or its affiliates.
Current State Assessment and Maturity Analysis Approach Gartner’s Integrated IT Assessment Framework
■ Each of the nine horizontal roles was reviewed across Technology, Organization, Process Strategy
and Service Levels from a current- and target-state maturity perspective, highlighting key State ofMichigan details, industry trends and best practices.
■ The maturity scales used for these assessments use standard criteria that incorporate bestpractices. These maturity scales are industry-agnostic and place no value judgement on the ITservices being delivered.

8/9/2019 A Current State Assessment-Finalv2 384036 7
http://slidepdf.com/reader/full/a-current-state-assessment-finalv2-384036-7 21/238
20
Engagement: 330002080 — Final Version
© 2012 Gartner, Inc. and/or its affiliates. All rights reserved.Gartner is a registered trademark of Gartner, Inc. or its affiliates.
Current State Assessment and Maturity Analysis Approach Gartner’s Integrated IT Assessment Approach
■ Gartner applied a number of proven qualitative and quantitative tools and approaches to ensure a
thorough analysis of ICT that analyzes the State of Michigan from a qualitative and quantitativeperspective, where appropriate.
– Qualitative Aspects: Process maturity, customer perceptions, alignment with best practices, etc.
– Quantitative Aspects: Staffing, rates, spending, etc.
■ Using these tools and techniques, Gartner rendered a rating for each TOPSS element within each ITrole for the current state and the target state. Collectively, an overall score was assessed.
– For instance, if Enterprise Architecture received a 2 for Technology, 3 for Organization, 2 for Process, 2 forStrategy and 2 for Service Level, the overall maturity rating for Enterprise Architecture would be 2.
■ The maturity scale is developed on an idealized basis, meaning that a Level 5 is the absolute bestpractice in the industry for that activity. Relatively few organizations make the investment to becomeLevel 5 in all the areas, because it would be prohibitively expensive to do so without acommensurate payback.
■ Target states will be determined using a combination of feedback from DTMB customers’ statedneeds, and DTMB leadership’s stated goal of becoming a global, best-in-class service provider. Ifachieved, the target states chosen will very likely exceed the performance of the vast majority of (ifnot all) public-sector organizations.
■ The subsequent slides illustrate the individual maturity models for Technology, Organization,Process, Strategy and Service Level.

8/9/2019 A Current State Assessment-Finalv2 384036 7
http://slidepdf.com/reader/full/a-current-state-assessment-finalv2-384036-7 22/238
21
Engagement: 330002080 — Final Version
© 2012 Gartner, Inc. and/or its affiliates. All rights reserved.Gartner is a registered trademark of Gartner, Inc. or its affiliates.
Gartner TOPSS Maturity Model Technology
No or limited IT systems or
tools in place to support the
role. Common attributes,
where applicable to the IT role,
include:
■ Ineffective to no standards;■ Siloed IT domains;■ No consolidation;■ Ad hoc services;■ Limited to no metrics;■ Limited tool deployment and
usage.
IT systems and tools are
present to support the role;
however, there is no
coordination or
standardization across the
enterprise. Common
attributes, where applicable to
the IT role, include:
■ Ineffective systems andmoderate-to-complexworkarounds exist;
■ Key standards exist and are
enforced;■ Project/Program-specific
tools;■ Duplicative tools;■ Some technical metrics in
place;■ Reactive monitoring.
IT systems and tools are in
place to support the role, but
have been procured without
suitable alignment to user and
operational requirements.
Common attributes, where
applicable to the IT role,
include:
■ Ineffective systems andmoderate workarounds exist;
■ System have beensignificantly customized to
meet end-user needs;■ Policy-driven standards;■ Domain-centric management
tools;■ Pre-emptive management of
critical components;■ Operational management
toolset;■ Differentiated service-based
technology;■ Standardized refresh of IT
components.
IT support systems are in
place to support the IT role
across the enterprise and are
consistently used. Common
attributes, where applicable to
the IT role, include:
■ System procurement anddesign incorporated end-userand enterprise needs;
■ Systems have beenimplemented with a minimalamount of customization;
■ Systems integrated intoenterprise architecture;
■ Heavy virtualization;■ Metrics-driven performance;■ Service- and performance-
aligned architecture;■ Operations automation;■ Consolidated environment
(domain-level consolidation).
IT support systems are in
place and support the
enterprise's ability to improve
and optimize operational
performance. Common
attributes, where applicable to
the IT role, include:
■ System flexibility to adapt tochanging business andoperational needs withoutrequiring large levels ofcustomization;
■ Highly scalable and elasticarchitecture;
■ Practices innovation anddeploying new technology;
■ Dynamic resource allocation;■ Business service tools;■ Real-time enterprise;■ Technology Research and
Development.
1 — Ad Hoc 2 — Reactive 3 — Challenged 4 — Managed 5 — Optimized
8/9/2019 A Current State Assessment-Finalv2 384036 7
http://slidepdf.com/reader/full/a-current-state-assessment-finalv2-384036-7 23/238
22
Engagement: 330002080 — Final Version
© 2012 Gartner, Inc. and/or its affiliates. All rights reserved.Gartner is a registered trademark of Gartner, Inc. or its affiliates.
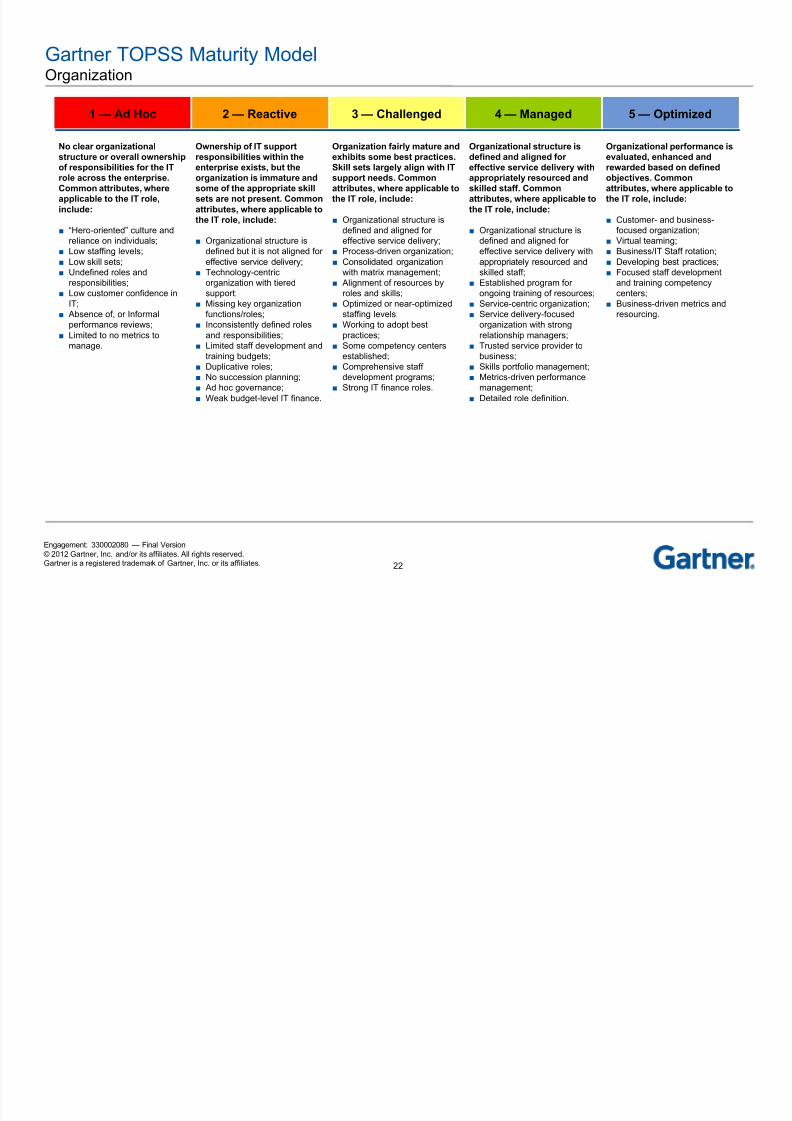
Gartner TOPSS Maturity Model Organization
No clear organizational
structure or overall ownership
of responsibilities for the IT
role across the enterprise.
Common attributes, where
applicable to the IT role,
include:
■ “Hero-oriented” culture andreliance on individuals;
■ Low staffing levels;■ Low skill sets;■ Undefined roles and
responsibilities;■ Low customer confidence in
IT;■ Absence of, or Informal
performance reviews;■ Limited to no metrics to
manage.
Ownership of IT support
responsibilities within the
enterprise exists, but the
organization is immature and
some of the appropriate skill
sets are not present. Common
attributes, where applicable to
the IT role, include:
■ Organizational structure isdefined but it is not aligned foreffective service delivery;
■ Technology-centric
organization with tieredsupport;
■ Missing key organizationfunctions/roles;
■ Inconsistently defined rolesand responsibilities;
■ Limited staff development andtraining budgets;
■ Duplicative roles;■ No succession planning;■ Ad hoc governance;■ Weak budget-level IT finance.
Organization fairly mature and
exhibits some best practices.
Skill sets largely align with IT
support needs. Common
attributes, where applicable to
the IT role, include:
■ Organizational structure isdefined and aligned foreffective service delivery;
■ Process-driven organization;■ Consolidated organization
with matrix management;
■ Alignment of resources byroles and skills;
■ Optimized or near-optimizedstaffing levels;
■ Working to adopt bestpractices;
■ Some competency centersestablished;
■ Comprehensive staffdevelopment programs;
■ Strong IT finance roles.
Organizational structure is
defined and aligned for
effective service delivery with
appropriately resourced and
skilled staff. Common
attributes, where applicable to
the IT role, include:
■ Organizational structure isdefined and aligned foreffective service delivery withappropriately resourced andskilled staff;
■ Established program forongoing training of resources;
■ Service-centric organization;■ Service delivery-focused
organization with strongrelationship managers;
■ Trusted service provider tobusiness;
■ Skills portfolio management;■ Metrics-driven performance
management;■ Detailed role definition.
Organizational performance is
evaluated, enhanced and
rewarded based on defined
objectives. Common
attributes, where applicable to
the IT role, include:
■ Customer- and business-focused organization;
■ Virtual teaming;■ Business/IT Staff rotation;■ Developing best practices;■ Focused staff development
and training competencycenters;
■ Business-driven metrics andresourcing.
1 — Ad Hoc 2 — Reactive 3 — Challenged 4 — Managed 5 — Optimized

8/9/2019 A Current State Assessment-Finalv2 384036 7
http://slidepdf.com/reader/full/a-current-state-assessment-finalv2-384036-7 24/238
23
Engagement: 330002080 — Final Version
© 2012 Gartner, Inc. and/or its affiliates. All rights reserved.Gartner is a registered trademark of Gartner, Inc. or its affiliates.
Gartner TOPSS Maturity Model Process
Processes to support the IT
role are non-existent, or ad
hoc. Common attributes,
where applicable to the IT role,
include:
■ Completely ad hoc processesthat are not documented,standardized, measured orcontinuously improved;
■ “Reinvention of the wheel,”duplicative efforts.
Processes to support the IT
role are largely documented,
but with limited
standardization, and are
inconsistent from location to
location, business unit to
business unit. Common
attributes, where applicable to
the IT role, include:
■ Processes are neither welldefined nor repeatable;
■ Some or most processes
documented;■ Processes are not
standardized or measured,and there is no method forimprovement.
Processes to support the IT
role are standardized and are
consistently applied to the
organization. Common
attributes include:
■ Some processes andprocedures may be manual orinefficient, and workaroundsare present;
■ No measurement or means ofimproving those processes.
Processes to support the IT
role are well defined and
managed consistently across
the enterprise. Common
attributes, where applicable to
the IT role, include:
■ Systems, methods andpractices are followed withappropriate control andgovernance;
■ Mechanisms are in placeacross the enterprise to
ensure compliance.
Processes to support the IT
role are mature and efficient.
Common attributes, where
applicable to the IT role,
include:
■ Processes, methods andsupporting systems areintegrated;
■ Control/governancemechanisms are in place tofeed a cycle of continualenhancement and evolution
across the enterprise.
1 — Ad Hoc 2 — Reactive 3 — Challenged 4 — Managed 5 — Optimized

8/9/2019 A Current State Assessment-Finalv2 384036 7
http://slidepdf.com/reader/full/a-current-state-assessment-finalv2-384036-7 25/238
24
Engagement: 330002080 — Final Version
© 2012 Gartner, Inc. and/or its affiliates. All rights reserved.Gartner is a registered trademark of Gartner, Inc. or its affiliates.
Gartner TOPSS Maturity Model Strategy
There is no defined strategy or
strategic planning function.
Common attributes, where
applicable to the IT role,
include:
■ Operational process and/ortechnology investmentdecisions are made locallyand independently as fundingis made available;
■ The IT role does not have itsown goals and objectives, and
simply reacts to most-vocal orinfluential customers (eitherinternal or external);
■ The IT role has no means ofunderstanding whether or notit is aligned with DTMB’soverall strategy.
Strategic planning occurs, but
it is not coordinated, not
clearly defined and does not
have measurable objectives.
Common attributes, where
applicable to the IT role,
include:
■ Strategy does not fullyintegrate with the widerorganization, nor is itcommunicated enterprise-wide.
■ The IT role has its own goalsand objectives, but there is noreal consideration for aligningit with the overall DTMBstrategy,
■ Some means ofunderstanding whether or notit is optimizing to its owndesired goals, but cannotdetermine if it is really workingtoward DTMB’s overallstrategy.
The strategy is defined and
communicated; however, it is
not effectively translated into
action. Common attributes,
where applicable to the IT role,
include:
■ Governance is inadequatelyestablished, allowing for theimplementation of the strategyto become fragmented andconfused across theenterprise;
■ The IT role has its own goalsand objectives that partiallyalign with DTMB’s overallstrategy;
■ Reactively determines howwell they are aligned toDTMB’s overall IT Strategy;
■ Ineffective or nascent processand/or governance in place toensure ongoing alignmentwith DTMB’s overall strategy,or ability to take correctiveaction when it is getting out of
alignment.
The strategy is clearly defined,
communicated and socialized
throughout the enterprise.
Common attributes, where
applicable to the IT role,
include:
■ An appropriate governancestructure is in place tooversee and ensure theexecution of the strategy;
■ The IT role has its own goalsand objectives that fully align
with DTMB’s overall strategy;■ Proactively determines how
well they are aligned toDTMB’s overall strategy;
■ Adequate process and/orgovernance in place to ensureongoing alignment withDTMB’s overall strategy, or totake corrective action when itis getting out of alignment.
Strategic planning is holistic,
continually reviewed, and the
strategy is updated to align
with business objectives.
Common attributes, where
applicable to the IT role,
include:
■ Strategy is clearly defined andcommunicated throughout theenterprise;
■ Effective governancestructure is in place to
oversee the execution of thestrategy;
■ The IT role has its own goalsand objectives that fully alignwith DTMB’s overall strategy;
■ Proactively determines howwell they are aligned toDTMB’s overall strategy;
■ Effective processes and/orgovernance in place to ensureongoing alignment withDTMB’s overall IT Strategy,and to take corrective action
when it is getting out ofalignment.
1 — Ad Hoc 2 — Reactive 3 — Challenged 4 — Managed 5 — Optimized

8/9/2019 A Current State Assessment-Finalv2 384036 7
http://slidepdf.com/reader/full/a-current-state-assessment-finalv2-384036-7 26/238
25
Engagement: 330002080 — Final Version
© 2012 Gartner, Inc. and/or its affiliates. All rights reserved.Gartner is a registered trademark of Gartner, Inc. or its affiliates.
Gartner TOPSS Maturity ModelService Level
IT support services not clearly
defined or negotiated with the
customer. Common attributes,
where applicable to the IT role,
include:
■ No service-level agreementsor metrics for which they areaccountable to either endcustomers or other groupswithin DTMB;
■ No means of working withcustomers on an ongoing
basis to understand actualdelivery against service-levelagreements;
■ No means of continuouslyimproving to achieve betterlevels of customersatisfaction.
IT support services are
provided, but performance is
not effectively measured.
Common attributes, where
applicable to the IT role,
include:
■ No or few objectives ormetrics are defined forspecific services, or acrossthe enterprise;
■ Has service-level agreementsand metrics for which they are
accountable to either endcustomers or other groupswithin DTMB;
■ Ability to accurately calculatethose metrics is limited;
■ Little means of working withcustomers on an ongoingbasis to understand actualdelivery against service-levelagreements;
■ No means to continuouslyimprove customer satisfaction.
Service-level agreements and
metrics are established and
the organization is
accountable to end customers
and other groups within
DTMB. Common attributes,
where applicable to the IT role,
include:
■ Ability to accurately calculatemetrics that end customersand other DTMB groupspartially believe to be
accurate;■ IT role is partially able to work
with customers on an ongoingbasis to understand actualdelivery against service-levelagreements;
■ No means of continuouslyimproving to achieve betterlevels of customersatisfaction.
Service-level agreements and
metrics are established, and
the IT support organization is
managing to agreed upon
service level. Common
attributes, where applicable to
the IT role, include:
■ Service-level agreements andmetrics for which they areaccountable to end customersand other groups withinDTMB, benchmarked against
peers;■ Ability to accurately calculate
metrics that end customersmostly believe to be accurate;
■ Fully able to work withcustomers on an ongoingbasis to understand actualdelivery against service-levelagreements;
■ Ability to work towardimproving actual delivery tocurrent service-levelagreements, but not toward
increasing those servicelevels in the future.
Service-level agreements and
metrics are collaboratively
and regularly agreed to with
customers, and organization
is fully accountable to end
customers and other groups
within DTMB. Common
attributes, where applicable to
the IT role, include:
■ Ability to accurately calculatemetrics that end customersand other DTMB groups truly
believe to be accurate;■ Fully able to work with
customers on an ongoingbasis to understand actualdelivery against service-levelagreements;
■ Means of continuouslyimproving to achieve betterlevels of customer satisfactionand to increase service;
■ Servlce levels supportchargeback and otherfinancial allocation
mechanisms to deliver cost-effective and high-qualityservices.
1 — Ad Hoc 2 — Reactive 3 — Challenged 4 — Managed 5 — Optimized

8/9/2019 A Current State Assessment-Finalv2 384036 7
http://slidepdf.com/reader/full/a-current-state-assessment-finalv2-384036-7 27/238
26
Engagement: 330002080 — Final Version
© 2012 Gartner, Inc. and/or its affiliates. All rights reserved.Gartner is a registered trademark of Gartner, Inc. or its affiliates.
Gartner TOPSS Maturity Model Tailored to the Nine IT Roles to Assess Maturity for the Each Area
CIO: Business Alignment and Effectiveness
CIO: Operations Management
Applications
Program and Portfolio Management
Business Intelligence and Performance Mgt.
Enterprise Architecture
Infrastructure and Operations
IT Sourcing and Vendor Management
Security and Risk Management
1 — NotPr esent 2 — Reactive 3 — Challenged 4 — Managed 5 — Optimized

8/9/2019 A Current State Assessment-Finalv2 384036 7
http://slidepdf.com/reader/full/a-current-state-assessment-finalv2-384036-7 28/238
27
Engagement: 330002080 — Final Version
© 2012 Gartner, Inc. and/or its affiliates. All rights reserved.Gartner is a registered trademark of Gartner, Inc. or its affiliates.
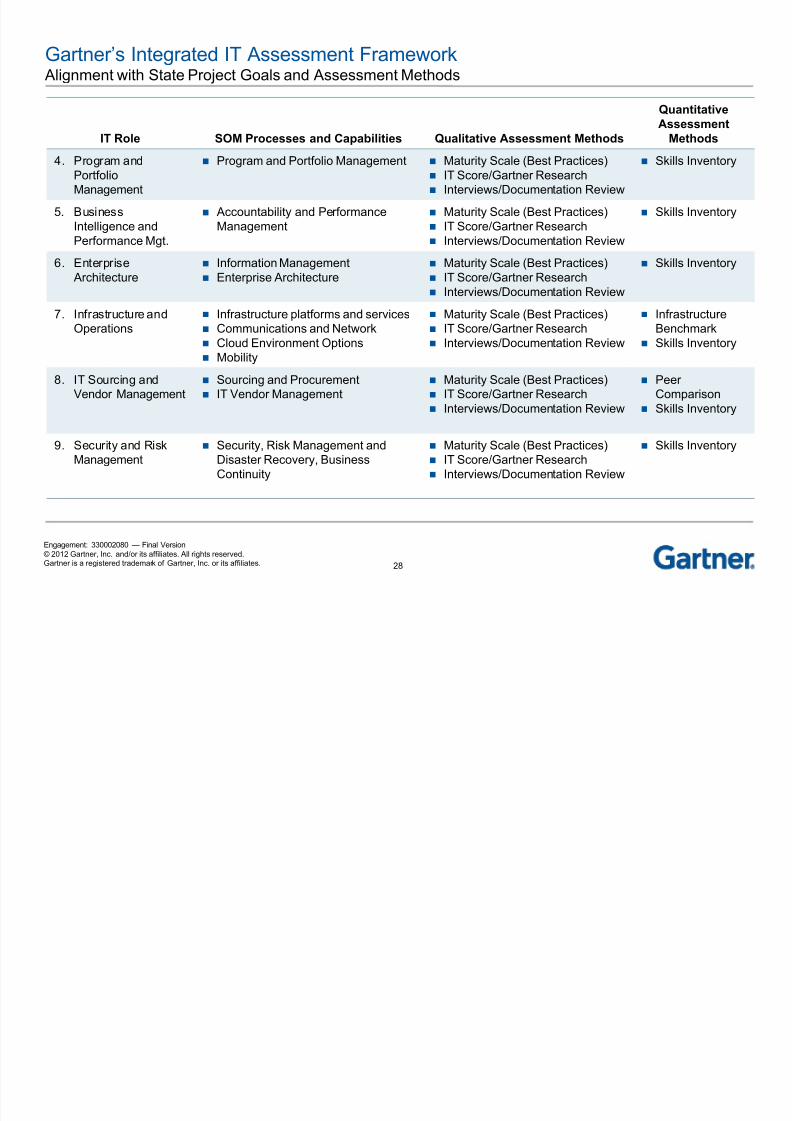
Gartner TOPSS Maturity Model Alignment with State Project Goals and Assessment Methods Utilized, by Role
■ As noted earlier, Gartner employed a combination of qualitative and quantitative tools to assess
each role depending on: 1) The nature of the functions within the role, and 2) The suitability of adirect comparison to peer groups vs. measuring alignment with industry best practices.
IT Role SOM Processes and Capabilities
Qualitative Assessment
Methods
Quantitative
Assessment
Methods
1. CIO: Business Alignment andEffectiveness
Collaboration, Partnerships and SharedServices
IT agency/business operational model Customer Service Management and
Operations
Maturity Scale (BestPractices)
IT Score/Gartner Research Interviews/Documentation
ITBE
2. CIO: OperationsManagement
People: Human Resources Governance Organizational structure Change and innovation management Social Media strategy Communications Budgeting, Financial Management and
Rate Structure comparisons
Maturity Scale (BestPractices)
IT Score/Gartner Research Interviews/Documentation
Review
ITBE Applications
Benchmark Infrastructure
Benchmark Skills Inventory
3. Applications Application technologies and services Web and portal services
Maturity Scale (BestPractices)
IT Score/Gartner Research Interviews/Documentation
Review
ApplicationsBenchmark
Skills Inventory
8/9/2019 A Current State Assessment-Finalv2 384036 7
http://slidepdf.com/reader/full/a-current-state-assessment-finalv2-384036-7 29/238
28
Engagement: 330002080 — Final Version
© 2012 Gartner, Inc. and/or its affiliates. All rights reserved.Gartner is a registered trademark of Gartner, Inc. or its affiliates.
IT Role SOM Processes and Capabilities Qualitative Assessment Methods
Quantitative
Assessment
Methods4. Program and
PortfolioManagement
Program and Portfolio Management Maturity Scale (Best Practices) IT Score/Gartner Research Interviews/Documentation Review
Skills Inventory
5. BusinessIntelligence andPerformance Mgt.
Accountability and PerformanceManagement
Maturity Scale (Best Practices) IT Score/Gartner Research Interviews/Documentation Review
Skills Inventory
6. Enterprise
Architecture
Information Management
Enterprise Architecture
Maturity Scale (Best Practices)
IT Score/Gartner Research Interviews/Documentation Review
Skills Inventory
7. Infrastructure andOperations
Infrastructure platforms and services Communications and Network Cloud Environment Options Mobility
Maturity Scale (Best Practices) IT Score/Gartner Research Interviews/Documentation Review
InfrastructureBenchmark
Skills Inventory
8. IT Sourcing andVendor Management
Sourcing and Procurement IT Vendor Management
Maturity Scale (Best Practices) IT Score/Gartner Research Interviews/Documentation Review
PeerComparison
Skills Inventory
9. Security and RiskManagement
Security, Risk Management andDisaster Recovery, BusinessContinuity
Maturity Scale (Best Practices) IT Score/Gartner Research Interviews/Documentation Review
Skills Inventory
Gartner’s Integrated IT Assessment Framework Alignment with State Project Goals and Assessment Methods
8/9/2019 A Current State Assessment-Finalv2 384036 7
http://slidepdf.com/reader/full/a-current-state-assessment-finalv2-384036-7 30/238
29
Engagement: 330002080 — Final Version
© 2012 Gartner, Inc. and/or its affiliates. All rights reserved.Gartner is a registered trademark of Gartner, Inc. or its affiliates.
CIO — Business Alignment and Effectiveness
Current State Assessment and Maturity Analysis
Current State =
Target State =

8/9/2019 A Current State Assessment-Finalv2 384036 7
http://slidepdf.com/reader/full/a-current-state-assessment-finalv2-384036-7 31/238
30
Engagement: 330002080 — Final Version
© 2012 Gartner, Inc. and/or its affiliates. All rights reserved.Gartner is a registered trademark of Gartner, Inc. or its affiliates.
CIO — Business Alignment and Effectiveness Role Definition — Key Management Objectives for IT Leadership: Alignment, Coordination andIntegration
DTMB is currently in the process of moving from isolated services to business-aligned services.
■ Focus on these objectives to deliver the business value of services
Fromisolated,
independentservices
To business-alignedservices
To timelycoordinated
services
Tosynergisticintegratedservices

8/9/2019 A Current State Assessment-Finalv2 384036 7
http://slidepdf.com/reader/full/a-current-state-assessment-finalv2-384036-7 32/238
31
Engagement: 330002080 — Final Version
© 2012 Gartner, Inc. and/or its affiliates. All rights reserved.Gartner is a registered trademark of Gartner, Inc. or its affiliates.
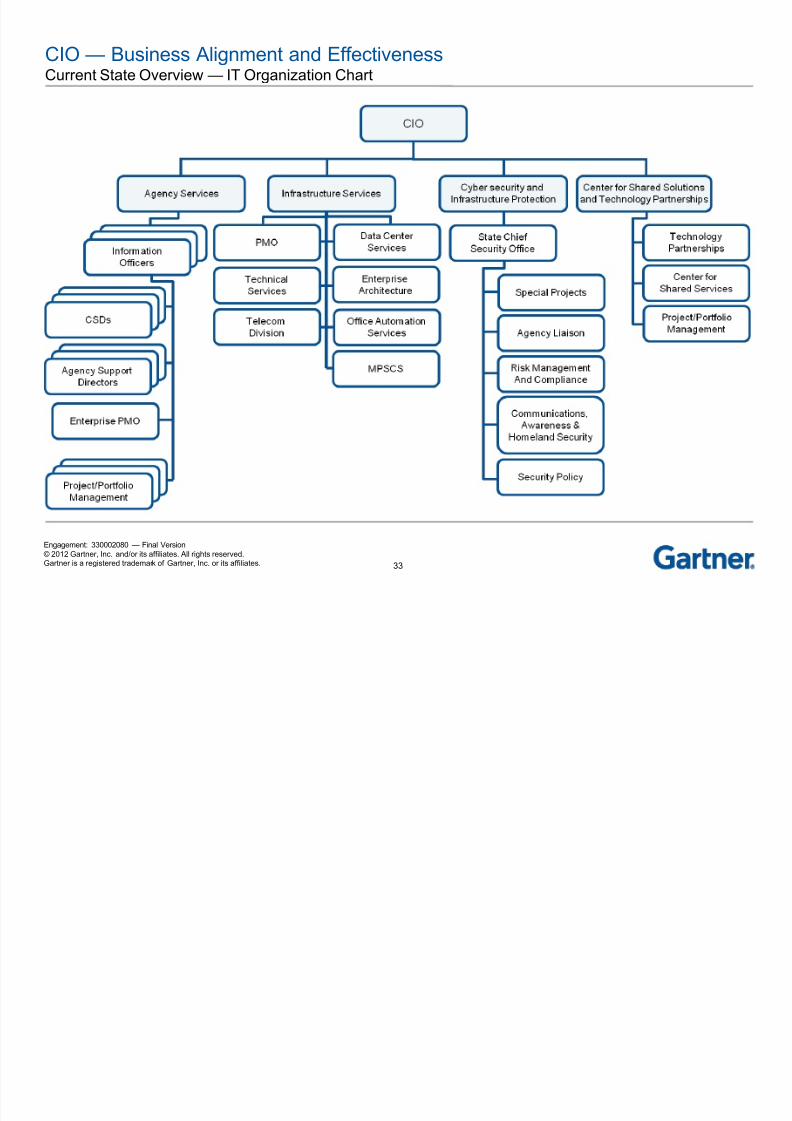
CIO — Business Alignment and EffectivenessCurrent State Overview
■ DTMB is currently providing shared IT technology services across 21 State agencies and entities,
and to a limited number of local/county government agencies. – Examples of shared services include Broadband/Telecommunications, GIS, MIDeal, Application Development
and Maintenance, and Infrastructure Services.
– Some policies and standards have been established for shared services, such as EO 2009-55, which formalizedIT-business alignment, fully integrating IT and business management processes.
– DTMB has begun to move from isolated, independent services to shared, business-aligned services.
■ DTMB has established various processes for the delivery of shared services to customer agencies.
– Communication and reporting processes have been implemented department-wide to ensure that division andprogram areas are collecting the right measures and that these are utilized for ongoing improvement.
– A technical and executive review board process is in place to grant policy exceptions for agency needs.
– DTMB has processes in place for agencies requesting services and reporting service problems (i.e., Remedy).

8/9/2019 A Current State Assessment-Finalv2 384036 7
http://slidepdf.com/reader/full/a-current-state-assessment-finalv2-384036-7 33/238
32
Engagement: 330002080 — Final Version
© 2012 Gartner, Inc. and/or its affiliates. All rights reserved.Gartner is a registered trademark of Gartner, Inc. or its affiliates.
CIO — Business Alignment and EffectivenessCurrent State Overview (continued)
■ Within DTMB there is an Office of Enterprise Development, which is responsible for outreach and
strategic planning.■ DTMB has a forward-looking vision that aims to position DTMB as an innovative, customer-centric
agency.
– DTMB would like to expand partnerships to include private sector, federal government, other state and localgovernment agencies.
– DTMB has ambitions to be “best in class” across all vertical industries — not just state government.
– To execute on its vision, DTMB does have an enterprisewide, documented, strategic plan in place, with several
supporting strategies in place (e.g., Mobile strategy, MiCloud). – The Office of Enterprise Development (and, to a lesser extent, the Enterprise Portfolio Management Office) is
tasked with aligning agency IT strategy to State strategy.
■ IT strategy development at the agency level varies among agencies, with each agency having itsown process for strategic development. Likewise, agencies are at various maturity levels with regardto having documented strategies in place.
■ Infrastructure Services has several service catalogs for services, and numerous service-level
agreements in place for service offerings, while Agency Services has a relatively immature servicecatalog.
8/9/2019 A Current State Assessment-Finalv2 384036 7
http://slidepdf.com/reader/full/a-current-state-assessment-finalv2-384036-7 34/238
33
Engagement: 330002080 — Final Version
© 2012 Gartner, Inc. and/or its affiliates. All rights reserved.Gartner is a registered trademark of Gartner, Inc. or its affiliates.
CIO — Business Alignment and EffectivenessCurrent State Overview — IT Organization Chart

8/9/2019 A Current State Assessment-Finalv2 384036 7
http://slidepdf.com/reader/full/a-current-state-assessment-finalv2-384036-7 35/238
34
Engagement: 330002080 — Final Version
© 2012 Gartner, Inc. and/or its affiliates. All rights reserved.Gartner is a registered trademark of Gartner, Inc. or its affiliates.
CIO — Business Alignment and EffectivenessCurrent State Overview — IT Organization Chart With Mapped Job Skills
Application Development
Architecture
Business Analysis
Business ContinuanceBusiness Intelligence
Client Technology/Desktop Support
Computer Operations
Customer Support/Help Desk
Database Administration
IT Leadership
IT Security
Network Management
Project ManagementQuality Assurance
Relationship Management
Systems Administration
Telecommunications
Web Design
Other
Application Development
Architecture
Business Analysis
Business IntelligenceClient Technology/Desktop Support
Computer Operations
Customer Support/Help Desk
Database Administration
Database Analysis
IT Leadership
IT Security
Project Management
Quality AssuranceRelationship Management
Release Management
Systems Administration
Web Administration
Web Design
Other
Architecture
IT Leadership
IT Security
Telecommunications
Application Development
Architecture
Business Intelligence
Client Technology/Desktop SupportCustomer Support/Help Desk
Database Administration
Database Analysis
IT Leadership
Project Management
Relationship Management
Systems Administration
Web Administration
Web DesignOther

8/9/2019 A Current State Assessment-Finalv2 384036 7
http://slidepdf.com/reader/full/a-current-state-assessment-finalv2-384036-7 36/238
35
Engagement: 330002080 — Final Version
© 2012 Gartner, Inc. and/or its affiliates. All rights reserved.Gartner is a registered trademark of Gartner, Inc. or its affiliates.
CIO — Business Alignment and EffectivenessCurrent State Overview — Agency Services

8/9/2019 A Current State Assessment-Finalv2 384036 7
http://slidepdf.com/reader/full/a-current-state-assessment-finalv2-384036-7 37/238
36
Engagement: 330002080 — Final Version
© 2012 Gartner, Inc. and/or its affiliates. All rights reserved.Gartner is a registered trademark of Gartner, Inc. or its affiliates.
CIO — Business Alignment and EffectivenessMajor Findings
Technology
Organization
ProcessStrategy
ServiceLevel
Current
■ DTMB is not viewed as a customer-service-oriented organization
and may be failing to incorporate business needs into the IT
strategy.
– Bottom Line: Only 16% of agencies that participated in the ITBEsurvey reported that they viewed DTMB as a strategic partner that isfully aligned with their agency strategy and an integral part of theirbusiness.
■ Metrics and Service Level Agreements (SLAs) provided to DTMB
customers are not descriptive and do not meet customer needs;
many customers are unaware of SLAs.
– Bottom Line: DTMB needs to better develop SLAs that meetcustomer needs. Furthermore, DTMB needs to provide consistentmetrics on SLA performance and communicate those withcustomers.
■ Inconsistent usage of a business analyst across the agencies.
– Bottom Line: Some agencies supply business analysts, while other agencies expect DTMB to providebusiness analysts so that they understand the agency’s business. This ambiguity leads to inconsistent
expectations from agencies. In some instances, the project manager becomes the de facto business analyst.This confusion can impact the quality of functional requirements and exacerbate customer frustrations.
■ Partnership opportunities with local government agencies could be greatly improved.
– Bottom Line: Local governments are finding DTMB services prohibitively expensive as a result of services notmeeting their specific business needs, and express that DTMB does not effectively partner with them tounderstand customer requirements.

8/9/2019 A Current State Assessment-Finalv2 384036 7
http://slidepdf.com/reader/full/a-current-state-assessment-finalv2-384036-7 38/238
37
Engagement: 330002080 — Final Version© 2012 Gartner, Inc. and/or its affiliates. All rights reserved.Gartner is a registered trademark of Gartner, Inc. or its affiliates.
No or limited systems or toolsin place to support account
planning and documentation
of customer requirements.
Systems or tools in place tosupport segmented account
planning and documentation
of customer requirements.
Systems or tools are present;however, there is no
coordination or
standardization across the
enterprise to support account
planning or the documentation
of requirements.
Standard systems and toolsacross the enterprise to
support account planning and
the documentation of
requirements.
Standard systems and toolsacross the enterprise to
support account planning and
the documentation of
requirements.
CIO — Business Alignment and EffectivenessCurrent State Technology Assessment
1 — Ad Hoc 2 — Reactive 3 — Challenged 4 — Managed 5 — Optimized

8/9/2019 A Current State Assessment-Finalv2 384036 7
http://slidepdf.com/reader/full/a-current-state-assessment-finalv2-384036-7 39/238
38
Engagement: 330002080 — Final Version© 2012 Gartner, Inc. and/or its affiliates. All rights reserved.Gartner is a registered trademark of Gartner, Inc. or its affiliates.
CIO — Business Alignment and EffectivenessCurrent State Technology Assessment Rationale
Strengths Weaknesses
Shared Services from the infrastructure side are mature. DTMB is currently using or in the process of adopting many
industry-leading technology solutions to provide basicservices to customer agencies (code development andtesting, servers, storage, etc.).
Tools are in place to provide for customer needs, although
there is not always standardization and coordination aroundtools.
There is a sense that DTMB is slow to pick up on newtechnology trends and is often not coming to customers withinnovative new technology solutions.
Technologies for accounting and billing to agencies are notfully automated and include manual inputs, often leading tolonger delivery times for customers.
DTMB is not fulfilling mobile provisioning rapidly enough to
satisfy customer demand. Local governments often find the cost of DTMB’s IT servicesto be prohibitively expensive (e.g., 800 MHZ dispatchsystem). This is often a result of DTMB technology solutionsnot meeting local government business requirements.

8/9/2019 A Current State Assessment-Finalv2 384036 7
http://slidepdf.com/reader/full/a-current-state-assessment-finalv2-384036-7 40/238
39
Engagement: 330002080 — Final Version© 2012 Gartner, Inc. and/or its affiliates. All rights reserved.Gartner is a registered trademark of Gartner, Inc. or its affiliates.
CIO — Business Alignment and EffectivenessCurrent State Organization Assessment
No clear organizationalstructure or overall ownership
of responsibilities for client
service delivery across the
enterprise. Common attributes
include:
■ DTMB does not have enoughadequately trained staff tosupport account planning andthe documentation ofrequirements.
Ownership of client servicedelivery responsibilities within
the enterprise exists, but the
organization is immature and
appropriate skill sets are not
present. Common attributes
include:
■ DTMB has staff that hasreceived some of thenecessary training (but needsmore training) to beadequately prepared to
support account planning andthe documentation ofrequirements.
Ownership of client servicedelivery responsibilities within
the enterprise exists, is fairly
mature, and exhibits some
best practices. Client service
delivery skill sets largely align
with IT support needs.
Common attributes include:
■ DTMB has adequately trainedresources but is understaffed,which limits the organization’sability to support account
planning and thedocumentation ofrequirements.
Client service deliveryorganization is integrated with
other key processes and IT
roles, and is appropriately
organized and staffed.
Common attributes include:
■ DTMB has a sufficient numberof adequately trainedresources to support accountplanning and thedocumentation ofrequirements.
Client service deliveryprocesses are mature and
efficient. Common attributes
include:
■ DTMB has a sufficient numberof proficient resources tosupport account planning anddocumentation ofrequirements; each roledocumented as responsible,accountable, consulted andinformed.
1 — Ad Hoc 2 — Reactive 3 — Challenged 4 — Managed 5 — Optimized

8/9/2019 A Current State Assessment-Finalv2 384036 7
http://slidepdf.com/reader/full/a-current-state-assessment-finalv2-384036-7 41/238
40
Engagement: 330002080 — Final Version© 2012 Gartner, Inc. and/or its affiliates. All rights reserved.Gartner is a registered trademark of Gartner, Inc. or its affiliates.
CIO — Business Alignment and EffectivenessCurrent State Organization Assessment Rationale
Strengths Weaknesses
DTMB staff is largely regarded by customers asadequately skilled to provide basic IT services. TheJob Skills Assessment showed that DTMB rankedabove average from an overall skills perspective, with38% of self-assessed skills being at “Advanced” or“Master” levels.
Agency customers repeatedly reported a feeling thatDTMB, especially at the higher managerial levels, wascommitted to improving service.
New executive leadership is regarded positively byagency customers.
The Agency Services organizational model has placedaccountability and ownership for customer needs atthe IO level in an effort to make DTMB moreresponsive to customer needs. This “ownership”organizational model aligns with DTMB’s vision to becustomer-centric.
Skills inventory revealed significant “bench strength”for many skills.
DTMB adequately keeps external stakeholders,including press organizations, informed of new DTMB-
related initiatives, milestones and accomplishments.Likewise, from an internal perspective, executivecommunication to DTMB staff is adequate.
In 2011 DTMB rolled out the Open Michigan websitethat makes it easier for citizens and businesses tolearn about DTMB efforts.
IT Leadership and Relationship Management skills within DTMB arelimited.
Agency Services, although dependent on Infrastructure Services todeliver customer services, has no direct authority over the group andfew formalized resources to ensure services are delivered in a timelymanner that meets customer expectations.
A high degree of variability exists with regard to the relationship IOshave with agency customers, and IOs are often working withagencies at an operational level. Additionally, the IT BusinessEffectiveness survey showed the variability of agency satisfactiondid not correlate with individual IOs, as often the same IO would be
responsible for both comparatively satisfied and unsatisfiedagencies.
A lack of succession planning and knowledge transfer from vendorsis common (e.g., spent $256M for a single vendor without therequisite knowledge transfer).
Portfolio Management is relatively immature from an organizationperspective, with challenges occurring at an enterprise level, makingit difficult to understand overall demand and capacity to optimizeresources.
Several agencies reported a lack of clarity regarding ownership of
issues, thus increasing the time to resolve issues. While internal and press communications are adequate,
communication to agency customers and local governments couldbe improved. Local government entities consistently reported ageneral lack of communication with DTMB, and several agenciesimplied a desire for increased communication with DTMB from anorganizational level.
8/9/2019 A Current State Assessment-Finalv2 384036 7
http://slidepdf.com/reader/full/a-current-state-assessment-finalv2-384036-7 42/238
41
Engagement: 330002080 — Final Version© 2012 Gartner, Inc. and/or its affiliates. All rights reserved.Gartner is a registered trademark of Gartner, Inc. or its affiliates.
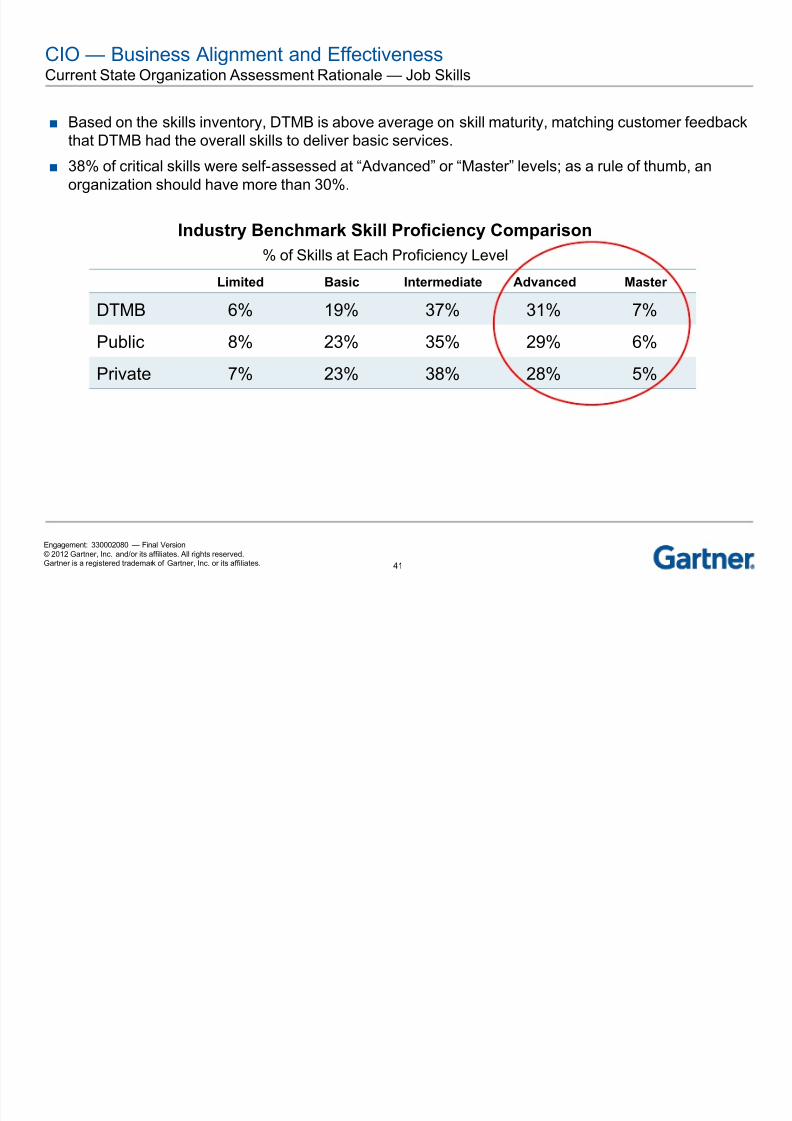
CIO — Business Alignment and Effectiveness Current State Organization Assessment Rationale — Job Skills
■ Based on the skills inventory, DTMB is above average on skill maturity, matching customer feedback
that DTMB had the overall skills to deliver basic services.■ 38% of critical skills were self-assessed at “Advanced” or “Master” levels; as a rule of thumb, an
organization should have more than 30%.
Limited Basic Intermediate Advanced Master
DTMB 6% 19% 37% 31% 7%
Public 8% 23% 35% 29% 6%
Private 7% 23% 38% 28% 5%
Industry Benchmark Skill Proficiency Comparison
% of Skills at Each Proficiency Level

8/9/2019 A Current State Assessment-Finalv2 384036 7
http://slidepdf.com/reader/full/a-current-state-assessment-finalv2-384036-7 43/238
42
Engagement: 330002080 — Final Version© 2012 Gartner, Inc. and/or its affiliates. All rights reserved.Gartner is a registered trademark of Gartner, Inc. or its affiliates.
Job FamilyHighly
QualifiedQualified
Less-
QualifiedTotal HC
Strength
(%HQ+Q)
Client Technology/Desktop Support 31 38 32 101 68%
Web Administration 4 3 5 12 58%
Quality Assurance 7 4 10 21 52%
Systems Administration 25 14 43 82 48%
Application Development 48 78 163 289 44%
Network Management 6 7 19 32 41%
Database Analysis 2 3 8 13 38%
Database Administration 14 7 35 56 38%
Web Design 5 8 22 35 37%
Telecommunications 7 8 32 47 32%
IT Security 2 5 15 22 32%
Business Analysis 3 13 37 53 30%
Architecture 3 6 22 31 29%
Business Intelligence 1 3 10 14 29%
Project Management 12 16 80 108 26%
Customer Support/Help Desk 4 19 66 89 26%
Computer Operations 1 12 46 59 22%
IT Leadership 10 17 96 123 22%
Business Continuance 1 0 4 5 20%
Release Management 1 1 8 10 20%
Relationship Management 2 1 38 41 7%
CIO — Business Alignment and Effectiveness Current State Organization Assessment Rationale — Job Skills
Highly Qualified = Q score 75% or higher; Qualified = Q score between 50% and 75%; Less-Qualified = Q score below 50%
■ IT Leadership and Relationship Management were among the least skilled job families within DTMB,which can significantly hamper CIO Business Alignment and Effectiveness.

8/9/2019 A Current State Assessment-Finalv2 384036 7
http://slidepdf.com/reader/full/a-current-state-assessment-finalv2-384036-7 44/238
43
Engagement: 330002080 — Final Version© 2012 Gartner, Inc. and/or its affiliates. All rights reserved.Gartner is a registered trademark of Gartner, Inc. or its affiliates.
CIO — Business Alignment and EffectivenessCurrent State Organization Assessment Rationale — Capabilities by IT Leadership Job Family
■ Job Family strength for FTEs currently in this job family:
■ Selected foundational skills and critical competencies:
■ Bench strength (Highly Qualified and Qualified FTEs currently in other Job Families):
Highly Qualified 17
Qualified 66
HQ+Q 83
5 Critical Competencies
2+ Levels
Below
Expected
1 Level
Below
Expected
At or
Above
Expected
Building Partnerships 33.3% 48.0% 18.7%Change Advocate 29.3% 54.5% 16.3%
Decision Making 28.5% 47.2% 24.4%
Initiating Action 30.1% 52.8% 17.1%
Strategic Planning 48.0% 43.9% 8.1%
10 Foundational Skills (% of People with Adv/Master Proficieny) % Adv/Mst
Budget/Finance 19.5%
Business Processes 39.8%
Business Strategic Planning 26.0%
Change Management 41.5%
Employee Coaching / Career Development 52.8%
Employee Performance Management 43.1%
Governance 24.4%
IT Planning: Tactical, Strategic 37.4%
Leadership & Direction Setting 44.7%
Staffing, Hiring, Selection 56.1%
Adv/Master>= 30% Adv/Master 20% –30% Adv/Master <20%
Below <40% At or Above 60% 40% to <60%
While IT Leadership possess adequate skills in the “harder”
foundational skills, they reported a concerning lack of skill incritical competencies or “soft skills.”
Job Family Highly Qualified Qualified Less-Qualified Total HCStrength
(%HQ+Q)
IT Leadership 10 17 96 123 22%
CIO B i Ali t d Eff ti

8/9/2019 A Current State Assessment-Finalv2 384036 7
http://slidepdf.com/reader/full/a-current-state-assessment-finalv2-384036-7 45/238
44
Engagement: 330002080 — Final Version© 2012 Gartner, Inc. and/or its affiliates. All rights reserved.Gartner is a registered trademark of Gartner, Inc. or its affiliates.
CIO — Business Alignment and EffectivenessCurrent State Organization Assessment Rationale — Capabilities by Relationship Management JobFamily
■ Job Family strength for FTEs currently in this job family:
■ Selected foundational skills and critical competencies:
■ Bench strength (Highly Qualified and Qualified FTEs currently in other Job Families):
Highly Qualified 15
Qualified 48
HQ+Q 63
10 Foundational Skil ls (% of People with Adv/Master Proficieny) % Adv/Mst
Business Assessment 17.1%
Business Case Development 14.6%
Business Cost Benefit Analysis 7.3%
Business Definition Requirements 12.2%
Business Feasibility Studies 9.8%
Business Processes 24.4%
Business Strategic Planning 12.2%
Enterprise Products/Services 4.9%
IT Trends & Directions 7.3%
Risk Management 4.9%
5 Critical Competencies
2+ Levels
Below
Expected
1 Level
Below
Expected
At or
Above
Expected
Building Partnerships 26.8% 41.5% 31.7%Change Advocate 46.3% 29.3% 24.4%
Consulting 34.1% 39.0% 26.8%
Information Seeking 43.9% 39.0% 17.1%
Innovation 41.5% 41.5% 17.1%
Adv/Master>= 30% Adv/Master 20% –30% Adv/Master <20%
Below <40% At or Above 60% 40% to <60%
Job Family Highly Qualified Qualified Less-Qualified Total HC Strength(%HQ+Q)
Relationship Management 2 1 38 41 7%

8/9/2019 A Current State Assessment-Finalv2 384036 7
http://slidepdf.com/reader/full/a-current-state-assessment-finalv2-384036-7 46/238
45
Engagement: 330002080 — Final Version© 2012 Gartner, Inc. and/or its affiliates. All rights reserved.Gartner is a registered trademark of Gartner, Inc. or its affiliates.
2 4 2 1 4 1 1 3 2 1 1 1 2 3 1 2
2.01
2.37
3.39 3.273.41
1.76
3.45 3.48
2.87 2.81
3.35
2.66
3.68
2.25
2.74 2.44
1
1.5
2
2.5
3
3.5
4
4.5
5
0
0.5
1
1.5
2
2.5
3
3.5
4
4.5
A g r i c u l t u r e a n d R u r a l
D e v e l o
p m e n t ( M D A R D )
A t t o r n
e y G e n e r a l ( A G )
C i v
i l R i g h t s ( M D C R )
C i v i l S e r v i c e C o
m m i s s i o n ( C S C )
C o m m u n i t y H e a l t h ( M D C H )
C o r
r e c t i o n s ( M D O C )
E d u c a t i o n ( M D E )
E n v i r o n m e n t a l Q u a l i t y ( D E Q )
H u m a n S e r v i c e s ( D H S )
L i c e n s i n g a n d R
e g u l a t o r y A f f a i r s
( L A
R A )
M i c h i g a n E c o n o m
i c D e v e l o p m e n t
C o r p o r a t i o
n ( M E D C )
N a t u r a l R
e s o u r c e s ( D N R )
S t a t e ( M D O S )
S t
a t e P o l i c e ( M S P )
T r a n s p
o r t a t i o n ( M D O T )
T r e a s u r y ( T R S )
Count
Scores
■ Agency satisfaction was not correlated with the performance of individual IOs, as it is often the casethat the same IO will be responsible for both comparatively satisfied and unsatisfied agencies.
Agencies by IO
Responsibility
LARA, MDOC, MSP,MDVA, MDCR
DCH,DEQ, DNR,MDARD
DHS
MCSC, MDE
MDOT, MDOS
AG, TRS
CIO — Business Alignment and Effectiveness Current State Organization Assessment Rationale — Job Skills

8/9/2019 A Current State Assessment-Finalv2 384036 7
http://slidepdf.com/reader/full/a-current-state-assessment-finalv2-384036-7 47/238

8/9/2019 A Current State Assessment-Finalv2 384036 7
http://slidepdf.com/reader/full/a-current-state-assessment-finalv2-384036-7 48/238
47
Engagement: 330002080 — Final Version© 2012 Gartner, Inc. and/or its affiliates. All rights reserved.Gartner is a registered trademark of Gartner, Inc. or its affiliates.
CIO — Business Alignment and EffectivenessCurrent State Process Assessment Rationale
Strengths Weaknesses
DTMB has several documented processes for serviceson behalf of agencies (e.g., procurement, incidentresponse and policy exception).
DTMB has a documented process in place for agencycustomers to directly request services of AgencyServices and report issues.
Several documented processes exist, but many are notroutinely followed (e.g., Call for Projects process, informationinput into ChangePoint). As a result, inconsistent processdiscipline leads to inefficiencies and lack of standardization insome areas.
Communication between Agency Services and InfrastructureServices is often reliant on informal relationships rather thanformal processes.
Enterprise Architecture policies and processes are oftenmisaligned with those of Agency Services, resulting in less-
than-desirable customer service. Currently there is no standardized, enterprisewide process for
reviewing benefits realization or ROI for DTMB initiatives onbehalf of agencies. As a result, DTMB projects are not beingcontinuously evaluated to ensure that they are delivering ontheir business case.
A standard process for developing a proposal for a new serviceto an agency customer is not in place. Likewise, some sharedservices initiatives are taking place at the IO level, without theinvolvement of the Office of Shared Solutions.
Local government entities report that they have not been askedto participate in requirements definition processes for potentialshared services. Consequently, local governments do not feelthat there is a real sense of partnership in developing potentialmutually beneficial shared services and, as a result, manyproposed State services do not meet their requirements.

8/9/2019 A Current State Assessment-Finalv2 384036 7
http://slidepdf.com/reader/full/a-current-state-assessment-finalv2-384036-7 49/238

8/9/2019 A Current State Assessment-Finalv2 384036 7
http://slidepdf.com/reader/full/a-current-state-assessment-finalv2-384036-7 50/238
49
Engagement: 330002080 — Final Version© 2012 Gartner, Inc. and/or its affiliates. All rights reserved.
Gartner is a registered trademark of Gartner, Inc. or its affiliates.
CIO — Business Alignment and EffectivenessCurrent State Strategy Assessment Rationale
Strengths Weaknesses
DTMB has a clear vision of key strategic objectives (i.e., acustomer-centric, innovative IT organization) and strongexecutive support.
The Office of Enterprise Development has been establishedto oversee the strategic alignment of DTMB initiatives.
A formalized, documented, up-to-date enterprise strategicplan is in place and widely available.
The State’s IT is reasonably well aligned with the State’sbusiness strategy, especially as a result of the Department ofIT merging with the Department of Management and Budget
to form DTMB.
There is a wide degree of variability with regard to IOs beingconsidered the strategic partners of agencies. In someinstances, the IO is working with agencies at a strategiclevel, but the IO relationship is not strategic for manyagencies. As a result, the nascent IO role yields mixedresults, particularly with regard to strategy alignment. – Less than 7% of customers surveyed felt that IT’s
strategies were fully aligned with their strategic businessrequirements.
– Despite the alignment issues, 90% of customers expect
extremely high or high dependency on IT in the future. – Respondents surveyed who viewed DTMB as a strategic
partner, rather than as administrative support, had highersatisfaction ratings with DTMB services.
Most agencies view themselves as having a limited level ofstrategy alignment with DTMB (“DTMB does not understandmy business.”).
With regard to presenting a strategy for shared services tolocal governments, there is a feeling the State has
historically been an unresponsive “big brother” that has noteffectively gathered their input/requirements for newservices.
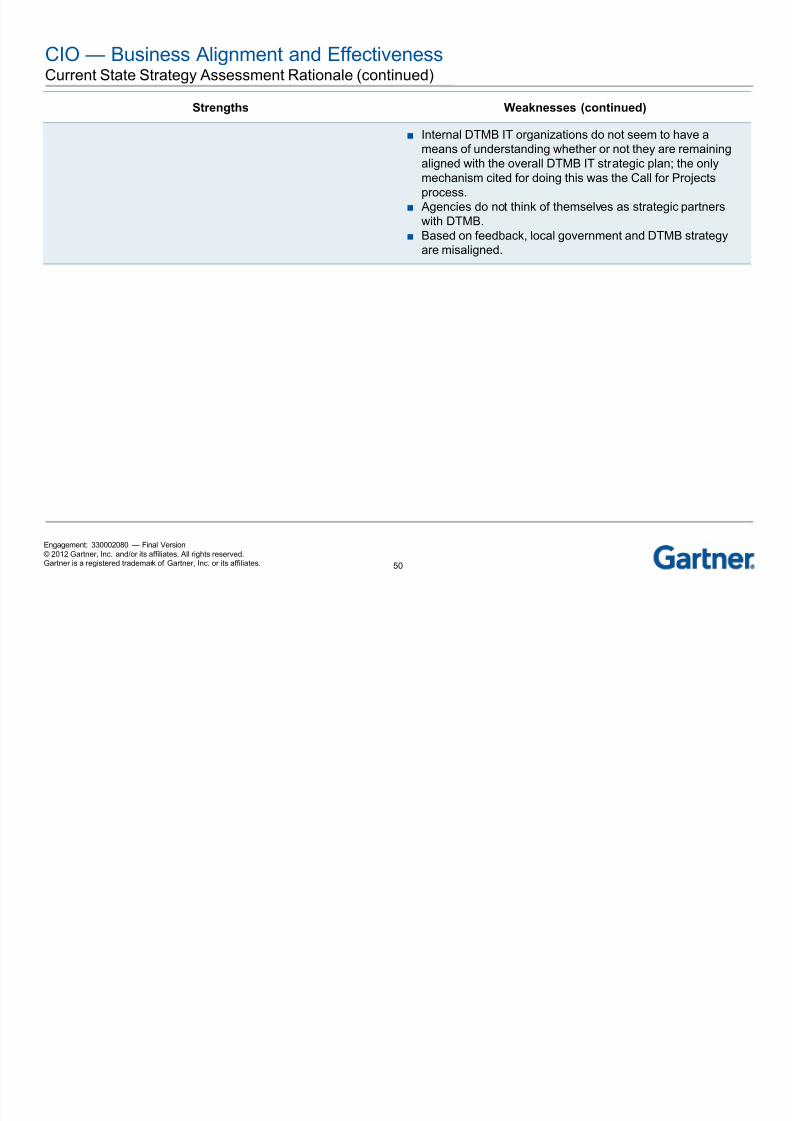
8/9/2019 A Current State Assessment-Finalv2 384036 7
http://slidepdf.com/reader/full/a-current-state-assessment-finalv2-384036-7 51/238
50
Engagement: 330002080 — Final Version© 2012 Gartner, Inc. and/or its affiliates. All rights reserved.
Gartner is a registered trademark of Gartner, Inc. or its affiliates.
CIO — Business Alignment and EffectivenessCurrent State Strategy Assessment Rationale (continued)
Strengths Weaknesses (continued)
■ Internal DTMB IT organizations do not seem to have a
means of understanding whether or not they are remainingaligned with the overall DTMB IT strategic plan; the onlymechanism cited for doing this was the Call for Projectsprocess.
■ Agencies do not think of themselves as strategic partnerswith DTMB.
■ Based on feedback, local government and DTMB strategyare misaligned.

8/9/2019 A Current State Assessment-Finalv2 384036 7
http://slidepdf.com/reader/full/a-current-state-assessment-finalv2-384036-7 52/238

8/9/2019 A Current State Assessment-Finalv2 384036 7
http://slidepdf.com/reader/full/a-current-state-assessment-finalv2-384036-7 53/238
52
Engagement: 330002080 — Final Version© 2012 Gartner, Inc. and/or its affiliates. All rights reserved.
Gartner is a registered trademark of Gartner, Inc. or its affiliates.
Averagedependency
10%
Highdependency
35%
Extremely highdependency55%
Highdependency
39%
Extremely highdependency
61%Current Dependency
Future Dependency
CIO — Business Alignment and Effectiveness ITBE Survey Results — Customer Dependency on IT
■ Despite the alignment issues, 90% of customers currently report having either an extremely high or
high dependency on IT.

8/9/2019 A Current State Assessment-Finalv2 384036 7
http://slidepdf.com/reader/full/a-current-state-assessment-finalv2-384036-7 54/238
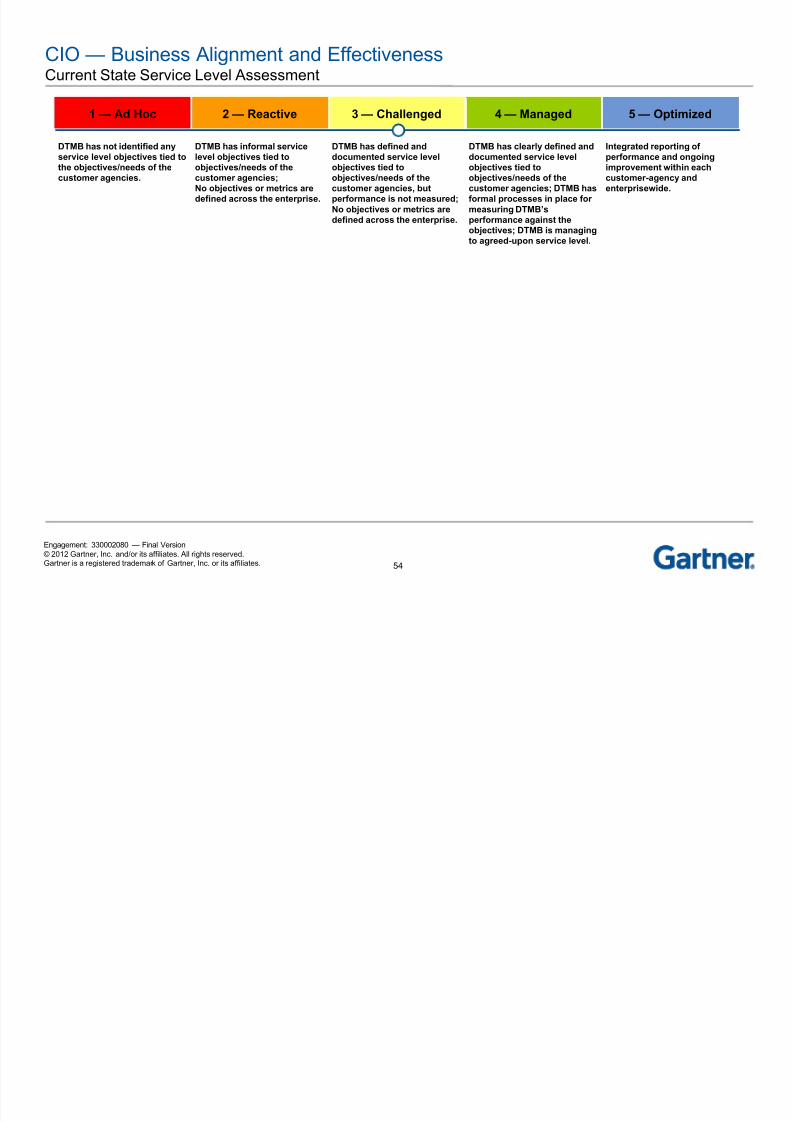
8/9/2019 A Current State Assessment-Finalv2 384036 7
http://slidepdf.com/reader/full/a-current-state-assessment-finalv2-384036-7 55/238
54
Engagement: 330002080 — Final Version© 2012 Gartner, Inc. and/or its affiliates. All rights reserved.
Gartner is a registered trademark of Gartner, Inc. or its affiliates.
DTMB has not identified anyservice level objectives tied to
the objectives/needs of the
customer agencies.
DTMB has informal servicelevel objectives tied to
objectives/needs of the
customer agencies;
No objectives or metrics are
defined across the enterprise.
DTMB has defined anddocumented service level
objectives tied to
objectives/needs of the
customer agencies, but
performance is not measured;
No objectives or metrics are
defined across the enterprise.
DTMB has clearly defined anddocumented service level
objectives tied to
objectives/needs of the
customer agencies; DTMB has
formal processes in place for
measuring DTMB’s
performance against the
objectives; DTMB is managing
to agreed-upon service level.
Integrated reporting ofperformance and ongoing
improvement within each
customer-agency and
enterprisewide.
CIO — Business Alignment and EffectivenessCurrent State Service Level Assessment
1 — Ad Hoc 2 — Reactive 3 — Challenged 4 — Managed 5 — Optimized
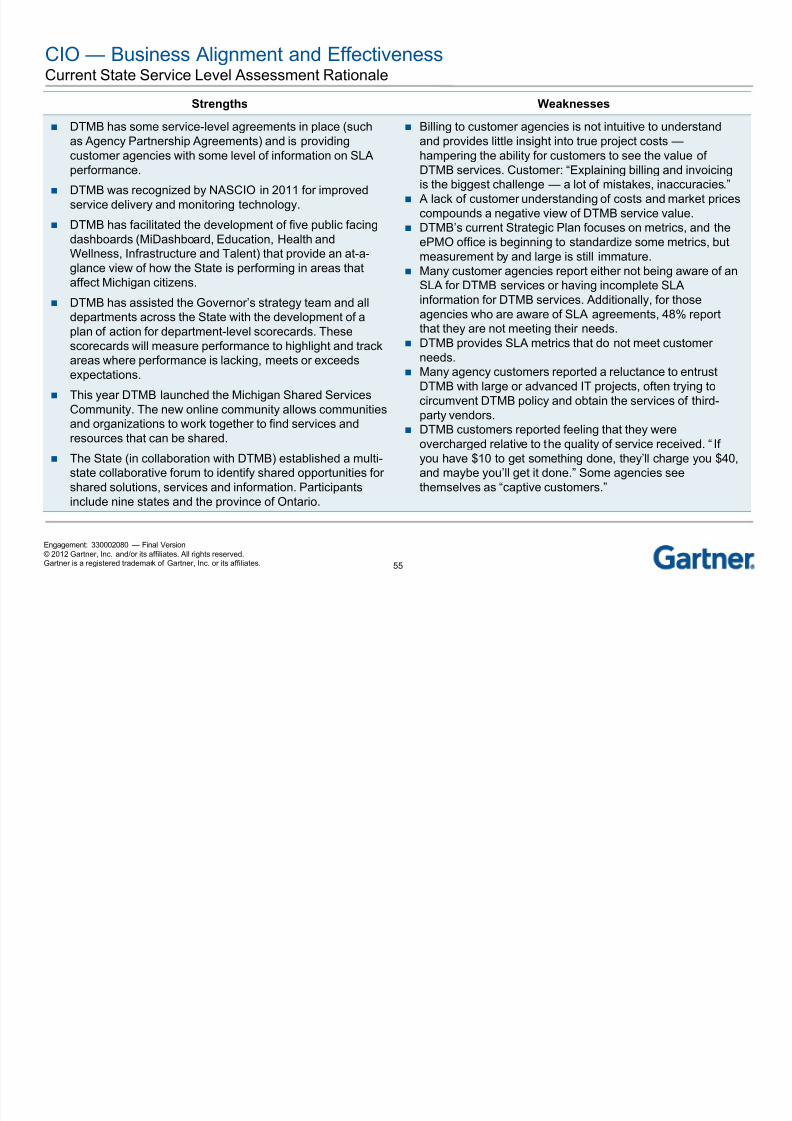
8/9/2019 A Current State Assessment-Finalv2 384036 7
http://slidepdf.com/reader/full/a-current-state-assessment-finalv2-384036-7 56/238
55
Engagement: 330002080 — Final Version© 2012 Gartner, Inc. and/or its affiliates. All rights reserved.
Gartner is a registered trademark of Gartner, Inc. or its affiliates.
CIO — Business Alignment and EffectivenessCurrent State Service Level Assessment Rationale
Strengths Weaknesses
DTMB has some service-level agreements in place (such
as Agency Partnership Agreements) and is providingcustomer agencies with some level of information on SLAperformance.
DTMB was recognized by NASCIO in 2011 for improvedservice delivery and monitoring technology.
DTMB has facilitated the development of five public facingdashboards (MiDashboard, Education, Health andWellness, Infrastructure and Talent) that provide an at-a-glance view of how the State is performing in areas that
affect Michigan citizens. DTMB has assisted the Governor’s strategy team and all
departments across the State with the development of aplan of action for department-level scorecards. Thesescorecards will measure performance to highlight and trackareas where performance is lacking, meets or exceedsexpectations.
This year DTMB launched the Michigan Shared ServicesCommunity. The new online community allows communities
and organizations to work together to find services andresources that can be shared.
The State (in collaboration with DTMB) established a multi-state collaborative forum to identify shared opportunities forshared solutions, services and information. Participantsinclude nine states and the province of Ontario.
Billing to customer agencies is not intuitive to understand
and provides little insight into true project costs — hampering the ability for customers to see the value ofDTMB services. Customer: “Explaining billing and invoicingis the biggest challenge — a lot of mistakes, inaccuracies.”
A lack of customer understanding of costs and market pricescompounds a negative view of DTMB service value.
DTMB’s current Strategic Plan focuses on metrics, and theePMO office is beginning to standardize some metrics, butmeasurement by and large is still immature.
Many customer agencies report either not being aware of an
SLA for DTMB services or having incomplete SLAinformation for DTMB services. Additionally, for thoseagencies who are aware of SLA agreements, 48% reportthat they are not meeting their needs.
DTMB provides SLA metrics that do not meet customerneeds.
Many agency customers reported a reluctance to entrustDTMB with large or advanced IT projects, often trying tocircumvent DTMB policy and obtain the services of third-party vendors.
DTMB customers reported feeling that they wereovercharged relative to the quality of service received. “Ifyou have $10 to get something done, they’ll charge you $40,and maybe you’ll get it done.” Some agencies seethemselves as “captive customers.”

8/9/2019 A Current State Assessment-Finalv2 384036 7
http://slidepdf.com/reader/full/a-current-state-assessment-finalv2-384036-7 57/238
56
Engagement: 330002080 — Final Version© 2012 Gartner, Inc. and/or its affiliates. All rights reserved.
Gartner is a registered trademark of Gartner, Inc. or its affiliates.
CIO — Business Alignment and EffectivenessCurrent State Service Level Assessment Rationale (continued)
Strengths Weaknesses (continued)
When comparing Benchmark results with satisfaction ratings
provided by the IT Business Effectiveness survey, agencieswith a higher support cost (MDOS, DCH, MSP) tended togive higher satisfaction ratings for system quality, servicequality and performance.
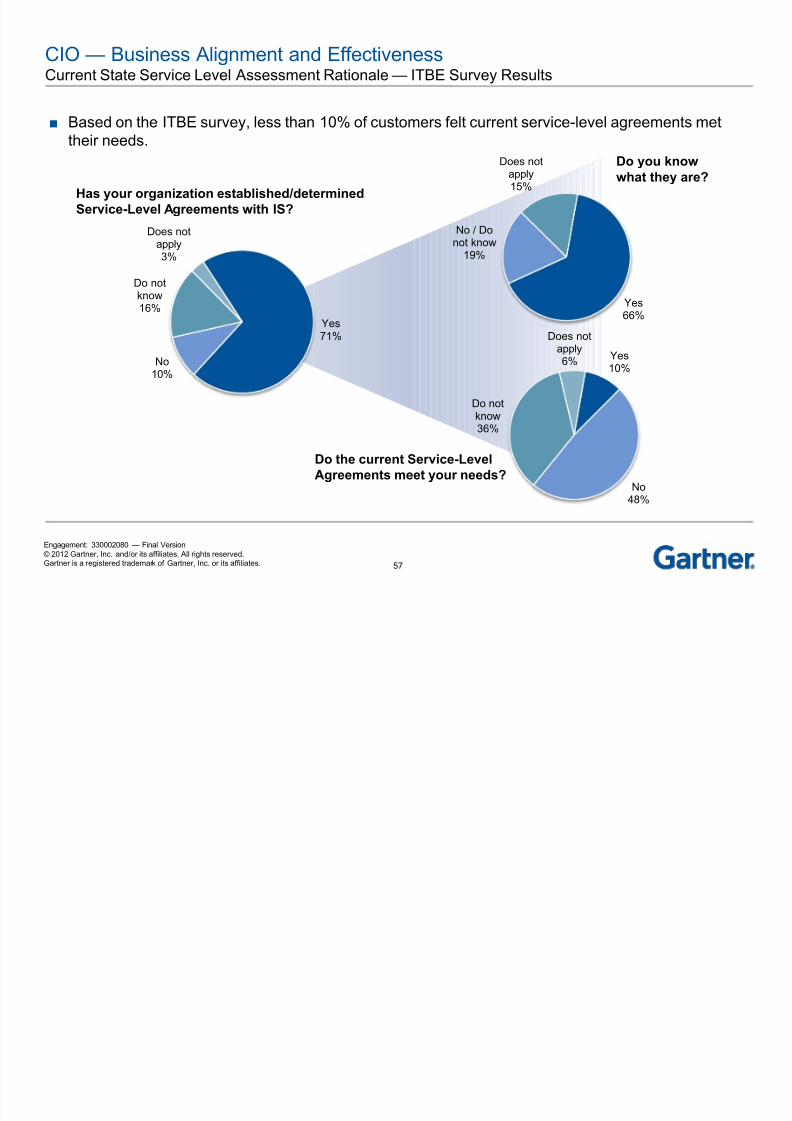
8/9/2019 A Current State Assessment-Finalv2 384036 7
http://slidepdf.com/reader/full/a-current-state-assessment-finalv2-384036-7 58/238
57
Engagement: 330002080 — Final Version© 2012 Gartner, Inc. and/or its affiliates. All rights reserved.
Gartner is a registered trademark of Gartner, Inc. or its affiliates.
Yes71%
No10%
Do notknow16%
Does notapply3%
Yes66%
No / Donot know
19%
Does notapply15%
Yes10%
No48%
Do notknow36%
Does notapply6%
Has your organization established/determined
Service-Level Agreements with IS?
Do you know
what they are?
Do the current Service-Level
Agreements meet your needs?
CIO — Business Alignment and EffectivenessCurrent State Service Level Assessment Rationale — ITBE Survey Results
■ Based on the ITBE survey, less than 10% of customers felt current service-level agreements met
their needs.

8/9/2019 A Current State Assessment-Finalv2 384036 7
http://slidepdf.com/reader/full/a-current-state-assessment-finalv2-384036-7 59/238
58
Engagement: 330002080 — Final Version© 2012 Gartner, Inc. and/or its affiliates. All rights reserved.
Gartner is a registered trademark of Gartner, Inc. or its affiliates.
CIO Perspective — Operations Management
Current State Assessment and Maturity Analysis
Current State =
Target State =

8/9/2019 A Current State Assessment-Finalv2 384036 7
http://slidepdf.com/reader/full/a-current-state-assessment-finalv2-384036-7 60/238
59
Engagement: 330002080 — Final Version© 2012 Gartner, Inc. and/or its affiliates. All rights reserved.
Gartner is a registered trademark of Gartner, Inc. or its affiliates.
CIO — Operations Management Role Definition — IT Operating Models vs. IT Delivery Models
■ The following framework was applied to DTMB to evaluate its current operations. This illustration depicts a loosevertical correlation with the business expectations of IT in the enterprise, the choice of operating model, and the
“right” IT delivery model in terms of the optimal combination of models.
■ IT Operating Models are a manifestation of certain implicit governance decisions that define and bind IT spheres ofinfluence. They are accountability frameworks that determine where responsibility and authority for deliveringdifferent types of IT value will reside and how the tradeoffs between monopolistic economies of scale andentrepreneurial flexibility will be balanced within the enterprise.
■ The IT Delivery Model defines the way in which a specific IT organization orchestrates its capabilities to deliveragainst its core value proposition. The choice of delivery model has explicit implications for the various organizationalarchitecture dimensions. Organizational attributes, such as tools, sourcing, structure, process and people
management, are largely dictated by the choice of delivery model and look different for each.
The scope of the CIO-Operationsrole assessment is primarily
focused on the IT DeliveryModel.

8/9/2019 A Current State Assessment-Finalv2 384036 7
http://slidepdf.com/reader/full/a-current-state-assessment-finalv2-384036-7 61/238
60
Engagement: 330002080 — Final Version© 2012 Gartner, Inc. and/or its affiliates. All rights reserved.
Gartner is a registered trademark of Gartner, Inc. or its affiliates.
CIO — Operations ManagementRole Definition — IT Delivery Model
■ The various IT delivery models are listed in order ofglobal prevalence; thus, “asset” and “process” models
are the most common, whereas “value” models are theleast common.
■ Delivery models orchestrate resources around thatwhich is being optimized, and so a key differentiatorbetween models is what they focus on managing.
■ Models are listed in order of maturation and, therefore,represent the required transformation path. An asset-optimizing organization wishing to become a service-
optimizing organization, for example, should firstbecome process-based. Models cannot easily beskipped.
■ There are no value judgments implied by theframework. The fact that one model requires morematurity than another does not make it better. Theframework is not meant to imply that every ITorganization should ultimately achieve the value model
and become a profit center. The framework onlyindicates the migration path required to achieve thecapabilities inherent in any given model. Which modelis best will be determined by the needs of the businessand the IT role it most values.
8/9/2019 A Current State Assessment-Finalv2 384036 7
http://slidepdf.com/reader/full/a-current-state-assessment-finalv2-384036-7 62/238
61
Engagement: 330002080 — Final Version© 2012 Gartner, Inc. and/or its affiliates. All rights reserved.
Gartner is a registered trademark of Gartner, Inc. or its affiliates.
CIO — Operations ManagementCurrent State Overview
■ The Department of Technology, Management and Budget (DTMB) is responsible for providing all InformationTechnology services to Michigan State Agencies.
– IT was consolidated in 2002 and then consolidated within DTMB in 2010.
■ The IT Organization has 1,544 employees (does not includes vacancies).
– Approximately 400 people retired from technology in the past year, and the majority of those retirements have not beenreplaced.
– The Department of Technology employs 354 contractors (includes agency services and infrastructure services).
■ DTMB has an operating budget of $414M (non-interface) which has increased by 17% since 2007.
■ DTMB has defined a 2010 –2014 IT strategic plan that lays forth six objectives and numerous guiding principals.
■ DTMB’s budgeting process uses a cost-recovery policy, where every expense is billed back to agencies. – DTMB’s baseline budgets are primarily defined through historical spending from previous years, and Agency Services costsare usually flat year-over-year because each agency has dedicated resources.
– Internal projects are usually not managed against fixed project budgets and the budgeting process does not drive projectprioritization.
■ DTMB has started to establish processes and tools to monitor projects and to manage resources.
– The annual Call For Projects is a three-year-old process that compiles and priortizes agency-specific and InfrastructureServices projects.
– DTMB has numerous tools and software packages in place to help with budgeting and resource planning. However, many
of these are not widely adopted or rigorously used (e.g., ChangePoint) and others are old and do not permit effectiveenterprise planning (e.g., Main).
■ DTMB has two types of SLA reports that are published monthly:
– Report on general statistics such as Enterprise Application Availability and Time to Restore Workstation
– Report on Red Card (mission-crititcal) applications status.

8/9/2019 A Current State Assessment-Finalv2 384036 7
http://slidepdf.com/reader/full/a-current-state-assessment-finalv2-384036-7 63/238
62
Engagement: 330002080 — Final Version© 2012 Gartner, Inc. and/or its affiliates. All rights reserved.
Gartner is a registered trademark of Gartner, Inc. or its affiliates.
CIO — Operations ManagementCurrent State Overview

8/9/2019 A Current State Assessment-Finalv2 384036 7
http://slidepdf.com/reader/full/a-current-state-assessment-finalv2-384036-7 64/238
63
Engagement: 330002080 — Final Version© 2012 Gartner, Inc. and/or its affiliates. All rights reserved.
Gartner is a registered trademark of Gartner, Inc. or its affiliates.
CIO — Operations ManagementCurrent State Overview — Center for Shared Solutions and Technology Partnerships (CSSTP)
■ CSSTP coordinates the development, maintenance and performance management of enterprise IT shared solutionsand provides a conduit for cross-boundary partnerships with agencies outside of State government.
– CSSTP operates as one unit, with a single entry point to reduce costs, provide more and better services tocitizens, and make crossing government lines seamless.
– Approximately 50 people work in CSSTP.
■ Current Services include:
– Intranet and Team Room Collaboration (SharePoint) — all State departments;
– Query and Reporting (BusinessObjects) — DHS, DCH, DTMB, MDARD, MDOT
– Data Transformation and Manipulation (IBM DataStage/QualityStage) — DCH, Treasury, DHS – GeoData Services (including base framework) — all State departments
– Bing Maps for Enterprise — various State departments and 15 county governments
– MiCloud Data Storage — MDOT, DTMB, DNR, DEQ.
■ Strategic Objectives of CSSTP:
– Increase communication and awareness of Shared Solutions role and portfolio.
– Improve decision making around the creation of shared solutions. – Increase efficiency through establishing more shared solutions.

8/9/2019 A Current State Assessment-Finalv2 384036 7
http://slidepdf.com/reader/full/a-current-state-assessment-finalv2-384036-7 65/238
64
Engagement: 330002080 — Final Version© 2012 Gartner, Inc. and/or its affiliates. All rights reserved.
Gartner is a registered trademark of Gartner, Inc. or its affiliates.
CIO — Operations Management Current State Overview — Michigan Public Safety Communications System (MPSCS)
■ Goal — The goal of the MPSCS is to be “the leading edge of public safety communications technology, leveragingthe technologies of broadband, Mobile Data, Computer-Aided Dispatch, Automatic Resource Locator (ARL), and
Asset Management hardware and software tools, while providing reliable interoperable communications as thefoundation for community safety and security by minimizing the financial and technological barriers throughinteragency cooperation.”
■ Customers Base and Customer Satisfaction — MPSCS subscribers have increased from 11,000 radios at the endof construction to 58,000 radios today.
– MPSCS works in close coordination with local government, neighboring state governments and federal agencies. Approximately 80% of users are local, with more than 1,000 different local agencies using MPSCS.
– Based on interviews, MPSCS is widely praised for its customer service. MSP noted that MPSCS provides excellent service,
but they are not adequately staffed and are not always able to service MSP vehicles often enough to keep them deployed inthe field.
■ Staffing — MPSCS staff has decreased from 110 to 72.
■ Funding — MPSCS’s annual budget is approximately $12 million, and the MPSCS budget has remained relativelyunchanged for the past eight years.
– MDOT is the only State agency to pay for MPSCS services, but it is estimated that agency subscriber fees would totalapproximately $3 million per year.
– Infrastructure improvements required to service local customers are paid for by the local customer. MPSCS then gives thelocal customer a credit valued at 50% the cost of the infrastructure improvement to be applied toward future fees.
■ MPSCS’s Outlook — MPSCS is well positioned to become a significant part of providing future mobility solutions toDTMB customers.
– In 2012, MPSCS will need to begin paying a $5 million maintenance fee to Motorola. It is currently unknown where thesefunds will come from.
CIO O i M

8/9/2019 A Current State Assessment-Finalv2 384036 7
http://slidepdf.com/reader/full/a-current-state-assessment-finalv2-384036-7 66/238
65
Engagement: 330002080 — Final Version© 2012 Gartner, Inc. and/or its affiliates. All rights reserved.
Gartner is a registered trademark of Gartner, Inc. or its affiliates.
CIO — Operations ManagementCurrent State Overview — Public Safety Communications in Other States
California Pennsylvania Florida Indiana
D e s c r i p t i o n
Several department-specific systems and
supporting infrastructures. Frequencies used:
800MHz, VHF low-band,VHF high-band, UHF.
State microwave systemleveraged forinterconnecting sites.
Data service is provided bythird-party entities and is
contracted out by eachdepartment.
PA-STARnet is an 800MHz trunked voice and
data communicationssystem which uses theproprietary OpenSkyprotocol.
Statewide microwavebackbone to supportsystem.
Their system currently hasa VHF overlay and is
planning for a UHFoverlay in the future.
Florida’s system, SLERS(Statewide Law Enforcement
Radio System) is an 800 MHztrunked voice communicationssystem.
Fire is on a separate VHFsystem and they are lookinginto P25 700 MHz for aircraft.
FIN (Florida InteroperabilityNetwork) operates in a gatewayfunction to promote
interoperability throughout theState.
Project HoosierSAFE-T is an 800
MHz trunked voiceand datacommunicationssystem.
O p e r a t i o n s
Departments own theirequipment, but it ismaintained by PublicSafety CommunicationsDivision (PSCD).
State-owned systemoperated by MA/COM(now Harris Corporation).
Public/Private partnership — MA/COM owns sites andcharges for their services.
State owns thesystem, but it isoperated by Motorola.
■
G o v e r n a n c
e
Responsibility for statewidestrategic planning is not
clearly defined. Public Safety Radio State
Planning Committee(PSRSPC) is responsiblefor State interoperabilityplanning.
The Office of PublicSafety Radio Services
(OPRS) provides generaloversight, managementand administration for thedesign, development andoperation of PA-STARNet.
Department of ManagedServices is responsible for
planning, but there is a boardthat has oversight andprioritization.
Integrated PublicSafety Commission is
responsible forstrategic direction andmaintaining thesystem.
CIO O ti M t

8/9/2019 A Current State Assessment-Finalv2 384036 7
http://slidepdf.com/reader/full/a-current-state-assessment-finalv2-384036-7 67/238
66
Engagement: 330002080 — Final Version© 2012 Gartner, Inc. and/or its affiliates. All rights reserved.
Gartner is a registered trademark of Gartner, Inc. or its affiliates.
CIO — Operations ManagementCurrent State Overview — Mapping DTMB against Gartner’s Framework
33%
35%
DTMB
55%10%
DTMB utilizes acentralized operatingmodel. Although agencyservices are stronglyaligned to the customer,they report to the Directorof Agency Services, whoreports to the CIO.
DTMB’s Delivery Model fallssomewhere between an
Asset and Process-optimized delivery model.
A large majority of Michigan State Agenciesexpect DTMB to enhance or transform their
business.
CIO O ti M t

8/9/2019 A Current State Assessment-Finalv2 384036 7
http://slidepdf.com/reader/full/a-current-state-assessment-finalv2-384036-7 68/238
67
Engagement: 330002080 — Final Version© 2012 Gartner, Inc. and/or its affiliates. All rights reserved.
Gartner is a registered trademark of Gartner, Inc. or its affiliates.
CIO — Operations ManagementCurrent State Overview — Current State Organizational Architecture
Asset Process Service Value
Tools/Automation Opportunistic devicemonitoring, help desk“ticketing” tools
“ERP" for IT "CRM" for IT IT back office “off theshelf”; significantinternal developmentfor retained competitiveadvantage
OrganizationalStructure
Functional or technicalsilos
Process/function matrixwith functional silosdominating
Process/function matrixwith multidisciplinaryprocess teams
dominating; somecompetency centersstaffed as internalconsultancies
IT-business matrixaround core businessprocesses or value
centers
Human Capital Technical expertise Process expertise Solution, relationshipand business expertise
Business expertise andinnovation expertise
Sourcing Mostly internal; some
external staffaugmentation
Mostly internal, some
selective outsourcingbased on “commodity”services
Strategic multi-
sourcing based onexplicitcompetitiveness ofinternal capabilities
Strategic multi-
sourcing based onbusiness corecompetencies andstrategic intent for IT
Organizational Architecture for IT Delivery Models
CIO O ti M t

8/9/2019 A Current State Assessment-Finalv2 384036 7
http://slidepdf.com/reader/full/a-current-state-assessment-finalv2-384036-7 69/238
68
Engagement: 330002080 — Final Version© 2012 Gartner, Inc. and/or its affiliates. All rights reserved.
Gartner is a registered trademark of Gartner, Inc. or its affiliates.
CIO — Operations ManagementCurrent State Overview — Current State Organizational Architecture (continued)
Asset Process Service Value
Process Design None Compliance to
“standard” (generallyITIL, possibly alsocombined withelements of CMMI,COBIT and Six Sigma)
Process improvements
correlated to requiredservice outcomes;outcomes measured inrelation to IT service-level agreements
IT process
improvementscorrelated to businessprocesses; outcomesmeasured in businessprocess or businessoutcome terms
Funding Fixed annual ITbudget; no chargeback
or chargeback basedon high-level allocation
Fixed annual IT budgetand chargeback
allocation forinfrastructure; possiblyzero-sum budgetingand chargeback forprojects
Cost or market-basedfee for service; zero-
sum budgeting
Market-based fee forservice; profit/loss-
based budget withdiscretionary revenuestream
CIO O ti M t

8/9/2019 A Current State Assessment-Finalv2 384036 7
http://slidepdf.com/reader/full/a-current-state-assessment-finalv2-384036-7 70/238
69
Engagement: 330002080 — Final Version© 2012 Gartner, Inc. and/or its affiliates. All rights reserved.
Gartner is a registered trademark of Gartner, Inc. or its affiliates.
CIO — Operations ManagementMajor Findings
■ DTMB has developed a strategic plan with high-level goals and
performance targets. Projects are included in the Call For Projects
process, but project costs estimates are not documented.
– Bottom Line: DTMB must determine project cost estimates anddetermine the funding required to complete these initiatives.
■ The DTMB annual budget is not composed of specific initiatives
and projects.
– Bottom Line: This prevents DTMB from achieving the granularity itneeds for scheduling, resource allocation, and prioritization ofactivities. Without this information, DTMB cannot work with the
agencies to prioritize resources or manage expectations, whichresults in customer frustration.
■ The DTMB annual budget consistently allocates costs to each
agency, but client project demands fluctuate every year.
Technology
Organization
ProcessStrategy
ServiceLevel
Current
– Bottom Line: The dedicated agency staff and the lack of project prioritization create unrealistic customerexpectations that exacerbate customer dissatisfaction.
■ Internal governance and customer-facing roles and responsibilities must be clearly defined.
– Bottom Line: Although some formal processes (including governance) are in place, processes need to be furtherdeveloped to ensure accountability between the IO and Infrastructure Services to best serve the agencies.
■ Agency Services has aligned resources to service specific agencies, which has created redundant
functions.
– Bottom Line: Several resources (project managers, programmers, DBAs, etc.) are solely dedicated to specificagencies, which has unevenly distributed skilled resources.
CIO Operations Management

8/9/2019 A Current State Assessment-Finalv2 384036 7
http://slidepdf.com/reader/full/a-current-state-assessment-finalv2-384036-7 71/238
70
Engagement: 330002080 — Final Version© 2012 Gartner, Inc. and/or its affiliates. All rights reserved.
Gartner is a registered trademark of Gartner, Inc. or its affiliates.
No or limited systems or toolsin place to support resource
tracking (e.g., personnel,
assets, budget).
Some systems or tools are inplace to support resource
tracking (e.g., personnel,
assets, budget).
Systems or tools to trackresources are present;
however, there is no
coordination or
standardization across the
enterprise to support resource
tracking.
Standard systems and tools tosupport resource tracking. DTMB is proactive in
researching various tools to
support resource tracking
(e.g., personnel, assets,
budget).
CIO — Operations ManagementCurrent State Technology Assessment
1 — Ad Hoc 2 — Reactive 3 — Challenged 4 — Managed 5 — Optimized
CIO Operations Management

8/9/2019 A Current State Assessment-Finalv2 384036 7
http://slidepdf.com/reader/full/a-current-state-assessment-finalv2-384036-7 72/238
71
Engagement: 330002080 — Final Version© 2012 Gartner, Inc. and/or its affiliates. All rights reserved.
Gartner is a registered trademark of Gartner, Inc. or its affiliates.
CIO — Operations ManagementCurrent State Technology Assessment Rationale
Strengths Weaknesses
Have basic tools in place that assist in communication and
creation of artifacts to document roles, responsibilities andprocesses (MS Office, ChangePoint, SharePoint, BusinessObjects, Main).
Basic nature of tools will, in time, cause difficulty as DTMB
matures its performance management functions. Lack of technology to make operations transparent across
organizations within DTMB exasperates the insular effect ofthe organizational silos.
Poor technology adoption (ChangePoint) prevents effectivebusiness analysis, operational overview and control:
‒ Inability to view real-time resource allocation
‒ Lack of measurement (cost, performance, etc.) preventseffective technology selection.
CIO Operations Management

8/9/2019 A Current State Assessment-Finalv2 384036 7
http://slidepdf.com/reader/full/a-current-state-assessment-finalv2-384036-7 73/238
72
Engagement: 330002080 — Final Version© 2012 Gartner, Inc. and/or its affiliates. All rights reserved.
Gartner is a registered trademark of Gartner, Inc. or its affiliates.
No clear organizational
structure or overall ownership
of responsibilities for resource
management across the
enterprise. Common attributes
include:
DTMB does not have enoughadequately trained staff tosupport resourcemanagement;
DTMB does not have apersonnel management planor strategy to ensure that
DTMB attracts and develops asufficient number ofadequately trained staff tosupport resourcemanagement;
DTMB has undefined rolesand responsibilities to supportresource management;
Functionally and technicallysiloed.
IT is run like a business and
ownership of client service
delivery responsibilities within
the enterprise exists, but the
organization is immature and
appropriate skill sets are not
present. Common attributes
include:
DTMB has staff that hasreceived some of thenecessary training (but needsmore training) to beadequately prepared to
support resourcemanagement;
DTMB inconsistently appliespersonnel developmentprocesses and does not havea defined hiring/recruiting planto address projected changesin the workforce (e.g.,significant number of potentialretirements, changingbusiness needs, etc.) tosupport resourcemanagement;
DTMB has inconsistentlyestablished roles andresponsibilities to supportresource management.
Ownership of client service
delivery responsibilities within
the enterprise exists, is fairly
mature, and exhibits some
best practices. Client service
delivery skill sets largely align
with IT support needs.
Common attributes include:
DTMB has adequately trainedresources but is understaffed,which limits the organization'sability to support resourcemanagement;
DTMB has a personnelmanagement plan or strategythat incorporates a definedtraining plan to developadequately trained staff tosupport resourcemanagement;
DTMB does not have adefined hiring/recruiting planto address projected changesin the workforce (e.g.,significant number of potentialretirements, changing
business needs, etc.) tosupport resourcemanagement;
DTMB has consistent anddocumented roles andresponsibilities to supportresource management.
Client service delivery
organization is integrated with
other key processes and IT
roles, and is appropriately
organized and staffed.
Common attributes include:
DTMB has a sufficient numberof adequately trainedresources to support resourcemanagement;
DTMB has a personnelmanagement plan or strategythat incorporates a defined
training plan to developadequately trained staff tosupport resourcemanagement;
DTMB has a definedhiring/recruiting plan toaddress projected changes inthe workforce to supportresource management;
DTMB has documented eachrole as responsible,accountable, consulted andinformed to support resource
management.
Client service delivery
processes are mature and
efficient. Common attribute,
include:
DTMB has a sufficient numberof proficient resources tosupport resourcemanagement;
DTMB has a personnelmanagement plan or strategythat incorporates a definedtraining plan to developadequately trained staff to
support resourcemanagement;
DTMB has a definedhiring/recruiting plan toaddress projected changes inthe workforce (e.g., significantnumber of potentialretirements, changingbusiness needs, etc.) tosupport resourcemanagement; Jobperformance is evaluated,enhanced and rewarded
based on defined objectivesto support resourcemanagement;
DTMB has documented eachrole as responsible,accountable, consulted andinformed to support resourcemanagement.
CIO — Operations ManagementCurrent State Organization Assessment
1 — Ad Hoc 2 — Reactive 3 — Challenged 4 — Managed 5 — Optimized
CIO Operations Management

8/9/2019 A Current State Assessment-Finalv2 384036 7
http://slidepdf.com/reader/full/a-current-state-assessment-finalv2-384036-7 74/238
73
Engagement: 330002080 — Final Version© 2012 Gartner, Inc. and/or its affiliates. All rights reserved.
Gartner is a registered trademark of Gartner, Inc. or its affiliates.
CIO — Operations ManagementCurrent State Organization Assessment Rationale
Strengths Weaknesses
Increasing economies of scale achieved as centralized
Infrastructure Services provide and adhere to technologystandardization.
‒ Consolidated data centers from 40 to three. Aligned Agency Services allow the IO to be responsive to
varying levels of business needs. Centralized model gives CIO authority to optimize
organizational structure as needed. MPSCS is widely praised for excellent customer service. Shared Services reaches out across traditional State, local
and federal government lines to leverage technology andmake services more effective and efficient.
DTMB’s cyber -security initiative is one of the mostaggressive in the nation:
‒ Established a Michigan Cyber-Command Center(MCCC), Michigan Intelligence Operations Center(MIOC) and Michigan Cyber-Defense Response Team(MCDRT) to prepare, manage and deal with the variety ofpotential and real electronic threats to the State ofMichigan
‒Pioneering partnerships with federal law enforcement.
The integration and communication between State of
Michigan agencies, Agency Services and InfrastructureServices is problematic for the following reasons:
‒ DTMB is organized to deliver on technology and IT goals,not business- or customer-oriented solutions and goals(see “General Observations” IT Skills Inventory)
‒ DTMB is organized around functional silos that do nothave end-to-end responsibility or accountability for theservice supplied to the customer (see “GeneralObservations” IT Skills Inventory and slides 40, 50)
‒
IOs are held accountable, but have no authority overinfrastructure services
‒ Functional Silos (IOs, EPMO, SS, IS, IS-PMO, EA, SS,CISO) permit expertise, but disparate efforts (e.g., thenumber and age of applications requires increasinglyspecialized and expensive personnel)
‒ Functional silos prevent sharing of resources andexpertise; successes in one functional silo do nottranslate into victories in another
• One example would be a technology or processachievement in one Information Officer’s agency notbeing communicated quickly and effectively to anagency under a different Information Officer.
CIO Operations Management

8/9/2019 A Current State Assessment-Finalv2 384036 7
http://slidepdf.com/reader/full/a-current-state-assessment-finalv2-384036-7 75/238
74
Engagement: 330002080 — Final Version© 2012 Gartner, Inc. and/or its affiliates. All rights reserved.
Gartner is a registered trademark of Gartner, Inc. or its affiliates.
CIO — Operations ManagementCurrent State Organization Assessment Rationale (continued)
Strengths Weaknesses (continued)
Enterprise Architecture reports to head of infrastructure
services, weakening enterprisewide impact, accountabilityand authority.
DTMB currently has a Chief Technology Officer, but thatrole is combined with Director of Infrastructure Services.Gartner contends the CTO must exist in a stand-alonedepartment in charge of innovation.
‒ No specific owner or product manager for innovation andintroduction of new technologies (e.g., Mobile) to DTMB’scustomers.
DTMB cannot effectively articulate its business valuebecause there is no centralized owner or manager of aservice portfolio.
‒ Erodes customer confidence in DTMB.
‒ DTMB is unable to compare its services to open market,denying DTMB the knowledge of its competitiveadvantages and disadvantages.
Inability to hire needed skills leads to contract hiring that ismore expensive.
‒ Hinders succession planning.
‒ Restricts resource utilization, and planning varies fromInformation Officer to Information Officer.

8/9/2019 A Current State Assessment-Finalv2 384036 7
http://slidepdf.com/reader/full/a-current-state-assessment-finalv2-384036-7 76/238
CIO Operations Management

8/9/2019 A Current State Assessment-Finalv2 384036 7
http://slidepdf.com/reader/full/a-current-state-assessment-finalv2-384036-7 77/238
76
Engagement: 330002080 — Final Version© 2012 Gartner, Inc. and/or its affiliates. All rights reserved.
Gartner is a registered trademark of Gartner, Inc. or its affiliates.
CIO — Operations ManagementCurrent State Process Assessment Rationale
Strengths Weaknesses
Utilize ITIL Incident Management to track Agencyapplication availability.
Day Start phone reviews major events and issues forDTMB.
‒ Includes majority of executives responsible for deliveringservices to the customer.
‒ Significant events are followed up with repeat progressreports throughout the day.
Some Agency Services utilize SUITE or Agile.
DTMB sets policy and procedure for social media activities
and monitors State of Michigan social media activity.
DTMB does regular reviews and updates of ongoingprojects.
Call For Projects is an annual process, but the portfolioplanning aspects of that process are not built in to the day-
to-day processes.
Various organizations within DTMB are not able to quantifythe value they add to the service supply chain (all groupsmust act to ensure appropriate service, but little overarchingprioritization).
‒ Specialization causes too much focus on specific tasks orprojects rather than an understanding of the overallimpact on the business.
Initiatives, operations and capital investment projects arenot managed to a budget.
‒ ROI analysis that demonstrates costs and benefits of agiven proposed project is not completed for each project.
‒ Unable to quantify return on investment becauseenterprise-level strategic investment does not occur.
Performance Management metrics are not used to quantifycost, resources and timelines of various objectives andgoals within DTMB.
‒Inability to make optimized sourcing decisions.
‒ Inability to optimize resources, leading to projectmismanagement and decreased business performance.
Inconsistent use of project management standardmethodology in that some projects use SUITE, some use Agile and some do not use either methodology.
CIO — Operations Management

8/9/2019 A Current State Assessment-Finalv2 384036 7
http://slidepdf.com/reader/full/a-current-state-assessment-finalv2-384036-7 78/238
77
Engagement: 330002080 — Final Version© 2012 Gartner, Inc. and/or its affiliates. All rights reserved.
Gartner is a registered trademark of Gartner, Inc. or its affiliates.
CIO — Operations ManagementCurrent State Process Assessment Rationale (continued)
Strengths Weaknesses (continued)
Ineffective enterprise-level portfolio planning and
prioritization lead to projects not starting and existingprojects not finishing.
‒ Ongoing legacy systems upgrades lead to excessivecosts and business service impairment.
‒ Smaller projects are never initiated because the majorityof resources are focused on legacy systems upgrades.
Perceived lack of agency involvement in the definition ofbusiness requirements for IT services.
‒ IT Skills survey reveals weakness in business analysis
and requirements definition when compared to technicalskills.
CIO — Operations Management
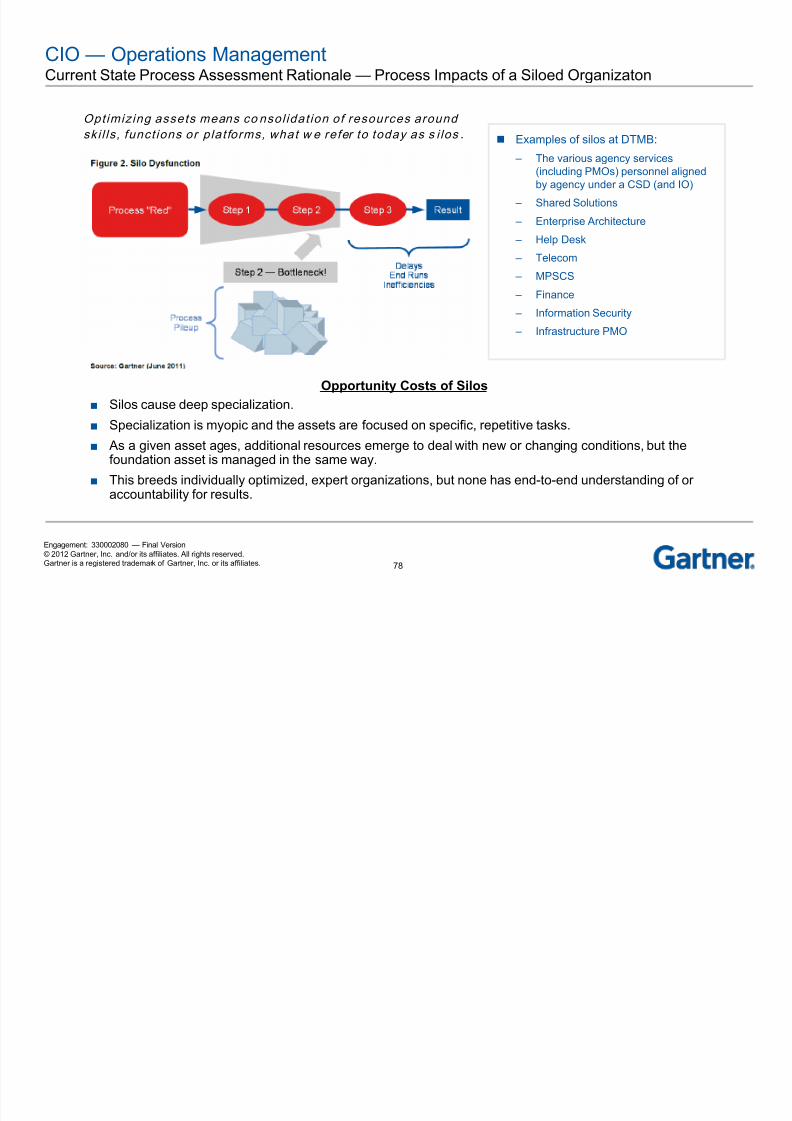
8/9/2019 A Current State Assessment-Finalv2 384036 7
http://slidepdf.com/reader/full/a-current-state-assessment-finalv2-384036-7 79/238
78
Engagement: 330002080 — Final Version© 2012 Gartner, Inc. and/or its affiliates. All rights reserved.
Gartner is a registered trademark of Gartner, Inc. or its affiliates.
CIO Operations ManagementCurrent State Process Assessment Rationale — Process Impacts of a Siloed Organizaton
Examples of silos at DTMB:
– The various agency services(including PMOs) personnel alignedby agency under a CSD (and IO)
– Shared Solutions
– Enterprise Architecture
– Help Desk
– Telecom
– MPSCS
– Finance
– Information Security
– Infrastructure PMO
Opportunity Costs of Silos
■ Silos cause deep specialization.
■ Specialization is myopic and the assets are focused on specific, repetitive tasks.■ As a given asset ages, additional resources emerge to deal with new or changing conditions, but the
foundation asset is managed in the same way.
■ This breeds individually optimized, expert organizations, but none has end-to-end understanding of oraccountability for results.
Opt imiz ing assets means co nsol idat ion of resources around
ski l ls , funct ions or plat forms, what w e refer to today as s i los .
CIO — Operations Management

8/9/2019 A Current State Assessment-Finalv2 384036 7
http://slidepdf.com/reader/full/a-current-state-assessment-finalv2-384036-7 80/238
79
Engagement: 330002080 — Final Version© 2012 Gartner, Inc. and/or its affiliates. All rights reserved.
Gartner is a registered trademark of Gartner, Inc. or its affiliates.
There is no resourcemanagement strategy or
strategic planning function.
Common attributes include:
DTMB has no enterprisestrategic plan;
Strategic planning is notperformed across theorganization;
DTMB does not proactivelymonitor or respond to industryand technology trends.
High-level resourcemanagement strategy is
defined but does not have
measurable objectives.
Common attributes include:
Each service (e.g., enterprisearchitecture, security, etc.)has an individual strategy, butthese individual strategies donot take into account thewider organization nor arethey communicatedenterprisewide;
Strategic planning efforts donot take into account thewider organization nor arethey communicatedenterprisewide;
DTMB inconsistently monitorsand responds to industry andtechnology trends but is notconsistent across theenterprise.
Strategy is defined andcommunicated; however, it is
not effectively translated into
consistent action. Common
attributes include:
Technology strategy isexplicitly aligned with businessgoals;
A high-level enterprisestrategy that aligns with theState's overall strategy isdefined and is communicatedenterprisewide;
Strategic plans for DTMB aredefined and communicated;however, they are nottranslated into action;
DTMB consistently monitorsand opportunistically respondsto industry and technologytrends across the enterprise.
Resource managementstrategy is clearly defined,
communicated and socialized
throughout the enterprise.
Common attributes include:
A detailed enterprise strategythat aligns with the State'soverall strategy is definedand is communicatedenterprisewide;
The strategic plan includesdiscrete IT initiatives that aredefined and prioritized intoan actionable road map thatsupports the IT Strategy;
Resource managementstrategy is clearly defined,communicated andsocialized throughout theenterprise;
Tools, organization andprocesses are aligned tooversee and ensure theexecution of the strategy;
DTMB consistently monitorsand opportunistically
responds to industry andtechnology trends across theenterprise and inconsistentlyinvests in innovation acrossthe enterprise.
Client service delivery strategyspans the business and is
integrated into enterprise strategic
planning, is continually reviewed,
and the strategy is updated to align
with business objectives. Common
attributes include:
A detailed enterprise strategy thataligns with the State's overallstrategy is defined and iscommunicated enterprisewide;
The strategic plan includes discreteIT initiatives that are defined andprioritized into an actionable roadmap that supports the IT Strategy;
The strategic plan has clearlydefined measures for success;
Strategic planning is holistic,continually reviewed, and thestrategy is updated to align withbusiness objectives;
Strategy is clearly defined andcommunicated throughout theenterprise;
Tools, organization and processesare aligned to oversee and ensure
the execution of the strategy; DTMB consistently monitors and
opportunistically responds toindustry and technology trendsacross the enterprise andconsistently invests in innovationacross the enterprise;
DTMB has an established innovationcenter.
CIO Operations ManagementCurrent State Strategy Assessment
1 — Ad Hoc 2 — Reactive 3 — Challenged 4 — Managed 5 — Optimized
CIO — Operations Management

8/9/2019 A Current State Assessment-Finalv2 384036 7
http://slidepdf.com/reader/full/a-current-state-assessment-finalv2-384036-7 81/238
80
Engagement: 330002080 — Final Version© 2012 Gartner, Inc. and/or its affiliates. All rights reserved.
Gartner is a registered trademark of Gartner, Inc. or its affiliates.
CIO Operations ManagementCurrent State Strategy Assessment Rationale
Strengths Weaknesses
DTMB has a documented and goal-oriented strategic plan
(ICT 2010 –2014 Strategic Plan) which provides excellentbusiness context.
The State has established a $2.5 million ICT InnovationManagement Fund.
DTMB received five NASCIO awards in 2011.
DTMB’s strategic plan has six objectives (goals) that do not
have measurable objectives.
DTMB’s strategic plan has identified projects but has notestimated costs for completing these projects.
There is no cohesive annual operational plan linking thevarious departments with defined projects, resources andprioritization all working toward a common goal.
No defined service portfolio that communicates services interms of business value to the customers.
Activities occurring within individual IT groups focus ontechnology solutions (e.g., SOM Mobile Strategy) and arenot linked to the overall strategy.
Inadequate enterprisewide strategic messaging
CIO — Operations Management

8/9/2019 A Current State Assessment-Finalv2 384036 7
http://slidepdf.com/reader/full/a-current-state-assessment-finalv2-384036-7 82/238
81
Engagement: 330002080 — Final Version© 2012 Gartner, Inc. and/or its affiliates. All rights reserved.
Gartner is a registered trademark of Gartner, Inc. or its affiliates.
CIO Operations ManagementCurrent State Strategy Assessment Rationale — NASCIO Awards
■ The State of Michigan has been awarded a number of accolades over the past several years thatexhibit its commitment to executing on its strategic vision for IT.
■ 2011 NASCIO Awards
– Data, Information and Knowledge Management — Department of Human Services Decision Support System
– Digital Government: Government to Business — USAHerds Cattle Tracking Protecting our Food Supply
– Enterprise IT Management Initiatives — Optimizing Government Technology Value: Establishing EnterpriseMetrics to Ensure Operational Readiness and Business Availability
– Fast Track Solutions — MiCloud Automated Hosting Service
– Information Communication Technology (ICT) Innovations — Michigan Building Intelligence System
■ 2010 NASCIO Awards
– Government Cloud Protection Program: Disaster Recovery Services Transformed for the Perfect Storm
■ 2009 NASCIO Awards
– Standard Desktop Environment
– Secure Wireless LAN
CIO — Operations Management

8/9/2019 A Current State Assessment-Finalv2 384036 7
http://slidepdf.com/reader/full/a-current-state-assessment-finalv2-384036-7 83/238
82
Engagement: 330002080 — Final Version© 2012 Gartner, Inc. and/or its affiliates. All rights reserved.
Gartner is a registered trademark of Gartner, Inc. or its affiliates.
CIO Operations ManagementCurrent State Strategy Assessment Rationale — Strategic Planning Process
IT Budget
Business Strategy
BoardSummary
Used to give the “elevator pitch” of the IT strategy, it typically consists of a one-or two-page PowerPointpresentation with four components: how the business will win, including capabilities needed; how IT willcontribute to business success; implications for the supply side of IT; and financial implications
IT Strategy
The main body of this should be 15 –20 pages at most—the shorter the better. This document sets the strategicdirection for IT’s contribution to business success, without defining the detailed plan. It should be written to
survive the long-term planning horizon of the business (three-to-five years). It will be explored in detail in therest of this report.
ITStrategic
Plan
This is a detailed, rolling plan of the major initiatives to be executed by the IT organization in growing ortransforming the business. This would normally be very detailed for the short-term planning horizon (12 –18months), with high-level vision for the medium and long-term planning horizons (three-to-five years or longer).The plan should typically include a Gantt chart showing the initiatives over time, success metrics for eachphase, resources (human, financial and other) needed for each phase and an investment view of the initiativesshowing the portfolio mix in terms of value, risk and size of investment.
ITOperating
Plan
A detailed plan of the operations of the IT organization, focused on run-the-business IT for the short term,typically documenting assets of the organization and success metrics for running them. Assets normallycovered are people, information, application portfolio and infrastructure.
■ Gartner used the following Strategic Planning framework to assess DTMB’s strategic planningprocess.
CIO — Operations Management

8/9/2019 A Current State Assessment-Finalv2 384036 7
http://slidepdf.com/reader/full/a-current-state-assessment-finalv2-384036-7 84/238
83
Engagement: 330002080 — Final Version© 2012 Gartner, Inc. and/or its affiliates. All rights reserved.
Gartner is a registered trademark of Gartner, Inc. or its affiliates.
CIO Operations ManagementCurrent State Strategy Assessment Rationale — DTMB Strategic Planning Process
Board Summary “To be the most innovative IT organization in the world”
IT Strategy Access: Provide exceptional services to Michigan citizens and businesses anytime, anywhere Service: Deliver efficient and effective technology services and shared solutions Strengthen operations and security through statewide solutions and universal standards Workplace: Support a talented and engaged workforce Cross-Boundary Solutions: Accelerate partnerships across and beyond state government Innovation and Transformation: Drive innovation and technology to transform Michigan government
IT Strategic Plan Expansion of Data Sharing Social Networking Service Michigan College Access
Network Parolee Self-Service Check-in
Kiosks Eligibility Information Sharing Child Welfare System
Modernization Unemployment Insurance
Modernization Driver’s License System
Modernization
Intelligent TransportationSystems
Statewide Skills Alliance Tax Registration Modernization Fraud Detection MiCloud Unified Communications E-Discovery Disaster Recovery Resources Desktop Virtualization Workforce/Succession Planning Innovation and Performance
Management Program Comprehensive On-Boarding
Program
DTMB Virtual University Employee Recognition Job-Shadowing Program Diversity Awareness Data Exchange with Major Utility
Companies Data Sharing with Michigan United
Way Health IT Broadband Expansion User-centered Design Shared-
services Team
IT Operating Plan
Both the goals in the IT Strategy and theInitiatives in the IT Strategic Plan lack
specific resources, timelines and metricsfor measuring success.
IT Budget
Business Strategy
There is no Operating Plan to execute thedefined initiatives or that aligns the ITbudget with the IT Strategic Plan.
CIO — Operations Management

8/9/2019 A Current State Assessment-Finalv2 384036 7
http://slidepdf.com/reader/full/a-current-state-assessment-finalv2-384036-7 85/238
84
Engagement: 330002080 — Final Version© 2012 Gartner, Inc. and/or its affiliates. All rights reserved.
Gartner is a registered trademark of Gartner, Inc. or its affiliates.
C O Ope at o s a age e tCurrent State Strategy Assessment Rationale — ITBE Survey Results
CIO — Operations Management

8/9/2019 A Current State Assessment-Finalv2 384036 7
http://slidepdf.com/reader/full/a-current-state-assessment-finalv2-384036-7 86/238
85
Engagement: 330002080 — Final Version© 2012 Gartner, Inc. and/or its affiliates. All rights reserved.
Gartner is a registered trademark of Gartner, Inc. or its affiliates.
Resource management
metrics are not clearly
defined. Common attributes
include:
DTMB has not identified anyservice level objectives tied tothe objectives/needs of itsexecutive team or thecustomer agencies.
Basic resource management
metrics exist, but performance
is not effectively measured.
Common attributes include:
DTMB has informal servicelevel objectives tied toobjectives/needs of theexecutive team and customeragencies;
No objectives or metrics aredefined across the enterprise.
Resource management
metrics are established, but
performance is not effectively
measured. Common attributes
include:
DTMB has defined anddocumented service levelobjectives tied toobjectives/needs of theexecutive team and customeragencies, but performance isnot measured;
No objectives or metrics are
defined across the enterprise.
Resource management
metrics are established, and
the organization is
accountable to other groups
within DTMB. Common
attributes include:
DTMB has clearly defined anddocumented service levelobjectives tied toobjectives/needs of theexecutive team and customeragencies;
DTMB has formal processes
in place for measuringDTMB's performance againstthe objectives;
DTMB is managing to agreed-upon service levels.
Resource management
metrics are established, and
the organization is fully
accountable to other groups
within DTMB. Common
attributes include:
Integrated reporting ofperformance and ongoingimprovement within eachcustomer-agency andenterprisewide.
p gCurrent State Service Level Assessment
1 — Ad Hoc 2 — Reactive 3 — Challenged 4 — Managed 5 — Optimized
CIO — Operations Management

8/9/2019 A Current State Assessment-Finalv2 384036 7
http://slidepdf.com/reader/full/a-current-state-assessment-finalv2-384036-7 87/238
86
Engagement: 330002080 — Final Version© 2012 Gartner, Inc. and/or its affiliates. All rights reserved.
Gartner is a registered trademark of Gartner, Inc. or its affiliates.
p gCurrent State Service Level Assessment Rationale
Strengths Weaknesses
DTMB updates SLA metrics monthly and provides them to
the agencies. DTMB has documented service-level agreements.
DTMB conducts real-time monitoring of red card applicationstatus. Red card application status metrics are usually inthe high 90% range.
SLA metrics are not linked to customer value.
‒7% of customers feel that current SLAs meet their needs(see slide 85)
‒ Inability to understand what matters to DTMB's customer
‒ The SLA metrics that are provided to the customer arenot meaningful in that there are few consequences toDTMB not meeting those SLAs.Inconsistent DTMBmetrics prevent effective measurement.
Currently not able to report project status, how much theycost and which benefits those projects will deliver.
CIO — Operations Management

8/9/2019 A Current State Assessment-Finalv2 384036 7
http://slidepdf.com/reader/full/a-current-state-assessment-finalv2-384036-7 88/238
87
Engagement: 330002080 — Final Version© 2012 Gartner, Inc. and/or its affiliates. All rights reserved.
Gartner is a registered trademark of Gartner, Inc. or its affiliates.
p gCurrent State Service Level Assessment Rationale — ITBE Survey Results

8/9/2019 A Current State Assessment-Finalv2 384036 7
http://slidepdf.com/reader/full/a-current-state-assessment-finalv2-384036-7 89/238
88
Engagement: 330002080 — Final Version© 2012 Gartner, Inc. and/or its affiliates. All rights reserved.
Gartner is a registered trademark of Gartner, Inc. or its affiliates.
Applications
Current State Assessment and Maturity Analysis
Current State =
Target State =
Applications

8/9/2019 A Current State Assessment-Finalv2 384036 7
http://slidepdf.com/reader/full/a-current-state-assessment-finalv2-384036-7 90/238
89
Engagement: 330002080 — Final Version© 2012 Gartner, Inc. and/or its affiliates. All rights reserved.Gartner is a registered trademark of Gartner, Inc. or its affiliates.
ppGartner Framework — Applications
Applications covers more than just the software development life cycle (SDLC); it involves the overallmanagement of the application portfolio, as well as all aspects of managing application developmentprojects and ongoing maintenance.
Business Alignment,Engagement and
Accountability
Application Portfolio Management
Staffing, Skills and Sourcing
Vendor Management
Software Processes
Project Portfolio Management
Financial Analysis and Budgets
Management of Architecture
Operations and Support
+

8/9/2019 A Current State Assessment-Finalv2 384036 7
http://slidepdf.com/reader/full/a-current-state-assessment-finalv2-384036-7 91/238
Applications

8/9/2019 A Current State Assessment-Finalv2 384036 7
http://slidepdf.com/reader/full/a-current-state-assessment-finalv2-384036-7 92/238
91
Engagement: 330002080 — Final Version© 2012 Gartner, Inc. and/or its affiliates. All rights reserved.Gartner is a registered trademark of Gartner, Inc. or its affiliates.
Current State Overview (continued)
Financial Analysis and Budgets
■ No total cost of ownership by application is being calculated today, and it would be very difficult to distribute all ITcosts to individual applications.
Software Processes
■ SUITE methodology has been established, but adherence to it is mixed throughout the organization.
■ Quality Assurance personnel and processes are organized/implemented differently within each of the AgencyServices development teams.
Operations and Support
■ No Operating Level Agreements in place today between IT groups.■ Some parts of service level reporting are useful, but not others; not all pieces are on the service level reports that
need to be there.
Applications

8/9/2019 A Current State Assessment-Finalv2 384036 7
http://slidepdf.com/reader/full/a-current-state-assessment-finalv2-384036-7 93/238
92
Engagement: 330002080 — Final Version© 2012 Gartner, Inc. and/or its affiliates. All rights reserved.Gartner is a registered trademark of Gartner, Inc. or its affiliates.
Current State Overview — Organizational Model
Applications

8/9/2019 A Current State Assessment-Finalv2 384036 7
http://slidepdf.com/reader/full/a-current-state-assessment-finalv2-384036-7 94/238
93
Engagement: 330002080 — Final Version© 2012 Gartner, Inc. and/or its affiliates. All rights reserved.Gartner is a registered trademark of Gartner, Inc. or its affiliates.
Major Findings
Technology
Organization
ProcessStrategy
ServiceLevel
Current
■ There are numerous programming languages and development
tools in place that are not standardized across development
teams. – Bottom Line: Platform complexity is driving higher costs and the
need for more programmers.
■ Application Portfolio Management (APM) is still in its infancy,
which limits the ability to proactively retire older technology
platforms.
– Bottom Line: The lack of APM results in reactive, tactical decisionsfor applications on older platforms that cannot be modified in order
to avoid very diff icult-to-resolve outages.
■ The SUITE methodology is robust and aligns to industry best
practices, but adherence to it and associated quality standards
are inconsistent.
– Bottom Line: Lack of development standardization is leading tovariability in customer satisfaction and the ability to be on time andon budget with application projects.
■ Supporting resources for development are distributed among thevarious development teams.
– Bottom Line: The current organizational structure underneath eachInformation Officer is contributing to variability in developmentprocesses, policies and procedures across the agencies.

8/9/2019 A Current State Assessment-Finalv2 384036 7
http://slidepdf.com/reader/full/a-current-state-assessment-finalv2-384036-7 95/238
ApplicationsC S T h l A R i l

8/9/2019 A Current State Assessment-Finalv2 384036 7
http://slidepdf.com/reader/full/a-current-state-assessment-finalv2-384036-7 96/238
95
Engagement: 330002080 — Final Version© 2012 Gartner, Inc. and/or its affiliates. All rights reserved.Gartner is a registered trademark of Gartner, Inc. or its affiliates.
Current State Technology Assessment Rationale
Strengths Weaknesses
Utilizing many industry-standard tools for code
development, code versioning, documentation and testingon newer platforms, such as Rational and Mercury.
Newer development is occurring on Microsoft .NET andJava-based platforms.
Usage of ChangePoint tool is a good start towardperforming application portfolio management.
There are many more programming languages and
support/testing tools in place than the benchmarkingaverage.
Each agency team is using its own set of “standard” toolsfor code development, code versioning, documentation andtesting.
Several critical applications in some agencies are usingvery old technology platforms.
Incomplete attribute data set on applications withinChangePoint will limit the ability to use it as a true
application portfolio management tool.
ApplicationsC t St t T h l A t R ti l DBMS O ti S t L

8/9/2019 A Current State Assessment-Finalv2 384036 7
http://slidepdf.com/reader/full/a-current-state-assessment-finalv2-384036-7 97/238
96
Engagement: 330002080 — Final Version© 2012 Gartner, Inc. and/or its affiliates. All rights reserved.Gartner is a registered trademark of Gartner, Inc. or its affiliates.
Database Technology
Name (List all the DBMS in use )
SQL Server
FILEMAKER
ACCESS
ORACLE
Flat Files
Teradata
FoxPro
DB2
IDMS
IMS
UNISYS DMSII
POSTGRES
BLLIBIndexed files (keyed I/O files)
Operating Systems
Name (List all operating system s in use )
Windows XP
Windows Server 2003
Windows Server 2008
MCP
Unix - Sun Solaris
Windows 7
Windows Server 2008 R2
TeradataUnix - HP
Unix - Linux
Windows NT
Linux-SUSE
Linux--Red Hat
BL/SOURCE, CANDE, BL/SCHED, BL/LIB
Novell
Programming Languages
Name (List all Languages in use )
C#.Net
SQL
ASP.NET
FileMaker Scripts
Crystal Reports Scripts
Siebel
Visual Basic
Microfocus for COBOL
Cognos
Access
Active Reports
ASP
ASP.NET
Business Objects
COBOL
COM+
Crystal Reports
DTS
Foxpro
HTML
Java
Java Script
Microsoft IIS
MS SQL Server
Oracle
Oracle Forms
Oracle SQL
PL SQL
Programming Languages
Name (List all Languages in use )
Rbase
Script Unix
Unix Commands
unix shell scripts
VB Script
VB.NET
Visual Basic
XML
XSLT
PHP
PERL
Cold Fusion
SAS
Jquery
SSIS
AS{/MET
ALGOL
DMALGOL
C++
Xgen
Python
CSS
Jquery(JS)
DELPHI
DOS
ABAP
PEOPLECODE
Current State Technology Assessment Rationale — DBMSs, Operating Systems, Languages
ApplicationsC t St t T h l A t R ti l S t/T ti T l

8/9/2019 A Current State Assessment-Finalv2 384036 7
http://slidepdf.com/reader/full/a-current-state-assessment-finalv2-384036-7 98/238
97
Engagement: 330002080 — Final Version© 2012 Gartner, Inc. and/or its affiliates. All rights reserved.Gartner is a registered trademark of Gartner, Inc. or its affiliates.
Current State Technology Assessment Rationale — Support/Testing Tools
ApplicationsC t St t T h l A t R ti l S t/T ti T l ( ti d)

8/9/2019 A Current State Assessment-Finalv2 384036 7
http://slidepdf.com/reader/full/a-current-state-assessment-finalv2-384036-7 99/238
98
Engagement: 330002080 — Final Version© 2012 Gartner, Inc. and/or its affiliates. All rights reserved.Gartner is a registered trademark of Gartner, Inc. or its affiliates.
Current State Technology Assessment Rationale — Support/Testing Tools (continued)
ApplicationsCurrent State Organization Assessment

8/9/2019 A Current State Assessment-Finalv2 384036 7
http://slidepdf.com/reader/full/a-current-state-assessment-finalv2-384036-7 100/238
99
Engagement: 330002080 — Final Version© 2012 Gartner, Inc. and/or its affiliates. All rights reserved.Gartner is a registered trademark of Gartner, Inc. or its affiliates.
Current State Organization Assessment
DTMB does not have defined
roles/responsibilities orenough adequately trained
staff for the following
activities:
■ Application planning■ Application analysis■ Application design■ Application portfolio
management■ Business process architecture■ Data modeling■ Database design
■ Software engineering■ Change management■ Configuration management■ Release management■ Testing■ Quality assurance■ Product turnover
DTMB has inconsistently
established roles andresponsibilities for the
following activities:
DTMB has staff that has
received some of the
necessary training (but needs
more training) to be
adequately prepared for the
following activities:
■ Application planning■ Application analysis■ Application design
■ Application portfoliomanagement
■ Business process architecture■ Data modeling■ Database design■ Software engineering■ Change management■ Configuration management■ Release management■ Testing■ Quality assurance■ Product turnover
DTMB has consistently
documented roles andresponsibilities for the
following activities:
DTMB has adequately trained
resources to manage
resources but is understaffed,
which limits their ability to
perform the following
activities:
■ Application planning■ Application analysis■ Application design
■ Application portfoliomanagement
■ Business process architecture■ Data modeling■ Database design■ Software engineering■ Change management■ Configuration management■ Release management■ Testing■ Quality assurance■ Product turnover
DTMB has documented each
role as responsible,accountable, consulted and
informed for the following
activities:
DTMB has a sufficient number
of adequately trained staff for
the following activities:
■ Application planning■ Application analysis■ Application design■ Application portfolio
management
■ Business process architecture■ Data modeling■ Database design■ Software engineering■ Change management■ Configuration management■ Release management■ Testing■ Quality assurance■ Product turnover
DTMB has a defined sourcing
strategy that evaluates theoptimal distribution of
insourced and outsourced
resources; DTMB has
optimized the number of
adequately trained staff to
manage resources across the
enterprise; This includes the
identification of resources that
should be pooled and shared
across the enterprise;
DTMB has documented each
role as responsible,
accountable, consulted andinformed for the following
activities:
■ Application planning■ Application analysis■ Application design■ Application portfolio
management■ Business process architecture■ Data modeling■ Database design■ Software engineering
■ Change management■ Configuration management■ Release management■ Testing■ Quality assurance■ Product turnover
1 — Ad Hoc 2 — Reactive 3 — Challenged 4 — Managed 5 — Optimized
ApplicationsCurrent State Organization Assessment Rationale
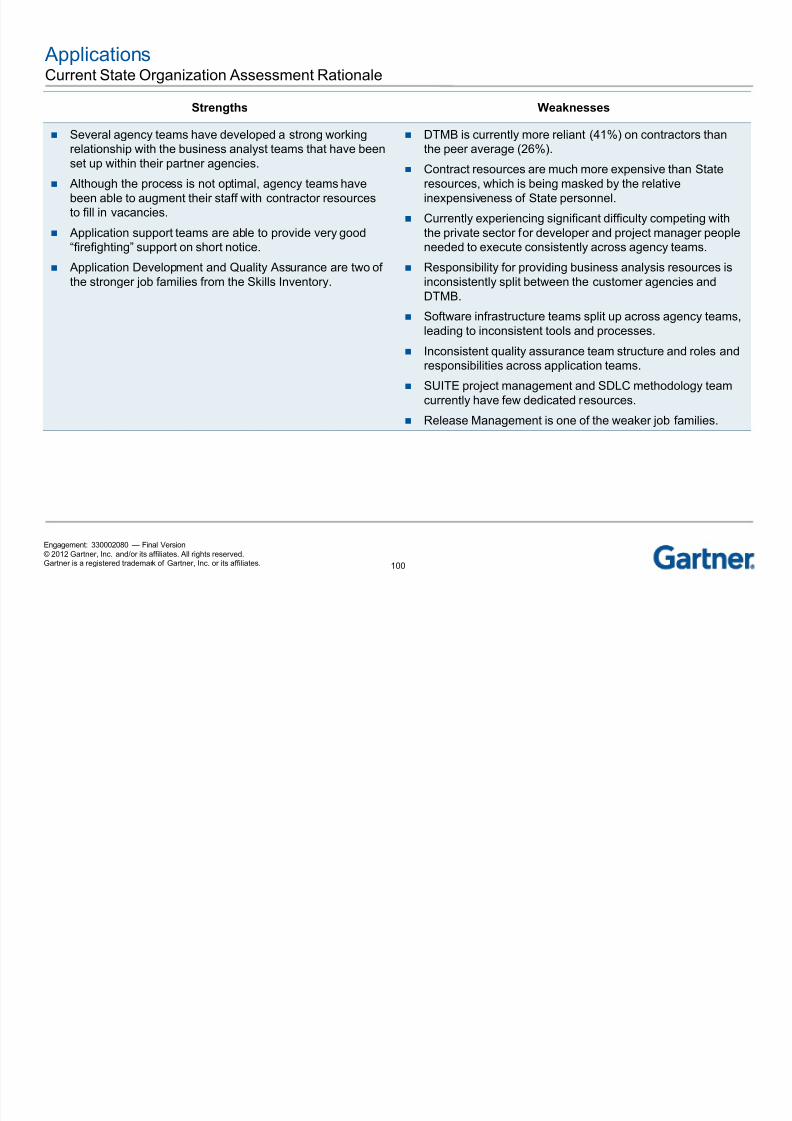
8/9/2019 A Current State Assessment-Finalv2 384036 7
http://slidepdf.com/reader/full/a-current-state-assessment-finalv2-384036-7 101/238
100
Engagement: 330002080 — Final Version© 2012 Gartner, Inc. and/or its affiliates. All rights reserved.Gartner is a registered trademark of Gartner, Inc. or its affiliates.
Current State Organization Assessment Rationale
Strengths Weaknesses
Several agency teams have developed a strong working
relationship with the business analyst teams that have beenset up within their partner agencies.
Although the process is not optimal, agency teams havebeen able to augment their staff with contractor resourcesto fill in vacancies.
Application support teams are able to provide very good“firefighting” support on short notice.
Application Development and Quality Assurance are two ofthe stronger job families from the Skills Inventory.
DTMB is currently more reliant (41%) on contractors than
the peer average (26%). Contract resources are much more expensive than State
resources, which is being masked by the relativeinexpensiveness of State personnel.
Currently experiencing significant difficulty competing withthe private sector for developer and project manager peopleneeded to execute consistently across agency teams.
Responsibility for providing business analysis resources isinconsistently split between the customer agencies and
DTMB.
Software infrastructure teams split up across agency teams,leading to inconsistent tools and processes.
Inconsistent quality assurance team structure and roles andresponsibilities across application teams.
SUITE project management and SDLC methodology teamcurrently have few dedicated resources.
Release Management is one of the weaker job families.
Applications Current State Organization Assessment Rationale Benchmark: FTE by Source

8/9/2019 A Current State Assessment-Finalv2 384036 7
http://slidepdf.com/reader/full/a-current-state-assessment-finalv2-384036-7 102/238
101
Engagement: 330002080 — Final Version© 2012 Gartner, Inc. and/or its affiliates. All rights reserved.Gartner is a registered trademark of Gartner, Inc. or its affiliates.
FTE by Source■ State of Michigan’s staff size at
787.1 FTEs is 3% less than the
peer 25th percentile.
■ With fixed-price outsourcedcosts, staff size increases by42.1 FTEs and is 14% higherthan the peer 75th percentile and20% higher than the peeraverage.
■ State of Michigan supplemental
workforce represents 41%,compared with the peer at 26%(319.1FTEs compared with248.3 FTEs for the peer).
Current State Organization Assessment Rationale — Benchmark: FTE by Source
Applications Current State Organization Assessment Rationale Benchmark: FTE by Job Category

8/9/2019 A Current State Assessment-Finalv2 384036 7
http://slidepdf.com/reader/full/a-current-state-assessment-finalv2-384036-7 103/238
102
Engagement: 330002080 — Final Version© 2012 Gartner, Inc. and/or its affiliates. All rights reserved.Gartner is a registered trademark of Gartner, Inc. or its affiliates.
■ State of Michigan developer FTEs at 542.2 indicates a high number compared with the peeraverage. There is a variance of 9% higher compared with the peer average.
■ State of Michigan is utilizing significantly more Quality Assurance resources, which would indicatethe need for a centralized Quality Assurance Function.
■ There are significantly less Business Analysts than in peer organizations— 64% less than the peeraverage. Business Analysts for the peer group reside in IT and in the State Agencies.
■ Project Management resources are less than the peer average and the peer 25th percentile, whileManagement resources are in range of the peer 75th percentile.
■ Management resources at 81.4 FTEs is high compared to the 75th percentile.■ Services Administration indicates the widest variance when compared with the peer organizations.
Job Category SOM 11 Peer AVG Peer 25th Peer 75th
Variance
to Peer
Average
SOM 11
Percentage
Peer
Average
Percentage
Developers, DBA and Infrastructure 542.2 496.5 423.7 577.8 9.20% 69.15% 60.62%
Quality Assurance 43.2 30.4 25.7 35.2 42.11% 5.51% 3.71%
Business Analyst 46.1 112.1 95.1 130.1 -58.88% 5.88% 13.69%
Project Management 40.5 44.8 37.5 61 -9.60% 5.17% 5.47%
Management and Administration 81.4 62.6 53 72 30.03% 10.38% 7.64%
Services Adminstration 21 72.6 61.5 75.2 -71.07% 216.49% 8.86%
Unallocated 9.7 0 0 0 1.24% 0.00%
Total 784.1 819 696.5 951.3 -4.26% 313.82% 100.00%
Current State Organization Assessment Rationale — Benchmark: FTE by Job Category
Applications Current State Organization Assessment Rationale Benchmark: Total Cost Per FTE
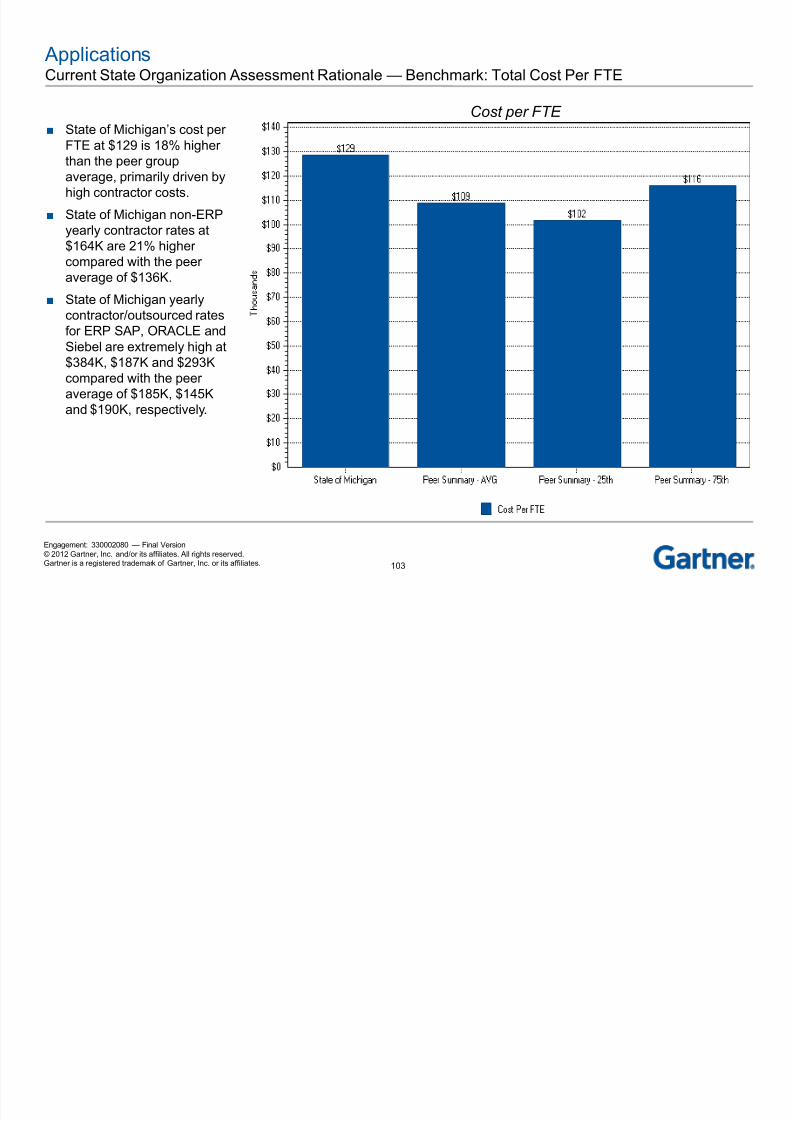
8/9/2019 A Current State Assessment-Finalv2 384036 7
http://slidepdf.com/reader/full/a-current-state-assessment-finalv2-384036-7 104/238
103
Engagement: 330002080 — Final Version© 2012 Gartner, Inc. and/or its affiliates. All rights reserved.Gartner is a registered trademark of Gartner, Inc. or its affiliates.
■ State of Michigan’s cost perFTE at $129 is 18% higherthan the peer groupaverage, primarily driven byhigh contractor costs.
■ State of Michigan non-ERPyearly contractor rates at$164K are 21% highercompared with the peeraverage of $136K.
■ State of Michigan yearlycontractor/outsourced ratesfor ERP SAP, ORACLE andSiebel are extremely high at$384K, $187K and $293Kcompared with the peeraverage of $185K, $145Kand $190K, respectively.
Cost per FTE
Current State Organization Assessment Rationale — Benchmark: Total Cost Per FTE
Applications Current State Organization Assessment Rationale — Capabilities by Application Development JobFamily

8/9/2019 A Current State Assessment-Finalv2 384036 7
http://slidepdf.com/reader/full/a-current-state-assessment-finalv2-384036-7 105/238
104
Engagement: 330002080 — Final Version© 2012 Gartner, Inc. and/or its affiliates. All rights reserved.Gartner is a registered trademark of Gartner, Inc. or its affiliates.
Family
■ Job Family strength for FTEs currently in this job family:
■ Selected foundational skills and critical competencies:
■ Bench strength (Highly Qualified and Qualified FTEs currently in other Job Families):
Highly Qualified 43
Qualified 122
HQ+Q 165
5 Critical Competencies
2+ Levels
Below
Expected
1 Level
Below
Expected
At or
Above
Expected
Adaptability 7.6% 32.5% 59.9%
Analytical Thinking 9.0% 30.8% 60.2%
Contributing to Team Success 12.1% 24.6% 63.3%
Customer Focused 10.0% 28.0% 61.9%
Quality Orientation 19.0% 34.3% 46.7%
10 Foundational Skill s (% of FTEs with Adv/Master Proficieny) % Adv/Mst
Development Tools 53.6%
Implementation (In Relevant Programming Language) 48.1%
Middleware Management (EAI, BPM, Application Servers) 7.6%
Quality Assurance (Software and Architecture Review) 20.1%
Service Oriented Architecture (SOA) 4.5%
Software Support and Maintenance 51.9%
Solution Architecture 12.1%
System Development Methodology 26.3%
Technical Specifications Development 28.4%
Testing 46.0%
Adv/Master>= 30% Adv/Master 20% –30% Adv/Master <20%
Below <40% At or Above 60% 40% to <60%
Job FamilyHighly
Qualified QualifiedLess-
Qualified Total HCStrength
(%HQ+Q)
Application Development 48 78 163 289 44%
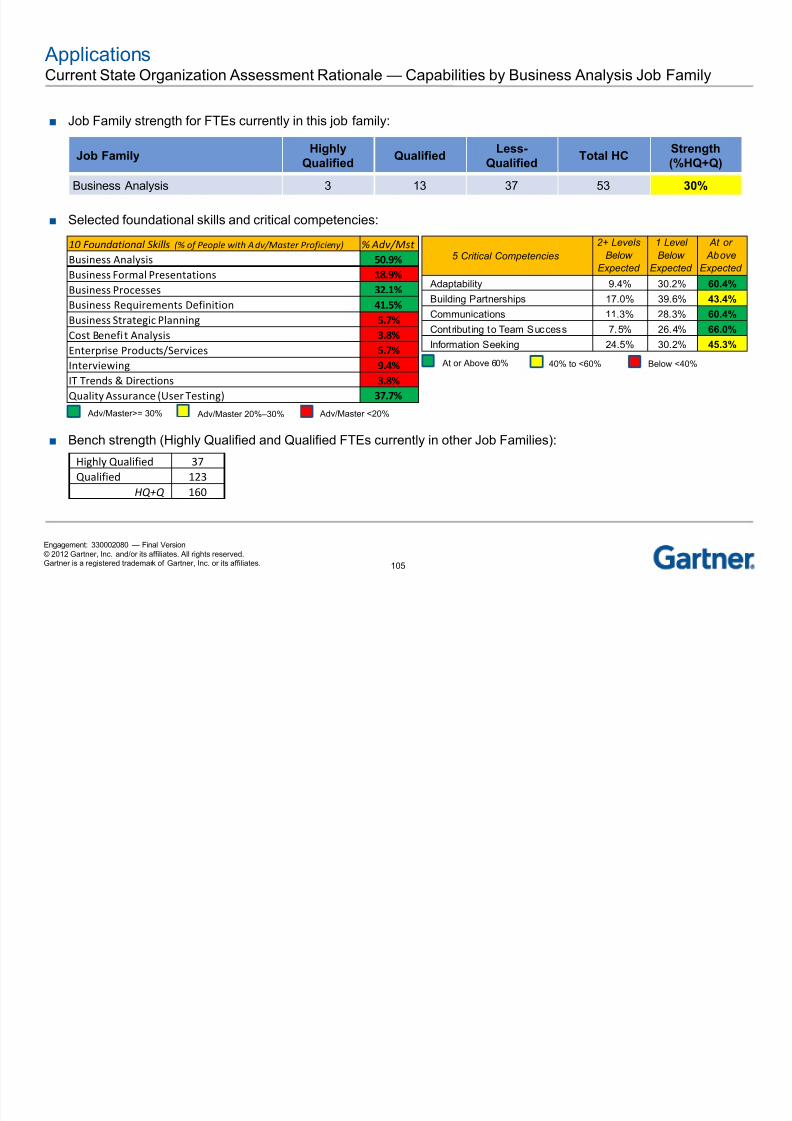
8/9/2019 A Current State Assessment-Finalv2 384036 7
http://slidepdf.com/reader/full/a-current-state-assessment-finalv2-384036-7 106/238
Applications Current State Organization Assessment Rationale — Capabilities by Project Management Job Family

8/9/2019 A Current State Assessment-Finalv2 384036 7
http://slidepdf.com/reader/full/a-current-state-assessment-finalv2-384036-7 107/238
106
Engagement: 330002080 — Final Version© 2012 Gartner, Inc. and/or its affiliates. All rights reserved.Gartner is a registered trademark of Gartner, Inc. or its affiliates.
Current State Organization Assessment Rationale Capabilities by Project Management Job Family
■ Job Family strength for FTEs currently in this job family:
■ Selected foundational skills and critical competencies:
■ Bench strength (Highly Qualified and Qualified FTEs currently in other Job Families):
Job FamilyHighly
Qualified Qualified Less-Qualified Total HCStrength
(%HQ+Q)
Project Management 12 16 80 108 26%
10 Foundational Skills (% of People with Adv/Master Proficieny) % Adv/Mst
Lead Long Projects (12+ Months) 40.7%
Lead Medium Projects (3-12 Months) 43.5%
Lead Short Projects (1-3 Months) 53.7%
Project Estimating 27.8%
Project Management Institute (PMI) 22.2%
Project Management Tools 30.6%
Project Scheduling 39.8%
Project Scope Management 40.7%
Project Tracking and Reporting 46.3%
Risk Management 29.6%
Highly Qualified 25
Qualified 87
HQ+Q 112
5 Critical Competencies
2+ Levels
Below
Expected
1 Level
Below
Expected
At or
Above
Expected
Building Partnerships 19.4% 46.3% 34.3%
Communications 8.3% 50.0% 41.7%Information Seeking 29.6% 43.5% 26.9%
Initiating Action 13.9% 47.2% 38.9%
Quality Orientation 23.1% 46.3% 30.6%
Adv/Master>= 30% Adv/Master 20% –30% Adv/Master <20%
Below <40% At or Above 60% 40% to <60%
Applications Current State Organization Assessment Rationale — Capabilities by Quality Assurance Job Family

8/9/2019 A Current State Assessment-Finalv2 384036 7
http://slidepdf.com/reader/full/a-current-state-assessment-finalv2-384036-7 108/238
107
Engagement: 330002080 — Final Version© 2012 Gartner, Inc. and/or its affiliates. All rights reserved.Gartner is a registered trademark of Gartner, Inc. or its affiliates.
Current State Organization Assessment Rationale Capabilities by Quality Assurance Job Family
■ Job Family strength for FTEs currently in this job family:
■ Selected foundational skills and critical competencies:
■ Bench strength (Highly Qualified and Qualified FTEs currently in other Job Families):
Job FamilyHighly
Qualified Qualified Less-Qualified Total HCStrength
(%HQ+Q)
Quality Assurance 7 4 10 21 52%
Highly Qualified 49
Qualified 93
HQ+Q 142
10 Foundational Skills (% of People with Adv/Master Proficieny) % Adv/Mst
Acceptance Testing 57.1%
Integration Testing 38.1%
Quality Assurance Concepts and Standards 47.6%
Regression Testing 52.4%
Systems Testing 52.4%
Test Case Decision 52.4%
Test Performance/Metrics 23.8%
Test Planning 57.1%
Testing Methodologies 28.6%
Testing Tools 38.1%
5 Critical Competencies
2+ Levels
Below
Expected
1 Level
Below
Expected
At or
Above
Expected
Analytical Thinking 4.8% 42.9% 52.4%
Communications 4.8% 33.3% 61.9%
Contributing to Team Success 4.8% 23.8% 71.4%
Planning and Organizing Work 14.3% 28.6% 57.1%
Quality Orientation 4.8% 19.0% 76.2%
Adv/Master>= 30% Adv/Master 20% –30% Adv/Master <20%
Below <40% At or Above 60% 40% to <60%
Applications Current State Organization Assessment Rationale — Capabilities by Release Management Job Family

8/9/2019 A Current State Assessment-Finalv2 384036 7
http://slidepdf.com/reader/full/a-current-state-assessment-finalv2-384036-7 109/238
108
Engagement: 330002080 — Final Version© 2012 Gartner, Inc. and/or its affiliates. All rights reserved.Gartner is a registered trademark of Gartner, Inc. or its affiliates.
Current State Organization Assessment Rationale Capabilities by Release Management Job Family
■ Job Family strength for FTEs currently in this job family:
■ Selected foundational skills and critical competencies:
■ Bench strength (Highly Qualified and Qualified FTEs currently in other Job Families):
Job Family Highly Qualified Qualified Less-Qualified Total HC
Strength
(%HQ+Q)
Release Management 1 1 8 10 20%
Highly Qualified 23
Qualified 79
HQ+Q 102
10 Foundational Skills (% of People with Adv/ Master Proficieny) % Adv/Mst
Change Control 60.0%
Configuration Management/Code Management Systems (En 70.0%
Document Management 40.0%
Governance 30.0%
IT Architecture 10.0%
ITIL Foundation Certification 0.0%
Performance Measurement and Tuning 10.0%
Project Management 0.0%
Quality Assurance Concepts and Standards 20.0%
Relevant Program Languages and Program Scripts (SQL, HTML 20.0%
5 Critical Competencies
2+ Levels
Below
Expected
1 Level
Below
Expected
At or
Above
Expected
Analytical Thinking 20.0% 50.0% 30.0%
Communications 30.0% 20.0% 50.0%Decision Making 20.0% 60.0% 20.0%
Information Seeking 30.0% 50.0% 20.0%
Quality Orientation 30.0% 40.0% 30.0%
Adv/Master>= 30% Adv/Master 20% –30% Adv/Master <20%
Below <40% At or Above 60% 40% to <60%
ApplicationsCurrent State Process Assessment

8/9/2019 A Current State Assessment-Finalv2 384036 7
http://slidepdf.com/reader/full/a-current-state-assessment-finalv2-384036-7 110/238
109
Engagement: 330002080 — Final Version© 2012 Gartner, Inc. and/or its affiliates. All rights reserved.Gartner is a registered trademark of Gartner, Inc. or its affiliates.
Current State Process Assessment
Processes and standards are
not clearly defined anddocumented for the following
activities:
■ SDLC methodology■ Application portfolio
management■ Application support■ Business process architecture■ Data modeling■ Database design■ Master data management■ Change management
■ Configuration management■ Release management■ Quality assurance■ Testing■ Production turnover
DTMB has different processes
and standards for some of thefollowing activities:
■ SDLC methodology■ Application portfolio
management■ Application support■ Business process architecture■ Data modeling■ Database design■ Master data management■ Change management■ Configuration management
■ Release management■ Quality assurance■ Testing■ Production turnover
DTMB has processes and
standards for all of thefollowing activities, but they
are not consistent across the
enterprise:
■ SDLC methodology■ Application portfolio
management■ Application support■ Business process architecture■ Data modeling■ Database design■ Master data management
■ Change management■ Configuration management■ Release management■ Quality assurance■ Testing■ Production turnover
DTMB has consistently
defined and documentedprocesses and standards for
the following activities:
■ SDLC methodology■ Application portfolio
management■ Application support■ Business process architecture■ Data modeling■ Database design■ Master data management■ Change management
■ Configuration management■ Release management■ Quality assurance■ Testing■ Production turnover
DTMB has a defined process
to ensure that processes andstandards are followed;
DTMB has consistently
defined and documented
processes and standards for
the following activities:
DTMB has a systematic
approach defined to evaluate,
refine and improve the
following activities:
■ SDLC methodology■ Application portfolio
management■ Application support■ Business process architecture■ Data modeling■ Database design■ Master data management■ Change management■ Configuration management■ Release management■ Quality assurance■ Testing■ Production turnover
1 — Ad Hoc 2 — Reactive 3 — Challenged 4 — Managed 5 — Optimized
ApplicationsCurrent State Process Assessment Rationale

8/9/2019 A Current State Assessment-Finalv2 384036 7
http://slidepdf.com/reader/full/a-current-state-assessment-finalv2-384036-7 111/238
110
Engagement: 330002080 — Final Version© 2012 Gartner, Inc. and/or its affiliates. All rights reserved.Gartner is a registered trademark of Gartner, Inc. or its affiliates.
Strengths Weaknesses
SUITE project management and SDLC methodology havebeen established.
Some individual agency teams have strong internal controlsfor managing projects and application development.
SUITE methodology is not followed consistently across allagency project teams, and solution architecture activitiesare not being performed frequently during initial projectproposal.
Currently, quality assurance processes do not proactivelyensure that all deliverables meet a certain quality standardas those deliverables are being created.
Currently only able to perform enterprise-level qualityassurance reviews after-the-fact with PPQA team.
Costs are generally only tracked for contractor resources —
not internal resources.
Some Agile development in place, but is not extensive, andPM methodology is playing catch-up.
There is no formally approved, established service catalogfor application development work.
ApplicationsCurrent State Strategy Assessment

8/9/2019 A Current State Assessment-Finalv2 384036 7
http://slidepdf.com/reader/full/a-current-state-assessment-finalv2-384036-7 112/238
111
Engagement: 330002080 — Final Version© 2012 Gartner, Inc. and/or its affiliates. All rights reserved.Gartner is a registered trademark of Gartner, Inc. or its affiliates.
gy
There is no defined
Applications strategic plan.Common attributes include:
■ Limited agency engagementfor application budgetcreation;
■ No management insight intoapplication performance;
■ No application portfoliomanagement;
■ Limited agency accountabilityfor application investments orbudget.
High-level applications
strategy is defined, but doesnot have measurable
objectives. Common attributes
include:
■ Some agencies are engagedfor application budgetcreation;
■ Ad hoc management insightinto application performance;
■ Ad hoc application portfoliomanagement;
■ Inconsistent agency
accountability for applicationinvestments or budget.
Applications strategy is
defined and communicated;however, it is not effectively
translated into consistent
action. Common attributes
include:
■ All agencies are inconsistentlyengaged for applicationbudget creation;
■ Management has insight intoapplication performance for allagencies;
■ Application portfolio
management is performed forall agencies;
■ Agency accountability forapplication investments orbudget is tracked by theagencies.
Applications strategy is
clearly defined, communicatedand socialized throughout the
enterprise. Common attributes
include:
■ All agencies are consistentlyengaged for applicationbudget creation;
■ Management has insight intoapplication performance for allagencies;
■ Application portfoliomanagement is performed for
all agencies;■ Agency accountability for
application investments orbudget is tracked at DTMB.
Applications strategy spans
the business and is integratedinto enterprise strategic
planning, is continually
reviewed, and the strategy is
updated to align with business
objectives. Common attributes
include:
■ All agencies are consistentlyengaged for applicationbudget creation;
■ DTMB proactively works withagencies to identify and
secure funding sources;■ Management has insight into
application performance for allagencies, and activelyidentifies applications tosunset;
■ Application portfoliomanagement is performed forall agencies, and definedprocesses are in place toevaluate the possibility ofsharing applications acrossagencies;
■ Agency accountability forapplication investments orbudget is tracked at DTMB.
1 — Ad Hoc 2 — Reactive 3 — Challenged 4 — Managed 5 — Optimized
ApplicationsCurrent State Strategy Assessment Rationale

8/9/2019 A Current State Assessment-Finalv2 384036 7
http://slidepdf.com/reader/full/a-current-state-assessment-finalv2-384036-7 113/238
112
Engagement: 330002080 — Final Version© 2012 Gartner, Inc. and/or its affiliates. All rights reserved.Gartner is a registered trademark of Gartner, Inc. or its affiliates.
gy
Strengths Weaknesses
Some Information Officers are providing strategic-levelsupport to their partner agencies.
There is an overall Agency Services section in the existingIT Strategic Plan.
Total application support spend is at the 75th percentile.
Overall, high costs being driven by very high software costsand very high hosting and outsourcing costs.
Some Information Officers are only able to provideoperational support.
Many agency teams are focused more on “firefighting” andcurrent operations, since “optional” projects are falling“below the line” in the Call for Projects process.
Individual agency teams did not appear to be referencingthe IT Strategic Plan to ensure alignment with it, except forindividual application projects.
Application SupportTotal Spending by Cost Category

8/9/2019 A Current State Assessment-Finalv2 384036 7
http://slidepdf.com/reader/full/a-current-state-assessment-finalv2-384036-7 114/238
113
Engagement: 330002080 — Final Version© 2012 Gartner, Inc. and/or its affiliates. All rights reserved.Gartner is a registered trademark of Gartner, Inc. or its affiliates.
Spend by Cost Category
■ Personnel cost is 6% less than
the peer average ($6.3M) forapplications sustainment.
■ Facility cost is less than thepeer organizations, as thereare fewer IT resources.
■ Software costs aresignificantly higher than thepeer average and align more
with the peer 75th percentile.
■ Hosting and Outsourced(Fixed Price) are significantlyhigher than the peerorganizations.
p g y g y
ApplicationsCurrent State Service Level Assessment

8/9/2019 A Current State Assessment-Finalv2 384036 7
http://slidepdf.com/reader/full/a-current-state-assessment-finalv2-384036-7 115/238
114
Engagement: 330002080 — Final Version© 2012 Gartner, Inc. and/or its affiliates. All rights reserved.Gartner is a registered trademark of Gartner, Inc. or its affiliates.
Application service levels not
clearly defined or negotiatedwith the customer. Common
attributes include:
■ Application developmentservice levels are not definedat the beginning of eachproject;
■ Application support servicelevels (e.g., uptime,availability, time to restore,etc.) are not defined.
Basic Application service
levels exist, but performanceis not effectively measured.
Common attributes include:
■ Application developmentservice levels are sometimesdefined at the beginning ofeach project;
■ Application support servicelevels (e.g., uptime,availability, time to restore,etc.) are ad hoc.
Application service-level
agreements and metrics areestablished, and the
organization is accountable to
end customers and other
groups within DTMB. Common
attributes include:
■ Application developmentservice levels are alwaysdefined at the beginning ofeach project, but areinconsistently tracked duringthe project;
■ Application support servicelevels (e.g., uptime,availability, time to restore,etc.) are consistently definedacross the enterprise butinconsistently tracked.
Application service-level
agreements and metrics areestablished and the
organization is accountable to
end customers and other
groups within DTMB. Common
attributes include:
■ Application developmentservice levels are alwaysdefined at the beginning ofeach project, and areconsistently tracked duringthe project;
■ Application support servicelevels (e.g., uptime,availability, time to restore,etc.) are consistently definedacross the enterprise and areconsistently tracked/reportedagainst.
Application service-level
agreements and metrics arecollaboratively and regularly
agreed to with customers, and
the organization is fully
accountable to end customers
and other groups within
DTMB. Common attributes
include:
■ Application developmentservice levels are alwaysdefined at the beginning ofeach project, and are
consistently tracked duringthe project;■ Application support service
levels (e.g., uptime,availability, time to restore,etc.) are consistently definedacross the enterprise and areconsistently tracked/reportedagainst;
■ Organizational performance isevaluated, enhanced andrewarded based on definedobjectives.
1 — Ad Hoc 2 — Reactive 3 — Challenged 4 — Managed 5 — Optimized
ApplicationsCurrent State Service Level Assessment

8/9/2019 A Current State Assessment-Finalv2 384036 7
http://slidepdf.com/reader/full/a-current-state-assessment-finalv2-384036-7 116/238
115
Engagement: 330002080 — Final Version© 2012 Gartner, Inc. and/or its affiliates. All rights reserved.Gartner is a registered trademark of Gartner, Inc. or its affiliates.
Strengths Weaknesses
Some “Red Card” applications are being monitored usingVantage.
A few Agency Services teams regularly perform detailedon-time and on-budget project reporting to their customeragencies.
Only some applications have monitoring that includes bothuptime/downtime availability measures, and individual pagedisplay performance metrics.
Availability and performance metrics produced by Vantageare not part of the monthly service level metrics reportingand are not published on an online dashboard forcustomers to reference any time they want.
Inconsistent reporting of on-time and on-budget status forapplication development projects.

8/9/2019 A Current State Assessment-Finalv2 384036 7
http://slidepdf.com/reader/full/a-current-state-assessment-finalv2-384036-7 117/238
116
Engagement: 330002080 — Final Version© 2012 Gartner, Inc. and/or its affiliates. All rights reserved.Gartner is a registered trademark of Gartner, Inc. or its affiliates.
Program and Portfolio Management
Current State Assessment and Maturity Analysis
Current State =
Target State =
Program and Portfolio ManagementRole Definition — Portfolio Management
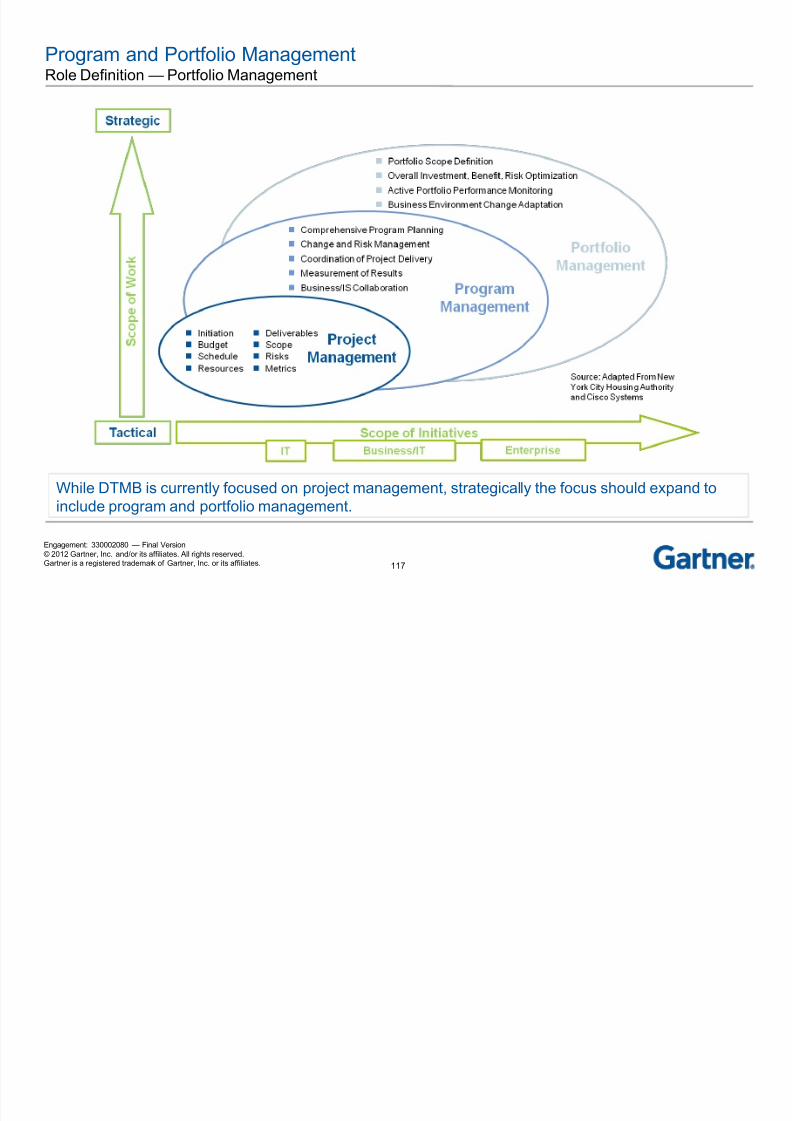
8/9/2019 A Current State Assessment-Finalv2 384036 7
http://slidepdf.com/reader/full/a-current-state-assessment-finalv2-384036-7 118/238
117
Engagement: 330002080 — Final Version© 2012 Gartner, Inc. and/or its affiliates. All rights reserved.Gartner is a registered trademark of Gartner, Inc. or its affiliates.
While DTMB is currently focused on project management, strategically the focus should expand toinclude program and portfolio management.
Program and Portfolio ManagementCurrent State Overview

8/9/2019 A Current State Assessment-Finalv2 384036 7
http://slidepdf.com/reader/full/a-current-state-assessment-finalv2-384036-7 119/238
118
Engagement: 330002080 — Final Version© 2012 Gartner, Inc. and/or its affiliates. All rights reserved.Gartner is a registered trademark of Gartner, Inc. or its affiliates.
■ The SUITE project management methodology is the established standard throughout DTMB.
■ Several project management offices (PMOs) exist through the organization (see the following slide).
■ DTMB has an Enterprise Portfolio Management Office (ePMO) that reports to a specific IO and thathas limited authority due to its position in the organization.
– DTMB wants to achieve best practices for the ePMO, including enterprise policy and oversight of projectmanagement and systems, standards and policy issuance, and centralized dashboards with insightful metrics.
– DTMB would like to progress toward project and portfolio management becoming more forward-looking, enablingfunctions such as demand and resource management.
■ DTMB has established an annual Call for Projects process that spans multiple levels (IO and Agencies, Infrastructure Services and ePMO).
– There is a documented process flow for the enterprise Call for Projects, but it lacks true enterprise-level authorityand currently serves as more of a reporting function.
– There is little standardization or guidance around a Call for Projects at the agency/IO level. Each agency unit hasits own process for prioritization.
– Infrastructure Services has a Call for Projects process that happens in conjunction and in coordination with the Agency Services (ePMO) Call for Projects. There is a high degree of interdependence between the twoprocesses.
Program and Portfolio ManagementCurrent State Overview (continued)

8/9/2019 A Current State Assessment-Finalv2 384036 7
http://slidepdf.com/reader/full/a-current-state-assessment-finalv2-384036-7 120/238
119
Engagement: 330002080 — Final Version© 2012 Gartner, Inc. and/or its affiliates. All rights reserved.Gartner is a registered trademark of Gartner, Inc. or its affiliates.
■ Although ChangePoint has been selected as the enterprise project/portfolio management andreporting tool, several technology tools are in place for project management (i.e., SharePoint, Excel,
Project, etc.), with little standardization across the enterprise.
■ Currently, no enterprisewide dashboard to provide a central repository of project information andmetrics. Project information is being rolled up into ChangePoint, but currently not at a level sufficientenough to provide a comprehensive enterprisewide view of projects in flight.
– Basic metrics around project management are being provided to agency customers, although there are differinglevels of metrics and little standardization.

8/9/2019 A Current State Assessment-Finalv2 384036 7
http://slidepdf.com/reader/full/a-current-state-assessment-finalv2-384036-7 121/238
Program and Portfolio ManagementGartner Framework — Gartner Research Recommends That Organizations such as DTMB Have theFollowing PMO Element Types in Place
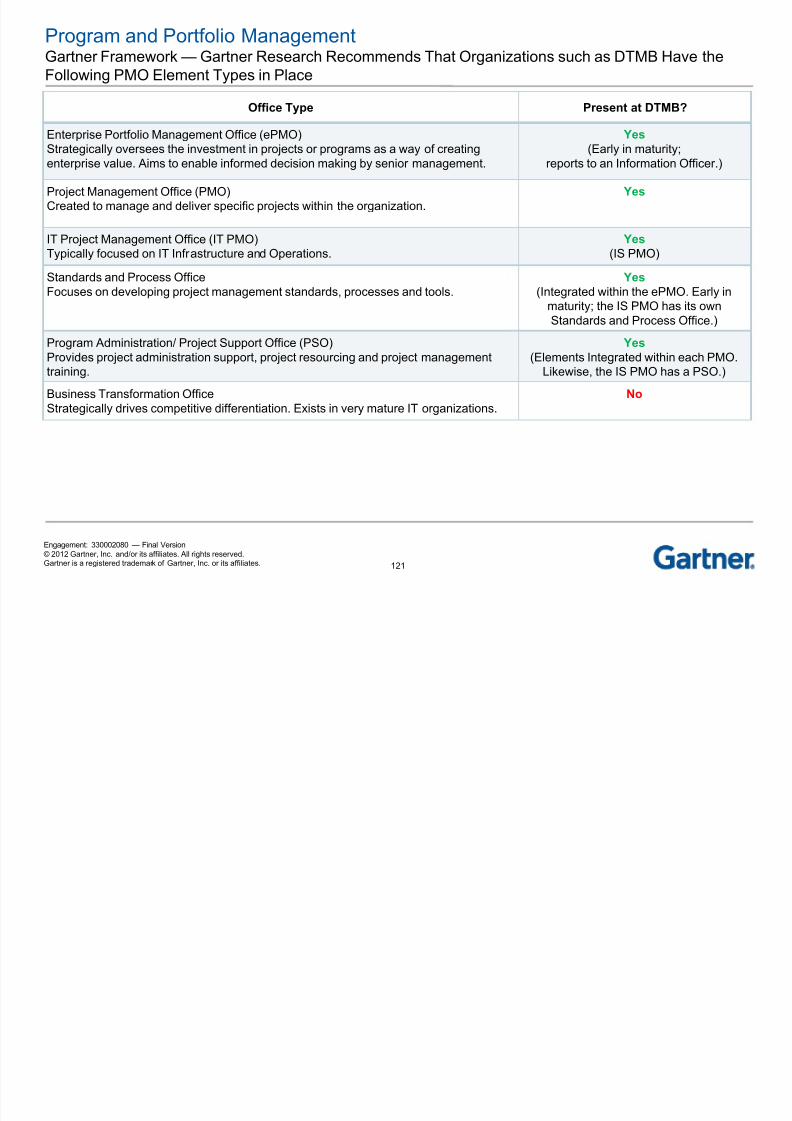
8/9/2019 A Current State Assessment-Finalv2 384036 7
http://slidepdf.com/reader/full/a-current-state-assessment-finalv2-384036-7 122/238
121
Engagement: 330002080 — Final Version© 2012 Gartner, Inc. and/or its affiliates. All rights reserved.Gartner is a registered trademark of Gartner, Inc. or its affiliates.
Office Type Present at DTMB?
Enterprise Portfolio Management Office (ePMO)Strategically oversees the investment in projects or programs as a way of creating
enterprise value. Aims to enable informed decision making by senior management.
Yes
(Early in maturity;
reports to an Information Officer.)
Project Management Office (PMO)Created to manage and deliver specific projects within the organization.
Yes
IT Project Management Office (IT PMO)Typically focused on IT Infrastructure and Operations.
Yes
(IS PMO)
Standards and Process Office
Focuses on developing project management standards, processes and tools.
Yes
(Integrated within the ePMO. Early inmaturity; the IS PMO has its ownStandards and Process Office.)
Program Administration/ Project Support Office (PSO)Provides project administration support, project resourcing and project managementtraining.
Yes
(Elements Integrated within each PMO.Likewise, the IS PMO has a PSO.)
Business Transformation OfficeStrategically drives competitive differentiation. Exists in very mature IT organizations.
No
Program and Portfolio ManagementMajor Findings

8/9/2019 A Current State Assessment-Finalv2 384036 7
http://slidepdf.com/reader/full/a-current-state-assessment-finalv2-384036-7 123/238
122
Engagement: 330002080 — Final Version© 2012 Gartner, Inc. and/or its affiliates. All rights reserved.Gartner is a registered trademark of Gartner, Inc. or its affiliates.
Technology
Organization
ProcessStrategy
ServiceLevel
Current
■ DTMB has limited enterprise insight into demand/resource management
and benefits realization.
– Bottom Line: DTMB is unable to effectively perform portfolio andinvestment management and maximize enterprise value.
■ The organizational structure of DTMB limits the authority, oversight
and executive reporting responsibility of the ePMO.
– Bottom Line: The ePMO is severely limited in its ability to effectivelyperform enterprise program and portfolio management because it reportsto a single IO in Agency Services. For example, although DTMB hasstandardized on the SUITE methodology for project management, it has
been inconsistently adopted.■ Varying degrees of project management skill exist within various IO
units.
– Bottom Line: Varying skill levels of project managers results in wide gapsin customer satisfaction. Additionally, agency customers often view DTMBas unable to deliver large or innovative projects on-time and on-budget.
■ Various agencies and IO units use differing tools to internally manage
projects, and there is little institutionalization to maintaining project
information into an enterprise reporting tool.
– Bottom Line: It is extremely difficult to roll up project data at an EnterpriseLevel and provide a centralized dashboard of project information andmetrics. Likewise, it is diff icult to execute portfolio management.
Program and Portfolio Management Current State Technology Assessment

8/9/2019 A Current State Assessment-Finalv2 384036 7
http://slidepdf.com/reader/full/a-current-state-assessment-finalv2-384036-7 124/238
123
Engagement: 330002080 — Final Version© 2012 Gartner, Inc. and/or its affiliates. All rights reserved.Gartner is a registered trademark of Gartner, Inc. or its affiliates.
No or limited IT systems or
tools in place to supportproject and program
management processes,
including:
■ Strategy development tools■ Automated resource
management tools■ Business modeling and
process tools■ Decision support tools■ Risk modeling tools■ Reporting dashboards
■ Project scheduling tools■ Automated PPM workflowengine
IT systems and tools are
present to support project andprogram management
processes; however, there is
no coordination or
standardization across the
enterprise.
■ Strategy development tools■ Automated resource
management tools■ Business modeling and
process tools■ Decision support tools
■ Risk modeling tools■ Reporting dashboards■ Project scheduling tools■ Automated PPM workflow
engine
IT systems and tools are in
place to support project andprogram management, but
have been procured without
suitable alignment to user and
operational requirements.
■ Strategy development tools■ Automated resource
management tools■ Business modeling and
process tools■ Decision support tools■ Risk modeling tools
■ Reporting dashboards■ Project scheduling tools■ Automated PPM workflow
engine
IT systems and tools are in
place to support project andprogram management across
the enterprise and are
consistently used.
■ Strategy development tools■ Automated resource
management tools■ Business modeling and
process tools■ Decision support tools■ Risk modeling tools■ Reporting dashboards
■ Project scheduling tools■ Automated PPM workflowengine
IT systems and tools are in
place and support theenterprise’s ability to improve
and optimize operational
performance.
■ Strategy development tools■ Automated resource
management tools■ Business modeling and
process tools■ Decision support tools■ Risk modeling tools■ Reporting dashboards
■ Project scheduling tools■ Automated PPM workflowengine
1 — Ad Hoc 2 — Reactive 3 — Challenged 4 — Managed 5 — Optimized
Program and Portfolio ManagementCurrent State Technology Assessment Rationale

8/9/2019 A Current State Assessment-Finalv2 384036 7
http://slidepdf.com/reader/full/a-current-state-assessment-finalv2-384036-7 125/238
124
Engagement: 330002080 — Final Version© 2012 Gartner, Inc. and/or its affiliates. All rights reserved.Gartner is a registered trademark of Gartner, Inc. or its affiliates.
Strengths Weaknesses
DTMB is in the process of convening around a singleenterprise project management tool — ChangePoint.
Currently working on providing enterprise-level dashboardsto aid with portfolio management and provide anenterprisewide view of project metrics.
Have a documented framework and process in place forhow information should be entered into ChangePoint byvarious IOs and CSDs.
There is a general sense of recognition around the need foran enterprise tool for program, resource and portfolio
management.
Various agencies and IO units are using differing tools tointernally manage projects (Microsoft Project, Microsoft
Project Server, SharePoint, Excel, etc.).
Many tools to manage projects are manual tools (e.g., manyof the tools to manage application development).
ChangePoint is viewed by several agencies as anunnecessary additional tool in an environment where far toomany tools already exist. Furthermore, various IO unitswithin Agency Services have not incorporated ChangePointinto their project management processes.
Some CSDs are not following process and fail to inputsubstantial project information into ChangePoint.
Although there is recognition for an enterprisewideprogram, resource and portfolio management tool — thereis no consensus on ChangePoint being the best tool toperform these functions.
Due to the various tools and processes in existence, it isextremely difficult to roll up project data at an enterpriselevel.
Program and Portfolio Management Current State Technology Assessment

8/9/2019 A Current State Assessment-Finalv2 384036 7
http://slidepdf.com/reader/full/a-current-state-assessment-finalv2-384036-7 126/238
125
Engagement: 330002080 — Final Version© 2012 Gartner, Inc. and/or its affiliates. All rights reserved.Gartner is a registered trademark of Gartner, Inc. or its affiliates.
■ Compuware’s Change Pointsoftware product is recognized
as a Gartner Magic QuadrantLeader
Magic Quadrant for Integrated IT
Portfolio Analysis Applications
Program and Portfolio Management Current State Organization Assessment

8/9/2019 A Current State Assessment-Finalv2 384036 7
http://slidepdf.com/reader/full/a-current-state-assessment-finalv2-384036-7 127/238
126
Engagement: 330002080 — Final Version© 2012 Gartner, Inc. and/or its affiliates. All rights reserved.Gartner is a registered trademark of Gartner, Inc. or its affiliates.
No clear organizational
structure or overall ownershipof responsibilities for PPM
across the enterprise.
Common attributes include:
■ Absence of a Program orProject Management Office;
■ Project management skills arelimited and not standardized;
■ Project and programmanagement roles andresponsibilities are undefined;
■ Subject Matter Experts
(SMEs) informally.
Ownership of PPM
reponsibilities within theenterprise exists, but the
organization is immature and
appropriate skill sets are not
present. Common attributes
include:
■ Project Management Office isdefined but it is not aligned foreffective service delivery;
■ Duplicative functions/roles;■ Inconsistently defined
program and project roles and
responsibilities;■ Limited project managementdevelopment and trainingbudgets;
■ Ad hoc governance;■ Non-optimized staffing levels;■ PPM activities are limited to
the interests and actions ofindividual managers.
Project Management Office
exists, is fairly mature andexhibits some best practices.
PPM skill sets largely align
with IT support needs.
Common attributes include:
■ Project Management Office isdefined and aligned foreffective service delivery;
■ Optimized or near-optimizedstaffing levels;
■ PMO collaborates withresource management to
ensure project resources andcapacity requirements aremet;
■ All PMs report through to thePMO and are allocated toprojects as needed;
■ Defined project managementdevelopment and trainingbudgets.
Program Management Office
that is integrated with otherkey processes and IT roles
and is appropriately organized
and staffed. Common
attributes include:
■ Focus on programcoordination, governance,communication;
■ Organizational structure isdefined and aligned foreffective service delivery withappropriately resourced and
skilled staff;■ PMO is service-delivery-focused organization withstrong relationship managersand service;
■ Established program forongoing PPM training ofresources;
■ Service-centric PPMorganization with strongrelationship managers.
Portfolio Management Office
where organizationalperformance is evaluated,
enhanced and rewarded based
on defined objectives.
Common attributes include:
■ Focus on investmentoptimization, benefitsrealization;
■ Reports to business, not CIO;■ Formalized steering
committee to prioritize, selectand manage projects,
programs and the IT portfolio;■ Customer- and business-focused organization;
■ PPM leaders exist in all areasof the enterprise;
■ Virtual teaming;■ Business/IT Staff rotation;■ Developing best practices.
1 — Ad Hoc 2 — Reactive 3 — Challenged 4 — Managed 5 — Optimized
Program and Portfolio ManagementCurrent State Organization Assessment Rationale

8/9/2019 A Current State Assessment-Finalv2 384036 7
http://slidepdf.com/reader/full/a-current-state-assessment-finalv2-384036-7 128/238
127
Engagement: 330002080 — Final Version© 2012 Gartner, Inc. and/or its affiliates. All rights reserved.Gartner is a registered trademark of Gartner, Inc. or its affiliates.
Strengths Weaknesses
Given the greater level of centralization and longer timeperiod in existence, the Infrastructure Services PMO is fairly
mature from an organization perspective.
Agency Services is actively working toward staffing each IObusiness unit with dedicated project managers.
An ePMO has been established to provide enterprisewidemetrics and begin an effort toward portfolio management.
IOs are frequently meeting with Agency customers toprovide qualitative updates as best they can on projects inflight, although quantitative metrics are commonly not
involved. Most Project Managers within the Infrastructure Services
PMO have project management certification.
PMs (especially within Agency Services) have widelyvarying skill and experience levels, with some PMs being
developers or having other job occupations. As a result ofthis varying skill level, some agencies have experiencedPMs resulting in higher agency satisfaction, while othercustomers have either inexperienced PMs or none at all,resulting in agency dissatisfaction.
The Job Skills Assessment reported “Project Management”as one of the lowest-ranked job families in terms of skilllevel — only 26% of respondents were “qualified” or “highlyqualified.”
The ePMO currently reports into an IO as part of AgencyServices and does not span Infrastructure Services.Likewise, PMs do not report into the ePMO, nor does theePMO have authority or oversight over PMs.
A lack of authority, oversight and executive reporting meansthat governance remains a challenge from an ePMOperspective and that the ePMO is severely limited withregard to effectively performing enterprise project andportfolio management.
Limited ePMO staff is adequate for reporting purposes, butcurrently not equipped for resource management andprogram management prioritization and oversight.
Program and Portfolio ManagementCurrent State Organization Assessment Rationale (continued)

8/9/2019 A Current State Assessment-Finalv2 384036 7
http://slidepdf.com/reader/full/a-current-state-assessment-finalv2-384036-7 129/238
128
Engagement: 330002080 — Final Version© 2012 Gartner, Inc. and/or its affiliates. All rights reserved.Gartner is a registered trademark of Gartner, Inc. or its affiliates.
Strengths Weaknesses (continued)
Resources are not commonly pooled or shared across IOs.
Resource management is done on an agency-by-agencybasis and not on an enterprisewide level.
The pace at which projects can be accomplished declinesas a result of resource management being unknown andresources not being more effectively shared across theenterprise.
In certain instances, PMOs have limited direct contact withagency staff (including Business Analysts), with interactionbeing filtered through the IO (or CSD).
Program and Portfolio ManagementCurrent State Organization Assessment Rationale — Capabilities by Project Management Job Family

8/9/2019 A Current State Assessment-Finalv2 384036 7
http://slidepdf.com/reader/full/a-current-state-assessment-finalv2-384036-7 130/238
129
Engagement: 330002080 — Final Version© 2012 Gartner, Inc. and/or its affiliates. All rights reserved.Gartner is a registered trademark of Gartner, Inc. or its affiliates.
■ Job Family Strength (for FTEs currently in this job family):
■ 10 Foundational Skills and five Critical Competencies Strength for Job Family:
■ Bench Strength (Highly Qualified and Qualified FTEs currently in other Job Families):
Job FamilyHighly
QualifiedQualified Less-Qualified Total HC
Strength
(%HQ+Q)
Project Management 12 16 80 108 26%
Highly Qualified 25
Qualified 87
HQ+Q 112
10 Foundational Skil ls (% of People with Adv/Master Proficieny) % Adv/Mst
Lead Long Projects (12+ Months) 40.7%
Lead Medium Projects (3-12 Months) 43.5%
Lead Short Projects (1-3 Months) 53.7%
Project Estimating 27.8%
Project Management Insti tute (PMI) 22.2%
Project Management Tools 30.6%
Project Scheduling 39.8%
Project Scope Management 40.7%
Project Tracking and Reporting 46.3%
Risk Management 29.6%
Building Partnerships 19.4% 46.3% 34.3%
Communications 8.3% 50.0% 41.7%
Information Seeking 29.6% 43.5% 26.9%
Initiating Action 13.9% 47.2% 38.9%
Quality Orientation 23.1% 46.3% 30.6%
5 Critical Competencies
(% of FTEs at or below Expected
Competency Proficiency Levels)
2+ Levels
Below
Expected
1 Level
Below
Expected
At or
Above
Expected
While Project Managers possess adequate skills in the“harder” foundational skills, they reported a concerninglack of skill in critical competencies or “soft skills.”
Adv/Master>= 30% Adv/Master 20% –30% Adv/Master <20%
Below <40% At or Above 60% 40% to <60%
Program and Portfolio ManagementCurrent State Process Assessment

8/9/2019 A Current State Assessment-Finalv2 384036 7
http://slidepdf.com/reader/full/a-current-state-assessment-finalv2-384036-7 131/238
130
Engagement: 330002080 — Final Version© 2012 Gartner, Inc. and/or its affiliates. All rights reserved.Gartner is a registered trademark of Gartner, Inc. or its affiliates.
PPM processes are non-
existent, or ad hoc. Commonattributes, include:
■ Completely ad hoc PPMprocesses that are notdocumented, standardized,measured or continuouslyimproved;
■ Project success largelydependent on individualefforts.
PPM processes are largely
documented, but with limitedstandardization, and are
inconsistent from location to
location, business unit to
business unit. Common
attributes include:
■ Processes are neither welldefined nor repeatable;
■ Some or most processesdocumented;
■ Processes are notstandardized or measured,and there is no method forimprovement;
■ A formal process is used formodeling costs for projectsand programs;
■ Project manintoring andoversight perfornmed ad hocor for problem projects only.
PPM processes are
standardized and documentedand are consistently applied to
the organization. Common
attributes include:
■ Defined project managementmethodology is activelycommunicated across the ITorganization and is regularlyfollowed;
■ No or informal measurementor means of improving thoseprocesses;
■ Sets of interdependentprojects are managed asprograms;
■ Some processes andprocedures may be manual orinefficient, and workaroundsare present;
■ Templates for time tracking,project mgt, risk management,deliverables, etc.;
■ A formal process is used toperiodically review project orprogram costs.
PPM processes are well
defined and managedconsistently across the
enterprise. Common attributes
include:
■ Project portfolios are definedand largely aligned withbusiness strategy;
■ PMO consistently managesthe Project Portfolio based ondefined criteria and on inputfrom Account Management,Enterprise Architecture andProduct Management;
■ Systems, methods andpractices are followed withappropriate governance;
■ To facilitate stakeholderadoption, business processchanges are accounted forand addressed as part of theproject or program;
■ Benefit statements provideformal metrics;
■ Mechanisms are in placeacross the enterprise toensure compliance.
PPM processes are mature
and efficient. Commonattribute, include:
■ Business leaders are activelyengaged in IT portfoliomanagement;
■ An enterprise portfolioconsisting of strategic projectsand programs is used toexecute strategy;
■ Benefit realization issupported by a PPM process;
■ Processes, methods andsupporting systems areintegrated;
■ Control/governancemechansims are in place tofeed a cycle of continualenhancement and evolutionacross the enterprise;
■ Time and cost are tracked forevery project participant andresource.
1 — Ad Hoc 2 — Reactive 3 — Challenged 4 — Managed 5 — Optimized
Program and Portfolio ManagementCurrent State Process Assessment Rationale

8/9/2019 A Current State Assessment-Finalv2 384036 7
http://slidepdf.com/reader/full/a-current-state-assessment-finalv2-384036-7 132/238
131
Engagement: 330002080 — Final Version© 2012 Gartner, Inc. and/or its affiliates. All rights reserved.Gartner is a registered trademark of Gartner, Inc. or its affiliates.
Strengths Weaknesses
Although not thoroughly institutionalized, standardizedmethodologies are in place in the form of SUITE — a PMI-
based methodology.
A documented process flow for the enterprise Call forProjects does exist.
The ePMO has a documented method for prioritizing andrecommending projects.
“Maintenance is ~70% of what resources are working onand currently Agency Services is not doing a very good job
of tracking maintenance and upgrade-related projects.”
“Demand management is not being tracked effectively, withno standardized processes in place to measure demandand capacity.”
Commonly, dates are moved and/or target dates are notmet as a result of a standardized and institutionalizeddemand management process not being in place.
Several agencies either do not participate in the enterprise
Call for Projects during any given year, or participate to alimited degree. There is a sense among many agencycustomers that the Call for Projects at the enterprise level isof limited use, as they already have several projects in thepipeline that still are yet to be completed.
Although there are enterprise-level recommendations onproject prioritization, they are often ignored by the variouscustomer agencies.
Many agencies and their IO business units do not have a
documented process for a Call to Projects at the agencylevel, with processes varying agency-by-agency. Likewise,project management processes vary among PMOs.
Program and Portfolio ManagementCurrent State Process Assessment Rationale (continued)
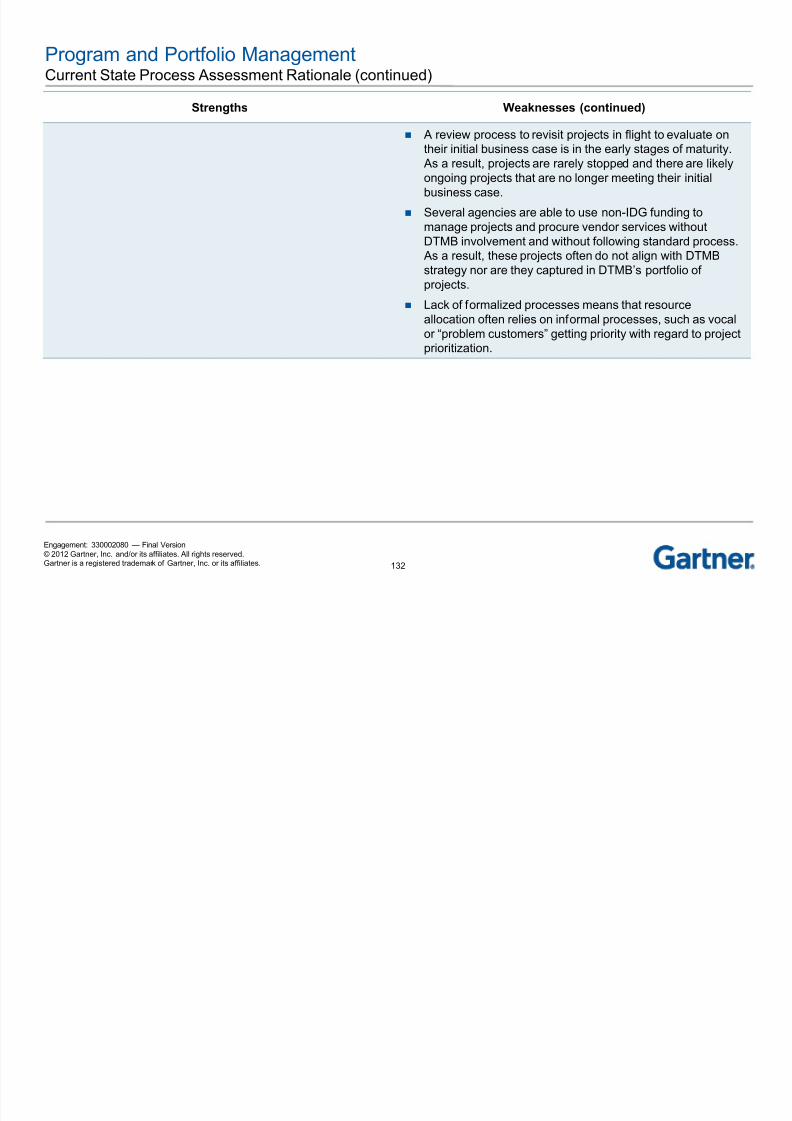
8/9/2019 A Current State Assessment-Finalv2 384036 7
http://slidepdf.com/reader/full/a-current-state-assessment-finalv2-384036-7 133/238
132
Engagement: 330002080 — Final Version© 2012 Gartner, Inc. and/or its affiliates. All rights reserved.Gartner is a registered trademark of Gartner, Inc. or its affiliates.
Strengths Weaknesses (continued)
A review process to revisit projects in flight to evaluate ontheir initial business case is in the early stages of maturity.
As a result, projects are rarely stopped and there are likelyongoing projects that are no longer meeting their initialbusiness case.
Several agencies are able to use non-IDG funding tomanage projects and procure vendor services withoutDTMB involvement and without following standard process. As a result, these projects often do not align with DTMBstrategy nor are they captured in DTMB’s portfolio ofprojects.
Lack of formalized processes means that resourceallocation often relies on informal processes, such as vocalor “problem customers” getting priority with regard to projectprioritization.
Program and Portfolio ManagementCurrent State Process Assessment Rationale — Governance Within DTMB for Project and PortfolioManagement Is Still Immature

8/9/2019 A Current State Assessment-Finalv2 384036 7
http://slidepdf.com/reader/full/a-current-state-assessment-finalv2-384036-7 134/238
133
Engagement: 330002080 — Final Version© 2012 Gartner, Inc. and/or its affiliates. All rights reserved.Gartner is a registered trademark of Gartner, Inc. or its affiliates.
■ A governance maturity framework is helpful in evaluating areas of growth for governance processes.
Program and Portfolio ManagementCurrent State Strategy Assessment

8/9/2019 A Current State Assessment-Finalv2 384036 7
http://slidepdf.com/reader/full/a-current-state-assessment-finalv2-384036-7 135/238
134
Engagement: 330002080 — Final Version© 2012 Gartner, Inc. and/or its affiliates. All rights reserved.Gartner is a registered trademark of Gartner, Inc. or its affiliates.
There is no defined project,
program or portfolio strategyor strategic planning function.
Common attributes include:
■ Operational process and/ortechnology investmentdecisions are made locallyand indepedently as fundingis made available;
■ PPM does not have its owngoals and objectives, andsimply executes projects asthey come;
■ PPM has no means ofunderstanding whether or notit is aligned with DTMB’soverall strategy;
■ No process and/orgovernance in place to ensurePPM's ongoing alignment withDTMB’s overall strategy.
High-level PPM strategy is
defined but does not havemeasurable objectives.
Common attributes include:
■ Common practices andlessons learned that areorganixaly inform strategy;
■ PPM has its own goals andobjectives, but there is no realconsideration for aligning itwith the overall DTMBstrategy;
■ Some process and/orgovernance in place to ensureongoing alignment withDTMB’s overall strategy.
PPM strategy is defined and
communicated; however, it isnot effectively translated into
consistent action. Common
attributes include:
■ Governance is inadequatelyestablished, allowing for theimplementation of the strategyto become fragmented andconfused across theenterprise;
■ PPM has its own goals andobjectives that partially alignwith DTMB’s overall strategy;
■ Reactively determines howwell they are aligned toDTMB’s overall IT Strategy;
■ Ineffective or nascent processand/or governance in place toensure ongoing alignmentwith DTMB’s overall strategy,or ability to take correctiveaction when it is getting out ofalignment.
PPM strategy is clearly
defined, communicated andsocialized throughout the
enterprise. Common attributes
include:
■ Project portfolios extendbeyond IT;
■ Mature portfolio managementobjectives with definedobjectives and metrics;
■ An appropriate governancestructure is in place tooversee and ensure theexecution of the strategy;
■ PPM has its own goals andobjectives that fully align withDTMB’s overall strategy;
■ PPM proactively determineshow well they are aligned toDTMB’s overall strategy.
PPM strategy spans the
business and is integratedinto enterprise strategic
planning, is continually
reviewed, and the strategy is
updated to align with business
objectives. Common attributes
include:
■ PPM strategy is integratedwith other enterpriseprocesses;
■ Effective governancestructure is in place tooversee the execution of thestrategy;
■ Effective PPM processesand/or governance in place toensure ongoing alignmentwith DTMB’s overall ITStrategy, and to takecorrective action when it isgetting out of alignment.
1 — Ad Hoc 2 — Reactive 3 — Challenged 4 — Managed 5 — Optimized

8/9/2019 A Current State Assessment-Finalv2 384036 7
http://slidepdf.com/reader/full/a-current-state-assessment-finalv2-384036-7 136/238
Program and Portfolio Management Current State Strategy Assessment Rationale — ITBE Survey Results

8/9/2019 A Current State Assessment-Finalv2 384036 7
http://slidepdf.com/reader/full/a-current-state-assessment-finalv2-384036-7 137/238
136
Engagement: 330002080 — Final Version© 2012 Gartner, Inc. and/or its affiliates. All rights reserved.Gartner is a registered trademark of Gartner, Inc. or its affiliates.
Yes32%
No68%
Fully aligned20%
Somewhataligned
80%
Neutral
10%
Somewhat Agree
40%
Strongly Agree50%
Are you aware of IT’s goals,
objectives and strategies?
How well are IT's strategies
aligned with your strategicbusiness requirements?
Do you agree with IT's goals,
objectives and strategies?
ITBE survey results show only one-third of the customers were aware of IT’s goals, objectives andstrategies. Of that one-third, only 20% thought that IT’s strategies aligned with their strategic businessrequirements.
Program and Portfolio ManagementCurrent State Service Level Assessment

8/9/2019 A Current State Assessment-Finalv2 384036 7
http://slidepdf.com/reader/full/a-current-state-assessment-finalv2-384036-7 138/238
137
Engagement: 330002080 — Final Version© 2012 Gartner, Inc. and/or its affiliates. All rights reserved.Gartner is a registered trademark of Gartner, Inc. or its affiliates.
PPM service levels not clearly
defined or negotiated with thecustomer. Common attributes
include:
■ No PPM service levels ormetrics for which they areaccountable to either endcustomers or other groupswithin DTMB;
■ No means of working withcustomers on an ongoingbasis to understand actualdelivery against service-levelagreements;
■ No means of continuouslyimproving to achieve betterlevels of customersatisfaction.
Basic PPM service levels
exist, but performance is noteffectively measured.
Common attributes include:
■ Few metrics are defined forPPM;
■ No or a few basic PPMservice-level agreements andmetrics for which they areaccountable to either endcustomers or other groupswithin DTMB;
■ Ability to accurately calculatemetrics is limited;
■ Little means of working withcustomers on an ongoingbasis to understand actualdelivery against service-levelagreements;
■ No means of continuouslyimproving to achieve betterlevels of customersatisfaction.
PPM service-level agreements
and metrics are established,and the organization is
accountable to end customers
and other groups within
DTMB. Common attributes
include:
■ Ability to accurately calculatePPM metrics that endcustomers partially believe tobe accurate;
■ PPM is partially able to workwith customers on an ongoingbasis to understand actualdelivery against service-levelagreements;
■ Metrics mostly related toproject and project managerperformance;
■ No means of continuouslyimproving to achieve betterlevels of customersatisfaction;
■ Servlce levels to supportchargeback and otherfinancial allocationmechanisms exist but are not
fully mature.
PPM service-level agreements
and metrics are established,and the IT support
organization is managing to
agreed-upon service levels.
Common attributes include:
■ PPM service-levelagreements and metrics forwhich they are accountable tobenchmark against peers;
■ Ability to accurately calculatePPM metrics that endcustomers and other DTMBgroups mostly believe to beaccurate;
■ Fully able to work withcustomers on an ongoingbasis to understand actualdelivery against service-levelagreements;
■ Ability to work towardimproving actual delivery tocurrent service-levelagreements;
■ Servlce levels to supportchargeback and otherfinancial allocation
mechanisms exist.
PPM service-level agreements
and metrics arecollaboratively and regularly
agreed to with customers, and
organization is fully
accountable to end customers
and other groups within
DTMB. Common attributes
include:
■ Ability to accurately calculatePPM metrics that endcustomers truly believe to beaccurate;
■ Fully able to work withcustomers on an ongoingbasis to understand actualdelivery against service-levelagreements;
■ Means of continuouslyimproving to achieve betterlevels of customer satisfactionand to increase those servicelevels in the future;
■ Best-practice chargeback andother financial allocationmechanisms are in place.
1 — Ad Hoc 2 — Reactive 3 — Challenged 4 — Managed 5 — Optimized
Program and Portfolio ManagementCurrent State Service Level Assessment Rationale

8/9/2019 A Current State Assessment-Finalv2 384036 7
http://slidepdf.com/reader/full/a-current-state-assessment-finalv2-384036-7 139/238
138
Engagement: 330002080 — Final Version© 2012 Gartner, Inc. and/or its affiliates. All rights reserved.Gartner is a registered trademark of Gartner, Inc. or its affiliates.
Strengths Weaknesses
For IO units with standardized project managementprocesses and experienced PMs, agency satisfaction with
project management services was often adequate.
Agency customers typically were satisfied with projectmanagement services provided by contractors.
DTMB is perceived as not being able to deliver big projectson time and on budget (e.g., Business Application
Modernization project for the Secretary of State has been inprogress since 2003, yet only 15% has been completed).
DTMB is often viewed by customers as not having the skillsto deliver on many larger-scale or innovative projects.Fearing that DTMB does not have the skills to completelarge projects on time and on budget, many customersprefer to go with outside contractors and vendors.
Customer satisfaction with project management servicesvaries, based on the skill and experience of the PMO staffand the ability to hire specialized contractors.
Agency customers report seeing little to no consistentmetrics for project management for projects in flight. As aresult of inconsistent and often lacking metrics, manymanagers report that they have little quantitative insight intoprojects currently in flight.
DTMB is often unable to adequately provide provisioning ina timely fashion to meet new customer demands (e.g.,
almost every agency wants mobility projects to beprovisioned much faster than DTMB can achieve).

8/9/2019 A Current State Assessment-Finalv2 384036 7
http://slidepdf.com/reader/full/a-current-state-assessment-finalv2-384036-7 140/238
Program and Portfolio ManagementCurrent State Service Level Assessment Rationale

8/9/2019 A Current State Assessment-Finalv2 384036 7
http://slidepdf.com/reader/full/a-current-state-assessment-finalv2-384036-7 141/238
140
Engagement: 330002080 — Final Version© 2012 Gartner, Inc. and/or its affiliates. All rights reserved.Gartner is a registered trademark of Gartner, Inc. or its affiliates.
ITBE survey results show that there is a large gap between satisfaction scores for projectmanagement. A major driver of this perception gap is the varying skills of PMs and the various levelsof process standardization.
ScoreImportance
9.13% 8.26% 8.10% 7.74% 7.67% 7.50% 7.35% 6.95% 6.88% 6.82% 6.73% 6.26% 5.61% 5.01%
2.07
2.67
2.25
3.31
2.07 1.43
1.93
1.62
2.73
2.25
2.67
2.08 2.13 2.20
3.47
3.79
3.23
3.813.54 3.50
3.233.07
3.653.38
3.77
3.13
3.71
3.08
1
1.5
2
2.5
3
3.5
4
4.5
5
0%
1%
2%
3%
4%
5%
6%
7%
8%
9%
10%
I m p r o v e
S e r v
i c e
Q u a
l i t y ( 1
. 4 )
S y s
t e m
F u n c
t i o n a
l i t y ( 1
. 1 3 )
S u p p o r t
R e s p o n s
i v e n e s s
( 0 . 9
8 )
S y s
t e m
Q u a
l i t y ( 0
. 5 )
S y s
t e m
I n t e g r a
t i o n
( 1 . 4
6 )
R e
d u c e
C o s
t ( 2
. 0 7 )
P r o
b l e m
M a n a g e m e n
t ( 1
. 3 )
C o s
t ( 1
. 4 5 )
S u p p o r t
E x p e r t i s e
( 0 . 9
2 )
I n c r e a s e
O u
t p u
t ( 1
. 1 3 )
S y s
t e m
P e r f o r m a n c e
( 1 . 1 )
L e a
d e r s
h i p & I n n o v a
t i o n
( 1 . 0
5 )
P r o
j e c
t M a n a g e m e n
t ( 1
. 5 9 )
C o n
t r a c
t M a n a g e m e n
t ( 0
. 8 8 )
50% Low Importance
50% Low Score
50% High Score
Least Satisfied 50% vs. Most Satisfied 50%

8/9/2019 A Current State Assessment-Finalv2 384036 7
http://slidepdf.com/reader/full/a-current-state-assessment-finalv2-384036-7 142/238
Business Intelligence and Performance ManagementGartner Framework — Business Intelligence

8/9/2019 A Current State Assessment-Finalv2 384036 7
http://slidepdf.com/reader/full/a-current-state-assessment-finalv2-384036-7 143/238
142
Engagement: 330002080 — Final Version© 2012 Gartner, Inc. and/or its affiliates. All rights reserved.Gartner is a registered trademark of Gartner, Inc. or its affiliates.
Business Intelligence
Integration
■ BI infrastructure
■ Metadatamanagement
■ Developmentenvironment
■ Workflow andcollaboration
Business Intelligence involves more than just the technical platforms for generating reports. It alsoinvolves the management of data for historical and predictive analytic purposes, as well as thegovernance of information utilized throughout the enterprise.
Information Delivery
■ Reporting
■ Ad hoc query
■ Dashboards
■ Search-based BI
Analysis
■ Online AnalyticalProcessing (OLAP)
■ Scorecarding
■ Visualization
■ Predictive modelingand data mining
Business Intelligence and Performance ManagementGartner Framework — Performance Management

8/9/2019 A Current State Assessment-Finalv2 384036 7
http://slidepdf.com/reader/full/a-current-state-assessment-finalv2-384036-7 144/238
143
Engagement: 330002080 — Final Version© 2012 Gartner, Inc. and/or its affiliates. All rights reserved.Gartner is a registered trademark of Gartner, Inc. or its affiliates.
The top-level agency metrics developed as part of Performance Management should drive all theanalytics and reporting activities down through each of the management layers in the agencies, and itshould all be supported by enterprise information management/governance.
Business Intelligence and Performance ManagementCurrent State Overview

8/9/2019 A Current State Assessment-Finalv2 384036 7
http://slidepdf.com/reader/full/a-current-state-assessment-finalv2-384036-7 145/238
144
Engagement: 330002080 — Final Version© 2012 Gartner, Inc. and/or its affiliates. All rights reserved.Gartner is a registered trademark of Gartner, Inc. or its affiliates.
BI Capabilities
■ Primary financial data warehouse (MIDB) utilizes Oracle DBMS.
■ Teradata is considered the “Enterprise Data Warehouse,” since nine departments’ worth of data are in there, and it isorganized as one data warehouse for those nine departments. There are approximately 10,000 end users for thisdata warehouse.
■ BusinessObjects being used for primary reporting layer for both Oracle and Teradata, but Cognos,InformationBuilders Webfocus, Crystal Reports, JSURS and OpenText’s BI Query also being used.
■ Capacity planning refresh just occurred, with a 25% growth assumption each year for the next four years.
■ The maintenance of the core Teradata platform has been outsource to Teradata themselves.
■ Teradata hardware maintained by a third party called Optum.
Analytic Applications
■ SAS has been chosen by CEPI as its analytics tool on MS SQL Server, and they have their own separate enterprisedata warehouse service.
Information Infrastructure
■ Approximate total database size is 11 terabytes’ worth of data that go back to 1997.
■ Teradata Parallel Transporter, DataStage and custom SQL being used for ETL activities.■ No BI Competency Center/COE today, with ad hoc sharing of resources across agencies.
Business Intelligence and Performance ManagementCurrent State Overview (continued)

8/9/2019 A Current State Assessment-Finalv2 384036 7
http://slidepdf.com/reader/full/a-current-state-assessment-finalv2-384036-7 146/238
145
Engagement: 330002080 — Final Version© 2012 Gartner, Inc. and/or its affiliates. All rights reserved.Gartner is a registered trademark of Gartner, Inc. or its affiliates.
Program Management
■ BI projects do not go through “Call for Projects” process; project prioritization done at the department level.
Business Strategy and Enterprise Metrics
■ No BI Competency Center/COE exists today, with ad hoc sharing of resources across agencies.
■ Each agency BI team maintains its own data warehouse, but nascent EIM capability exists in Shared Services.
■ Performance Management being done via many manual processes to get the info on the MiDashboard website.
■ Reporting and Analytics efforts at the top level are not currently aligned all the way through mid-level managementreporting and on down to day-to-day operational reporting in the source applications.

8/9/2019 A Current State Assessment-Finalv2 384036 7
http://slidepdf.com/reader/full/a-current-state-assessment-finalv2-384036-7 147/238
Business Intelligence and Performance ManagementCurrent State Technology Assessment

8/9/2019 A Current State Assessment-Finalv2 384036 7
http://slidepdf.com/reader/full/a-current-state-assessment-finalv2-384036-7 148/238
147
Engagement: 330002080 — Final Version© 2012 Gartner, Inc. and/or its affiliates. All rights reserved.Gartner is a registered trademark of Gartner, Inc. or its affiliates.
No or limited IT systems or
tools in place to support
business intelligence,
including functions and tools
such as:
■ Corporate performancemanagement and financialanalytics;
■ Web analytics;■ Customer service analytics;■ Content analytics;■ Social Network analysis;■ Datamart/datawarehouse;■ ETL tools;
■ OLAP/OLTP.
IT systems and tools are
present to support business
intelligence, including
functions and tools such as
those listed below. However,
tools, applications and data
are largely siloed and there is
only ad hoc coordination or
standardization across the
enterprise.
■ Corporate performancemanagement and financialanalytics;
■ Web analytics;
■ Customer service analytics;■ Content analytics;■ Social Network analysis;■ Datamart/datawarehouse;■ ETL tools;■ OLAP/OLTP.
IT systems and tools are in
place to support business
intelligence, including
functions and tools such as
those listed below. Centralized
data repository(ies) in place,
and some enterprise analytics
performed.
■ Corporate performancemanagement and financialanalytics;
■ Web analytics;■ Customer service analytics;■ Content analytics;
■ Social Network analysis;■ Datamart/datawarehouse;■ ETL tools;■ OLAP/OLTP.
IT systems and tools are in
place to support business
intelligence across the
enterprise and they are
consistently used, including
functions and tools such as
those listed below. BI used as
indicators of performance for
tactical improvement.
■ Corporate performancemanagement and financialanalytics;
■ Web analytics;■ Customer service analytics;
■ Content analytics;■ Social Network analysis;■ Datamart/datawarehouse;■ ETL tools;■ OLAP/OLTP.
IT systems and tools are in
place and support the
enterprise’s ability to improve
and optimize operational
performance using business
intelligence, including
functions and tools such as:
■ Corporate performancemanagement and financialanalytics;
■ Web analytics;■ Customer service analytics;■ Content analytics;■ Social Network analysis;
■ Datamart/datawarehouse;■ ETL tools;■ OLAP/OLTP.
1 — Ad Hoc 2 — Reactive 3 — Challenged 4 — Managed 5 — Optimized
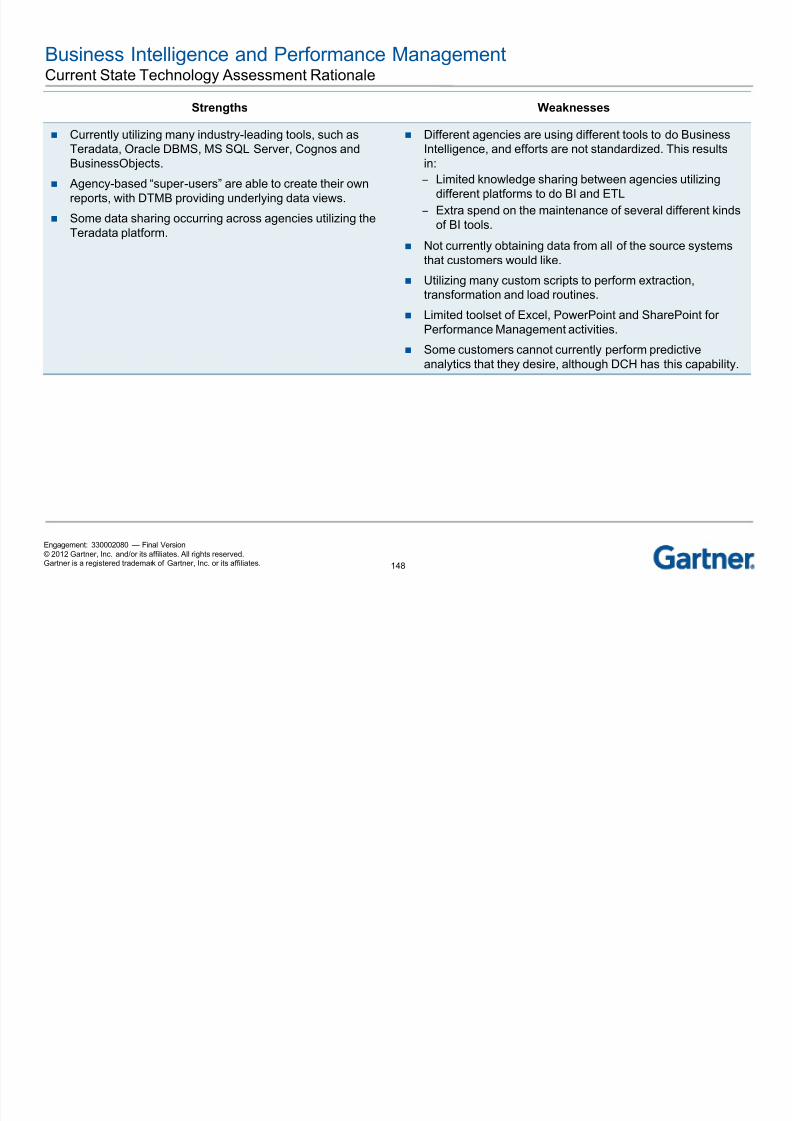
8/9/2019 A Current State Assessment-Finalv2 384036 7
http://slidepdf.com/reader/full/a-current-state-assessment-finalv2-384036-7 149/238
Business Intelligence and Performance ManagementCurrent State Organization Assessment
1 Ad H 2 R ti 3 Ch ll d 4 M d 5 O ti i d

8/9/2019 A Current State Assessment-Finalv2 384036 7
http://slidepdf.com/reader/full/a-current-state-assessment-finalv2-384036-7 150/238
149
Engagement: 330002080 — Final Version© 2012 Gartner, Inc. and/or its affiliates. All rights reserved.Gartner is a registered trademark of Gartner, Inc. or its affiliates.
No clear organizational
structure or overall
ownership ofresponsibilities for business
intelligence across the
enterprise. Common
attributes include:
■ Business application,business analysts, IT staff,executive management andPPM users have low levelsof skills required to leverageBI initiatives;
■ Reporting requires
individuals aggregating datafrom disparate data sourceswith known gaps;
■ Low staffing levels and skillsets;
■ Undefined roles andresponsibilities;
■ Low customer confidence inIT.
Ownership of business
intelligence responsibilities
within the enterprise exists,but the organization is
immature and some of the
appropriate skill sets are not
present. Common attributes
include:
Business application,business analysts, IT staff,executive management andPPM users have low levelsof skills required to leverageBI initiatives;
Missing key organizationfunctions/roles;
Inconsistently defined rolesand responsibilities;
Limited staff developmentand training budgets;
Duplicative roles; Non-optimized staffing
levels.
Organization is fairly mature
and exhibits some best
practices. Skill sets largelyalign with business
intelligence needs. Common
attributes include:
Business application,business analysts, IT staff,executive management andPPM users have mediumlevels of skills required toleverage BI initiatives;
Alignment of resources byroles and skills;
Appropriate staffing or skillsnot in place for someelements of businessintelligence;
Optimized or near-optimizedstaffing levels;
Working to adopt bestpractices;
Comprehensive staffdevelopment programs.
Business intelligence
organizational structure is
defined and aligned foreffective service delivery,
with appropriately resourced
and skilled staff. Common
attributes include:
Business application,business analysts, IT staff,executive management andPPM users have high levelsof skills required to leverageBI initiatives;
Business intelligence and
performance DTMB; Established program for
ongoing training ofresources;
Metrics-driven performancemanagement;
Detailed role definition.
Business intelligence
competency center
exists, and organizationalperformance is evaluated,
enhanced and rewarded
based on defined objectives.
Common attributes include:
Business application,business analysts, IT staff,executive management andPPM users have high levelsof skills required to leverageBI initiatives;
Organizational structure is
defined and aligned foreffective service delivery,with appropriately resourcedand skilled staff.
1 — Ad Hoc 2 — Reactive 3 — Challenged 4 — Managed 5 — Optimized
Business Intelligence and Performance ManagementCurrent State Organization Assessment Rationale
Strengths Weaknesses

8/9/2019 A Current State Assessment-Finalv2 384036 7
http://slidepdf.com/reader/full/a-current-state-assessment-finalv2-384036-7 151/238
150
Engagement: 330002080 — Final Version© 2012 Gartner, Inc. and/or its affiliates. All rights reserved.Gartner is a registered trademark of Gartner, Inc. or its affiliates.
Strengths Weaknesses
Some knowledge sharing via brown-bag lunches andsimilar activities through the Center for Shared Solutions,
and the Data Center has quarterly Common Interest Groupmeetings with all client agencies to share experiences,enhancements, and tips and techniques.
Approximately 100 developers with State and contractorpersonnel supporting agency BI requirements, althoughthere are not enough to keep up with the ongoing projectdemand in the queue.
No Business Intelligence Center of Excellence or similarorganization exists currently. As a result, developing
consistent and standardized processes across BI teams isvery difficult.
In the Job Skills Inventory, less than 30% of staff in theBusiness Intelligence job family rated themselves asqualified or highly qualified.
More reliant on contractors today than desired.
Business Intelligence and Performance ManagementCurrent State Organization Assessment Rationale — Capabilities by Business Intelligence Job Family
■ Job Family strength for FTEs currently in this job family:
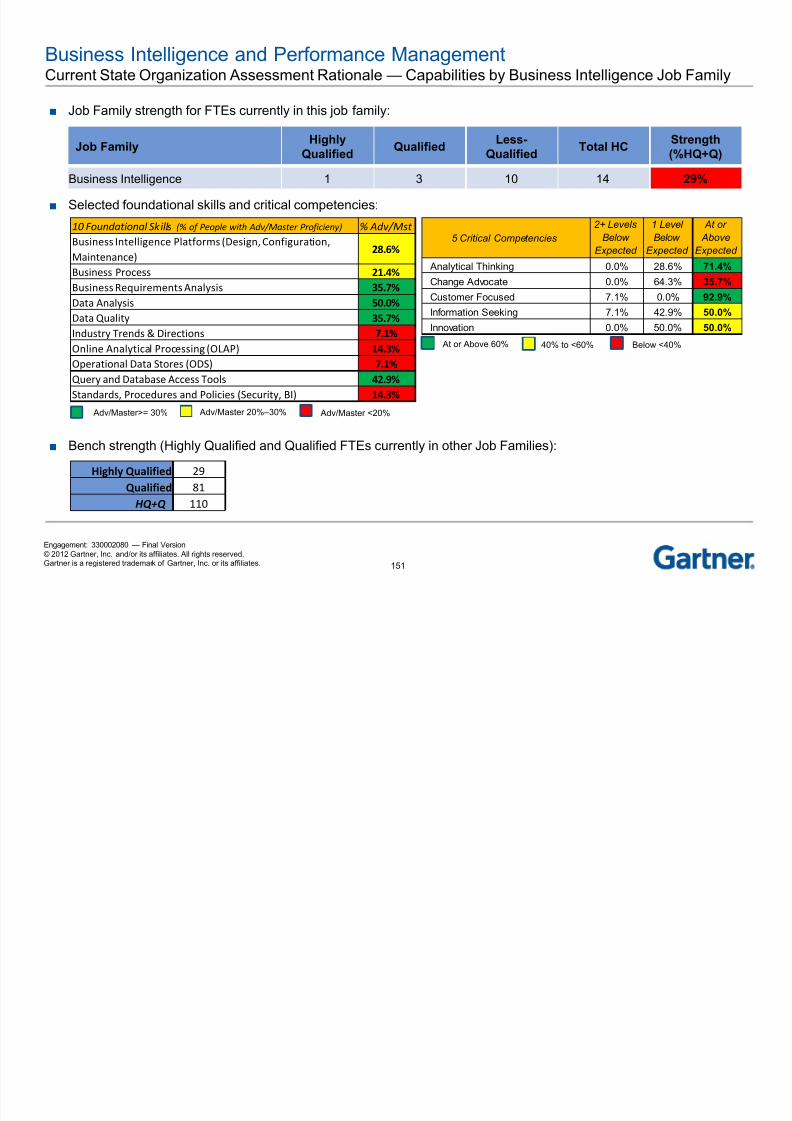
8/9/2019 A Current State Assessment-Finalv2 384036 7
http://slidepdf.com/reader/full/a-current-state-assessment-finalv2-384036-7 152/238
151
Engagement: 330002080 — Final Version© 2012 Gartner, Inc. and/or its affiliates. All rights reserved.Gartner is a registered trademark of Gartner, Inc. or its affiliates.
■ Job Family strength for FTEs currently in this job family:
■ Selected foundational skills and critical competencies:
■ Bench strength (Highly Qualified and Qualified FTEs currently in other Job Families):
Job FamilyHighly
QualifiedQualified
Less-
QualifiedTotal HC
Strength
(%HQ+Q)
Business Intelligence 1 3 10 14 29%
Highly Qualified 29
Qualified 81
HQ+Q 110
5 Critical Competencies
2+ Levels
Below
Expected
1 Level
Below
Expected
At or
Above
Expected
Analytical Thinking 0.0% 28.6% 71.4%
Change Advocate 0.0% 64.3% 35.7%
Customer Focused 7.1% 0.0% 92.9%Information Seeking 7.1% 42.9% 50.0%
Innovation 0.0% 50.0% 50.0%
10 Foundational Skills (% of People with Adv/Master Proficieny) % Adv/Mst
Business Intelligence Platforms (Design, Configuration,
Maintenance) 28.6%
Business Process 21.4%
Business Requirements Analysis 35.7%
Data Analysis 50.0%
Data Quality 35.7%
Industry Trends & Directions 7.1%
Online Analytical Processing (OLAP) 14.3%
Operational Data Stores (ODS) 7.1%
Query and Database Access Tools 42.9%
Standards, Procedures and Policies (Security, BI) 14.3%
Adv/Master>= 30% Adv/Master 20% –30% Adv/Master <20%
Below <40% At or Above 60% 40% to <60%
Business Intelligence and Performance ManagementCurrent State Process Assessment
1 Ad Hoc 2 Reactive 3 Challenged 4 Managed 5 Optimized

8/9/2019 A Current State Assessment-Finalv2 384036 7
http://slidepdf.com/reader/full/a-current-state-assessment-finalv2-384036-7 153/238
152
Engagement: 330002080 — Final Version© 2012 Gartner, Inc. and/or its affiliates. All rights reserved.Gartner is a registered trademark of Gartner, Inc. or its affiliates.
Business intelligence
processes are nonexistent, or
ad hoc. Common attributesinclude:
■ Completely ad hoc processesthat are not documented,standardized, measured orcontinuously improved;
■ “Reinvention of the wheel,”duplicative efforts.
Business intelligence
processes are largely
documented, but with limitedstandardization, and are
inconsistent from location to
location, business unit to
business unit. Common
attributes include:
■ Processes are neither welldefined nor repeatable;
■ Some or most processesdocumented;
■ Processes are notstandardized or measured,
and there is no method forimprovement.
Business intelligence
processes are standardized
and are consistently applied tothe organization. Common
attributes include:
■ Some processes andprocedures may be manual orinefficient, and workaroundsare present.
■ No measurement or means ofimproving those processes.
Business intelligence
processes are well defined
and managed consistentlyacross the enterprise.
Common attributes include:
■ Senior executives, businessusers and IT collaborate onintelligence and performancemanagement requirementsdefinition;
■ Systems, methods andpractices are followed withappropriate control andgovernance;
■ Mechanisms are in placeacross the enterprise toensure compliance.
Business intelligence
processes are mature and
efficient. Common attributesinclude:
■ Information and analysis fromBI initiatives play a key role inthe business decision-makingprocesses;
■ Business community adoptsbusiness intelligenceinformation and analysis as aregular practice;
■ Control/governancemechanisms are in place to
feed a cycle of continualenhancement and evolutionacross the enterprise.
1 — Ad Hoc 2 — Reactive 3 — Challenged 4 — Managed 5 — Optimized
Business Intelligence and Performance ManagementCurrent State Process Assessment Rationale
Strengths Weaknesses
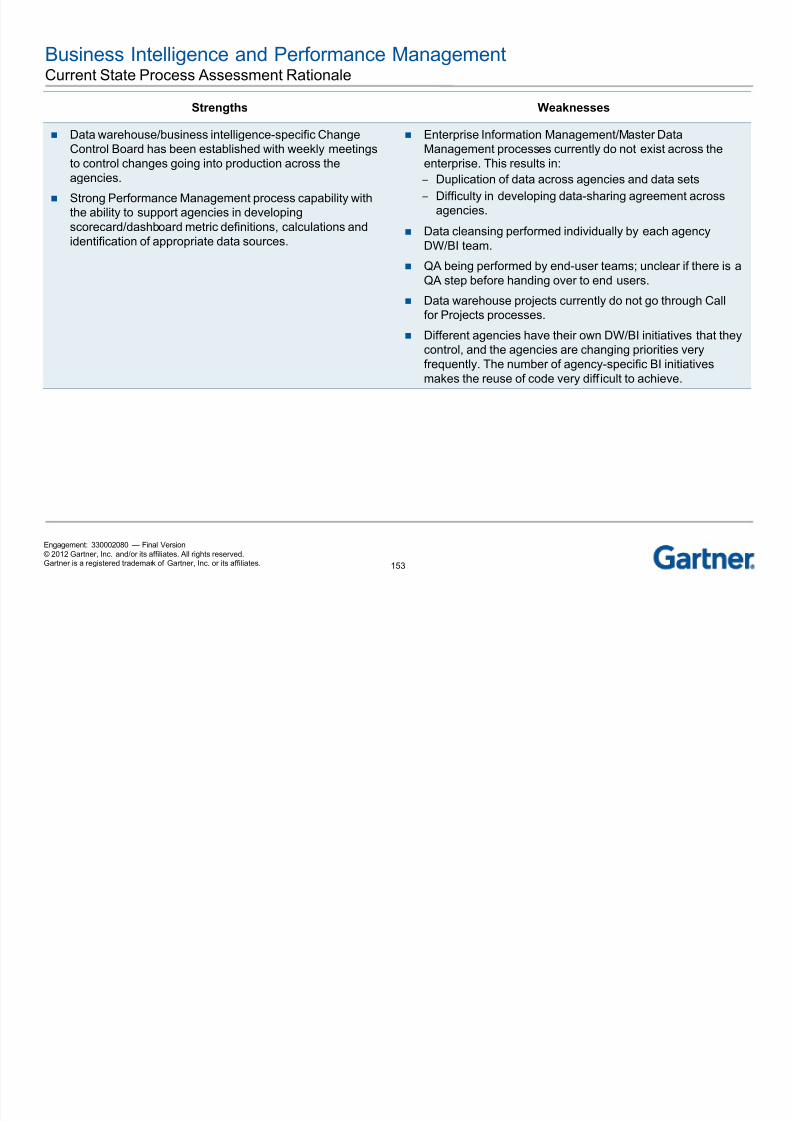
8/9/2019 A Current State Assessment-Finalv2 384036 7
http://slidepdf.com/reader/full/a-current-state-assessment-finalv2-384036-7 154/238
153
Engagement: 330002080 — Final Version© 2012 Gartner, Inc. and/or its affiliates. All rights reserved.Gartner is a registered trademark of Gartner, Inc. or its affiliates.
g
Data warehouse/business intelligence-specific ChangeControl Board has been established with weekly meetings
to control changes going into production across theagencies.
Strong Performance Management process capability withthe ability to support agencies in developingscorecard/dashboard metric definitions, calculations andidentification of appropriate data sources.
Enterprise Information Management/Master DataManagement processes currently do not exist across the
enterprise. This results in:‒ Duplication of data across agencies and data sets
‒ Difficulty in developing data-sharing agreement acrossagencies.
Data cleansing performed individually by each agencyDW/BI team.
QA being performed by end-user teams; unclear if there is aQA step before handing over to end users.
Data warehouse projects currently do not go through Callfor Projects processes.
Different agencies have their own DW/BI initiatives that theycontrol, and the agencies are changing priorities veryfrequently. The number of agency-specific BI initiativesmakes the reuse of code very diff icult to achieve.
Business Intelligence and Performance ManagementCurrent State Strategy Assessment
1 Ad Hoc 2 Reactive 3 Challenged 4 Managed 5 Optimized

8/9/2019 A Current State Assessment-Finalv2 384036 7
http://slidepdf.com/reader/full/a-current-state-assessment-finalv2-384036-7 155/238
154
Engagement: 330002080 — Final Version© 2012 Gartner, Inc. and/or its affiliates. All rights reserved.Gartner is a registered trademark of Gartner, Inc. or its affiliates.
There is no defined strategy
for business intelligence.
Common attributes include:
■ Operational process and/ortechnology investmentdecisions are made locallyand independently (inisolation of the widerenterprise) as funding is madeavailable;
■ The IT role does not have itsown goals and objectives, andsimply reacts to most-vocal orinfluential customers (either
internal or external);■ The IT role has no means of
understanding whether or notit is aligned with DTMB’soverall strategy.
A business intelligence
strategy exists, but it is not
coordinated, not clearlydefined and does not have
measurable objectives.
Common attributes include:
■ Strategy does not fullyintegrate with the widerorganization, nor is itcommunicatedenterprisewide;
■ The IT role has its own goalsand objectives, but there is noreal consideration for aligning
it with the overall DTMBstrategy;
■ Some means ofunderstanding whether or notit is optimizing to its owndesired goals, but cannotdetermine if it is really workingtoward DTMB’s overallstrategy;
■ No process and/orgovernance in place to ensureongoing alignment withDTMB’s overall strategy.
The business intelligence
strategy is defined and
communicated; however, it isnot effectively translated into
action. Common attributes
include:
■ Information and analysis usedin support of one-off tacticaldecisions;
■ The IT role has its own goalsand objectives that partiallyalign with DTMB’s overallstrategy;
■ Reactively determines how
well they are aligned toDTMB’s overall IT Strategy;
■ Ineffective or nascent processand/or governance in place toensure ongoing alignmentwith DTMB’s overall strategy,or ability to take correctiveaction when it is getting out ofalignment.
The business intelligence
strategy is clearly defined,
communicated and socializedthroughout the enterprise.
Common attributes include:
■ Information and analysis usedas key drivers in strategicdecision-making process;
■ An appropriate governancestructure is in place tooversee and ensure theexecution of the strategy;
■ Business intelligence has itsown goals and objectives that
fully align with DTMB’s overallstrategy;
■ Adequate process and/orgovernance in place to ensureongoing alignment withDTMB’s overall strategy, or totake corrective action when itis getting out of alignment.
Business intelligence is
closely integrated into, and
informs, enterprise strategicplanning. The strategy is
continually reviewed and
updated to align with business
objectives. Common attributes
include:
■ Business and IT resourcescollaborate to develop andrefine business intelligencestrategy and requirements;
■ DTMB business intelligencestrategy includes customers
and business partners asappropriate;
■ Strategy is clearly defined andcommunicated throughout theenterprise;
■ Effective processes and/orgovernance in place to ensureongoing alignment withDTMB’s overall IT Strategy,and to take corrective actionwhen it is getting out ofalignment.
1 — Ad Hoc 2 — Reactive 3 — Challenged 4 — Managed 5 — Optimized
Business Intelligence and Performance ManagementCurrent State Strategy Assessment Rationale
Strengths Weaknesses

8/9/2019 A Current State Assessment-Finalv2 384036 7
http://slidepdf.com/reader/full/a-current-state-assessment-finalv2-384036-7 156/238
155
Engagement: 330002080 — Final Version© 2012 Gartner, Inc. and/or its affiliates. All rights reserved.Gartner is a registered trademark of Gartner, Inc. or its affiliates.
Each agency team meeting with its respective agenciesregularly to determine and fulfill their needs for underlying
data warehouses. Office of Enterprise Development’s Performance
Management team has a complete vision ofdashboarding/scorecarding at the highest level.
Data Warehousing organization received a NASCIO awardfor the DHS Decision Support System.
Improved fraud detection enabled as part of DCH CHAMPSinitiative, which is an important part of the DCH agency
strategic plan.
Inconsistent BI strategies across agencies.
No Enterprise Information Management strategy currently
exists at enterprise level.
No Master Data Management strategy currently exists atenterprise level.
No clear evidence of connecting Performance Managementefforts to the BI initiatives happening within the agencies.This results in an unclear line of sight from highest strategicmetric level down to the reporting that frontline levelmanagers are seeing.
Business Intelligence and Performance ManagementCurrent State Service Level Assessment
1 — Ad Hoc 2 — Reactive 3 — Challenged 4 — Managed 5 — Optimized
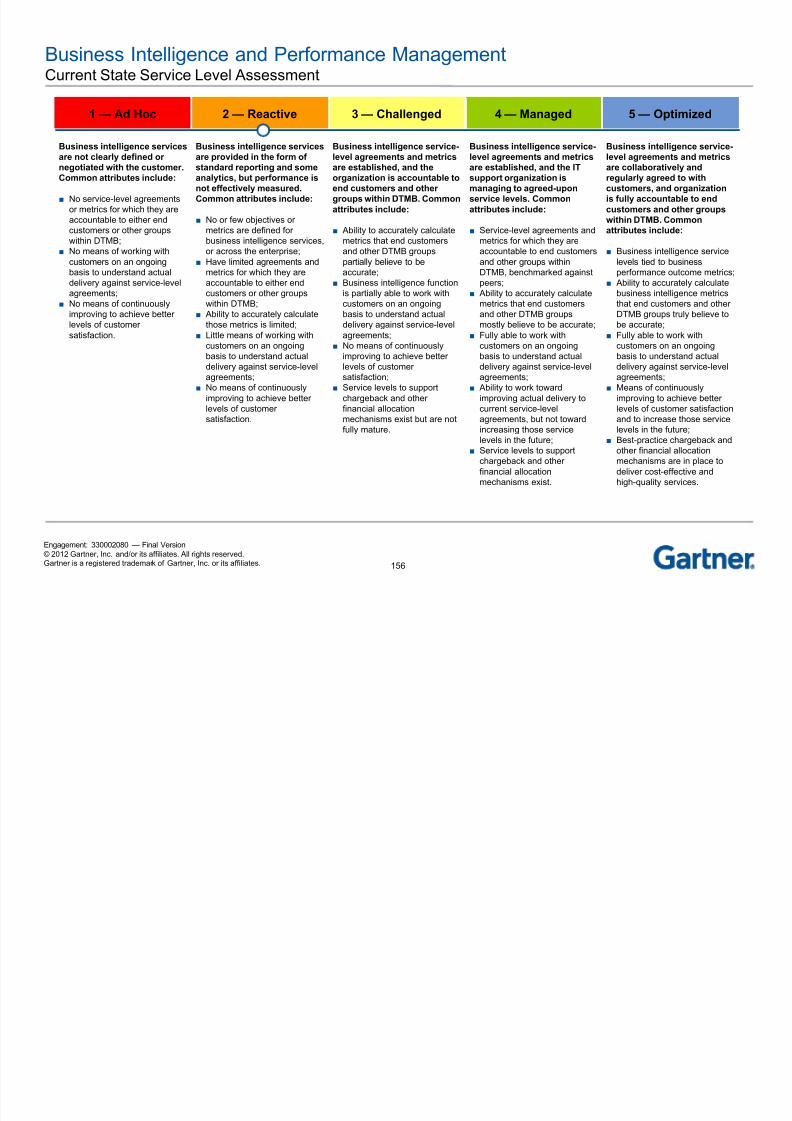
8/9/2019 A Current State Assessment-Finalv2 384036 7
http://slidepdf.com/reader/full/a-current-state-assessment-finalv2-384036-7 157/238
156
Engagement: 330002080 — Final Version© 2012 Gartner, Inc. and/or its affiliates. All rights reserved.Gartner is a registered trademark of Gartner, Inc. or its affiliates.
Business intelligence services
are not clearly defined or
negotiated with the customer.Common attributes include:
■ No service-level agreementsor metrics for which they areaccountable to either endcustomers or other groupswithin DTMB;
■ No means of working withcustomers on an ongoingbasis to understand actualdelivery against service-levelagreements;
■ No means of continuouslyimproving to achieve betterlevels of customersatisfaction.
Business intelligence services
are provided in the form of
standard reporting and someanalytics, but performance is
not effectively measured.
Common attributes include:
■ No or few objectives ormetrics are defined forbusiness intelligence services,or across the enterprise;
■ Have limited agreements andmetrics for which they areaccountable to either endcustomers or other groups
within DTMB;■ Ability to accurately calculate
those metrics is limited;■ Little means of working with
customers on an ongoingbasis to understand actualdelivery against service-levelagreements;
■ No means of continuouslyimproving to achieve betterlevels of customersatisfaction.
Business intelligence service-
level agreements and metrics
are established, and theorganization is accountable to
end customers and other
groups within DTMB. Common
attributes include:
■ Ability to accurately calculatemetrics that end customersand other DTMB groupspartially believe to beaccurate;
■ Business intelligence functionis partially able to work with
customers on an ongoingbasis to understand actualdelivery against service-levelagreements;
■ No means of continuouslyimproving to achieve betterlevels of customersatisfaction;
■ Service levels to supportchargeback and otherfinancial allocationmechanisms exist but are notfully mature.
Business intelligence service-
level agreements and metrics
are established, and the ITsupport organization is
managing to agreed-upon
service levels. Common
attributes include:
■ Service-level agreements andmetrics for which they areaccountable to end customersand other groups withinDTMB, benchmarked againstpeers;
■ Ability to accurately calculate
metrics that end customersand other DTMB groupsmostly believe to be accurate;
■ Fully able to work withcustomers on an ongoingbasis to understand actualdelivery against service-levelagreements;
■ Ability to work towardimproving actual delivery tocurrent service-levelagreements, but not towardincreasing those service
levels in the future;■ Service levels to support
chargeback and otherfinancial allocationmechanisms exist.
Business intelligence service-
level agreements and metrics
are collaboratively andregularly agreed to with
customers, and organization
is fully accountable to end
customers and other groups
within DTMB. Common
attributes include:
■ Business intelligence servicelevels tied to businessperformance outcome metrics;
■ Ability to accurately calculatebusiness intelligence metrics
that end customers and otherDTMB groups truly believe tobe accurate;
■ Fully able to work withcustomers on an ongoingbasis to understand actualdelivery against service-levelagreements;
■ Means of continuouslyimproving to achieve betterlevels of customer satisfactionand to increase those servicelevels in the future;
■ Best-practice chargeback andother financial allocationmechanisms are in place todeliver cost-effective andhigh-quality services.
1 — Ad Hoc 2 — Reactive 3 — Challenged 4 — Managed 5 — Optimized
Business Intelligence and Performance ManagementCurrent State Service Level Assessment Rationale
Strengths Weaknesses
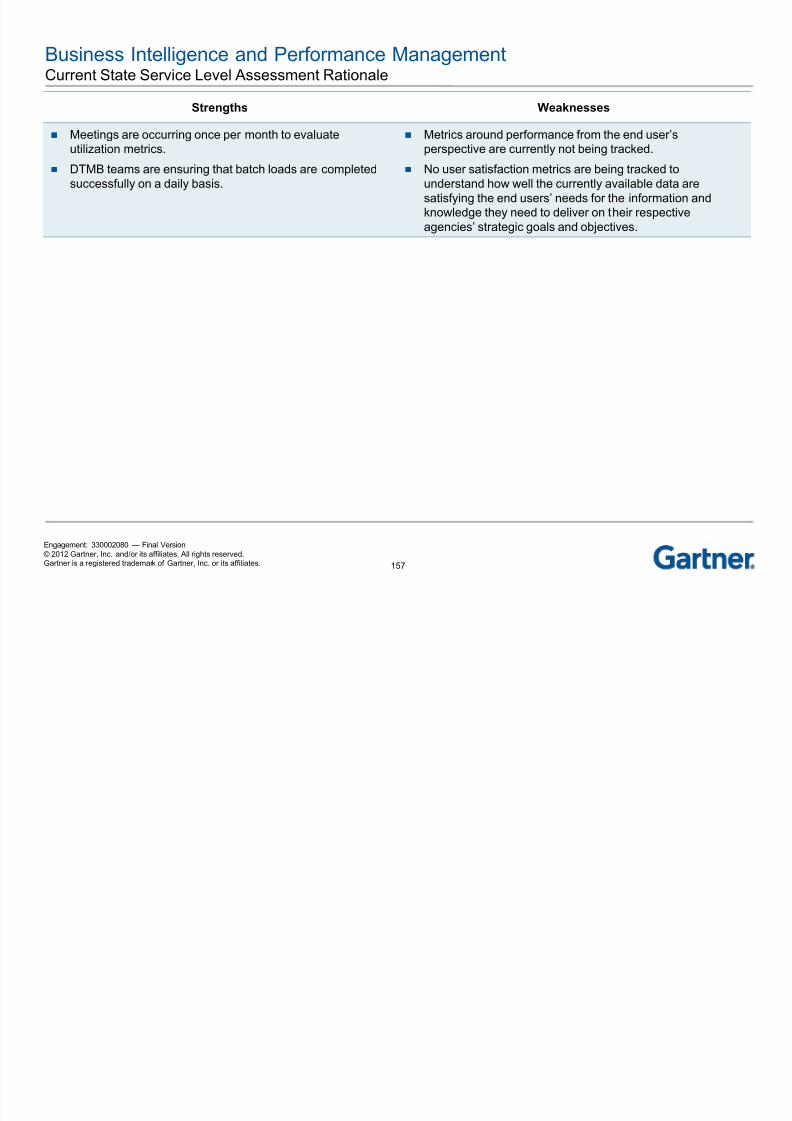
8/9/2019 A Current State Assessment-Finalv2 384036 7
http://slidepdf.com/reader/full/a-current-state-assessment-finalv2-384036-7 158/238
157
Engagement: 330002080 — Final Version© 2012 Gartner, Inc. and/or its affiliates. All rights reserved.Gartner is a registered trademark of Gartner, Inc. or its affiliates.
Meetings are occurring once per month to evaluateutilization metrics.
DTMB teams are ensuring that batch loads are completedsuccessfully on a daily basis.
Metrics around performance from the end user’sperspective are currently not being tracked.
No user satisfaction metrics are being tracked tounderstand how well the currently available data aresatisfying the end users’ needs for the information andknowledge they need to deliver on their respectiveagencies’ strategic goals and objectives.

8/9/2019 A Current State Assessment-Finalv2 384036 7
http://slidepdf.com/reader/full/a-current-state-assessment-finalv2-384036-7 159/238
158
Engagement: 330002080 — Final Version© 2012 Gartner, Inc. and/or its affiliates. All rights reserved.Gartner is a registered trademark of Gartner, Inc. or its affiliates.
Enterprise Architecture
Current State Assessment and Maturity Analysis
Current State =
Target State =
Enterprise ArchitectureGartner Framework — EA Is Made Up of These…

8/9/2019 A Current State Assessment-Finalv2 384036 7
http://slidepdf.com/reader/full/a-current-state-assessment-finalv2-384036-7 160/238
159
Engagement: 330002080 — Final Version© 2012 Gartner, Inc. and/or its affiliates. All rights reserved.Gartner is a registered trademark of Gartner, Inc. or its affiliates.
Enterprise ArchitectureCurrent State Overview
EA i DTMB i d b hi f hit t h i di t t t th h d f I f t t

8/9/2019 A Current State Assessment-Finalv2 384036 7
http://slidepdf.com/reader/full/a-current-state-assessment-finalv2-384036-7 161/238
160
Engagement: 330002080 — Final Version© 2012 Gartner, Inc. and/or its affiliates. All rights reserved.Gartner is a registered trademark of Gartner, Inc. or its affiliates.
■ EA in DTMB is managed by a chief architect, who is a direct report to the head of InfrastructureServices.
■ EA consists of two teams/components: – The EA Division, which sets and manages the technical standards and facilitates the EA process across DTMB
(workshops, EA planning, specialized projects)
– The EA Core Group, which consists of 40 –45 members from across DTMB. The goal of the EA Core Group is:
• Be an advocate for architecture practices and help grow the EA discipline in DTMB
• Monitor and update technology life cycle road maps every six to eight months
• Provide subject matter expertise in conducting EA technical standards compliance reviews and providing input to
technical architecture for DTMB project submissions. – Core Team members are expected to be SMEs in their f ield and act as ambassadors for both EA and their
respective department/Agency.
■ EA has a SharePoint site which acts as a central repository for all EA-related documents andstandards.
■ EA is integrated into the SUITE methodology, and all projects are required to obtain EA complianceapproval prior to deploying new technologies into their environments.
Enterprise ArchitectureCurrent State Overview (continued)
EA process begins with the EA core team submissions

8/9/2019 A Current State Assessment-Finalv2 384036 7
http://slidepdf.com/reader/full/a-current-state-assessment-finalv2-384036-7 162/238
161
Engagement: 330002080 — Final Version© 2012 Gartner, Inc. and/or its affiliates. All rights reserved.Gartner is a registered trademark of Gartner, Inc. or its affiliates.
EA process begins with the EA core team submissions.
EA Core Team operates a technical domain workgroup that repeatedly refreshes thetechnology life cycle road maps for various technologies.
EA Solution Assessment Templates are created based off the current version of theTechnology Life Cycle Road Map.
DTMB project teams (i.e., a PM in Agency Services working on a project) uses the templateto create an EA project solution assessment.
The EA Core Team reviews the Project Assessment.
‒ If necessary, an EA workshop is conducted to create a workable solution within thestandards set by the domain workgroup and published in the technology life cycle roadmaps.
EA Division conducts EA workshops to help customers with solution design and problemresolution.
The project assessment is reviewed for completeness by the EA Division, composed of themembers of the EA department.
The EA Division validates the Project Solution for completeness and publishes it to theSharePoint Library.
State of Michigan Current State OverviewEnterprise Architecture Major Findings
Technolog■ DTMB has a dedicated EA Division and a core team that is
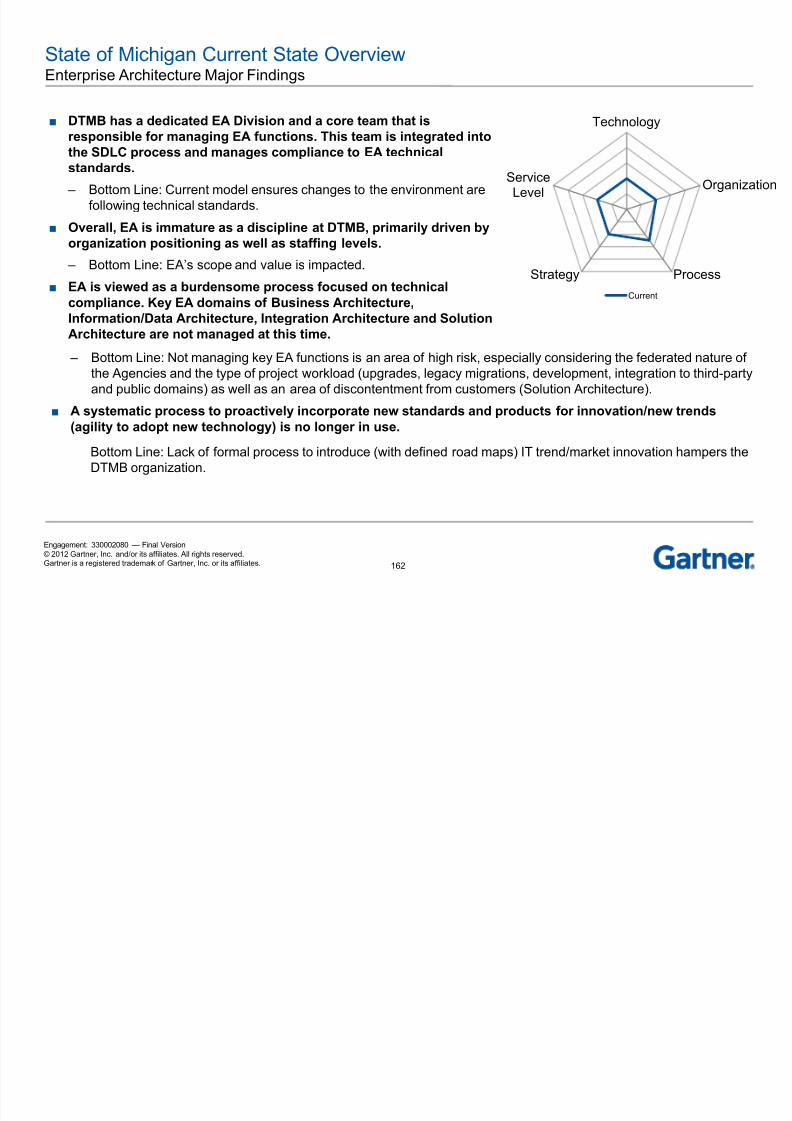
8/9/2019 A Current State Assessment-Finalv2 384036 7
http://slidepdf.com/reader/full/a-current-state-assessment-finalv2-384036-7 163/238
162
Engagement: 330002080 — Final Version© 2012 Gartner, Inc. and/or its affiliates. All rights reserved.Gartner is a registered trademark of Gartner, Inc. or its affiliates.
Technology
Organization
ProcessStrategy
ServiceLevel
Current
■ DTMB has a dedicated EA Division and a core team that is
responsible for managing EA functions. This team is integrated into
the SDLC process and manages compliance to EA technical
standards.
– Bottom Line: Current model ensures changes to the environment arefollowing technical standards.
■ Overall, EA is immature as a discipline at DTMB, primarily driven by
organization positioning as well as staffing levels.
– Bottom Line: EA’s scope and value is impacted.
■ EA is viewed as a burdensome process focused on technical
compliance. Key EA domains of Business Architecture,Information/Data Architecture, Integration Architecture and Solution
Architecture are not managed at this time.
– Bottom Line: Not managing key EA functions is an area of high risk, especially considering the federated nature ofthe Agencies and the type of project workload (upgrades, legacy migrations, development, integration to third-partyand public domains) as well as an area of discontentment from customers (Solution Architecture).
■ A systematic process to proactively incorporate new standards and products for innovation/new trends
(agility to adopt new technology) is no longer in use.
Bottom Line: Lack of formal process to introduce (with defined road maps) IT trend/market innovation hampers theDTMB organization.
Enterprise Architecture Current State Technology Assessment
1 — Ad Hoc 2 — Reactive 3 — Challenged 4 — Managed 5 — Optimized

8/9/2019 A Current State Assessment-Finalv2 384036 7
http://slidepdf.com/reader/full/a-current-state-assessment-finalv2-384036-7 164/238
163
Engagement: 330002080 — Final Version© 2012 Gartner, Inc. and/or its affiliates. All rights reserved.Gartner is a registered trademark of Gartner, Inc. or its affiliates.
No or limited IT systems or
tools in place to support
enterprise architecture,including tools such as:
■ Basic tools such as Word,Visio and PowerPoint (orequivalents) used todocument EA;
■ Collaboration tools;■ Specialized EA tools;■ Integrated solutions (EA tools
integrated with related toolssuch as CMDB, BPM).
IT systems and tools are
presently in place to support
enterprise architecture,including tools such as those
listed below. However, no or
limited coordination or
standardization across the
enterprise.
■ Basic tools such as Word,Visio and PowerPoint (orequivalents) used todocument EA;
■ Collaboration tools;■ Specialized EA tools.
■ Integrated solutions (EA toolsintegrated with related toolssuch as EA portals, CMDB,BPM).
IT systems and tools are in
place to support enterprise
architecture, including toolssuch as those listed below.
Inconsistent usage of tools
(e.g., planning only, large
projects, etc.).
■ Basic tools such as Word,Visio and PowerPoint (orequivalents) used todocument EA;
■ Collaboration tools;■ Specialized EA tools;■ Integrated solutions (EA tools
integrated with related toolssuch as EA portals, CMDB,BPM).
IT tools and systems are in
place to support enterprise
architecture across theenterprise and are
consistently used, including
tools such as those listed
below.
■ Basic tools such as Word,Visio and PowerPoint (orequivalents) used todocument EA;
■ Collaboration tools;■ Specialized EA tools;■ Integrated solutions (EA tools
integrated with related toolssuch as CMDB, BPM).
IT systems and tools are in
place to proactively integrate
enterprise architecture andsupport the enterprise’s ability
to improve and optimize
operational performance using
tools such as:
■ Basic tools such as Word,Visio and PowerPoint (orequivalents) used todocument EA;
■ Collaboration tools;■ Specialized EA tools;■ Integrated solutions (EA tools
integrated with related toolssuch as EA portals, CMDB,BPM).
g g p
Enterprise ArchitectureCurrent State Technology Assessment Rationale
Strengths Weaknesses

8/9/2019 A Current State Assessment-Finalv2 384036 7
http://slidepdf.com/reader/full/a-current-state-assessment-finalv2-384036-7 165/238
164
Engagement: 330002080 — Final Version© 2012 Gartner, Inc. and/or its affiliates. All rights reserved.Gartner is a registered trademark of Gartner, Inc. or its affiliates.
The Enterprise Architecture team is using a shared centralrepository for hosting all EA-related artifacts and
documents.‒ Repository leverages SharePoint and is available through
the DTMB intranet.
EA artifacts have been built internally using SharePoint andMS Office documents for ease of use and sharing acrossDTMB.
No EA tool is being leveraged; the EA tools being used areself-built (SharePoint and MS Office documents).
‒User feedback indicated tools were difficult to leverageand use for research and EA submissions.
EA content is manually updated and maintained.
Email/SharePoint is the primary tool used to communicateduring the EA process review for 40+ people.
With many areas to manage and coordinate, lack ofautomation and tooling make it difficult for both the EAdivision and the customers to utilize the repository
effectively.
Enterprise Architecture
Current State Organization Assessment
1 — Ad Hoc 2 — Reactive 3 — Challenged 4 — Managed 5 — Optimized

8/9/2019 A Current State Assessment-Finalv2 384036 7
http://slidepdf.com/reader/full/a-current-state-assessment-finalv2-384036-7 166/238
165
Engagement: 330002080 — Final Version© 2012 Gartner, Inc. and/or its affiliates. All rights reserved.Gartner is a registered trademark of Gartner, Inc. or its affiliates.
No clear organizational
structure or overall ownership
of EA responsibilities forenterprise. Common attributes
include:
■ EA not valued within theorganization;
■ No dedicated resources forenterprise architecture astheir primary responsibility;
■ No or low EA accountability atboth the project and ongoingoperations levels;
■ No or extremely limited EA
training or certificationspresent;
■ Low skill sets;■ Undefined roles and
responsibilities.
Ownership of EA
responsibilities within the
enterprise exists, but theorganization is immature and
some of the appropriate skill
sets are not present. Common
attributes include:
■ General understanding ofimportance of EA, but largelyviewed as project andoperational “overhead;”
■ Organizational structure isdefined but it is not aligned foreffective service delivery;
■ Ad hoc EA “policing” ofadherence to standards;
■ Missing key organizationfunctions/roles;
■ One or a few dedicatedresources for enterprisearchitecture as their primaryresponsibility;
■ Low EA accountability at boththe project and ongoingoperations levels, often onlyfor major projects/initiatives;
■ Limited EA training or
certifications present.
EA organizational structure
defined and fairly mature, and
exhibits some best practices.Skill sets largely align with EA
needs and training, and
certifications are present.
Common attributes include:
■ EA valued and partiallyintegrated intoprogram/project andoperational organizationalstructure;
■ Single organization unit“owns” EA;
■ Organizational structure isdefined and aligned foreffective service delivery;
■ Alignment of resources byroles and skills;
■ Appropriate number ofdedicated resources forenterprise architecture astheir primary responsibility;
■ Working to adopt bestpractices;
■ Some competency centersestablished;
■ Defined senior-levelgovernance structure andcharters;
■ Basic, but effective, staffdevelopment, training andcertification programs inplace.
EA organizational structure
defined and aligned for
effective service delivery andenforcement with
appropriately resourced and
skilled staff. Common
attributes include:
■ EA valued and completelyintegrated intoprogram/project andoperational organizationalstructure;
■ Organizational structure isdefined and aligned for
effective service delivery, withappropriately resourced andskilled staff;
■ Subject matter expertsrecruited temporarily into EAvirtual teams to participate indevelopment;
■ Established program forongoing training of resourcesand resource development;
■ Service-delivery-focusedorganization with strongrelationship managers and
service line;■ Trusted service provider anddemonstrated value tobusiness;
■ Metrics-driven performancemanagement;
■ Detailed role definition.
EA organizational
performance is evaluated,
enhanced and rewarded basedon defined objectives.
Common attributes include:
■ EA sits at executive level andis an integral part of corporateculture;
■ Organizational structureintegrated with business andfocused on businessoutcomes;
■ Business/IT Staff rotation;■ Developing best practices;
■ Focused staff developmentand training competencycenters;
■ Business-driven metrics andresourcing.
Enterprise Architecture Current State Organization Assessment Rationale
Strengths Weaknesses

8/9/2019 A Current State Assessment-Finalv2 384036 7
http://slidepdf.com/reader/full/a-current-state-assessment-finalv2-384036-7 167/238
166
Engagement: 330002080 — Final Version© 2012 Gartner, Inc. and/or its affiliates. All rights reserved.Gartner is a registered trademark of Gartner, Inc. or its affiliates.
A dedicated EA Program office is in place that manages EAofferings across DTMB; the program office is called the EA
Division. The EA Division is headed by a dedicated Chief Architect.
The EA Division leverages a group of DTMB resources inthe form of an EA Core team.
‒ The EA Core team is a federated EA architect communitythat provides EA governance, policy and technicalexpertise to EA offerings, EA Standards and EAsubmissions.
Few agencies have dedicated EA specialists who areresponsible for driving the EA efforts and Solution Architecture efforts at an agency level.
‒ However, this type of dedicated resourcing is very limitedacross the agencies and is constrained by lack ofcoordination with the EA Division, as well as scope ofarchitect services provided.
A true Chief Technology Officer (CTO) function that drivesinnovation, technology adoption and technology
standardization that works with the EA division does notexist.
The EA Division reports into the Infrastructure ServicesDirector and not the CIO/CTO.
EA Division has little integration with capital planning efforts(apart from input to Call for Projects list).
EA Division has limited staffing that is not enough to coverthe scope and breadth of EA needs and requirementsacross the DTMB agencies and the associatedprojects/programs.
A governance process that manages EA across DTMB toset priorities, direction, issue resolution, planning andauthority does not exist.
Unclear on the ownership and roles and responsibilities ofEA functions between Agency Services, EA Division (andthe EA core team) and Shared Solutions.
Enterprise Architecture Current State Organization Assessment Rationale (continued)
Strengths Weaknesses (continued)

8/9/2019 A Current State Assessment-Finalv2 384036 7
http://slidepdf.com/reader/full/a-current-state-assessment-finalv2-384036-7 168/238
167
Engagement: 330002080 — Final Version© 2012 Gartner, Inc. and/or its affiliates. All rights reserved.Gartner is a registered trademark of Gartner, Inc. or its affiliates.
Communication planning or a formal communication officeis not in place.
‒
Little or no formal communication from EA Division toCSDs, project managers, developers, etc.
‒ Value of EA and impacts of proper EA initiatives were notidentified.
‒ Agency services have different view of what EA shouldoffer; EA Division has different view of what canrealistically be offered.
Formally defined Architecture roles do not exist in themajority of agencies.
The EA core group is the foundation for maintaining andmanaging standards across DTMB. However, this group isvolunteer in nature.
Little to no EA training is available for existing architectsand Agency services.
In the Job Skills Inventory, less than 30% of staff in the Architecture job family rated themselves as qualified orhighly qualified.
EA is viewed as a policing service and not a strategic
service. Resource issue (staffing levels) and misalignment of
organization functions impacts the adoption of supportingnew technologies.
EA process cannot quantify its value to DTMB.
Current Capabilities by Job FamilyCurrent State Organization Assessment Rationale — Capabilities by Architecture Job Family
■ Job Family strength for FTEs currently in this job family:

8/9/2019 A Current State Assessment-Finalv2 384036 7
http://slidepdf.com/reader/full/a-current-state-assessment-finalv2-384036-7 169/238
168
Engagement: 330002080 — Final Version© 2012 Gartner, Inc. and/or its affiliates. All rights reserved.Gartner is a registered trademark of Gartner, Inc. or its affiliates.
■ Job Family strength for FTEs currently in this job family:
■ Selected foundational skills and critical competencies:
■ Bench strength (Highly Qualified and Qualified FTEs currently in other Job Families):
Highly Qualified 21
Qualified 71
HQ+Q 92
Job FamilyHighly
Qualified
QualifiedLess-
Qualified
Total HCStrength
(%HQ+Q)
Architecture 3 6 22 31 29%
Adv/Master >= 30% Adv/Master 20% –30% Adv/Master <20%
Below <40% At or Above 60% 40% to <60%
10 Foundational Skills (% of People with Adv/Master Proficieny) % Adv/Mst
Data and Information Architecture 38.7%
Enterprise Architecture and Strategic Planning 41.9%
Governance 25.8%
IT Trends & Directions 41.9%
Network Architecture 35.5%
Product and Vendor Evaluation 35.5%
Security Architecture 29.0%
Solution Architecture 41.9%
Standards, Procedures and Policies 45.2%
Technical Architecture 58.1%
5 Critical Competencies
2+ Levels
Below
Expected
1 Level
Below
Expected
At or
Above
Expected
Building Partnerships 25.8% 51.6% 22.6%
Change Advocate 32.3% 38.7% 29.0%Consulting 22.6% 48.4% 29.0%
Innovation 25.8% 35.5% 38.7%
Strategic Planning 41.9% 45.2% 12.9%
Enterprise Architecture Current State Process Assessment
1 — Ad Hoc 2 — Reactive 3 — Challenged 4 — Managed 5 — Optimized

8/9/2019 A Current State Assessment-Finalv2 384036 7
http://slidepdf.com/reader/full/a-current-state-assessment-finalv2-384036-7 170/238
169
Engagement: 330002080 — Final Version© 2012 Gartner, Inc. and/or its affiliates. All rights reserved.Gartner is a registered trademark of Gartner, Inc. or its affiliates.
Processes to support
enterprise architecture are
non-existent, or ad hoc.Common attributes include:
■ Absence of EA processes,with some adherence toinformal or nascent standards;
■ Completely ad hoc processesthat are not documented,standardized, measured orcontinuously improved.
Processes to support
enterprise architecture are
largely documented; formalprocesses are nascent and
focused on policing and
compliance. Common
attributes include:
■ Nascent or partial enterprisearchitecture principles andstandards been created,delivered, approved and/orcommunicated to theorganization;
■ Limited gating and review
processes are in place toensure that EA Strategy isenforced;
■ Processes are neither welldefined nor repeatable;
■ Some or most processesdocumented;
■ Processes are notstandardized or measured,and there is no method forimprovement.
Processes to support
enterprise architecture are
standardized and areconsistently applied to the
organization. Common
attributes include:
■ Enterprise architectureprinciples and standards beencreated, delivered, approvedand/or communicated to theorganization;
■ Formal gating and reviewprocesses are in place toensure that EA Strategy is
enforced;■ Business unit management,
infrastructure, applicationsproject management andoperations have involvementin EA program for theenterprise;
■ Defined process for handlingarchitectural exceptions;
■ Highly valuable subset of EAdeliverables been identified,prioritized and scheduled fordevelopment.
Processes to support
enterprise architecture are
well defined and managedconsistently across the
enterprise. Common attributes
include:
■ Enterprise architectureprinciples and standards areperiodically revisited and alignwith best practices;
■ Formal gating and reviewprocesses are an enterprisepriority to ensure that EAStrategy is enforced;
■ Senior management haveinvolvement in EA program forthe enterprise;
■ Business unit management,infrastructure, applicationsproject management andoperations have consistent,coordinated involvement inEA program for the enterprise;
■ EA refreshed annually;■ Ad hoc, or partially planned
EA communication activities;■ Highly valuable subset of EA
deliverables developed andutilized;■ Mechanisms are in place
across the enterprise toensure EA compliance.
Processes to support
enterprise architecture are
mature and efficient. Commonattributes include:
■ Enterprise architectureprinciples and standards arecontinuously revisited andcontribute to definition of bestpractices;
■ Formal gating and reviewprocesses are valued bybusiness to ensure that EAStrategy is enforced;
■ EA aligned with business
objectives and metrics;■ EA integrated with all other
key process areas;■ Formally planned EA
communication activities;■ EA refreshed at least annually
or more frequently when out-of-cycle changes occur;
■ Highly valuable subset of EAdeliverables optimized withbusiness input.

8/9/2019 A Current State Assessment-Finalv2 384036 7
http://slidepdf.com/reader/full/a-current-state-assessment-finalv2-384036-7 171/238
Enterprise ArchitectureCurrent State Process Assessment Rationale (continued)
Strengths Weaknesses (continued)

8/9/2019 A Current State Assessment-Finalv2 384036 7
http://slidepdf.com/reader/full/a-current-state-assessment-finalv2-384036-7 172/238
171
Engagement: 330002080 — Final Version© 2012 Gartner, Inc. and/or its affiliates. All rights reserved.Gartner is a registered trademark of Gartner, Inc. or its affiliates.
Federated architecture model does not have controls inplace to coordinate architectural efforts across Agency
Services, apart from compliance-based review cycles. EA process documentation is at a high level from the EA
Division. However, Agency Services do not have anyrequirement to document and maintain standard EAdocumentation and EA artifacts across their domains.
Enterprise ArchitectureCurrent State Strategy Assessment
1 — Ad Hoc 2 — Reactive 3 — Challenged 4 — Managed 5 — Optimized

8/9/2019 A Current State Assessment-Finalv2 384036 7
http://slidepdf.com/reader/full/a-current-state-assessment-finalv2-384036-7 173/238
172
Engagement: 330002080 — Final Version© 2012 Gartner, Inc. and/or its affiliates. All rights reserved.Gartner is a registered trademark of Gartner, Inc. or its affiliates.
There is no defined strategy or
for enterprise architecture.
Common attributes include:
■ EA does not have its owngoals and objectives, andsimply reacts to most-vocal orinfluential customers (eitherinternal or external);
■ EA has no means ofunderstanding whether or notit is aligned with DTMB’soverall strategy;
■ No process and/orgovernance in place to ensureongoing alignment withDTMB’s overall strategy.
An enterprise architecture
strategy exists, but it is not
coordinated, not clearlydefined, and does not have
measurable objectives.
Common attributes include:
■ EA strategy does not fullyintegrate with the widerorganization, nor is itcommunicatedenterprisewide;
■ EA has its own goals andobjectives, but there is no realconsideration for aligning itwith the overall DTMBstrategy;
■ Some means ofunderstanding whether or notit is optimizing to its owndesired goals, but cannotdetermine if it is really workingtoward DTMB’s overallstrategy;
■ No or limited ability to ensureongoing alignment withDTMB’s overall strategy.
The enterprise architecture
strategy is defined and
communicated; however, it isnot consistently or effectively
translated into action.
Common attributes include:
■ EA governance isinadequately established,allowing for theimplementation of the strategyto become fragmented andconfused across theenterprise;
■ EA has its own goals andobjectives that partially alignwith DTMB’s overall strategy;
■ Reactively determines howwell they are aligned toDTMB’s overall strategy;
■ Ineffective or nascent ability toensure ongoing alignmentwith DTMB’s overall strategy,or ability to take correctiveaction when it is getting out ofalignment.
The enterprise architecture
strategy is clearly defined,
communicated and socializedthroughout the enterprise.
Common attributes include:
■ EA governance effectivelyused to articulate howarchitecture developmentdecisions are made;
■ EA has its own goals andobjectives that fully align withDTMB’s overall strategy;
■ Proactively determines howwell they are aligned toDTMB’s overall strategy;
■ Adequate ability to ensureongoing alignment withDTMB’s overall strategy, or totake corrective action when itis getting out of alignment.
Enterprise architecture is fully
integrated with strategic
planning, continuallyreviewed, and the strategy is
updated to align with business
objectives. Common attributes
include:
■ EA governance fully andeffectively integrated withbusiness;
■ EA strategy is clearly definedand communicatedthroughout the enterprise;
■ The IT role has its own goalsand objectives that fully alignwith DTMB’s overall strategy;
■ Proactively determines howwell they are aligned toDTMB’s overall strategy;
■ Effective ability to ensureongoing alignment withDTMB’s overall strategy, andto take corrective action whenit is getting out of alignment.

8/9/2019 A Current State Assessment-Finalv2 384036 7
http://slidepdf.com/reader/full/a-current-state-assessment-finalv2-384036-7 174/238
Enterprise ArchitectureCurrent State Strategy Assessment Rationale (continued)
Strengths Weaknesses (continued)

8/9/2019 A Current State Assessment-Finalv2 384036 7
http://slidepdf.com/reader/full/a-current-state-assessment-finalv2-384036-7 175/238
174
Engagement: 330002080 — Final Version© 2012 Gartner, Inc. and/or its affiliates. All rights reserved.Gartner is a registered trademark of Gartner, Inc. or its affiliates.
EA function is not a stakeholder in the customer strategyprocess.
EA function is not integrated with other decision-makingdisciplines such as budgeting, project and programmanagement, innovation management and cross-agencyprocesses.
IT customers have differing understanding and expectationsof the EA process; but their focus is on meeting EAcompliance requirements.
A systematic process to identify IT trends or tracking marketinnovations that are capable of supporting DTMB
architecture is not in place.
Enterprise ArchitectureCurrent State Service Level Assessment
1 — Ad Hoc 2 — Reactive 3 — Challenged 4 — Managed 5 — Optimized

8/9/2019 A Current State Assessment-Finalv2 384036 7
http://slidepdf.com/reader/full/a-current-state-assessment-finalv2-384036-7 176/238
175
Engagement: 330002080 — Final Version© 2012 Gartner, Inc. and/or its affiliates. All rights reserved.Gartner is a registered trademark of Gartner, Inc. or its affiliates.
EA services are not clearly
defined or negotiated with the
customer. Common attributesinclude:
■ No service-level agreementsor metrics for which they areaccountable to either endcustomers or other groupswithin DTMB;
■ No means of working withcustomers on an ongoingbasis to understand actualdelivery against service-levelagreements;
■ No means of continuouslyimproving to achieve betterlevels of customersatisfaction.
EA services are provided, but
performance is not effectively
measured. Common attributesinclude:
■ No or few objectives ormetrics are defined for EAservices, or across theenterprise;
■ Have limited EA service-levelagreements and metrics forwhich they are accountable toeither end customers or othergroups within DTMB;
■ Ability to accurately calculatethose metrics is limited;
■ Little means of working withcustomers on an ongoingbasis to understand actualdelivery against service-levelagreements;
■ No means of continuouslyimproving to achieve betterlevels of customersatisfaction.
EA service-level agreements
and metrics are established,
and the organization isaccountable to end customers
and other groups within DTMB
include:
■ Ability to accurately calculatemetrics that end customersand other DTMB groupspartially believe to beaccurate;
■ EA is partially able to workwith customers on an ongoingbasis to understand actualdelivery against service-levelagreements;
■ No means of continuouslyimproving to achieve betterlevels of customersatisfaction;
■ Service levels to supportchargeback and otherfinancial allocationmechanisms exist, but are notfully mature.
EA service-level agreements
and metrics are established,
and the IT supportorganization is managing to
agreed-upon service levels.
Common attributes include:
■ EA service-level agreements,and metrics for which they areaccountable to end customersand other groups withinDTMB, are benchmarkedagainst peers;
■ Ability to accurately calculatemetrics that end customersand other DTMB groupsmostly believe to be accurate;
■ Fully able to work withcustomers on an ongoingbasis to understand actualdelivery against service-levelagreements;
■ Ability to work towardimproving actual delivery tocurrent service-levelagreements, but not towardincreasing those servicelevels in the future;
■ Service levels to support
chargeback and otherfinancial allocationmechanisms exist.
EA service-level agreements
and metrics are
collaboratively and regularlyagreed to with customers, and
organization is fully
accountable to end customers
and other groups within
DTMB. Common attributes
include:
■ Ability to accurately calculatemetrics that end customersand other DTMB groups trulybelieve to be accurate;
■ Fully able to work withcustomers on an ongoingbasis to understand actualdelivery against service-levelagreements;
■ Means of continuouslyimproving to achieve betterlevels of customer satisfactionand to increase those servicelevels in the future;
■ Best-practice chargeback andother financial allocationmechanisms are in place todeliver cost-effective andhigh-quality services.
Enterprise ArchitectureCurrent State Service Level Assessment Rationale
Strengths Weaknesses
S f f

8/9/2019 A Current State Assessment-Finalv2 384036 7
http://slidepdf.com/reader/full/a-current-state-assessment-finalv2-384036-7 177/238
176
Engagement: 330002080 — Final Version© 2012 Gartner, Inc. and/or its affiliates. All rights reserved.Gartner is a registered trademark of Gartner, Inc. or its affiliates.
Service levels are based on compliance reviews of EAsubmissions.
EA Division collects and tracks metrics for the EAcompliance review process (historic and current).
No metrics around the following area that are traditionallymeasured by EA:
‒Basic financial measures
‒ Productivity/efficiency measures
‒ Quality/effectiveness
‒ Delivery process.
No process is in place to identify and communicate EAsuccess stories.

8/9/2019 A Current State Assessment-Finalv2 384036 7
http://slidepdf.com/reader/full/a-current-state-assessment-finalv2-384036-7 178/238
177
Engagement: 330002080 — Final Version© 2012 Gartner, Inc. and/or its affiliates. All rights reserved.Gartner is a registered trademark of Gartner, Inc. or its affiliates.
Infrastructure and Operations
Current State Assessment and Maturity Analysis
Current State =
Target State =
Infrastructure and OperationsCurrent State Overview
■ DTMB manages a large-size infrastructure that spans across 800+ offices and provides connectivity

8/9/2019 A Current State Assessment-Finalv2 384036 7
http://slidepdf.com/reader/full/a-current-state-assessment-finalv2-384036-7 179/238
178
Engagement: 330002080 — Final Version© 2012 Gartner, Inc. and/or its affiliates. All rights reserved.Gartner is a registered trademark of Gartner, Inc. or its affiliates.
to approximately 69,000 end users. The DTMB core infrastructure is managed by InfrastructureServices (IS), which manages:
– Total of 798 Unix OSs on 659 physical servers
– Total of 3,061 Wintel OS count on 2,273 physical servers
• Technical Services: 2,159 Wintel OSs on 1,371 physical servers (approximately 36% virtualized)
• Office Automation: 902 physical servers (no virtualization)
– Small mainframe environment with 285 MIPS installed
– Total centralized storage of 5.4PB with approximately 3PB being online storage (~1.5PB is utilized) and 2.5PB
reserved for backup and archive process – Approximately 113,000 active ports
– Approximately 80,000 devices supported on the WAN
– One primary data center (Tier 3), one DR data center and one test/development data center
• Total usable space is ~30,000 sq. ft.
■ The majority of the DTMB infrastructure is centrally hosted and managed out of Lansing, Michigan.
Infrastructure and OperationsCurrent State Overview (continued)
■ The infrastructure environment is managed by a centralized group of approximately 616 FTEs

8/9/2019 A Current State Assessment-Finalv2 384036 7
http://slidepdf.com/reader/full/a-current-state-assessment-finalv2-384036-7 180/238
179
Engagement: 330002080 — Final Version© 2012 Gartner, Inc. and/or its affiliates. All rights reserved.Gartner is a registered trademark of Gartner, Inc. or its affiliates.
(organic and contractor) who are organized into the following technical domain teams:
– Program Management – Technical Service
– Telecommunications
– Data Center Services
– Enterprise Architecture
– Office Automation Services.
■ IS provides core infrastructure services through a standardized service catalog process that isbacked up with a chargeback mechanism to its customers.
■ IS runs and manages all the standard data center processes such as incident management, changemanagement, configuration management, problem management and event monitoring across theinfrastructure.

8/9/2019 A Current State Assessment-Finalv2 384036 7
http://slidepdf.com/reader/full/a-current-state-assessment-finalv2-384036-7 181/238
Infrastructure and OperationsCurrent State Overview — Benchmarking Results (continued)
■ The IT spend by cost category reveals that Michigan spends more than the peer group average in

8/9/2019 A Current State Assessment-Finalv2 384036 7
http://slidepdf.com/reader/full/a-current-state-assessment-finalv2-384036-7 182/238
181
Engagement: 330002080 — Final Version© 2012 Gartner, Inc. and/or its affiliates. All rights reserved.Gartner is a registered trademark of Gartner, Inc. or its affiliates.
the software category, but has lower spending in hardware, personnel, transmission and occupancy.
Infrastructure and OperationsCurrent State Overview — Benchmarking Results (continued)
■ Total staffing is lower than the peer group, with Michigan at 616 and the peer group at 626.
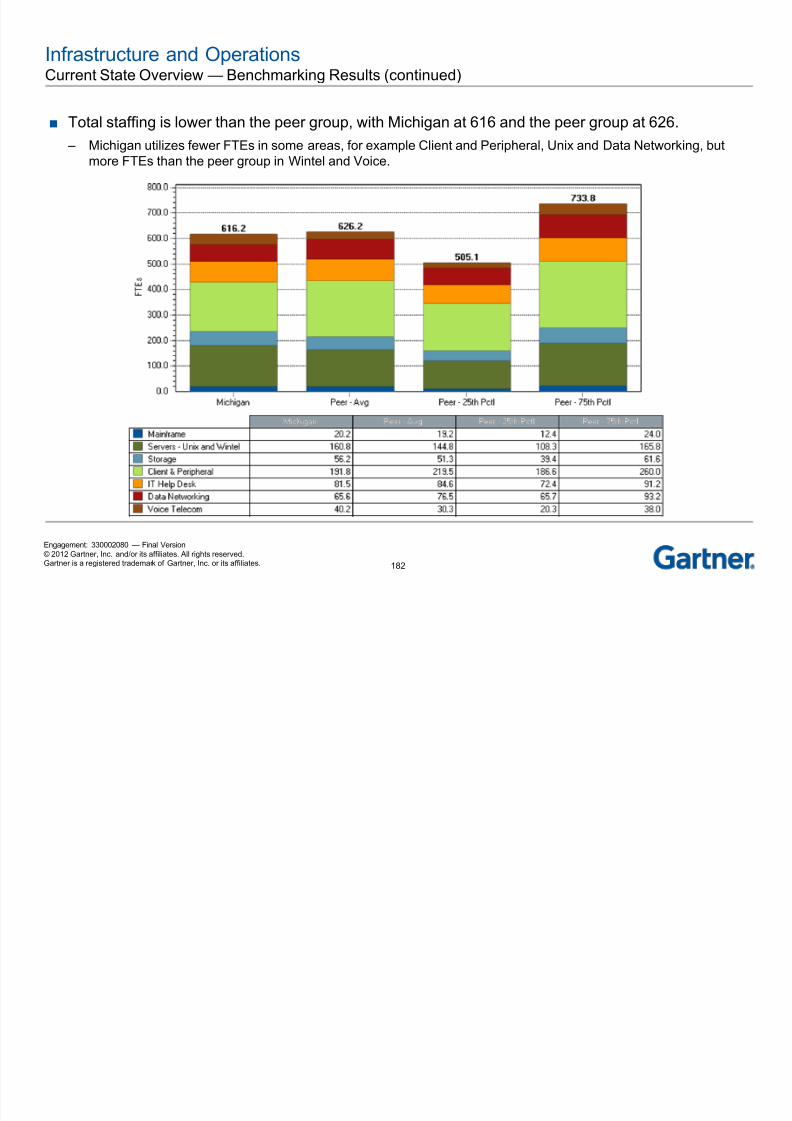
8/9/2019 A Current State Assessment-Finalv2 384036 7
http://slidepdf.com/reader/full/a-current-state-assessment-finalv2-384036-7 183/238
182
Engagement: 330002080 — Final Version© 2012 Gartner, Inc. and/or its affiliates. All rights reserved.Gartner is a registered trademark of Gartner, Inc. or its affiliates.
– Michigan utilizes fewer FTEs in some areas, for example Client and Peripheral, Unix and Data Networking, butmore FTEs than the peer group in Wintel and Voice.
Infrastructure and OperationsCurrent State Overview — Benchmarking Results (continued)
■ Michigan and the peer group utilize a similar number of external staff resources. Michigan utilizest t th th t 40 26 4 b t th t i ith

8/9/2019 A Current State Assessment-Finalv2 384036 7
http://slidepdf.com/reader/full/a-current-state-assessment-finalv2-384036-7 184/238
183
Engagement: 330002080 — Final Version© 2012 Gartner, Inc. and/or its affiliates. All rights reserved.Gartner is a registered trademark of Gartner, Inc. or its affiliates.
more contractors than the peer group, at 40 vs. 26.4, but the peer group uses more outsourcing, with28 FTEs.
Infrastructure and OperationsCurrent State Overview — Benchmarking Results (continued)
■ The cost per FTE is lower at Michigan compared to the peer group, but the per-capita spending ont t i ll hi h t Mi hi ith th ti f th H l D k d St

8/9/2019 A Current State Assessment-Finalv2 384036 7
http://slidepdf.com/reader/full/a-current-state-assessment-finalv2-384036-7 185/238
184
Engagement: 330002080 — Final Version© 2012 Gartner, Inc. and/or its affiliates. All rights reserved.Gartner is a registered trademark of Gartner, Inc. or its affiliates.
contractors is generally higher at Michigan, with the exception of the Help Desk and Storage.
Infrastructure and Operations Major Findings
Technology■ DTMB has good standardization with regard to mainstream
technology platforms across the major infrastructure domains

8/9/2019 A Current State Assessment-Finalv2 384036 7
http://slidepdf.com/reader/full/a-current-state-assessment-finalv2-384036-7 186/238
185
Engagement: 330002080 — Final Version© 2012 Gartner, Inc. and/or its affiliates. All rights reserved.Gartner is a registered trademark of Gartner, Inc. or its affiliates.
Organization
ProcessStrategy
ServiceLevel
Current
technology platforms across the major infrastructure domains.
– Bottom Line: Good tools and architecture make it easier to
manage the infrastructure environment.
■ Infrastructure Services is a consolidated and centralized IT
infrastructure organization that is working on adopting and
implementing industry-leading trends.
– Bottom Line: Consolidation and centralization lead to optimization andstandardization. The efficiencies from consolidation have resulted in abenchmark that places the State of Michigan better than the peeraverage for I&O costs.
■ Overall, I&O maturity is high, but is hampered from the alignment by
technology platform. Each technology platform has a unique service catalog.
– Bottom Line: Strong technology alignment and multiple service catalogs make it more difficult to work collaborativelyacross Infrastructure Services in a coordinated and organized manner.
■ Lack of a consistent customer-facing approach (metrics, service catalogs, processes, operations,
management, cost management) limits the ability of Infrastructure Services to be truly regarded as an
integrated business partner. Feedback indicates SLAs are not aligned with customer expectations.
– Bottom Line: Infrastructure and operations should have operating level agreements (OLAs) with other DTMBfunctions to improve customer service.
■ Overall, there is a limited automation and integration in Infrastructure management.
– Bottom Line: With limited automation and multiple delivery teams, IT process and staffing efficiencies are impacted.
Infrastructure and OperationCurrent State Technology Assessment
1 — Ad Hoc 2 — Reactive 3 — Challenged 4 — Managed 5 — Optimized

8/9/2019 A Current State Assessment-Finalv2 384036 7
http://slidepdf.com/reader/full/a-current-state-assessment-finalv2-384036-7 187/238
186
Engagement: 330002080 — Final Version© 2012 Gartner, Inc. and/or its affiliates. All rights reserved.Gartner is a registered trademark of Gartner, Inc. or its affiliates.
Data centers are not
appropriately located or
provisioned. No tools areimplemented in the following
areas:
■ Infrastructure support■ Network (WAN, LAN and
telephony)■ Data center■ Change tracking■ Service desk tools (e.g.,
incident management, tickettracking, problemmanagement)
■ Event correlation analysis■ Element management■ Patch management■ Capacity management■ Operations management■ Discovery■ Topology■ Status monitoring■ Fault management■ IT asset management
Tools are inconsistently
implemented for each agency
in some of the following areas:
■ Infrastructure support■ Network (WAN, LAN and
telephony)■ Data center■ Change tracking■ Service desk tools (e.g.,
incident management, tickettracking, problemmanagement)
■ Event correlation analysis■ Element management
■ Patch management■ Capacity management■ Operations management■ Discovery■ Topology■ Status monitoring■ Fault management■ IT asset management
Tools are inconsistently
implemented for all agencies
in all the following areas:
■ Infrastructure support■ Network (WAN, LAN and
telephony)■ Data center■ Change tracking■ Service desk tools (e.g.,
incident management, tickettracking, problemmanagement)
■ Event correlation analysis■ Element management
■ Patch management■ Capacity management■ Operations management■ Discovery■ Topology■ Status monitoring■ Fault management■ IT asset management
A standard set of tools is
consistently implemented for
all agencies in all the followingareas:
■ Infrastructure support■ Network (WAN, LAN and
telephony)■ Data center■ Change tracking■ Service desk tools (e.g.,
incident management, tickettracking, problemmanagement)
■ Event correlation analysis
■ Element management■ Patch management■ Capacity management■ Operations management■ Discovery■ Topology■ Status monitoring■ Fault management■ IT asset management
A standard set of tools is
consistently implemented for
all agencies in all the followingareas, and DTMB continually
looks to improve this toolset:
■ Infrastructure support■ Network (WAN, LAN and
telephony)■ Data center■ Change tracking■ Service desk tools (e.g.,
incident management, tickettracking, problemmanagement)
■ Event correlation analysis■ Element management■ Patch management■ Capacity management■ Operations management■ Discovery■ Topology■ Status monitoring■ Fault management■ IT asset management
Infrastructure and Operations Current State Technology Assessment Rationale
Strengths Weaknesses
Overall, Infrastructure Services has adopted or is in thef d ti i d t l di ti d t l
Currently, Infrastructure Services has a low virtualizationt th i ti 50% t 75%+ i
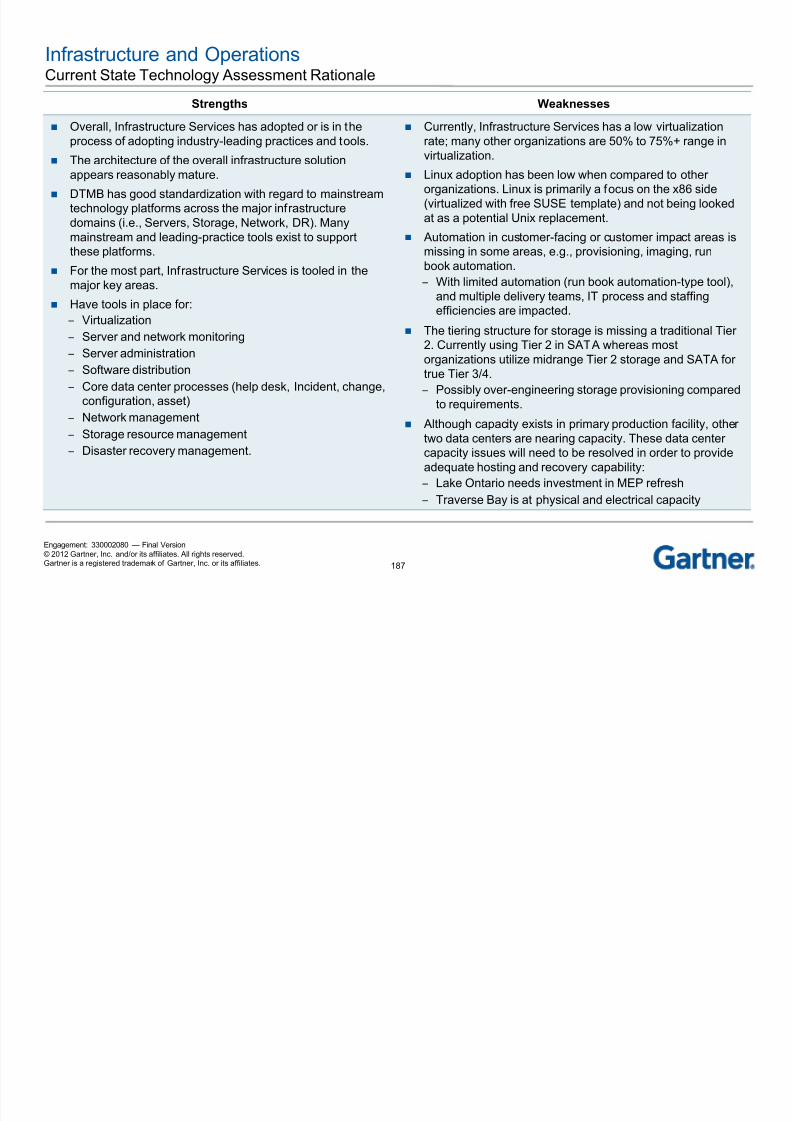
8/9/2019 A Current State Assessment-Finalv2 384036 7
http://slidepdf.com/reader/full/a-current-state-assessment-finalv2-384036-7 188/238
187
Engagement: 330002080 — Final Version© 2012 Gartner, Inc. and/or its affiliates. All rights reserved.Gartner is a registered trademark of Gartner, Inc. or its affiliates.
process of adopting industry-leading practices and tools.
The architecture of the overall infrastructure solution
appears reasonably mature.
DTMB has good standardization with regard to mainstreamtechnology platforms across the major infrastructuredomains (i.e., Servers, Storage, Network, DR). Manymainstream and leading-practice tools exist to supportthese platforms.
For the most part, Infrastructure Services is tooled in themajor key areas.
Have tools in place for:‒ Virtualization
‒ Server and network monitoring
‒ Server administration
‒ Software distribution
‒ Core data center processes (help desk, Incident, change,configuration, asset)
‒ Network management
‒ Storage resource management
‒Disaster recovery management.
rate; many other organizations are 50% to 75%+ range invirtualization.
Linux adoption has been low when compared to otherorganizations. Linux is primarily a focus on the x86 side(virtualized with free SUSE template) and not being lookedat as a potential Unix replacement.
Automation in customer-facing or customer impact areas ismissing in some areas, e.g., provisioning, imaging, runbook automation.
‒ With limited automation (run book automation-type tool),and multiple delivery teams, IT process and staffing
efficiencies are impacted.
The tiering structure for storage is missing a traditional Tier2. Currently using Tier 2 in SATA whereas mostorganizations utilize midrange Tier 2 storage and SATA fortrue Tier 3/4.
‒ Possibly over-engineering storage provisioning comparedto requirements.
Although capacity exists in primary production facility, othertwo data centers are nearing capacity. These data centercapacity issues will need to be resolved in order to provideadequate hosting and recovery capability:
‒ Lake Ontario needs investment in MEP refresh
‒ Traverse Bay is at physical and electrical capacity
Infrastructure and Operations Current State Technology Assessment Rationale (continued)
Strengths (continued) Weaknesses (continued)
Network (WAN) is primarily outsourced to ATT, and LANs DR capability is in the same geographic location (same city

8/9/2019 A Current State Assessment-Finalv2 384036 7
http://slidepdf.com/reader/full/a-current-state-assessment-finalv2-384036-7 189/238
188
Engagement: 330002080 — Final Version© 2012 Gartner, Inc. and/or its affiliates. All rights reserved.Gartner is a registered trademark of Gartner, Inc. or its affiliates.
( ) p y ,follow standard deployment pattern.
‒
Working on provisioning fiber at key SOM installations.‒ Working proactively with ATT to manage WAN
configuration, capacity and quality.
DTMB is moving along the virtualization path with a soundapproach and appropriate virtual tool stack.
DTMB is using an industry-leading Disaster RecoveryManagement tool to help manage the DR process andenable application teams to develop and manage the DRplans.
A standard refresh process with additional third-partywarranty exists.
DTMB has only a handful of select vendors in the IThardware space.
Mission-critical applications have been identified, and DRplans are in process for the majority of the application.
Overall DTMB has a good standardized core infrastructurethat utilized enterprise-class tools. This results in more-
efficient support and easier management.
p y g g p ( yenvironment).
The monitoring solution in place is adequate, but isessentially element-level monitoring for core infrastructurethat is limited to up/down status. Performance managementtool (Vantage) is available but being selectively used (by Applications group) or being used reactively to diagnoseissues. Monitoring does not provide comprehensiveanalysis tools for performance monitoring or event co-relation.
‒ Ability to manage/monitor network performance at localsites is limited.
A true NOC for managing the network does not exist.
Infrastructure and OperationsCurrent State Organization Assessment
1 — Ad Hoc 2 — Reactive 3 — Challenged 4 — Managed 5 — Optimized

8/9/2019 A Current State Assessment-Finalv2 384036 7
http://slidepdf.com/reader/full/a-current-state-assessment-finalv2-384036-7 190/238
189
Engagement: 330002080 — Final Version© 2012 Gartner, Inc. and/or its affiliates. All rights reserved.Gartner is a registered trademark of Gartner, Inc. or its affiliates.
DTMB does not have defined
roles/responsibilities or
enough adequately trainedstaff for the following
activities:
■ Customer relationshipmanagement;
■ Service management;■ Process management (e.g.,
change manager, capacitymanager, incident manager,etc.);
■ Infrastructure support;■ Platform/technical specialties;■ I&O financial management.
DTMB has inconsistently
established roles and
responsibilities for thefollowing activities:
DTMB has staff that has
received some of the
necessary training (but needs
more training) to be
adequately prepared for the
following activities:
■ Customer relationshipmanagement;
■ Service management;■ Process management (e.g.,
change manager, capacitymanager, incident manager,etc.);
■ Infrastructure support;■ Platform/technical specialties;■ I&O financial management.
DTMB has consistently
documented roles and
responsibilities for thefollowing activities:
DTMB has adequately trained
resources to manage
resources but is understaffed,
which limits its ability to
perform the following
activities:
■ Customer relationshipmanagement;
■ Service management;■ Process management (e.g.,
change manager, capacitymanager, incident manager,etc.);
■ Infrastructure support;■ Platform/technical specialties;■ I&O financial management.
DTMB has documented each
role as responsible,
accountable, consulted andinformed for the following
activities:
DTMB has a sufficient number
of adequately trained staff for
the following activities:
■ Customer relationshipmanagement;
■ Service management;■ Process management (e.g.,
change manager, capacitymanager, incident manager,etc.);
■ Infrastructure support;■ Platform/technical specialties;■ I&O financial management.
DTMB has a defined sourcing
strategy that evaluates the
optimal distribution ofinsourced and outsourced
resources; DTMB has
optimized the number of
adequately trained staff to
manage resources across the
enterprise for the following
activities:
■ Customer relationshipmanagement;
■ Service management;■ Process management (e.g.,
change manager, capacitymanager, incident manager,etc.);
■ Infrastructure support;■ Platform/technical specialties;■ I&O financial management.
Infrastructure and OperationsCurrent State Organization Assessment Rationale
Strengths Weaknesses
Infrastructure Services is a consolidated and centralized IT Overall, the Infrastructure Services organization is aligned

8/9/2019 A Current State Assessment-Finalv2 384036 7
http://slidepdf.com/reader/full/a-current-state-assessment-finalv2-384036-7 191/238
190
Engagement: 330002080 — Final Version© 2012 Gartner, Inc. and/or its affiliates. All rights reserved.Gartner is a registered trademark of Gartner, Inc. or its affiliates.
infrastructure organization.
Key areas of IT infrastructure management are staffedunder a separate management structure:
‒ Program Management
‒ Field Services
‒ Technical Service
‒ Telecommunications
‒ Data Center Services
‒ Enterprise Architecture
‒ Office Automation Services.
A Program Management Office (PMO) structure is in placefor managing ongoing and new projects. The technologydomain teams integrate with the PMO for infrastructureprojects. PMO provides broad project managementactivities as well as coordination/management of customerinteraction points with the Infrastructure Specialist role.
A business relationship function that acts as the liaisonbetween the IT operations and the customers’ units is inplace. This group manages the communication and
requirements between customers and IT operations(IO/CSD model).
Competency centers for key areas are in the process ofbeing developed or are deployed (VCOE, Citrix, DRM, etc.).
, g gby technology platform, that in some cases are overlappingand duplicative.
‒ Server management is distributed across three sub-serverteams with its own engineering and operations functions.The teams are aligned by agency.
‒ Connectivity server equipment is managed under aseparate team.
Organization appears to be very hierarchical, with manyteams responsible for different parts of the process. Thisleads to more-reactive (as opposed to more-proactive)operations when incidents/anomalies arise.
‒Server provisioning is managed by IT PMO team that has tointeract with hosting, network, operations, security, vendors,helpdesk, Agency Services and procurement in order toprovision a server. Any delay from one directly impactsserver provisioning time.
‒ No metric or enforcement function is in place that drivesdifferent teams to provision a server in a specific time frame.
Infrastructure availability and performance are siloed bytechnical tower. This results in an unclear escalation and
accountability process for overall IS services. IS utilizes a contracting strategy to have highly skilled
contractors perform core engineering and operationalfunctions, which increases overall cost of service.
Infrastructure and OperationsCurrent State Organization Assessment Rationale (continued)
Strengths (continued) Weaknesses (continued)
Process owners are in place for key infrastructure service Infrastructure Services does not have any customer-facing

8/9/2019 A Current State Assessment-Finalv2 384036 7
http://slidepdf.com/reader/full/a-current-state-assessment-finalv2-384036-7 192/238
191
Engagement: 330002080 — Final Version© 2012 Gartner, Inc. and/or its affiliates. All rights reserved.Gartner is a registered trademark of Gartner, Inc. or its affiliates.
ydelivery processes.
Training budgets are in existence to train technical staff. Career progression for staff development is in place.
Client technology, system administration and networkmanagement are three of the stronger job families from theskills inventory.
y grole that liaisons with customers to understand their needsor pain points. This role/requirement is expected to be inplace at the working level between the CSDs and theInfrastructure Specialists.
Utilizing inexperienced/undertrained resources for incidentmanagement and field services directly impactsInfrastructure Services’ credibility and ability to resolveissues.
Separate Tier 3 organization (engineering level) thatfocuses primarily on project-oriented work, rather than day-
to-day operations was not identified. Operations andengineering organizations are contained in sub-teams(server team, operations team, etc.) and are focused ontheir technical domain.
Owner of Risk Management is unclear: risk management isdone only for IT systems. DC ops is responsible formanaging the DRM process, but no enforcement or riskmanagement activities under a risk manager wereidentified. Single owner of risk management was notidentified who is accountable for the entire life cycle of IT
risk management.
A role to independently measure and manage the SLAprocess for service delivery is not in place.
Infrastructure and OperationsCurrent State Organization Assessment Rationale (continued)
Strengths Weaknesses (continued)
Service delivery manager/IT Service product manager (or

8/9/2019 A Current State Assessment-Finalv2 384036 7
http://slidepdf.com/reader/full/a-current-state-assessment-finalv2-384036-7 193/238
192
Engagement: 330002080 — Final Version© 2012 Gartner, Inc. and/or its affiliates. All rights reserved.Gartner is a registered trademark of Gartner, Inc. or its affiliates.
similar role) accountable for data center services deliverynot in place; a centralized service delivery manager rolewould help enhance end-to-end system delivery focus,prioritization.
‒ Function is supported by various tower owners (network,server-Unix, server-Windows, storage, facilities, Office Automation, Helpdesk) all with different budgets (andchargebacks) and different service catalogs.
‒ Service performance/outage :
• “If there’s an issue…I have to resolve myself…I onlyget piecemeal answers from infrastructure, I have to
assemble the network, server, storage, hosting,desktop teams to get them to figure out an issue” — interview quote
Customer Support/Helpdesk, Computer Operations andBusiness Continuance are among the weaker job families inthe skills inventory.
Infrastructure and Operations Current State Organization Assessment Rationale — Capabilities by Client Technology/Desktop SupportJob Family
■ Job Family strength for FTEs currently in this job family:
Hi hl L St th

8/9/2019 A Current State Assessment-Finalv2 384036 7
http://slidepdf.com/reader/full/a-current-state-assessment-finalv2-384036-7 194/238
193
Engagement: 330002080 — Final Version© 2012 Gartner, Inc. and/or its affiliates. All rights reserved.Gartner is a registered trademark of Gartner, Inc. or its affiliates.
■ Selected foundational skills and critical competencies:
■ Bench strength (Highly Qualified and Qualified FTEs currently in other Job Families):
Job FamilyHighly
QualifiedQualified
Less-
QualifiedTotal HC
Strength
(%HQ+Q)
Client Technology/Desktop Support 31 38 32 101 68%
Highly Qualified 67
Qualified 144
HQ+Q 211
5 Critical Competencies
2+ Levels
Below
Expected
1 Level
Below
Expected
At or
Above
Expected
Analytical Thinking 5.0% 11.9% 83.2%
Communications 3.0% 20.8% 76.2%
Contributing to Team Success 4.0% 13.9% 82.2%Customer Focused 3.0% 9.9% 87.1%
Information Seeking 7.9% 17.8% 74.3%
10 Foundational Skills (% of People with Adv/Master Proficieny) % Adv/Mst
Desktop Operating Systems 65.5%
Hardware Installation and Support 66.4%
Mobile Devise HW/SW Support 27.3%
PC/Workstation Hardware Architecture 39.1%
Performance Measurement and Tuning 17.3%
Product and Vendor Evaluation 11.8%
Project Management 15.5%
Quality Management 10.0%
Remote Computing 31.8%
Software Installation and Support 60.0%
Adv/Master>= 30% Adv/Master 20% –30% Adv/Master <20%
Below <40% At or Above 60% 40% to <60%
Infrastructure and Operations Current State Organization Assessment Rationale — Capabilities by Computer Operations Job Family
■ Job Family strength for FTEs currently in this job family:
Hi hl S h

8/9/2019 A Current State Assessment-Finalv2 384036 7
http://slidepdf.com/reader/full/a-current-state-assessment-finalv2-384036-7 195/238
194
Engagement: 330002080 — Final Version© 2012 Gartner, Inc. and/or its affiliates. All rights reserved.Gartner is a registered trademark of Gartner, Inc. or its affiliates.
■ Selected foundational skills and critical competencies:
■ Bench strength (Highly Qualified and Qualified FTEs currently in other Job Families):
Job FamilyHighly
QualifiedQualified
Less-
QualifiedTotal HC
Strength
(%HQ+Q)
Computer Operations 1 12 46 59 22%
Highly Qualified 34
Qualified 125
HQ+Q 159
10 Foundational Skills (% of People with Adv/Master Proficieny) % Adv/Mst
Contingency and Disaster Recovery 8.5%
Facilities Management 8.5%
Peripheral Equipment 5.1%
Production Control 8.5%
Production Scheduling 10.2%
Production Support and Documentation 20.3%
Security Policies and Procedures 5.1%
Standards, Procedures and Policies 16.9%
Systems Computer/Console Operations 28.8%
Workflow Automation 6.8%
5 Critical Competencies
2+ Levels
Below
Expected
1 Level
Below
Expected
At or
Above
Expected
Analytical Thinking 6.8% 30.5% 62.7%
Communications 10.2% 27.1% 62.7%
Contributing to Team Success 8.5% 22.0% 69.5%Planning and Organizing Work 13.6% 40.7% 45.8%
Quality Orientation 16.9% 30.5% 52.5%
Adv/Master>= 30% Adv/Master 20% –30% Adv/Master <20%
Below <40% At or Above 60% 40% to <60%
Infrastructure and Operations Current State Organization Assessment Rationale — Capabilities by Customer Support and Help DeskJob Family
■ Job Family strength for FTEs currently in this job family:

8/9/2019 A Current State Assessment-Finalv2 384036 7
http://slidepdf.com/reader/full/a-current-state-assessment-finalv2-384036-7 196/238
195
Engagement: 330002080 — Final Version© 2012 Gartner, Inc. and/or its affiliates. All rights reserved.Gartner is a registered trademark of Gartner, Inc. or its affiliates.
■ Selected foundational skills and critical competencies:
■ Bench strength (Highly Qualified and Qualified FTEs currently in other Job Families):
Job FamilyHighly
QualifiedQualified Less-Qualified Total HC
Strength
(%HQ+Q)
Customer Support/Help Desk 4 19 66 89 26%
Highly Qualified 42
Qualified 122
HQ+Q 132
5 Critical Competencies2+ Levels
Below
Expected
1 Level
Below
Expected
At or
Above
Expected
Adaptability 3.4% 15.7% 80.9%
Communications 12.4% 24.7% 62.9%
Customer Focused 9.0% 11.2% 79.8%Information Seeking 15.7% 21.3% 62.9%
Planning and Organizing Work 20.2% 23.6% 56.2%
10 Foundational Skills (% of People with Adv/Master Proficieny) % Adv/Mst
Client Server Computing 10.1%
Contingency and Disaster Recovery 1.1%
Data Access and User Administration 16.9%
Enterprise Products/Services 3.4%
Network Administration 9.0%
Security Policies and Procedures 5.6%
Software Support 32.6%
Standards, Procedures and Policies 10.1%
Systems Help Desk Management 13.5%
Systems Security and User Administration 10.1%
Adv/Master>= 30% Adv/Master 20% –30% Adv/Master <20%
Below <40% At or Above 60% 40% to <60%
Current Capabilities by Job Family Current State Organization Assessment Rationale — Capabilities by Network Management Job Family
■ Job Family strength for FTEs currently in this job family:

8/9/2019 A Current State Assessment-Finalv2 384036 7
http://slidepdf.com/reader/full/a-current-state-assessment-finalv2-384036-7 197/238
196
Engagement: 330002080 — Final Version© 2012 Gartner, Inc. and/or its affiliates. All rights reserved.Gartner is a registered trademark of Gartner, Inc. or its affiliates.
■ Selected foundational skills and critical competencies:
■ Bench strength (Highly Qualified and Qualified FTEs currently in other Job Families):
Job FamilyHighly
Qualified
Qualified Less-Qualified Total HCStrength
(%HQ+Q)
Network Management 6 7 19 32 41%
5 Critical Competencies
2+ Levels
Below
Expected
1 Level
Below
Expected
At or
Above
Expected
Analytical Thinking 3.1% 25.0% 71.9%
Communications 6.3% 37.5% 56.3%
Contributing to Team Success 9.4% 15.6% 75.0%
Information Seeking 6.3% 28.1% 65.6%
Quality Orientation 9.4% 34.4% 56.3%
10 Foundational Skil ls (% of People with Adv/Master Proficieny) % Adv/Mst
Network Architecture 28.1%
Network Capacity Planning 9.4%
Network Configuration and Implementation 40.6%
Network Design 34.4%
Network Diagnostics and Monitoring 34.4%
Network Installation 43.8%
Network Performance Tuning and Troubleshooting 34.4%
Network Security 25.0%
Remote Access 25.0%
Vendor Management 6.3%
Highly Qualified 13
Qualified 62
HQ+Q 75
Adv/Master>= 30% Adv/Master 20% –30% Adv/Master <20%
Below <40% At or Above 60% 40% to <60%
Infrastructure and OperationsCurrent State Process Assessment
I&O processes are non I&O processes are largely I&O processes are I&O processes are well I&O processes are mature and
1 — Ad Hoc 2 — Reactive 3 — Challenged 4 — Managed 5 — Optimized

8/9/2019 A Current State Assessment-Finalv2 384036 7
http://slidepdf.com/reader/full/a-current-state-assessment-finalv2-384036-7 198/238
197
Engagement: 330002080 — Final Version© 2012 Gartner, Inc. and/or its affiliates. All rights reserved.Gartner is a registered trademark of Gartner, Inc. or its affiliates.
I&O processes are non-
existent, or ad hoc. Common
attributes include:
■ Policies and automation donot extend across IT andbusiness processes (i.e., riskassessment, IT service self-provisioning and ITdashboards);
■ Process integration andhandoff points not in placebetween IT architecture,applications and I&O;
■ Applications and I&O are notintegrated to make pre-production testing morerigorous;
■ Tools are not integrated at thedata and functional levelacross processes;
■ Processes and standards arenot clearly defined.
I&O processes are largely
documented, but with limited
standardization, and areinconsistent from location to
location, business unit to
business unit. Common
attributes include:
■ Policies and automationinconsistently extend acrossIT and business processes(i.e., risk assessment, ITservice self-provisioning andIT dashboards);
■ Process integration andhandoff points informally inplace between IT architecture,applications and I&O;
■ Applications and I&O areinconsistently integrated tomake pre-production testingmore rigorous;
■ Some tools are integrated atthe data and functional levelacross a few of theprocesses;
■ DTMB has ad-hoc processesand standards.
I&O processes are
standardized and documented
and are consistently applied tothe organization. Common
attributes include:
■ Policies and automationconsistently extend across ITand business processes (i.e.,risk assessment, IT serviceself-provisioning and ITdashboards);
■ Process integration andhandoff points are formally inplace between IT architecture,applications and I&O;
■ Applications and I&O areconsistently integrated tomake pre-production testingmore rigorous;
■ Tools are integrated at thedata and functional levelacross the processes;
■ DTMB has formal processesand standards.
I&O processes are well
defined and managed
consistently across theenterprise. Common attributes
include:
■ Policies and automationconsistently extend across ITand business processes (i.e.,risk assessment, IT serviceself-provisioning and ITdashboards);
■ Process integration andhandoff points are formally inplace between IT architecture,applications and I&O;
■ Applications and I&O areconsistently integrated tomake pre-production testingmore rigorous;
■ Tools are integrated at thedata and functional levelacross the processes;
■ DTMB has consistentlydefined and documentedprocesses.
I&O processes are mature and
efficient. Common attribute,
include:
■ DTMB has a defined processto ensure that processes andstandards are followed;
■ Policies and automationconsistently extend across ITand business processes (i.e.,risk assessment, IT serviceself-provisioning and ITdashboards);
■ Process integration andhandoff points are formally inplace between IT architecture,applications and I&O;
■ Applications and I&O areconsistently integrated tomake pre-production testingmore rigorous;
■ Tools are integrated at thedata and functional levelacross the processes.
Infrastructure and Operations Current State Process Assessment Rationale
Strengths Weaknesses
Infrastructure Services is organized around technologyl tf b t i l b i t i ith
There is a general lack of formalized integration forf d ti l ( h i id t fi ti

8/9/2019 A Current State Assessment-Finalv2 384036 7
http://slidepdf.com/reader/full/a-current-state-assessment-finalv2-384036-7 199/238
198
Engagement: 330002080 — Final Version© 2012 Gartner, Inc. and/or its affiliates. All rights reserved.Gartner is a registered trademark of Gartner, Inc. or its affiliates.
platforms, but is also becoming process-centric, withdedicated functions being set up that are focused on keycross-platform processes.
DTMB has several foundational level processes in place,including:
‒ Incident management
‒ Change management
‒ Configuration management
‒ Asset management.
Currently have in place appropriate-level Change Advisory
Boards (federated and centralized) with an exceptionprocess built in.
Some key processes are documented or “ingrained” in theway people work. Standard Operating Procedures are inplace for Infrastructure Services.
DRM process is well defined and documented. and toolsare provided to application owners to help build andmanage the appropriate DR plans.
Have Remedy installed for primary Incident managementfunctions. Remedy currently does not have any additionalITSM modules.
foundational processes (change, incident, configuration,asset and problem). Little enterprisewide integration acrossprocess flows for all domains.
‒ While process integration may be occurring individually(manually), there was no evidence of formal workflow tointegrate foundational process with each other.
Process documentation exists for some processes, but themajority of the work is done through “tribal knowledge.”
There is a lack of a single ITSM framework tool.
Remedy is constrained to only incident management, with
no integration to change and configuration managementtools/activities.
Problem management is being done, but appears ad hocand reactive, with little linkage to incident management,change/configuration management, and no event co-relation tools, no known error log management, noknowledge management process.
Configuration/asset management is managed by separateteams, separate tools and under separate owners:
‒Servers/Storage/Facilities
‒ Network
‒ Desktops/Laptops.
Infrastructure and Operations Current State Process Assessment Rationale (continued)
Strengths (continued) Weaknesses (continued)
Custom-developed tools for change, configuration andasset management activities
Infrastructure Services-wide capacity management functionis not in place Infrastructure capacity management is done

8/9/2019 A Current State Assessment-Finalv2 384036 7
http://slidepdf.com/reader/full/a-current-state-assessment-finalv2-384036-7 200/238
199
Engagement: 330002080 — Final Version© 2012 Gartner, Inc. and/or its affiliates. All rights reserved.Gartner is a registered trademark of Gartner, Inc. or its affiliates.
asset management activities.
CMDB tool is utilized as the basis of chargebacks.
is not in place. Infrastructure capacity management is doneat the element level and is not proactive across theInfrastructure Services domain.
Change and configuration are the most evolved at DTMB,but still relatively siloed in nature.
‒ Configuration and Change processes are more matureand repeatable in DC Ops, but do not extend to otherparts of Infrastructure Services or Agency Services to thesame degree.
Progress to process maturity and adoption is not clear.
‒
General lack of top-down vision for process adoption anddeployment across IT infrastructure.
‒ A road map/strategic direction for IT service managementadoption and maturity across DTMB is not evident.
DTMB is using point solutions for IT Service Management(ITSM) with no comprehensive ITSM capability in place.Most large organizations use an enterprise-scale ITSM toolthat provides integrated features for foundational ITSMprocesses.
‒Incident management is based on a Remedy product thatis heavily customized and behind in version level.Remedy is not fully integrated to other process areas.
Infrastructure and Operations Current State Process Assessment Rationale (continued)
Strengths Weaknesses (continued)
‒ Change and Configuration management utilizehomegrown tools to manage all aspects of process

8/9/2019 A Current State Assessment-Finalv2 384036 7
http://slidepdf.com/reader/full/a-current-state-assessment-finalv2-384036-7 201/238
200
Engagement: 330002080 — Final Version© 2012 Gartner, Inc. and/or its affiliates. All rights reserved.Gartner is a registered trademark of Gartner, Inc. or its affiliates.
homegrown tools to manage all aspects of processmanagement activities in DC Ops. Network and Desktopteams manage their own tools and processes.
Apart from initial risk analysis, DRM process is notintegrated with risk management.
‒ Although Risk management results in identification of DRrequirements, the application owners have to implementthe actual DR plans. Current DR adoption is slow (muchis in progress), with little-to-no DR testing andcompliance.
‒ No single owner of the IT risk management process fromend to end.
There is a lack of formal and consistent monitoring andreporting of IT infrastructure health and performance (i.e.,monitoring of system availability, system performance,trending, uptime, etc.) across all elements.
Process metrics such as cycle time, resolution rates,improvement goals, etc., are not captured in a performancedashboard.
Infrastructure and Operations Current State Strategy Assessment
There is no defined I&O High-level I&O strategy is I&O strategy is defined and I&O strategy is clearly defined, I&O strategy spans the
1 — Ad Hoc 2 — Reactive 3 — Challenged 4 — Managed 5 — Optimized

8/9/2019 A Current State Assessment-Finalv2 384036 7
http://slidepdf.com/reader/full/a-current-state-assessment-finalv2-384036-7 202/238
201
Engagement: 330002080 — Final Version© 2012 Gartner, Inc. and/or its affiliates. All rights reserved.Gartner is a registered trademark of Gartner, Inc. or its affiliates.
There is no defined I&O
strategic plan. Common
attributes include:
■ No defined strategy forbusiness continuity;
■ Infrastructure investmentdecision are not based onbusiness needs;
■ No clearly defined servicecatalog.
High level I&O strategy is
defined but does not have
measurable objectives.
Common attributes include:
■ Informal strategy for businesscontinuity;
■ A few Infrastructureinvestment decisions arebased on business needs;
■ Informally defined servicecatalog or service catalogsthat are not integrated.
I&O strategy is defined and
communicated; however, it is
not effectively translated into
consistent action. Common
attributes include:
■ Formal I&O strategic plan thatis inconsistently appliedacross the enterprise;
■ Formal strategy for businesscontinuity;
■ Majority of infrastructureinvestment decisions arebased on business needs;
■ Formally defined servicecatalog that is marketed to all
agencies.
I&O strategy is clearly defined,
communicated and socialized
throughout the enterprise.
Common attributes include:
■ Formal strategy for businesscontinuity;
■ All infrastructure investmentdecisions are based onbusiness needs;
■ Formally defined servicecatalog that is marketed to allagencies and local/federalgovernments.
I&O strategy spans the
business and is integrated
into enterprise strategic
planning, is continually
reviewed, and the strategy is
updated to align with business
objectives. Common attributes
include:
■ Formal I&O strategic plan thatis consistently applied acrossthe enterprise;
■ Defined process forevaluating and updatingstrategic plan;
■ Formal strategy for business
continuity;■ All infrastructure investment
decisions are based onbusiness needs;
■ DTMB evaluates and exploitsemerging technologies forbusiness innovation;
■ Formally defined servicecatalog that is marketed to allagencies, local/federalgovernments and privatecompanies.

8/9/2019 A Current State Assessment-Finalv2 384036 7
http://slidepdf.com/reader/full/a-current-state-assessment-finalv2-384036-7 203/238
Infrastructure and Operations Current State Strategy Assessment Rationale (continued)
Strengths Weaknesses (continued)
Cloud computing services is a step in the right direction,but:
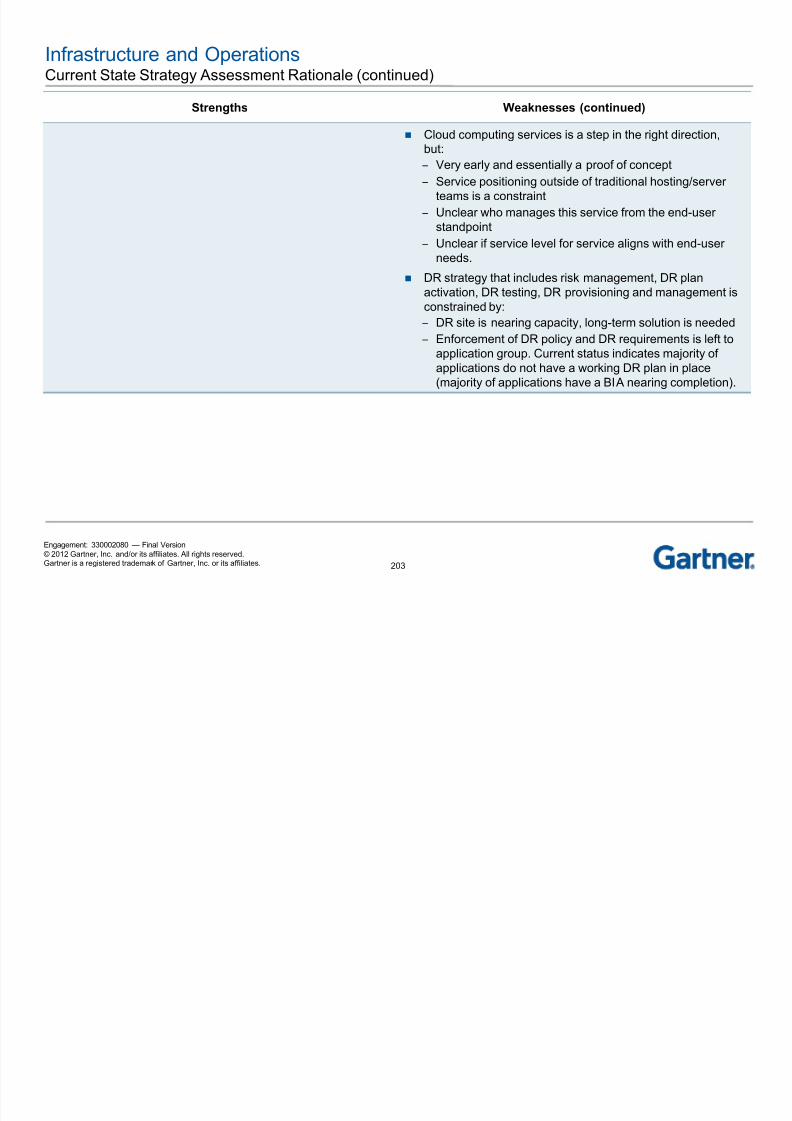
8/9/2019 A Current State Assessment-Finalv2 384036 7
http://slidepdf.com/reader/full/a-current-state-assessment-finalv2-384036-7 204/238
203
Engagement: 330002080 — Final Version© 2012 Gartner, Inc. and/or its affiliates. All rights reserved.Gartner is a registered trademark of Gartner, Inc. or its affiliates.
but:
‒ Very early and essentially a proof of concept
‒ Service positioning outside of traditional hosting/serverteams is a constraint
‒ Unclear who manages this service from the end-userstandpoint
‒ Unclear if service level for service aligns with end-userneeds.
DR strategy that includes risk management, DR planactivation, DR testing, DR provisioning and management is
constrained by:‒ DR site is nearing capacity, long-term solution is needed
‒ Enforcement of DR policy and DR requirements is left toapplication group. Current status indicates majority ofapplications do not have a working DR plan in place(majority of applications have a BIA nearing completion).
I&O service levels not clearly Basic I&O service levels exist, I&O service-level agreements I&O service-level agreements I&O service-level agreements
Infrastructure and OperationsCurrent State Service Level Assessment
1 — Ad Hoc 2 — Reactive 3 — Challenged 4 — Managed 5 — Optimized

8/9/2019 A Current State Assessment-Finalv2 384036 7
http://slidepdf.com/reader/full/a-current-state-assessment-finalv2-384036-7 205/238
204
Engagement: 330002080 — Final Version© 2012 Gartner, Inc. and/or its affiliates. All rights reserved.Gartner is a registered trademark of Gartner, Inc. or its affiliates.
y
defined or negotiated with the
customer. Common attributes
include:
■ Infrastructure and data centermetrics are not defined;
■ Project metrics are notdefined at the beginning ofthe project;
■ Metrics to measure I&Oservice are not captured oravailable;
■ Disaster recovery objectives[Mean Time To Recovery(MTTR), Recovery Time
Objectives (RTOs) andRecovery Point Objectives(RPOs)] are not defined forcritical business systems.
,
but performance is not
effectively measured.
Common attributes include:
■ Infrastructure and data centermetrics are generally knownbut informally defined;
■ Project metrics are informallydefined at the beginning ofthe project;
■ Metrics to measure I&Oservice are available but notmeaningful for day-to-dayoperational management andfor service management as
per service catalog;■ Disaster recovery objectives
[Mean Time To Recovery(MTTR), Recovery TimeObjectives (RTOs) andRecovery Point Objectives(RPOs)] are informallydefined.
g
and metrics are established,
and the organization is
accountable to end customers
and other groups within
DTMB. Common attributes
include:
■ Infrastructure and data centermetrics are formally definedbut inconsistently tracked;
■ Project metrics are formallydefined at the beginning ofthe project but inconsistentlytracked;
■ Metrics to measure I&O
service are published, and arebeing used to manageoperations and servicecatalog;
■ Disaster recovery objectives[Mean Time To Recovery(MTTR), Recovery TimeObjectives (RTOs) andRecovery Point Objectives(RPOs)] are formally definedfor critical business systems.
g
and metrics are established,
and the organization is
accountable to end customers
and other groups within
DTMB. Common attributes
include:
■ Infrastructure and data centermetrics are formally definedand consistently tracked;
■ Project metrics are formallydefined at the beginning ofthe project and consistentlytracked;
■ Metrics to measure I&O
service are published, utilzedfor operational management,service delivery and beingused to improve services;
■ Disaster recovery objectives[Mean Time To Recovery(MTTR), Recovery TimeObjectives (RTOs) andRecovery Point Objectives(RPOs)] are formally defined.
g
and metrics are
collaboratively and regularly
agreed to with customers, and
the organization is fully
accountable to end customers
and other groups within
DTMB. Common attributes
include:
■ Infrastructure and data centermetrics are formally definedand consistently tracked;
■ Project metrics are formallydefined at the beginning ofthe project and consistently
tracked;■ Metrics to measure I&O
service are published, utilzedfor operational management,service delivery and beingused to improve services;
■ Disaster recovery objectives[Mean Time To Recovery(MTTR), Recovery TimeObjectives (RTOs) andRecovery Point Objectives(RPOs)] are formally defined.
Infrastructure and Operations Current State Service Level Assessment Rationale
Strengths Weaknesses
Formal performance standards with agencies do exist.
DTMB has tools in place to capture detail data that can be
With regard to customer service:
‒ Agencies have commonly complained about incidents

8/9/2019 A Current State Assessment-Finalv2 384036 7
http://slidepdf.com/reader/full/a-current-state-assessment-finalv2-384036-7 206/238
205
Engagement: 330002080 — Final Version© 2012 Gartner, Inc. and/or its affiliates. All rights reserved.Gartner is a registered trademark of Gartner, Inc. or its affiliates.
DTMB has tools in place to capture detail data that can be
utilized for metrics. Internal metrics for operational measurement at a high
level are in place.
Road map to manage the DRM expansion status existsand is being managed.
Cross-infrastructure metrics for end-to-end service arepartially in place for application availability. Operationalmetrics for application availability are tracked and reportedto the customer base. The application availability metrics
are a combination of all the application layer components.
‒ Agencies have commonly complained about incidentsbeing closed before remedied, insufficiently trained fieldagents, a lack of comprehensive metrics, andresponsibility handoffs.
Several service catalogs exists (e.g., one for Network, onefor Desktops, one for DC Ops, one for Cloud). The lack ofcoordinated service catalogs limits DTMB’s ability to presenta single view of IT performance to customers:
‒ No single service owner
‒ Service catalog pricing and service guarantees
‒
Service improvement‒ Service design, service operations and service
measurement are all done by the same teams.
Not measuring cycle time or improvement to customer-meaningful metrics.
Performance management dashboards are not in place.
Performance metrics (end-user view) for system/applicationperformance for critical applications is not in place.
Cross-infrastructure metrics for end service are partially inplace (application availability) — partly due to differentservice catalogs that are not integrated.
Essentially, the number of FTEs devoted to particularfunctions (technology towers) is known.
Infrastructure and Operations Current State Service Level Assessment Rationale (continued)
Strengths Weaknesses (continued)
Staff productivity and trending with improvement targets arenot in place.

8/9/2019 A Current State Assessment-Finalv2 384036 7
http://slidepdf.com/reader/full/a-current-state-assessment-finalv2-384036-7 207/238
206
Engagement: 330002080 — Final Version© 2012 Gartner, Inc. and/or its affiliates. All rights reserved.Gartner is a registered trademark of Gartner, Inc. or its affiliates.
not in place.
Resource utilization metrics are not comprehensivelytracked.
‒ Metrics that measure the progress, productivity and loadon the FTEs.
Metrics for performance management measures andperformance improvement measures with trending andcorrelation were not identified.
‒ Lack of internal management metrics and lack ofimprovement targets for services makes it difficult to
measure true status of IT operations, and limits ability toprovide customers with true (not perceived) IT operationsperformance.

8/9/2019 A Current State Assessment-Finalv2 384036 7
http://slidepdf.com/reader/full/a-current-state-assessment-finalv2-384036-7 208/238
207
Engagement: 330002080 — Final Version© 2012 Gartner, Inc. and/or its affiliates. All rights reserved.Gartner is a registered trademark of Gartner, Inc. or its affiliates.
IT Sourcing and Vendor Management
Current State Assessment and Maturity Analysis
Current State =
Target State =

8/9/2019 A Current State Assessment-Finalv2 384036 7
http://slidepdf.com/reader/full/a-current-state-assessment-finalv2-384036-7 209/238
IT Sourcing and Vendor Management Current State Overview
■ The procurement functions have limited staff with limited experience and training.
■ The individuals within the sourcing function are generally well regarded by peers, while the sourcing

8/9/2019 A Current State Assessment-Finalv2 384036 7
http://slidepdf.com/reader/full/a-current-state-assessment-finalv2-384036-7 210/238
209
Engagement: 330002080 — Final Version© 2012 Gartner, Inc. and/or its affiliates. All rights reserved.Gartner is a registered trademark of Gartner, Inc. or its affiliates.
function itself is not.
■ The State segments purchasing and sourcing functions under separate management, and describesfunctions in a way that is inconsistent and in conflict with best practices.
■ The State lacks organizational functions related to contract administration, vendor management,strategic sourcing and bid best-practice development found in peer states.
■ The sourcing function lacks meaningful integration in the strategic/project planning process andpreparation for agency-specific sourcing efforts.
■ There is a lack of clear sourcing strategy and guidelines for delegated authority.
■ Under current responsibilities and structure, the State is highly reliant on a single-sourcedcommodity contract vehicle.
■ The procurement process requires repeat entry in up to four separate systems prior to fulfillment.
■ The workflow within systems, and the manual processes that connect them, lead to delays that areperceived to be related to the procurement process as opposed to other DTMB review processes.
■ The State lacks contract management tools that allow for tracking of key contract terms,
performance measures, key deliverable and renewal dates, etc.■ The State lacks meaningful capacity to generate spend analysis of its volume, and is highly
dependent on vendors to provide this information.
IT Sourcing and Vendor ManagementMajor Findings
■ Many baseline organizational functions found in peers are
missing; procurement organizational structure seems
unique to Michigan.
Technology

8/9/2019 A Current State Assessment-Finalv2 384036 7
http://slidepdf.com/reader/full/a-current-state-assessment-finalv2-384036-7 211/238
210
Engagement: 330002080 — Final Version© 2012 Gartner, Inc. and/or its affiliates. All rights reserved.Gartner is a registered trademark of Gartner, Inc. or its affiliates.
unique to Michigan.
– Bottom Line: The dispersion of procurement functions acrossorganizational components adds complexity, which results inbottlenecks that lengthen the procurement process.
■ The sourcing strategy is not integrated with the strategic
technology planning, which results in delays and divergent
priorities on what to bid and when.
– Bottom Line: Lack of integration with strategic planning resultsin procurement being viewed as an inhibitor, and diminishes
the DTMB’s ability to enable strategic sourcing.
■ The existing technology structure requires multiple entry.
– Bottom Line: Lack of automation causes user frustration anddoes not provide baseline spend analysis capacity consideredto be the core strategic decision-making tool in peer states.
■ Current staffing levels cannot provide adequate
procurement support to customer agencies.
– Bottom Line: The State needs to increase delegated authority,or increase staff, or both, for procurement to meetperformance expectations.
Organization
ProcessStrategy
ServiceLevel
Current
Technology
Organization
ProcessStrategy
ServiceLevel
Current
V en d or M an a g e
m en t
S o ur ci n g
IT Sourcing and Vendor Management Current State Technology Assessment
Sourcing
1 — Ad Hoc 2 — Reactive 3 — Challenged 4 — Managed 5 — Optimized

8/9/2019 A Current State Assessment-Finalv2 384036 7
http://slidepdf.com/reader/full/a-current-state-assessment-finalv2-384036-7 212/238
211
Engagement: 330002080 — Final Version© 2012 Gartner, Inc. and/or its affiliates. All rights reserved.Gartner is a registered trademark of Gartner, Inc. or its affiliates.
Vendor Management
DTMB has deployed no
systems or tools to supportthe process of procurement.
DTMB has deployed systems
and/or manual processes tosupport the procurement
process, but systems are
fragmented, requiring multiple
entries and intervention by the
client. Systems are not
integrated and are likely built
utilizing standard office
applications. Access to spend
data is limited and no spend
analytics tools are employed.
DTMB has deployed
automated systems or tools tosupport the procurement
process. Some processes may
still require manual
intervention and systems may
or may not be fully integrated,
which may require work re-
entry for DTMB that is
otherwise not visible to the
client. Spend analytics tools
are not employed, but spend
data are readily available and
can be analyzed with standard
office applications.
DTMB has deployed systems
or tools to support theprocurement process.
Procurement requests flow in
a single unified process
across one or more systems
without re-entry. Access to
spend data is readily available
and spend analytic tools are
available and employed.
DTMB has implemented a
statewide e-procurementsystem where all procurement
requested are processed
online in a fully automated
way. Access to spend data is
readily available and spend
analytic tools are available
and employed.
DTMB has deployed no
systems or tools to track
contract requirements and
manage vendor performance.
DTMB has deployed limited
systems supported by manual
processes to track contract
requirements and manage
vendor performance.
DTMB has deployed
automated tools to track
contract requirements and
manage vendor performance,
but systems rely solely on
vendor reporting for data.
Reporting is limited.
DTMB has deployed
automated tools to track
contract requirements and
manage vendor performance.
System utilizes vendor
reporting, customer reporting
and contract purchasing datato track and report.
DTMB has deployed an e-
procurement system that is
used to track contract
requirements and manage
vendor performance.
Customers and vendors are
provided a portal to report,and data from these sources
and for procurements made
against contracts in the
system are aggregated for
tracking and reporting.
1 — Ad Hoc 2 — Reactive 3 — Challenged 4 — Managed 5 — Optimized
IT Sourcing and Vendor Management Current State Technology Assessment Rationale
Strengths Weaknesses
DTMB has deployed systems to support and manageprocurement processes.
Maintain four (4) independent systems utilized in theprocurement process that have little to no integration.

8/9/2019 A Current State Assessment-Finalv2 384036 7
http://slidepdf.com/reader/full/a-current-state-assessment-finalv2-384036-7 213/238
212
Engagement: 330002080 — Final Version© 2012 Gartner, Inc. and/or its affiliates. All rights reserved.Gartner is a registered trademark of Gartner, Inc. or its affiliates.
DTMB has deployed the Bid4Michigan system, establishinga foundation for an e-procurement platform.
Online system is provided to purchasers for major ITcommodity contract.
‒ Lack of integration points between procurement systems
requires multiple, redundant, manual entries to completeprocurement process redundant work by staff.
Manual review and approval processes are often requiredto complete the procurement process.
‒ Limited ability to manage and track procurements fromproject identification to contract.
Contract management tools that allow for tracking of keycontract terms, performance measures, key deliverable and
renewal dates are non-existent. Systems do not provide ready access to detailed
purchasing data.
‒ No system access to purchase detail data and limitedaccess to procurement-related spend data (which dataexist is provided by vendors where contracts require it).
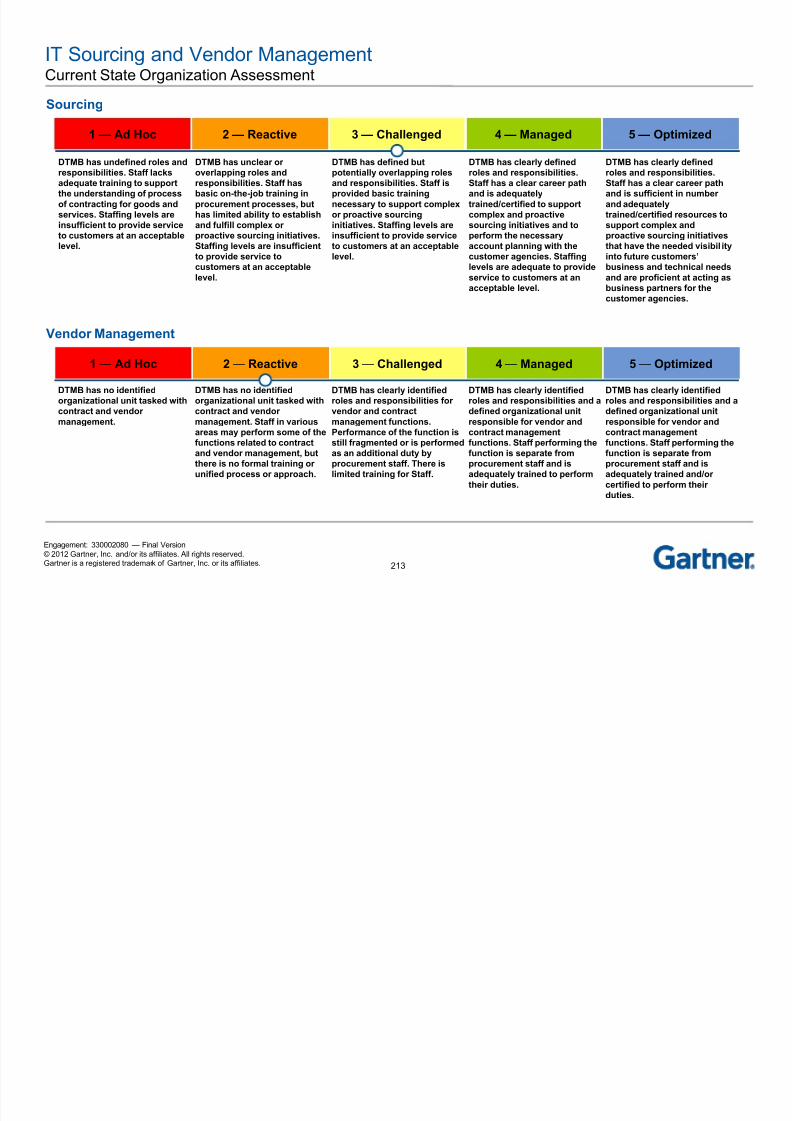
8/9/2019 A Current State Assessment-Finalv2 384036 7
http://slidepdf.com/reader/full/a-current-state-assessment-finalv2-384036-7 214/238
IT Sourcing and Vendor Management Current State Organization Assessment Rationale
Strengths Weaknesses
DTMB separates daily purchasing functions from more-complex procurement functions.
Staff performing procurement functions report to differentmanagement divisions.

8/9/2019 A Current State Assessment-Finalv2 384036 7
http://slidepdf.com/reader/full/a-current-state-assessment-finalv2-384036-7 215/238
214
Engagement: 330002080 — Final Version© 2012 Gartner, Inc. and/or its affiliates. All rights reserved.Gartner is a registered trademark of Gartner, Inc. or its affiliates.
IT Procurement staff are organized to developspecialization by product category.
Individual contributors to the process are well regarded.
Staff have minimal time on job and lack adequate training toperform complex sourcing activities.
Staffing levels are lacking to provide adequate procurementsupport to customer agencies.
‒ Limited IT procurement resources often createbottlenecks in process.
‒ Resource constraints limit ability to execute on manyopportunities.
There is no organizational unit tasked with strategic
sourcing, contract or vendor management.
IT Sourcing and Vendor Management Current State Process Assessment
DTMB d t h l DTMB h d t d d DTMB h t d d DTMB h t d d DTMB h t d d
Sourcing
1 — Ad Hoc 2 — Reactive 3 — Challenged 4 — Managed 5 — Optimized

8/9/2019 A Current State Assessment-Finalv2 384036 7
http://slidepdf.com/reader/full/a-current-state-assessment-finalv2-384036-7 216/238
215
Engagement: 330002080 — Final Version© 2012 Gartner, Inc. and/or its affiliates. All rights reserved.Gartner is a registered trademark of Gartner, Inc. or its affiliates.
DTMB does not have
documented processes for
contract and vendor
management.
DTMB has undocumented ad
hoc processes, or limited
documented processes
directing the process of
contract and vendor
management. Contract and
Vendor management consistsof addressing concerns or
issues brought by customers
as they arise.
DTMB has a standard,
documented process to direct
contract and vendor
management, but
management is often reactive
to vendor and/or customer
reporting.
DTMB has a standard,
documented process to direct
contract and vendor
management. Staff proactively
review vendor and/or
customer reporting to seek
and address issues beforethey arise, when possible.
DTMB has a standard,
documented process to direct
contract and vendor
management. Staff develop
tools for use by customers to
improve the process for future
contracts.
DTMB does not have clear
statute and/or documentedprocesses directing the
process of acquisition and
sourcing.
DTMB has undocumented ad
hoc processes, or limiteddocumented processes
directing the process of
acquisition and sourcing.
DTMB has standard,
documented processesdirecting the process of
acquisition and sourcing, but
processes to align
procurement efforts with IT
standards and shared service
review processes are limited
to non-existent.
DTMB has a standard,
documented process directingthe process of acquisition and
sourcing, and that evaluates
the alignment of business
needs to IT initiatives for each
customer agency. DTMB’s
tools and organization are
appropriately aligned to
efficiently track the needs of
the business during the
defined processes.
DTMB has a standard,
documented process toevaluate the alignment of
business needs to IT
initiatives for each customer
agency; DTMB’s tools and
organization are appropriately
aligned to efficiently track the
needs of the business during
the defined processes.; DTMB
has defined service level
objectives for interactions
with each customer agency.
Vendor Management
1 — Ad Hoc 2 — Reactive 3 — Challenged 4 — Managed 5 — Optimized
IT Sourcing and Vendor Management Current State Process Assessment Rationale
Strengths Weaknesses
Processes for basic purchasing functions and purchasecategories are documented.
Processes for complex procurements are not documentedor repeatable.

8/9/2019 A Current State Assessment-Finalv2 384036 7
http://slidepdf.com/reader/full/a-current-state-assessment-finalv2-384036-7 217/238
216
Engagement: 330002080 — Final Version© 2012 Gartner, Inc. and/or its affiliates. All rights reserved.Gartner is a registered trademark of Gartner, Inc. or its affiliates.
Toolkit being developed to perform annual assessments ofcontracts and vendors.
Each contract has an identified Contract Compliance Officerresponsible for managing the contract, but only as an addedduty.
Procurement is not actively involved in the current processfor agencies to communicate future procurement needs.
‒ Agencies often view procurement as a step in theprocess, rather than a “go-to” group that can help tofacilitate a solution to a complex problem.
Procurements require interaction from multiple divisions atDTMB.
There is minimal delegation authority for procurementactivities.
Vendor management is primarily a response to complaintsor concerns.

8/9/2019 A Current State Assessment-Finalv2 384036 7
http://slidepdf.com/reader/full/a-current-state-assessment-finalv2-384036-7 218/238
IT Sourcing and Vendor Management Current State Strategy Assessment Rationale
Strengths Weaknesses
Several statewide strategic commodity and shared servicescontracts have been established for agency use.
Lack organization, governance and staffing to enablestrategic sourcing and category management activities.
F i h dli d il fl f k d t

8/9/2019 A Current State Assessment-Finalv2 384036 7
http://slidepdf.com/reader/full/a-current-state-assessment-finalv2-384036-7 219/238
218
Engagement: 330002080 — Final Version© 2012 Gartner, Inc. and/or its affiliates. All rights reserved.Gartner is a registered trademark of Gartner, Inc. or its affiliates.
MiDeal program is actively fostering use of State contractsby local government.
Call for Projects process provides a foundation for theopportunity to drive strategic sourcing and shared services.
‒ Focus is on handling daily flow of work and not on
identifying strategic opportunities.
Shared services are often seen as new budget costs andare rebuffed by agency.
‒ Staff often do not culturally associate with DTMB as ashared-services organization.
IT Sourcing and Vendor Management Current State Service Level Assessment
DTMB has not established any DTMB has informal service DTMB has defined and DTMB has clearly defined and Integrated reporting of
Sourcing
1 — Ad Hoc 2 — Reactive 3 — Challenged 4 — Managed 5 — Optimized

8/9/2019 A Current State Assessment-Finalv2 384036 7
http://slidepdf.com/reader/full/a-current-state-assessment-finalv2-384036-7 220/238
219
Engagement: 330002080 — Final Version© 2012 Gartner, Inc. and/or its affiliates. All rights reserved.Gartner is a registered trademark of Gartner, Inc. or its affiliates.
DTMB has not established any
service level objectives forsourcing and acquisition that
are tied to the statewide
objectives/needs of the
customer agencies.
DTMB has informal service
level objectives for sourcingand acquisition that are tied to
objectives/needs of the
customer agencies;
No objectives or metrics are
defined across the enterprise.
DTMB has defined and
documented service levelobjectives for sourcing and
acquisition that are tied to
objectives/needs of the
customer agencies, but
performance is not measured;
No objectives or metrics are
defined across the enterprise.
DTMB has clearly defined and
documented service levelobjectives for sourcing and
acquisition that are tied to
objectives/needs of the
customer agencies; DTMB has
formal processes in place for
measuring DTMB’s
performance against the
objectives; DTMB is managing
to agreed-upon service levels.
Integrated reporting of
performance and ongoingimprovement within each
customer-agency and
enterprisewide.
DTMB has not established any
service level objectives for
contract and vendor
management that are tied to
the objectives/needs of the
customer agencies.
DTMB has informal service
level objectives for contract
and vendor management that
are tied to objectives/needs of
the customer agencies;
No objectives or metrics are
defined across the enterprise.
DTMB has defined and
documented service level
objectives for contract and
vendor management that are
tied to objectives/needs of the
customer agencies, but
performance is not measured;No objectives or metrics are
defined across the enterprise.
DTMB has clearly defined and
documented service level
objectives for contract and
vendor management that are
tied to objectives/needs of the
customer agencies; DTMB has
formal processes in place formeasuring DTMB’s
performance against the
objectives; DTMB is managing
to agreed-upon service levels.
Integrated reporting of
performance and ongoing
improvement within each
customer-agency and
enterprisewide.
Vendor Management
1 — Ad Hoc 2 — Reactive 3 — Challenged 4 — Managed 5 — Optimized

8/9/2019 A Current State Assessment-Finalv2 384036 7
http://slidepdf.com/reader/full/a-current-state-assessment-finalv2-384036-7 221/238

8/9/2019 A Current State Assessment-Finalv2 384036 7
http://slidepdf.com/reader/full/a-current-state-assessment-finalv2-384036-7 222/238
221
Engagement: 330002080 — Final Version© 2012 Gartner, Inc. and/or its affiliates. All rights reserved.Gartner is a registered trademark of Gartner, Inc. or its affiliates.
Security and Risk Management
Current State Assessment and Maturity Analysis
Current State =
Target State =
Security and Risk Management Current State Overview
■ Michigan recently reorganized to create a Cyber-Security and Infrastructure Protection Organization (CIP) that istasked with managing all aspects of security for Michigan.
■ The CIP is headed by the Cyber-Security Officer (CSO) who manages all aspects of cyber-security and infrastructure

8/9/2019 A Current State Assessment-Finalv2 384036 7
http://slidepdf.com/reader/full/a-current-state-assessment-finalv2-384036-7 223/238
222
Engagement: 330002080 — Final Version© 2012 Gartner, Inc. and/or its affiliates. All rights reserved.Gartner is a registered trademark of Gartner, Inc. or its affiliates.
y y y ( ) g p y y
protection, including: – Physical security of DTMB assets and property
– Information security and protection of DTMB assets and data
– External community outreach programs to ensure Michigan’s desire to be a leader in cyber -awareness, trainingand citizen safety.
■ The CSO works with federal and State agencies on piloting cutting-edge technologies (DHS Einstein and Alberttechnologies).
■ 2011 Cyber-Summit for National Cyber-Awareness month with DHS and NCSA.
■ DTMB has a very comprehensive website for cyber-security that provides an overview of the outreach activities aswell as end-user awareness training activities.
■ DTMB currently has all the right tools and technology supporting amature architecture.
■ DTMB has a good-sized, dedicated staff (32 personnel), but struggles,like most organizations, with finding and retaining top cyber-securitystaff. Staff is more operationally focused, less risk-focused.
■ DTMB currently performs processes that are typical security process,policy, awareness, vulnerability, threat, incident management.
■ DTMB does not have a strong focus on privacy management.
Security and Risk ManagementMajor Findings
■ DTMB is using the right tools, supports a mature architecture, and is
involved in all the traditional security processes.
– Bottom Line: This is a good foundation to improve security
Technology

8/9/2019 A Current State Assessment-Finalv2 384036 7
http://slidepdf.com/reader/full/a-current-state-assessment-finalv2-384036-7 224/238
223
Engagement: 330002080 — Final Version© 2012 Gartner, Inc. and/or its affiliates. All rights reserved.Gartner is a registered trademark of Gartner, Inc. or its affiliates.
g p y
management processes.■ DTMB is not leveraging all capabilities of tools, nor protecting the
entire infrastructure consistently.
– Bottom Line: Advanced threats through desktop applications can causesecurity breaches.
■ Good collaboration with commercial industry and federal/State
agencies.
– Bottom Line: External outreach policy and strategy make it possible forDTMB to leverage these relationships for tools, training and to be aleader in cyber-security.
■ DTMB struggles with finding and retaining top cyber-security staff.
– Bottom Line: Security operations can be severely impacted bypersonnel attrition.
■ DTMB lacks a strong focus on privacy management and data security
management.
– Bottom Line: Privacy management is an increasingly important area inthe industry. Lack of privacy management increases overall risk to theState.
Organization
ProcessStrategy
ServiceLevel
Current
Security and Risk Management Current State Technology Assessment
No or limited IT systems or
tools in place to support
sec rit incl ding tools s ch
IT systems and tools are
presently in place to support
sec rit incl ding tools s ch
IT systems and tools are in
place to support security,
incl ding tools s ch as those
IT tools and systems are in
place to support security
across the enterprise and are
IT systems and tools are in
place to proactively integrate
sec rit and s pport the
1 — Ad Hoc 2 — Reactive 3 — Challenged 4 — Managed 5 — Optimized

8/9/2019 A Current State Assessment-Finalv2 384036 7
http://slidepdf.com/reader/full/a-current-state-assessment-finalv2-384036-7 225/238
224
Engagement: 330002080 — Final Version© 2012 Gartner, Inc. and/or its affiliates. All rights reserved.Gartner is a registered trademark of Gartner, Inc. or its affiliates.
security, including tools such
as:
■ Endpoint Security and MobilityTools
■ Network and Data CenterSecurity Tools
■ Application and SoftwareSecurity
■ Data Security Tools■ Identity and Access
Management Tools■ Cloud Security Tools■ Monitoring Tools
■ Vulnerability ManagementTools
security, including tools such
as those listed below.However, no or limited
coordination or
standardization across the
enterprise.
■ Endpoint Security and MobilityTools
■ Network and Data CenterSecurity Tools
■ Application and SoftwareSecurity
■ Data Security Tools
■ Identity and AccessManagement Tools
■ Cloud Security Tools■ Monitoring Tools■ Vulnerability Management
Tools
including tools such as those
listed below. Inconsistentusage of tools (e.g., planning
only, large projects, etc.).
■ Endpoint Security and MobilityTools
■ Network and Data CenterSecurity Tools
■ Application and SoftwareSecurity
■ Data Security Tools■ Identity and Access
Management Tools
■ Cloud Security Tools■ Monitoring Tools■ Vulnerability Management
Tools
across the enterprise and are
consistently used, includingtools such as those listed
below.
■ Endpoint Security and MobilityTools
■ Network and Data CenterSecurity Tools
■ Application and SoftwareSecurity
■ Data Security Tools■ Identity and Access
Management Tools■ Cloud Security Tools■ Monitoring Tools■ Vulnerability Management
Tools
security and support the
enterprise’s ability to improveand optimize operational
performance using tools such
as:
■ Endpoint Security and MobilityTools
■ Network and Data CenterSecurity Tools
■ Application and SoftwareSecurity
■ Data Security Tools■ Identity and Access
Management Tools■ Cloud Security Tools■ Monitoring Tools■ Vulnerability Management
Tools
Security and Risk Management Current State Technology Assessment Rationale
Strengths Weaknesses
Have good technology: Symantec suite and SIEM,Netwitness, Albert from DHS. Two-factor authentication forremote access using RSA, Tivoli SSO, Websense filters,
Not utilizing all the tools to their capability. Mostly reviewinglogs and not leveraging comprehensive alerting for real-time notifications.

8/9/2019 A Current State Assessment-Finalv2 384036 7
http://slidepdf.com/reader/full/a-current-state-assessment-finalv2-384036-7 226/238
225
Engagement: 330002080 — Final Version© 2012 Gartner, Inc. and/or its affiliates. All rights reserved.Gartner is a registered trademark of Gartner, Inc. or its affiliates.
remote access using RSA, Tivoli SSO, Websense filters,
Qualys scanners. All these tools are mainstream tools in themarket.
The strong tools are backed up by a strong securityarchitecture with protection zones, as per industry norm.
time notifications.
Too much reliance on tool output to initiate responseprocess; active monitoring is not ongoing, especially after-hours.
Vulnerability coverage focused mostly on PCI andcompliance systems at the server layer. Desktops andnetwork devices are not being secured or monitored, aswell as servers.
‒ Potentially missing many intrusions coming fromcompromised desktops.
‒Data may be protected at rest, on servers, but not intransit or on workstations.
No clear organizational
structure or overall ownership
of security responsibilities for
Ownership of security
responsibilities within the
enterprise exists but the
Security organizational
structure defined and fairly
mature and exhibits some
Security organizational
structure defined and aligned
for effective service delivery
Security organizational
performance is evaluated,
enhanced and rewarded based
Security and Risk Management Current State Organization Assessment
1 — Ad Hoc 2 — Reactive 3 — Challenged 4 — Managed 5 — Optimized

8/9/2019 A Current State Assessment-Finalv2 384036 7
http://slidepdf.com/reader/full/a-current-state-assessment-finalv2-384036-7 227/238
226
Engagement: 330002080 — Final Version© 2012 Gartner, Inc. and/or its affiliates. All rights reserved.Gartner is a registered trademark of Gartner, Inc. or its affiliates.
of security responsibilities for
enterprise. Common attributesinclude:
■ Very few dedicated resourcesfor security as their primaryresponsibility;
■ Low security accountability atboth the project and ongoingoperations levels;
■ No or extremely limitedsecurity training orcertifications present;
■ Low skill sets;
■ Undefined roles andresponsibilities.
enterprise exists, but the
organization is immature andsome of the appropriate skill
sets are not present. Common
attributes include:
■ Organizational structure isdefined but it is not aligned foreffective service delivery;
■ Technology-centricorganization with tieredsupport;
■ Missing key organizationfunctions/roles;
■ Inconsistently defined rolesand responsibilities;
■ Nascent process-based roles;■ Limited staff development and
training budgets;■ Staff utilization metrics;■ Formal performance reviews;■ Duplicative roles;■ No succession planning with
key single points of failure;■ Ad hoc governance;■ Non-optimized staffing levels;■ Weak budget level IT finance.
mature, and exhibits some
best practices. Skill setslargely align with security
needs and training, and
certifications are present.
Common attributes include:
■ Defined, empowered role for aCISO or similar position;
■ Organizational structure isdefined and aligned foreffective service delivery;
■ Process-driven organization;■ Consolidated organization
with matrix management;■ Alignment of resources by
roles and skills;■ Appropriate staffing or skills
not in place for someelements;
■ Optimized or near-optimizedstaffing levels;
■ Working to adopt bestpractices;
■ Some competency centers;■ Defined senior-level
governance structure and
charters;■ Effective succession planningwith no single points of failure;
■ Comprehensive staffdevelopment programs.
for effective service delivery
and enforcement withappropriately resourced and
skilled staff. Common
attributes include:
■ Organizational structure isdefined and aligned foreffective service delivery, withappropriately resourced andskilled staff;
■ Established program forongoing training;
■ Service-centric organization;
■ Service-delivery-focusedorganization with strongrelationship managers andservice line financialmanagement roles;
■ Trusted service provider tobusiness;
■ Skills portfolio management;■ Formal multi-tiered
governance structure withcharters;
■ Metrics-driven performancemanagement;
■ Detailed role definition.
enhanced and rewarded based
on defined objectives.Common attributes include:
■ Security accountabilityintegrated effectively into thebusiness;
■ Customer- and business-focused organization;
■ Virtual teaming;■ Business/IT Staff rotation;■ Developing best practices;■ Focused staff development
and training competency
centers;■ Business-driven metrics and
resourcing.
Security and Risk Management Current State Organization Assessment Rationale
Strengths Weaknesses
Cyber-security is managed under a separate statewideCSO who is a direct report of the CIO.
Dedicated staffing with a sufficient number of staff.
As is the norm in the industry, DTMB is challenged withhiring and retaining senior people.
Some key functions are one-deep, with limited succession

8/9/2019 A Current State Assessment-Finalv2 384036 7
http://slidepdf.com/reader/full/a-current-state-assessment-finalv2-384036-7 228/238
227
Engagement: 330002080 — Final Version© 2012 Gartner, Inc. and/or its affiliates. All rights reserved.Gartner is a registered trademark of Gartner, Inc. or its affiliates.
Have good feeder system across DTMB and from regionaleducational institutions to bring in junior staff.
Staffing function includes architecture, project management,compliance, risk management, training and policymanagement functions.
Performing both security management and IT riskmanagement functions within the security organization.
Have a security operations committee in place to help
govern the technical and business issues around securitymanagement. This committee is a sub-committee of theCSP governance process and is solely focused on cyber-security with representation from other technology domains,as well as Agency Services.
Have an executive-level Technical Review Board (ETRB)that manages overall IT direction, as well as providesapprovals and management for specific exceptions, asneeded, for the security process.
planning in place. Privacy management role and privacy officer function was
not observed.
Staff do not appear to have comprehensive understandingof how to leverage full capability of tools. There is a needfor specialized training on tools in the environment.
‒ Staff is using tools in a more-general sense and is not ableto customize to improve effectiveness and efficiency. Thesecurity staff does not have strong security analysts. As a
result they do not possess the skill/training to leverage thefull capabilities of the tools.
Some security duties are managed by other organizations,e.g., Office Automation manages the mail filter; this wouldbe better run by Security operations.
Roles and responsibilities between the various IS technicaldomains and the recently created CIP are not clearlydefined.
Overall, IT risk management is not comprehensive. Some
functions related to initial IT application risk is done;however, evaluation, enforcement and operationalizing riskmanagement activities (DR plans) are not a focus. Aseparate State risk officer function was not observed.
Security and Risk Management Current State Organization Assessment Rationale (continued)
Strengths Weaknesses (continued)
Staff reactive rather than proactive, and missing intrusionsor increased time before identification.
Not seeing all security events (i e from email filters) could

8/9/2019 A Current State Assessment-Finalv2 384036 7
http://slidepdf.com/reader/full/a-current-state-assessment-finalv2-384036-7 229/238
228
Engagement: 330002080 — Final Version© 2012 Gartner, Inc. and/or its affiliates. All rights reserved.Gartner is a registered trademark of Gartner, Inc. or its affiliates.
Not seeing all security events (i.e., from email filters) couldmiss intrusions originating from phishing emails, which isbecoming a big threat factor in getting a foothold on thedesktops, which are not well protected.
Security and Risk Management Current State Process Assessment
Processes to support security
are non-existent, or ad hoc.
Common attributes include:
Processes to support security
are largely documented;
formal processes are nascent
Processes to support security
are standardized and are
consistently applied to the
Processes to support security
are well defined and managed
consistently across the
Processes to support security
are mature and efficient.
Common attributes include:
1 — Ad Hoc 2 — Reactive 3 — Challenged 4 — Managed 5 — Optimized

8/9/2019 A Current State Assessment-Finalv2 384036 7
http://slidepdf.com/reader/full/a-current-state-assessment-finalv2-384036-7 230/238
229
Engagement: 330002080 — Final Version© 2012 Gartner, Inc. and/or its affiliates. All rights reserved.Gartner is a registered trademark of Gartner, Inc. or its affiliates.
Common attributes include:
■ Completely ad hoc processesthat are not documented,standardized, measured orcontinuously improved;
■ "Reinvention of the wheel",duplicative efforts.
formal processes are nascent
and focused on policing andcompliance. Common
attributes include:
■ Security processes have beenpartially integrated (at theuser interface, data or activitylevels) with other relatedprocesses, including relevantoperations and servicemanagement processes;
■ Processes are neither welldefined nor repeatable;
■ Some or most processesdocumented;
■ Processes are notstandardized or measured,and there is no method forimprovement.
consistently applied to the
organization. Commonattributes include:
■ Security processes have beenlargely integrated (at the userinterface, data or activitylevels) with other relatedprocesses, including relevantoperations and servicemanagement processes;
■ Some processes andprocedures may be manual orinefficient, and workarounds
are present;■ No measurement or means of
improving those processes.
consistently across the
enterprise. Common attributesinclude:
■ Security processes have beenformally and effectivelyintegrated (at the userinterface, data or activitylevels) with other relatedprocesses, including relevantoperations and servicemanagement processes;
■ Systems, methods andpractices are followed with
appropriate control andgovernance;
■ Mechanisms are in placeacross the enterprise toensure compliance.
Common attributes include:
■ Best practices for securityprocesses are present, andhave been optimallyintegrated (at the userinterface, data or activitylevels) with other relatedprocesses, including relevantoperations and servicemanagement processes;
■ Continuous measurement andimprovement of securityprocesses is a core
competency;■ Control/governance
mechanisms are in place tofeed a cycle of continualenhancement and evolutionacross the enterprise.
Security and Risk Management Current State Process Assessment Rationale
Strengths Weaknesses
Policy management is being done by the compliance team.Policy compliance is tied in with EA reviews, as well as theinfrastructure service request process.
Awareness and education process is starting to developinitial user-awareness training. However, there appears tobe a need for better user awareness on areas of increasing

8/9/2019 A Current State Assessment-Finalv2 384036 7
http://slidepdf.com/reader/full/a-current-state-assessment-finalv2-384036-7 231/238
230
Engagement: 330002080 — Final Version© 2012 Gartner, Inc. and/or its affiliates. All rights reserved.Gartner is a registered trademark of Gartner, Inc. or its affiliates.
A good compliance process is in place, especially for PCIcompliance. CIP works very closely with the TreasuryDepartment to ensure all aspects of PCI compliance areproactively managed. SOM has been PCI certified fourtimes.
Good collaboration sources with MS/ISAC and DHS.
Use COBIT and NIST 800-53 standards and guidelines.
Have inserted security into the SUITE process for
compliance reporting and participate in the infrastructureprovisioning process, especially for servers.
Utilizing configuration management processes and toolsmaintained by the DC operations team, the network teamand the desktop team.
Are starting to look at user awareness training for security-related functions.
Vulnerability management including identification (EAcompliance phase), remedial action (EA compliance and
CMDB) and scanning is being done.
risk.‒ Specialized technical risk-awareness training and
controls are also needed when dealing with a federatedapplication development/Infrastructure Servicesenvironment with many different vendors and products.
IAM and data access management will need to bemanaged due to focus on Mobility, cross-agencyintegration, third-party integration, social networking, etc.This area appears to be reactive based on need, as
opposed to being a focus for DTMB. Need to be more proactive (detective in nature), as
opposed to reacting to threats identified by tools.
Vulnerability management/threat management.
‒ Tracking of critical data elements is not done formally (agreat deal of privileged taxpayer info, criminalinformation, etc., is stored but not tracked formally).
‒ A comprehensive enterprisewide risk assessment thatidentifies the top five to 10 risks for the State has not
been done. The last agency-wide risk assessment wasnine years ago and has not been updated.
Security and Risk Management Current State Process Assessment Rationale (continued)
Strengths (continued) Weaknesses (continued)
Security incident management involves detection throughSIEM tools and management through a breachmanagement process.
‒ IT risks assessments for IT systems are done on asystem-by-system basis.
‒ Process to update policies with latest threats or control

8/9/2019 A Current State Assessment-Finalv2 384036 7
http://slidepdf.com/reader/full/a-current-state-assessment-finalv2-384036-7 232/238
231
Engagement: 330002080 — Final Version© 2012 Gartner, Inc. and/or its affiliates. All rights reserved.Gartner is a registered trademark of Gartner, Inc. or its affiliates.
Business continuity risk management for IT systems ismanaged out of the CIP.
p p
technology is not comprehensive.
Out-of-date enterprisewide risk assessment indicatesprobably not prioritizing areas of protection that are notspecifically under regulatory requirements.
Asset management not comprehensive; still in multiplesystems with varying degrees of control.
‒ Without complete asset management, one does not knowwhat to protect, or where it is.
Desktop patching is limited to OS, not applications.‒ Unpatched applications are a large threat vector, not
keeping applications (such as Adobe or browsers)patched could allow simple attacks to take overworkstations.
Focus is on security processes; risk management andprivacy management are not as mature or a source offocus.
A dedicated 24/7 SOC process that is in charge of security
monitoring of all infrastructure assets is not in place. Although security monitoring is occurring during office hoursand transferred to IT operations monitoring after-hours, thisfunction is not dedicated in nature.
Security and Risk Management Current State Strategy Assessment
There is no defined strategy
for security. Common
attributes include:
A security strategy exists, but
it is not coordinated, not
clearly defined, and does not
The security strategy is
defined and communicated;
however, it is not consistently
The security strategy is clearly
defined, communicated and
socialized throughout the
Security is fully integrated
with strategic planning,
continually reviewed, and the
1 — Ad Hoc 2 — Reactive 3 — Challenged 4 — Managed 5 — Optimized

8/9/2019 A Current State Assessment-Finalv2 384036 7
http://slidepdf.com/reader/full/a-current-state-assessment-finalv2-384036-7 233/238
232
Engagement: 330002080 — Final Version© 2012 Gartner, Inc. and/or its affiliates. All rights reserved.Gartner is a registered trademark of Gartner, Inc. or its affiliates.
■ Security does not have itsown goals and objectives, andsimply reacts to most-vocal orinfluential customers (eitherinternal or external);
■ Security has no means ofunderstanding whether or notit is aligned with DTMB’soverall strategy;
■ No process and/orgovernance in place to ensureongoing alignment with
DTMB’s overall strategy.
y ,
have measurable objectives.Common attributes include:
■ Security strategy does notfully integrate with the widerorganization. nor is itcommunicatedenterprisewide;
■ Security has its own goalsand objectives, but there is noreal consideration for aligningit with the overall DTMBstrategy;
■ Some means ofunderstanding whether or notit is optimizing to its owndesired goals, but cannotdetermine if it is really workingtoward DTMB’s overallstrategy;
■ No or limited ability to ensureongoing alignment withDTMB’s overall strategy.
, y
or effectively translated intoaction. Common attributes
include:
■ Security governance isinadequately established,allowing for theimplementation of the strategyto become fragmented andconfused across theenterprise;
■ Security has its own goalsand objectives that partially
align with DTMB’s overallstrategy;
■ Reactively determines howwell they are aligned toDTMB’s overall strategy;
■ Ineffective or nascent ability toensure ongoing alignmentwith DTMB’s overall strategy,or ability to take correctiveaction when it is getting out ofalignment.
g
enterprise. Common attributesinclude:
■ Security governanceeffectively used to articulatehow architecture developmentdecisions are made;
■ Security has its own goalsand objectives that fully alignwith DTMB’s overall strategy;
■ Proactively determines howwell they are aligned toDTMB’s overall strategy;
■ Adequate ability to ensureongoing alignment withDTMB’s overall strategy, or totake corrective action when itis getting out of alignment.
y ,
strategy is updated to alignwith business objectives.
Common attributes include:
■ Security governance functionis integrated with theorganization’s corporate andIT governance functions;
■ Security strategy is clearlydefined and communicatedthroughout the enterprise;
■ Security has its own goalsand objectives that fully align
with DTMB’s overall strategy;■ Proactively determines how
well they are aligned toDTMB’s overall strategy;
■ Effective ability to ensureongoing alignment withDTMB’s overall strategy, andto take corrective action whenit is getting out of alignment.
Security and Risk Management Current State Strategy Assessment Rationale
Strengths Weaknesses
Strong statewide outward-facing strategy for cyber-awareness and education, as is evidenced by the cyber-security website as well as strategy documents.
A corresponding internal strategy that links outward focus toprotection of State network was not identified.
Currently, more-tactical operations, no strategic long-term

8/9/2019 A Current State Assessment-Finalv2 384036 7
http://slidepdf.com/reader/full/a-current-state-assessment-finalv2-384036-7 234/238
233
Engagement: 330002080 — Final Version© 2012 Gartner, Inc. and/or its affiliates. All rights reserved.Gartner is a registered trademark of Gartner, Inc. or its affiliates.
Strong peer networking approach with strong ties withfederal/State security agencies that enables testing,funding and training of resources and new technologies.
Working with local, State, federal agencies and privatecompanies to set up a cyber-command center.
view of internal security priorities.‒ A public intrusion on internal network could affect the State’s
reputation for wanting to be leader.
With limited capital funding to upgrade existing toolsets andpurchase new technologies, keeping abreast of cyber-security is an important area for SOM.
Risk management activities are limited to IT systemssecurity and initial application risk management.Comprehensive risk management activities such as risk
governance, risk mitigation planning, risk managementprogram, risk register and repeatable risk managementprogram is not in place.
‒ The lack of risk management discipline increases overall riskto the State.
Environmental scanning that looks for events in the externalmarket, as well as events/trends in the internal organizationwith a view to identify potential threats, is not in place at thistime.
‒
Without this, DTMB will not keep up with advanced threats. Although IT security is a focus, information security is not a
focus (includes lack of EA focus in informationmanagement).

8/9/2019 A Current State Assessment-Finalv2 384036 7
http://slidepdf.com/reader/full/a-current-state-assessment-finalv2-384036-7 235/238
Security services are not
clearly defined or negotiated
with the customer. Common
Security services are
provided, but performance is
not effectively measured.
Security service-level
agreements and metrics are
established, and the
Security service-level
agreements and metrics are
established, and the IT
Security service-level
agreements and metrics are
collaboratively and regularly
Security and Risk Management Current State Service Level Assessment
1 — Ad Hoc 2 — Reactive 3 — Challenged 4 — Managed 5 — Optimized

8/9/2019 A Current State Assessment-Finalv2 384036 7
http://slidepdf.com/reader/full/a-current-state-assessment-finalv2-384036-7 236/238
235
Engagement: 330002080 — Final Version© 2012 Gartner, Inc. and/or its affiliates. All rights reserved.Gartner is a registered trademark of Gartner, Inc. or its affiliates.
attributes include:
■ No service-levelagreements or metrics forwhich they are accountableto either end customers orother groups within DTMB;
■ No means of working withcustomers on an ongoingbasis to understand actualdelivery against service-level agreements;
■ No means of continuouslyimproving to achieve betterlevels of customersatisfaction.
Common attributes include:
■ No or few objectives ormetrics are defined forsecurity services, or acrossthe enterprise;
■ Have limited securityservice-level agreementsand metrics for which theyare accountable to eitherend customers or othergroups within DTMB;
■ Ability to accuratelycalculate those metrics islimited;
■ Little means of working withcustomers on an ongoingbasis to understand actualdelivery against service-level agreements;
■ No means of continuouslyimproving to achieve betterlevels of customersatisfaction.
organization is accountableto end customers and other
groups within DTMB.
Common attributes include:
■ Ability to accuratelycalculate metrics that endcustomers and other DTMBgroups partially believe tobe accurate;
■ Security is partially able towork with customers on anongoing basis to understandactual delivery againstservice-level agreements;
■ No means of continuouslyimproving to achieve betterlevels of customersatisfaction;
■ Service levels to supportchargeback and otherfinancial allocationmechanisms exist but arenot fully mature.
support organization ismanaging to agreed-upon
service levels. Common
attributes include:
■ Security service-levelagreements, and metrics forwhich they are accountableto end customers and othergroups within DTMB, arebenchmarked againstpeers;
■ Ability to accurately
calculate metrics that endcustomers and other DTMBgroups mostly believe to beaccurate;
■ Fully able to work withcustomers on an ongoingbasis to understand actualdelivery against service-level agreements;
■ Ability to work towardimproving actual delivery tocurrent service-levelagreements, but not toward
increasing those servicelevels in the future;■ Service levels to support
chargeback and otherfinancial allocationmechanisms exist.
agreed to with customers,and organization is fully
accountable to end
customers and other groups
within DTMB. Common
attributes include:
■ Ability to accuratelycalculate metrics that endcustomers and other DTMBgroups truly believe to beaccurate;
■ Fully able to work withcustomers on an ongoingbasis to understand actualdelivery against service-level agreements;
■ Means of continuouslyimproving to achieve betterlevels of customersatisfaction and to increasethose service levels in thefuture;
■ Best-practice chargebackand other financialallocation mechanisms arein place to deliver cost-
effective and high-qualityservices.
Security and Risk ManagementCurrent State Service Level Assessment Rationale
Strengths Weaknesses
Tools that have been deployed automatically capturemany operational metrics around security process.
DRM process has started collecting metrics around
Management-level metrics that deal with security dashboards ormetrics for providing to management to assess the overall threatstatus to DTMB were not identified.

8/9/2019 A Current State Assessment-Finalv2 384036 7
http://slidepdf.com/reader/full/a-current-state-assessment-finalv2-384036-7 237/238
236
Engagement: 330002080 — Final Version© 2012 Gartner, Inc. and/or its affiliates. All rights reserved.Gartner is a registered trademark of Gartner, Inc. or its affiliates.
progress toward completing DR planning.

8/9/2019 A Current State Assessment-Finalv2 384036 7
http://slidepdf.com/reader/full/a-current-state-assessment-finalv2-384036-7 238/238
Contact Information
Eugene MartinezProject ManagerTelephone: +1 916 414 [email protected]
Rob Stalder Assessment LeadTelephone: +1 703 387 [email protected]
Paul DenvirEngagement ManagerTelephone: +1 908 249 [email protected]
Ivy I. AndersonManaging Partner, ConsultingTelephone: +1 312 526 0264 [email protected]


![[7] Apresentação finalV2](https://static.fdocuments.net/doc/165x107/577c80501a28abe054a822ba/7-apresentacao-finalv2.jpg)
