A cross validation of Consumer-Based Brand Equity models ... · A cross validation of...
20
Page 1 of 20 A cross validation of Consumer-Based Brand Equity models: Driving customer equity in retail brands Sertaç Çifci, Abant Izzet Baysal Unıversity, Turkey Yuksel Ekinci, University of Reading United Kingdom Georgina Whyatt, Oxford Brookes University, United Kingdom Arnold Japutra, Tarumanagara University, Indonesia Sebastian Molinillo, University of Malaga, Spain Haytham Siala, University of Roehamton, United Kingdom Abstract The Consumer-Based Brand Equity (CBBE) literature has, in recent years, introduced various CBBE models. This study aims to compare the validity of the two prominent CBBE models in the retail industry; those introduced by Yoo and Donthu (2011) and Nam, Ekinci and Whyatt (2011). In order to make this comparison, the study collected data from Turkish (n = 285) and Spanish respondents (n = 236) who had experience with global fashion brands and Private Labels (PL). The findings of the study suggest that Nam et al.'s (2011) CBBE model has better validity than Yoon and Donthu's (2011) model. When brand awareness is included in Nam et al.'s model, the psychometric properties of the model improve and outperform the two models. The study discusses the theoretical contributions and managerial implications of the research. Keywords Consumer-Based Brand Equity (CBBE), Brand satisfaction, Service quality, Fashion retail industry, Private Labels (PL)
Transcript of A cross validation of Consumer-Based Brand Equity models ... · A cross validation of...
Page 1 of 20
A cross validation of Consumer-Based Brand Equity models:
Driving customer equity in retail brands
Sertaç Çifci, Abant Izzet Baysal Unıversity, Turkey
Yuksel Ekinci, University of Reading United Kingdom
Georgina Whyatt, Oxford Brookes University, United Kingdom
Arnold Japutra, Tarumanagara University, Indonesia
Sebastian Molinillo, University of Malaga, Spain
Haytham Siala, University of Roehamton, United Kingdom
Abstract
The Consumer-Based Brand Equity (CBBE) literature has, in recent years, introduced various CBBE models.
This study aims to compare the validity of the two prominent CBBE models in the retail industry; those
introduced by Yoo and Donthu (2011) and Nam, Ekinci and Whyatt (2011). In order to make this comparison,
the study collected data from Turkish (n = 285) and Spanish respondents (n = 236) who had experience with
global fashion brands and Private Labels (PL). The findings of the study suggest that Nam et al.'s (2011)
CBBE model has better validity than Yoon and Donthu's (2011) model. When brand awareness is included in
Nam et al.'s model, the psychometric properties of the model improve and outperform the two models. The
study discusses the theoretical contributions and managerial implications of the research.
Keywords
Consumer-Based Brand Equity (CBBE), Brand satisfaction, Service quality, Fashion retail industry, Private
Labels (PL)
Document1 2
1. Introduction
In today's marketplace successful brands must develop and maintain distinctive images in order to sustain
their competitive advantage (Aaker, 1991; Pappu, Quester, & Cooksey, 2005). Consumer-Based Brand
Equity (CBBE) is essential for driving customer equity, differentiating brands, assessing brand performance
and gaining competitive advantage in the marketplace (Lassar, Mittal, & Sharma, 1995; Sun, Kim, & Kim,
2014; Zhang, Ko, & Kim, 2010). Strong brand equity is achieved when consumers recognize brands, have
favorable brand identification, and brand loyalty (Keller, 1993).
As brand equity positively associates with customer equity and brand success, CBBE receives significant
attention from the academic and business community (Kim, Kim, & An, 2003; Kim, Ko, Lee, Mattila, & Kim,
2014). As such the brand equity models introduced by Aaker (1991) and Keller (1993) are widely
acknowledged (Buil, Martinez, & de Chernatony, 2013; Pappu et al., 2005). Using Aaker's (1991) four-
dimensional brand equity model, scholars such as Yoo and Donthu (2001) introduce measurement scales for
assessing CBBE. However, many of these measures are applied to goods dominant brands (Jung & Sung,
2008; Punj & Hillyer, 2004; Yoo & Donthu, 2001). Applications of the CBBE measures to service brands are
limited. Also previous applications of Aaker's CBBE model to service organizations display poor validity (for
example, Boo, Busser, & Baloglu, 2009). Nam, Ekinci, and Whyatt (2011) argue that the existing
measurement scales based on Aaker's (1991) and Keller's (1993) CBBE models are not suitable for service
dominant brands because of the inherent characteristics of services: intangibility, perishability, heterogeneity
and inseparability (Grönroos, 1984). Some of the brand equity dimensions seem to differ for services.
Although Aaker (1991) states that perceived quality is uni-dimensional, services marketing scholars argue
that service quality is multi-dimensional (Grönroos, 1984). Nam et al. (2011) show that service quality is
formed with two dimensions: physical quality and staff behavior. Furthermore, Aaker's (1991) CBBE model
focuses mainly on the functional aspects of brands and ignores the brand's symbolic consumption that is
essential for brand equity. To address this deficiency, Nam et al. (2011) introduce three symbolic
consumption related brand equity dimensions: self-congruence, brand identification and lifestyle congruence.
Nam et al.'s (2011) empirical study support validity of their model in the UK hospitality industry, but their
findings are limited to only hotel and restaurant brands. Hence, there is uncertainty as to whether their
findings are valid when the CBBE model is applied to other service sectors and national cultures.
This study's aims are twofold; firstly, to assess the external validity of Yoo & Donthu's (2001) and Nam et
al.'s (2011) brand equity model in Turkish fashion retailing and Spanish grocery retailing selling private
labels. Both countries are culturally different from the UK and US, where these models had been developed
and tested; secondly, to advance Nam et al.'s (2011) CBBE model by introducing brand awareness. This
study differs from previous studies by comparing the validity of the two prominent CBBE models in a new
service sector, and contributes to the branding literature by advancing understanding of brand equity
dimensions and their relationships with brand satisfaction and brand loyalty in cross-cultural settings. The
research paper starts with a review of the CBBE models. Then the methodology of the two studies and their
findings are presented. Finally, this paper discusses the theoretical and managerial implications for the retail
industry.
Document1 3
2. Background of the study: Consumer-Based Brand Equity
Attentions to measuring CBBE have been increasing in recent years (Moon, Park, & Choi, 2010). The
underlying reason for this interest is the impact that CBBE has on the consumer's brand choice, brand
commitment (Cobb-Walgren, Beal, & Donthu, 1995), brand extension (Kim & Brandon, 2010), and business
performance (Kim et al., 2003). Over the last three decades, different CBBE models and dimensions are
introduced (Jung & Sung, 2008). Due to the differing conceptualizations of CBBE, there is no clear
agreement on how brand equity should be measured (Maio Mackay, 2001). Nonetheless, the consumer-
brand equity models introduced by Aaker (1991) and Keller (1993) are widely utilized. Keller (1993; 2)
defines brand equity as “the differential effect of brand knowledge on consumer response to the marketing of
the brand”. Whereas Aaker (1991) refers to brand equity as a set of assets and liabilities linked to a brand.
According to Aaker (1991), CBBE has four dimensions: perceived quality, brand awareness, brand loyalty
and brand associations. Perceived quality is described as “the consumer's judgment about a product's
overall excellence or superiority” (Zeithaml, 1988; 3). Brand awareness refers to the consumer's brand recall
or brand recognition (Aaker, 1991). Brand association is the brand knowledge stored in the consumer's mind,
and brand loyalty is “the attachment that a customer has to a brand” (Aaker, 1991; 39). However, Aaker
(1991) introduces this model for drawing attention to brand management in an ideal world, rather than
demonstrating how brand equity should be measured.
Utilizing Aaker's (1991) and Keller's (1993) conceptualizations of brand equity, Yoo and Donthu (2001)
develop a multi-dimensional scale to measure CBBE. They test the validity of the scale using goods
dominant brands (athletic shoes, film for cameras, and color television sets) among three cultural groups
(Korean, Korean American and American). They claim that their measures are valid and reliable. Although
applications of Yoo and Donthu's (2001) brand equity scale confirm its reliability, the validity of their model is
questioned. Washburn, Brian, and Priluck (2000) state that the discriminant validity of their measures used to
assess three dimensions are poor: perceived quality, brand loyalty and brand associations/awareness.
Washburn and Plank (2002) show that the scale items measuring brand association and brand awareness
are not distinct. In addition to these criticisms, several researchers argue that Yoo & Donthu's brand equity
measure is not suitable for service dominant brands (for example, Lee & Back, 2010; Nam et al., 2011)
because service dominant brands are different from goods dominant brands (Kim et al., 2003) due to the
inherent characteristics of services: intangibility, perishability, heterogeneity and inseparability (Grönroos,
1984). Therefore, Aaker's model should be adapted to service brands where necessary (Lee & Back, 2010).
Nam et al. (2011) introduce an alternative CBBE model for assessing service dominant brands based on
seven dimensions: physical quality, staff behavior, ideal self-congruence, brand identification and lifestyle
congruence, brand satisfaction and brand loyalty. In their new conceptualisation of CBBE for services, Nam
et al. (2011) exclude brand awareness although Aaker (1991) and Keller (1993) recognize brand awareness
as an important asset for brand equity. Keller (2003; 76) defines brand awareness as “the customers' ability
to recall and recognize the brand as reflected by their ability to identify the brand under different conditions
and to link the brand name, logo, symbol, and so forth to certain associations in memory”. Brand recognition
is usually assessed by nominal (that is, “yes” or “no”) responses. Later Keller (2003) and Aaker (1996)
introduce higher levels of brand awareness (or recall) besides recognition including brand dominance, brand
knowledge, and brand opinion. The latter is the set of brand associations linked to the brand. Brand

Document1 4
awareness is the degree of brand knowledge stored in the minds of consumers beyond simple name
recognition. As stated in Keller's (1993) and Aaker's (1996) conceptualisation, brand awareness is a
cognitive and knowledge-based brand equity dimension even though it is excluded from Nam et al.'s (2011)
model. Hence, Fig. 1 presents the three CBBE models introduced by Yoo and Donthu (2001); Nam et al.
(2011) and the extended Nam et al. model that includes brand awareness.
Fig. 1. Consumer-Based Brand Equity: three competing models.
As can be seen from Fig. 1, Yoo and Donthu (2001) propose that brand loyalty is one of the components of
CBBE and the three brand equity dimensions influence overall brand equity (Model 1). Furthermore, brand
awareness and brand associations are formed into the same dimension. Nam et al. (2011) argue that brand
loyalty is one of the components of CBBE but an outcome rather than antecedent of brand equity.
Researchers (for example, Im, Kim, Elliot, & Han, 2012; Xu & Chan, 2010) acknowledge the direct
relationship between brand equity dimensions and brand loyalty. Buil et al. (2013) confirm that brand
associations, brand awareness, perceived quality and brand association influence brand loyalty.
As can be seen from Model 2, Nam et al. (2011) suggest that the six brand equity dimensions — physical
quality, staff behavior, ideal self-congruence, brand identification and lifestyle congruence, brand satisfaction
— influence brand loyalty. Physical quality and staff behavior are service quality (SQ) dimensions in line with
the multi-dimensional nature of service quality (Ekinci, Dawes, & Massey, 2008, Grönroos, 1984). The two
service quality dimensions represent the cognitive aspect of brand equity, whereas ideal self-congruence,
brand identification and lifestyle congruence represent the symbolic aspect of brand equity. Brand
satisfaction embodies the consumer's post-purchase experience with brands and mediates the relationships
between the five dimensions of brand equity and brand loyalty (Koo & Kang, 2004). Nam et al. (2011) argue

Document1 5
that, if consumers do not have purchase experience with brands, brand satisfaction can be removed from the
model. Consumer loyalty refers to the consumer's behavioral intentions with regard to purchasing and
recommending.
According to Nam et al. (2011) physical quality is the image projected by the design, equipment, facilities,
and materials associated with the retail shop; whereas staff behavior is the image projected by the retail
employees' competence, helpfulness, friendliness, and responsiveness (Ekinci et al., 2008). Ideal self-
congruence refers to the degree to which brand image coincides with the consumer's ideal self-concept
(Ekinci et al., 2008). Hence people consume brands in order to sustain their self-esteem (Das, 2015; Sirgy,
1982). Recent research suggests that consumer-brand relationships are driven by a multifaceted self in the
form of multiple social identities (Champniss, Wilson, & Macdonald, 2015; Reed, Forehand, Puntoni, &
Warlop, 2012). Brand identification refers to a situation where consumers express their social identity
through brand association or brand consumption (Del Rio, Vazquez, & Iglesias, 2001). Consumers associate
themselves with brands that have positive reputations (Long & Shiffman, 2000). Hence, brand identification
enables consumers to integrate or disintegrate social groups. Furthermore consumers develop positive
attitudes towards brands when they feel that those brands help them to express uniqueness and desired
lifestyle (Phau, Teah, Lim, & Ho, 2015). Lifestyle congruence refers to the degree to which brand
consumption supports the consumer's unique pattern of living as expressed by activities, interests, and
opinions (Nam et al., 2011). All of these brand equity dimensions help to either differentiate individuals from
one another, or to associate them to other individuals who have similar interests and activities (Foxall,
Goldsmith, & Brown, 1998; Solomon, 2002). Finally, Model 3 includes all the brand equity dimensions
suggested by Nam et al. and brand awareness. This study compares validity of the three CBBE models in
two different retail sectors in Turkey and Spain.
3. Study 1
Study 1 selects the global fashion retail sector because this is changing rapidly and therefore firms need to
create strong brands to compete successfully. Despite the significant size of this sector, the research
investigating CBBE in the global fashion retail brand context is limited (Tong & Hawley, 2009). Turkey is
selected because previous CBBE studies draw empirical data from developed countries such as UK, USA,
and Turkey's economy is growing rapidly. This offers the opportunity to examine the external validity of the
two CBBE models in a different culture and economy from Western and Asian societies.
Document1 6
3.1. Method
An online questionnaire including a list of 25 global fashion brands (for example, Adidas, Dolce and
Gabbana, H&M, Lacoste, Marks and Spencer) was administered in Turkey. Respondents assessed one of
the presented brands' perceived brand equity. Since the measurement scales were in English, a qualified
interpreter translated the scale items into Turkish. Then, a bilingual researcher back-translated the scale
items to English to confirm accuracy and consistency of their meaning. Most respondents were resident in
one of the two largest cosmopolitan Turkish cities: Istanbul and Ankara. Three hundred fifty consumers
responded to the questionnaire. Of these, 285 responses were found to be valid. The sample demographics
were: 44% male, 56% female; 40% were between 16 and 24, 24% between 25 and 34% between 35 and 44,
2% over 45 years old.
The dimensions of CBBE include perceived quality, brand awareness/associations, brand loyalty, overall
brand equity, physical quality, staff behavior, ideal self-congruence, brand identification, lifestyle congruence
and brand satisfaction assessed by a 7-point Likert type scale. This study adopted measurement items from
Yoo and Donthu (2001) and Nam et al. (2011). In line with Anderson and Gerbing (1988), a two-stage
Structural Equation Modeling (SEM) approach (the measurement model followed by the structural model)
tested Yoo and Donthu's (2001), Nam et al.'s (2011) model and the extended model of Nam et al. (Model 3).
Before any analysis was conducted, normality tests were performed using the skewness value of each item.
The results suggested that the distribution of the data was normal since the skewness values are around the
absolute value of 0 and 1 (Hair, Black, Babin, & Anderson, 2010). The two-stage SEM approach was
conducted with AMOS 21 employing the Maximum Likelihood (ML) method.
Based on Harman's single-factor test, common-method variance poses a problem if a single unrotated factor
solution appears from the exploratory factor analysis (EFA) test or one general factor accounts for the
majority of the covariance among the measures (Podsakoff, MacKenzie, Lee, & Podsakoff, 2003). The EFA
results of Yoo and Donthu's (2001) model revealed two factors from the unrotated factor solution, accounting
for 60.83% of the total variance where the first factor accounts for 45.19%. The results of the EFA of Nam et
al.'s (2011) model revealed five factors from the unrotated factor solution, accounting for 70.24% where the
first factor accounts for 40.63%. The EFA results for the extended model of Nam et al. revealed seven
factors with eigen values greater than one from the unrotated factor solution, accounting for 72.67% where
the first factor accounts for 38.55%. These results suggest that common-method variance does not pose a
significant problem for the extended model of Nam et al.

Document1 7
3.2. Results
In order to determine whether the measurement scales are valid, Confirmatory Factor Analysis (CFA) was
conducted on the data and squared correlations and Average Variances Extracted (AVE) were examined to
assess discriminate validity (Fornell & Larcker, 1981). Then Composite Reliability (CR) and Cronbach's
alpha (α) estimated the scale's internal consistency reliability. The descriptive statistics and the scale's
reliability scores are illustrated in Table 1.
Table 1. Study 1: Yoo and Donthu's (2001) CBBE scale: descriptive statistics, reliability, correlations and AVEs.
As can be seen from Table 1, the mean scores of Yoo and Donthu's (2001) brand equity measure range
from 3.92 to 5.37. CR and α scores range from 0.83 to 0.88. Fornell and Larcker (1981) suggest that AVE
values should be greater than 0.50 and higher than the squared correlations in order to support discriminant
validity. All measurement scales meet these criteria. Table 2 shows the results of descriptive statistics and
discriminant validity for Nam et al.'s (2011) measures as well as the brand awareness scale.
Table 2. Study 1: Nam et al. (2011) CBBE scale and the brand awareness scale: descriptive statistics, reliability, correlations and AVEs.
As depicted in Table 2, the scale's CR and α scores are high (> 0.70). Each of the AVEs is higher than 0.50
and greater than the squared inter-correlations. Accordingly Nam et al.'s (2011) measures meet the
requirements of reliability, discriminant validity suggested by Fornell and Larcker (1981). The model testing
was done via the SEM approach and CFA. The structural model fit indices are shown in Table 3.
Document1 8
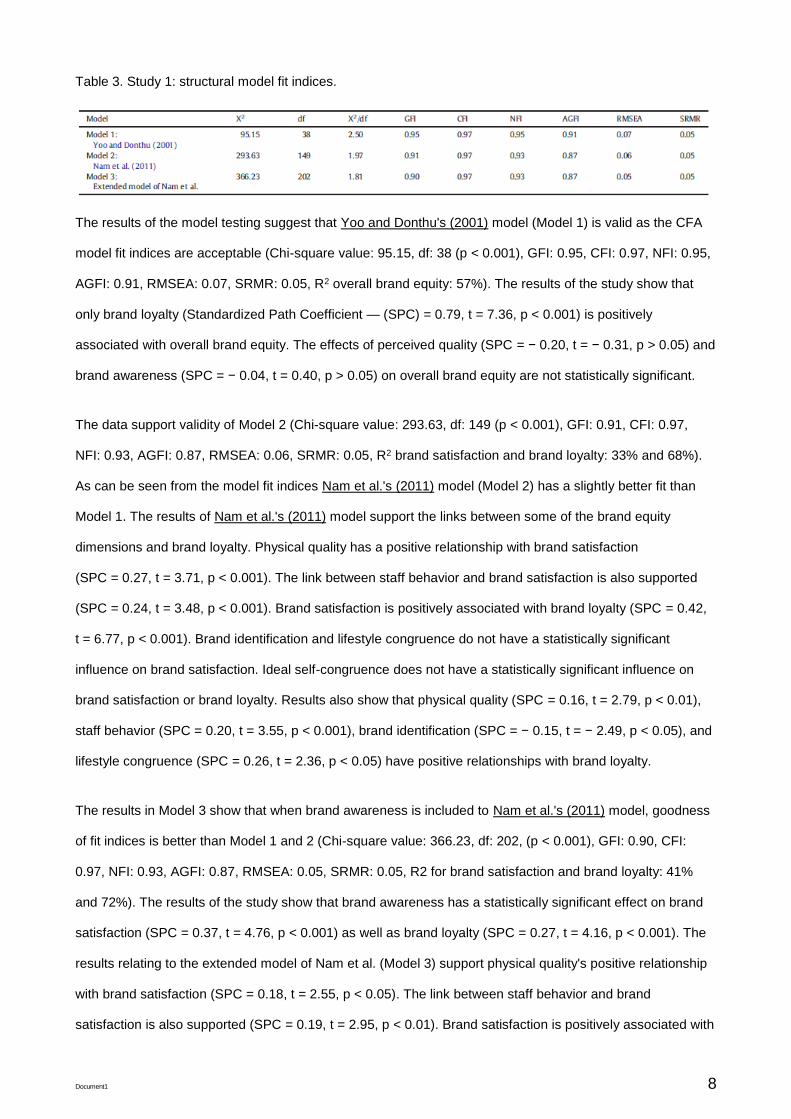
Table 3. Study 1: structural model fit indices.
The results of the model testing suggest that Yoo and Donthu's (2001) model (Model 1) is valid as the CFA
model fit indices are acceptable (Chi-square value: 95.15, df: 38 (p < 0.001), GFI: 0.95, CFI: 0.97, NFI: 0.95,
AGFI: 0.91, RMSEA: 0.07, SRMR: 0.05, R2 overall brand equity: 57%). The results of the study show that
only brand loyalty (Standardized Path Coefficient — (SPC) = 0.79, t = 7.36, p < 0.001) is positively
associated with overall brand equity. The effects of perceived quality (SPC = − 0.20, t = − 0.31, p > 0.05) and
brand awareness (SPC = − 0.04, t = 0.40, p > 0.05) on overall brand equity are not statistically significant.
The data support validity of Model 2 (Chi-square value: 293.63, df: 149 (p < 0.001), GFI: 0.91, CFI: 0.97,
NFI: 0.93, AGFI: 0.87, RMSEA: 0.06, SRMR: 0.05, R2 brand satisfaction and brand loyalty: 33% and 68%).
As can be seen from the model fit indices Nam et al.'s (2011) model (Model 2) has a slightly better fit than
Model 1. The results of Nam et al.'s (2011) model support the links between some of the brand equity
dimensions and brand loyalty. Physical quality has a positive relationship with brand satisfaction
(SPC = 0.27, t = 3.71, p < 0.001). The link between staff behavior and brand satisfaction is also supported
(SPC = 0.24, t = 3.48, p < 0.001). Brand satisfaction is positively associated with brand loyalty (SPC = 0.42,
t = 6.77, p < 0.001). Brand identification and lifestyle congruence do not have a statistically significant
influence on brand satisfaction. Ideal self-congruence does not have a statistically significant influence on
brand satisfaction or brand loyalty. Results also show that physical quality (SPC = 0.16, t = 2.79, p < 0.01),
staff behavior (SPC = 0.20, t = 3.55, p < 0.001), brand identification (SPC = − 0.15, t = − 2.49, p < 0.05), and
lifestyle congruence (SPC = 0.26, t = 2.36, p < 0.05) have positive relationships with brand loyalty.
The results in Model 3 show that when brand awareness is included to Nam et al.'s (2011) model, goodness
of fit indices is better than Model 1 and 2 (Chi-square value: 366.23, df: 202, (p < 0.001), GFI: 0.90, CFI:
0.97, NFI: 0.93, AGFI: 0.87, RMSEA: 0.05, SRMR: 0.05, R2 for brand satisfaction and brand loyalty: 41%
and 72%). The results of the study show that brand awareness has a statistically significant effect on brand
satisfaction (SPC = 0.37, t = 4.76, p < 0.001) as well as brand loyalty (SPC = 0.27, t = 4.16, p < 0.001). The
results relating to the extended model of Nam et al. (Model 3) support physical quality's positive relationship
with brand satisfaction (SPC = 0.18, t = 2.55, p < 0.05). The link between staff behavior and brand
satisfaction is also supported (SPC = 0.19, t = 2.95, p < 0.01). Brand satisfaction is positively associated with

Document1 9
brand loyalty (SPC = 0.34, t = 5.37, p < 0.001). Meanwhile ideal self-congruence, brand identification,
lifestyle congruence do not have a statistically significant influence on brand satisfaction. Results also show
that physical quality (SPC = 0.12, t = 2.07, p < 0.05), staff behavior (SPC = 0.19, t = 3.55, p < 0.001) brand
identification (SPC = − 0.15, t = − 2.52, p < 0.01) and lifestyle congruence (SPC = 0.22, t = 2.14, p < 0.05)
have positive relationships with brand loyalty.
A bootstrap test analysis, using 5000 bootstrap samples, checks the mediation analysis on Model 3
(Preacher & Hayes, 2008; Zhao, Lynch, & Chen, 2010). The score for each construct was aggregated and
bootstrapping procedures were done on each independent variable of brand loyalty, while treating the other
independent variables as covariates. For brand awareness, the mean indirect effect is positive and
significant (a × b = 0.08, 95% CI [0.04, 0.15]). Since c is significant (c = 0.34, p < 0.001) and a × b × c is
positive (0.03), the mediation is complementary mediation. Physical quality's mean indirect effect is positive
and significant (a × b = 0.07, 95% CI [0.02, 0.14]). Since c is significant (c = 0.14, p < 0.05) and a × b × c is
positive (0.01), the mediation is complementary mediation. The mean indirect effect of staff behavior is
positive and significant (a × b = 0.04, 95% CI [0.01, 0.09]). Since c is significant (c = 0.21, p < 0.001) and
a × b × c is positive (0.01), the mediation is complementary mediation. The mean indirect effect of ideal self-
congruence is negative and not significant (a × b = − 0.00, 95% CI [− 0.04, 0.04]). C is not significant
(c = 0.07, p > 0.05), and therefore is no-effect non-mediation. For brand identification, the mean indirect
effect is positive and not significant (a × b = 0.01, 95% CI [− 0.02, 0.04]). C is significant (c = − 0.08,
p < 0.05), and therefore is direct-only non-mediation. The mean indirect effect of lifestyle congruence is
positive and not significant (a × b = 0.02, 95% CI [− 0.01, 0.07]). C is significant (c = 0.18, p < 0.01), and
therefore is direct-only non-mediation.
Based on the results above, brand satisfaction mediates three constructs' relationships with brand loyalty:
brand awareness, physical quality, staff behavior. Since the mediations are categorized as complementary
mediation (Zhao et al., 2010), brand satisfaction partially mediates the effect of brand awareness, physical
quality, and staff behavior on brand loyalty.
4. Study 2
Study 2 aims to assess the external validity of Yoo and Donthu's (2001) and the extended model of Nam et
al. (2011) with Private Labels (PL) in Spain. PL is a powerful commercial entity that impacts significantly on
retail business performance (Pauwels & Srinivasan, 2004). Although PLs are of increasing interest to both

Document1 10
academics and practitioners, particularly since 2000, studies examining PL brand equity are limited (Cuneo,
Lopez, & Jesus Yagüe, 2012).
4.1. Method
Data were collected through a structured questionnaire. A Spanish marketing research company distributed
the questionnaire which includes the measurement scales introduced by Yoo and Donthu (2001) and Nam et
al. (2011). The back translation method was employed to ensure accurate understanding of the scale items
in two languages. Quota sampling was employed to obtain a representative sample for the study. Two
hundred and thirty-six respondents participated in the survey in December 2014. At the beginning of the
questionnaire a list of 30 fashion and sportswear PLs is introduced. Respondents were asked to choose a
familiar PL brand from the list and then to rate the brand equity items.
Seventy-three precent of the respondents stated that they had purchased the selected brands within the last
12 months at once. Most of the respondents were female (53%) and received an annual income of between
6000 to 11,999 Euros (23%). The majority of the participants had undergraduate degree (24%). This is
followed by high school diploma (23%). The age-group distribution was somewhat similar between the age-
group categories: 15–24 (24%), 25–34 (19%), 35–44 (19%), 45–54 (16%), 55–64 (11%), and above 65
(11%).
4.2. Findings
Following Fornell and Larcker's (1981) suggestion, the Average Variance Extracted (AVE) scores are used for
testing the scales' discriminant validity. Composite Reliability (CR) tests and Cronbach's alpha statistic (α) are
used for assessing reliability of the scales. The AVEs, CR and α scores are shown in Table 4 and Table 5.
Table 4. Study 2: Yoo and Donthu's (2001) CBBE scale: descriptive statistics, reliability, correlations and AVEs.

Document1 11
Table 5. Study 2: Nam et al.'s CBBE scale and the brand awareness scale: descriptive statistics, reliability, correlations and AVEs.
As shown in Tables 4 and 5, the AVEs are all above 0.50 and higher than the squared inter-correlations,
indicating that discriminant validity of the measures is supported. Reliability is also achieved, since both the
CR and α scores are above the threshold of 0.70 (Malhotra, 2010). The fit statistics of the two structural
models are shown in Table 6 below.
Table 6. Study 2: structural model fit statistics.
As shown in Table 6, the model fit indices marginally support the validity of Yoo & Donthu's brand equity
model (Chi-square value: 98.92, df: 38, p < 0.001, GFI: 0.92, CFI: 0.96, NFI: 0.93, AGFI: 0.87, RMSEA: 0.08,
SRMR: 0.05, R2 for overall brand equity: 71%.) but fully support the validity of the extended model of Nam et
al. (Chi-square value: 349.86, df: 202, p < 0.001, GFI: 0.88, CFI: 0.96, NFI: 0.90, AGFI: 0.84, RMSEA: 0.06,
SRMR: 0.04, R2 for brand satisfaction and brand loyalty: 33% and 62%). Hence, Model 2 has better validity
than Model 1. The results of Yoo & Donthu's model testing suggest that only perceived quality (SPC = 0.20,
t = 3.00, p < 0.01) and brand loyalty (SPC = 0.69, t = 9.66, p < 0.001) are positively associated with overall
brand equity. The link between brand awareness and overall brand equity is not statistically significant
(SPC = 0.08, t = 1.14, p > 0.05).
The results of the extended model testing of Nam et al. support physical quality having a positive relationship
with brand satisfaction (SPC = 0.50, t = 5.05, p < 0.001). The relationship between brand identification and
brand satisfaction is also supported (SPC = 0.14, t = 1.91, p < 0.10; one tailed test). Furthermore, brand
satisfaction is positively associated with brand loyalty (SPC = 0.23, t = 2.90, p < 0.01). Results also show
that brand awareness (SPC = 0.41, t = 4.83, p < 0.001) and physical quality (SPC = 0.32, t = 3.61, p < 0.001)
have positive relationships with brand loyalty. Staff behavior, ideal self-congruence and lifestyle congruence
do not have a statistically significant influence on brand satisfaction and brand loyalty.

Document1 12
A bootstrapping analysis, using 5000 bootstrap samples, checks the mediation effect of the extended model
of Nam et al. Brand awareness's mean indirect effect is positive and not significant (a × b = 0.01, 95% CI
[− 0.01, 0.05]). C is significant (c = 0.36, p < 0.001), and therefore is direct-only non-mediation. Physical
quality's mean indirect effect is positive and significant (a × b = 0.10, 95% CI [0.03, 0.21]). Since c is
significant (c = 0.47, p < 0.001) and a × b × c is positive (0.05), the mediation is complementary mediation.
Staff behavior's mean indirect effect is positive and not significant (a × b = 0.01, 95% CI [− 0.01, 0.05]). C is
not significant (c = 0.05, p > 0.05), and therefore is no-effect non-mediation. Ideal self-congruence's mean
indirect effect is positive and not significant (a × b = 0.01, 95% CI [− 0.02, 0.03]). C is not significant
(c = 0.01, p > 0.05) and therefore is no-effect non-mediation. Brand identification's mean indirect effect is
positive and significant (a × b = 0.02, 95% CI [0.00, 0.05]). Since c is not significant (c = − 0.04, p > 0.05) the
mediation is indirect-only mediation. Lifestyle congruence's mean indirect effect is negative and not
significant (a × b = − 0.01, 95% CI [− 0.04, 0.02]). C is significant (c = 0.11, p < 0.05), and therefore is direct-
only non-mediation.
Based on the results above, brand satisfaction mediates physical quality's and brand identification's
relationships with brand loyalty. For physical quality, since the mediation is categorized as complementary
mediation, brand satisfaction partially mediates the relationship between physical quality and brand loyalty.
For brand identification, since the mediation is categorized as indirect-only mediation (Zhao et al., 2010),
brand satisfaction fully mediates the relationship between brand identification and brand loyalty.
5. Conclusions
Consumer-Based Brand Equity (CBBE) is an essential driver of customer equity. The majority of existing
CBBE research is based on Aaker's (1991) four-dimensional model: perceived quality, brand associations,
brand awareness and brand loyalty. This framework also influences many scale development studies (for
example, Buil et al., 2013; Pappu et al., 2005). Yoo and Donthu's (2001) measure, which is based on Aaker's
model, is widely used for assessing brand equity (Washburn & Plank, 2002; Washburn et al., 2000).
However, the applications of Aaker's CBBE model to services prompt questions as to whether the model is
suitable for service dominant brands. In order to address this deficiency, Nam et al. (2011) introduced an
alternative brand equity model for services which includes seven dimensions and different sets of
relationships among them: physical quality, staff behavior, ideal self-congruence, brand identification,
lifestyle congruence, brand satisfaction and brand loyalty.
Document1 13
The current study contributes to the existing body of knowledge through an investigation of the validity of
Yoo & Donthu's (2001) and Nam et al.'s (2011) CBBE scale in the retail industry and across different cultural
settings: Turkish and Spanish. Furthermore, the study assesses the external validity of the two prominent
brand equity measures. The external validity of a measure is important because it assesses the usefulness
and generalizability of the models in different social settings. The findings of the study demonstrate that
although both brand equity scales are valid in the retailing sector, Nam et al.'s scale displays better validity
than Yoo & Donthu's scale. Furthermore, the common-method variance analysis supports previous concerns
regarding Yoo & Donthu's scale, as some of its dimensions may not be distinct (Washburn & Plank, 2002;
Washburn et al., 2000).
This study suggests that physical quality and staff behavior are the key antecedents of brand satisfaction
and brand loyalty in the retail industry. Hence, these findings support Nam et al.'s (2011) brand equity
research in the UK hotel and restaurant industry. Although brand identification and lifestyle-congruence (two
symbolic consumption related brand equity dimensions) influence brand loyalty, the effect of ideal self-
congruence on brand loyalty is not statistically significant in the retail industry. This finding may have
occurred because the study brands are utility oriented (PL) and publicly consumed (fashion retail brands)
products. Hence brand identification, lifestyle-congruence and physical quality may have concealed the
effect of ideal self-congruence on brand satisfaction and brand loyalty. The two studies support the effect of
brand satisfaction on brand loyalty in the retail industry; this is in line with previous research (for example,
Ekinci et al., 2008; Nam et al., 2011).
Also this study advances understanding of the relationship between brand awareness, brand satisfaction and
brand loyalty in several ways. First, including brand awareness into Nam et al.'s model advances
understanding of CBBE in the retail industry. In particular, brand awareness is defined as a knowledge-
based entity rather than brand recognition. Hence, this study provides evidence for Keller's (2003) and
Aaker's (1996) definition of brand awareness suitable for established brands. Although, for new or niche
brands, recognition is important; for well-known brands, brand knowledge and brand opinion can be more
relevant. Second, the study findings suggest that brand awareness influences brand satisfaction and brand
loyalty. Therefore, brand knowledge is not only essential for assessing brand equity, but also an asset in
developing powerful brands. Third, this research is the first attempt to empirically examine whether brand
awareness advances the validity of Nam et al.'s (2011) model in the retail industry and across cultures. The
Document1 14
study findings suggest that brand awareness is a key component of brand equity and enhances the
predictive validity of Nam et al.'s model.
5.1. Managerial implications
This study introduces a valid and reliable scale for measuring brand equity in the retail industry. As a result,
brand managers can develop internal and external benchmarks using this measure. They can observe brand
performance from the customers' viewpoint and track the changes over time. The brand equity measure
enables managers to assess the strengths and weaknesses of their brands, and compares their brand's
performance with similar brands.
Retail managers should ensure that the tangible aspects of brands, such as store environment and
packaging, are visually appealing in order to enhance brand satisfaction and brand loyalty. As service
personnel interact with consumers on a daily basis, they are important in implementing brand strategy and
enhancing brand loyalty in the retail industry. In particular, retail managers should develop and implement
efficient recruitment policies to ensure that the quality of staff behavior is aligned with brand values. A
carefully designed training program will enhance the quality of staff behavior and subsequently the retail
brand equity.
This study's findings indicate that consumers develop brand loyalty because brand identification enhances or
express their social identity. Retail managers must ensure that consumers' brand experience provides high
social value in order to achieve consumers' interpersonal goals. Social value can be achieved through
fostering interactions between brand and consumer, and through brand oriented interactions among
consumers. In doing so, a number of approaches such as event marketing can be implemented, and social
brand communities can be formed (Kim, 2015; Park & Kim, 2015). Consumers are motivated to express their
distinctiveness through brand experiences and develop loyalty to brands. Furthermore, retail managers
should monitor current and potential consumers' lifestyles. Understanding consumers' brand expectations
and brand interests will inform management decisions on how to position brands in the marketplace, how to
achieve brand extensions and develop new brands. Finally, retail managers should continue to foster brand
awareness through a myriad of traditional and modern marketing communication methods including
advertising, sponsoring, merchandising, web design, social media, content marketing, and corporate social
marketing programs (Hoeffler & Keller, 2002).
Document1 15
5.2. Limitations
This study advances understanding of brand equity in the retail industry, and is not without limitations. The
most important of these limitations is the fact that the study is unable to draw causal relationships among the
variables from cross-sectional survey data. Future research may be able to test this conceptual framework
with alternative methodologies, such as experimental or longitudinal research design. Although this study
provides evidence about the validity of the extended model of Nam et al. in the retail industry, the results
cannot be generalized to the manufacturing industry, or other service industry sectors, for example financial
services, tourism, transportation, education, health. Future research should test the validity of this model with
goods dominant brands in different cultures. Finally, establishing the relationships between the model's
brand equity dimensions and business performance indicators, such as market share, profitability, return on
investment, will be a challenging but worthwhile effort for future research.

Document1 16
Appendix A. Study 1 measures of the Nam, Ekinci, Whyatt (NEW) brand equity model
Document1 17
References
Aaker, 1991 D.A. Aaker, Managing brand equity: capitalizing on the value of a brand name Free Press, New York, NY (1991)
Aaker, 1996 D.A. Aaker, Measuring brand equity across products and markets California Management Review, 38 (Spring) (1996), pp. 102-120
Anderson and Gerbing, 1988 J.C. Anderson, D.W. Gerbing, Structural equation modelling in practice: A review and recommended two-step approach, Psychological Bulletin, 103 (3) (1988), pp. 411-423
Boo et al., 2009 S. Boo, J. Busser, S. Baloglu, A model of customer-based brand equity and its application to multiple destinations, Tourism Management, 30 (2) (2009), pp. 219-231
Buil et al., 2013 I. Buil, E. Martinez, L.D. de Chernatony, The influence of brand equity on consumer responses Journal of Consumer Marketing, 30 (1) (2013), pp. 62-74
Champniss et al., 2015 G. Champniss, H.N. Wilson, E.K. Macdonald, Understanding your customers' social identities Harvard Business Review, 93 (1–2) (2015), pp. 88-96
Cobb-Walgren et al., 1995 C.J. Cobb-Walgren, C. Beal, N. Donthu, Brand equity, brand preferences, and purchase intent Journal of Advertising, 24 (3) (1995), pp. 25-40
Cuneo et al., 2012 A. Cuneo, P. Lopez, M. Jesus Yagüe, Measuring private labels brand equity: a consumer perspective, European Journal of Marketing, 46 (7/8) (2012), pp. 952-964
Das, 2015 G. Das, Linkages between self-congruity, brand familiarity, perceived quality and purchase intention: A study of fashion retail brands, Journal of Global Fashion Marketing, 6 (3) (2015), pp. 180-193
Del Rio et al., 2001 A.B. Del Rio, R. Vazquez, V. Iglesias, The effects of brand associations on consumer response Journal of Consumer Marketing, 18 (5) (2001), pp. 410-425
Ekinci et al., 2008 Y. Ekinci, P.L. Dawes, G.R. Massey, An extended model of the antecedents and consequences of consumer satisfaction for hospitality services, European Journal of Marketing, 42 (1) (2008), pp. 35-68
Fornell and Larcker, 1981 C. Fornell, D.F. Larcker, Evaluating structural equation models with unobservable variables and measurement error, Journal of Marketing Research, 27 (February) (1981), pp. 39-50
Foxall et al., 1998 G. Foxall, R. Goldsmith, S. Brown, Consumer psychology for marketing, International Thomson Business Press, London (1998)
Grönroos, 1984 C. Grönroos, A service quality model and its marketing implications, European Journal of Marketing, 8 (4) (1984), pp. 36-44
Document1 18
Hair et al., 2010 J.F. Hair Jr., W.C. Black, B.J. Babin, R.E. Anderson, Multivariate data analysis: A global perspectives, (7th ed.), Pearson Education Inc., New Jersey (2010)
Hoeffler and Keller, 2002 S. Hoeffler, K.L. Keller, Building brand equity through corporate social marketing Journal of Public Policy & Marketing, 21 (1) (2002), pp. 78-89
Im et al., 2012 H. Im, S. Kim, S. Elliot, H. Han, Conceptualizing destination brand equity dimensions from a consumer-based brand equity perspective, Journal of Travel & Tourism Marketing, 29 (4) (2012), pp. 385-403
Jung and Sung, 2008 J. Jung, E.Y. Sung, Consumer-based brand equity; comparisons among Americans and South Koreans in the USA and South Koreans in Korea, Journal of Fashion Marketing and Management, 12 (1) (2008), pp. 24-35
Keller, 1993 K.L. Keller, Conceptualizing, measuring, and managing customer-based brand equity Journal of Marketing, 57 (January) (1993), pp. 1-22
Keller, 2003 K.L. Keller, Strategic brand management, (2nd ed.), Prentice Hall, Upper Saddle River, NJ (2003)
Kim and Brandon, 2010 E.Y. Kim, L. Brandon, Modeling brand equity for lifestyle brand extensions: A strategic approach into Generation Y vs. Baby Boomer, Journal of Global Academy of Marketing Science, 20 (1) (2010), pp. 35-48
Kim et al., 2003 H. Kim, W.G. Kim, J.A. An, The effect of consumer-based brand equity on firms' financial performance, Journal of Consumer Marketing, 20 (4) (2003), pp. 335-351
Kim, 2015 J. Kim, Sustainability in social brand communities: influences on customer equity Journal of Global Scholars of Marketing Science, 25 (3) (2015), pp. 246-258
Kim et al., 2014 K. Kim, E. Ko, M. Lee, P. Mattila, K.H. Kim, Fashion collaboration effects on consumer response and customer equity in global luxury and SPA brand marketing, Journal of Global Scholars of Marketing Science, 24 (3) (2014), pp. 350-364
Koo and Kang, 2004 D.M. Koo, M.J. Kang, Managing store images by discount retailers in Korea, Journal of Global Academy of Marketing Science, 14 (1) (2004), pp. 145-169
Lassar et al., 1995 W. Lassar, B. Mittal, A. Sharma, Measuring customer-based brand equity, Journal of Consumer Marketing, 12 (4) (1995), pp. 11-19
Lee and Back, 2010 J.S. Lee, K.J. Back, Re-examination of attendee-based brand equity, Tourism Management, 31 (2010), pp. 395-401
Long and Shiffman, 2000
M.M. Long, L.G. Shiffman, Consumption values and relationships: Segmenting the market for frequency programs, Journal of Consumer Marketing, 17 (3) (2000), pp. 214-232
Maio Mackay, 2001 M. Maio Mackay, Evaluation of brand equity measures: Further empirical results, Journal of Product and Brand Management, 10 (1) (2001), pp. 38-51
Document1 19
Malhotra, 2010 N.K. Malhotra, Marketing research: An applied orientation, (6th ed.), Pearson Education, London (2010)
Moon et al., 2010 B.J. Moon, W. Park, S.C. Choi, Relationships among brand equity components: An exploratory study of the moderating role of product type Journal of Global Academy of Marketing Science., 20 (1) (2010), pp. 98-108
Nam et al., 2011 J. Nam, Y. Ekinci, G. Whyatt, Brand equity, brand loyalty and consumer satisfaction Annals of Tourism Research, 38 (3) (2011), pp. 1009-1030
Pappu et al., 2005 R. Pappu, G.P. Quester, W.R. Cooksey, Consumer-based brand equity: Improving the measurement empirical evidence The Journal of Product & Brand Management, 14 (2/3) (2005), pp. 143-154
Park and Kim, 2015 H. Park, Y.K. Kim, Can a fashion brand be social?: The role of benefits of brand community within social network sites Journal of Global Fashion Marketing, 6 (2) (2015), pp. 75-86
Pauwels and Srinivasan, 2004 K. Pauwels, S. Srinivasan, Who benefits from store brand entry? Marketing Science, 23 (3) (2004), pp. 364-390
Phau et al., 2015 I. Phau, M. Teah, A. Lim, R. Ho, brief affair with underwear: Uniqueness and innovativeness in male underwear brand purchases Journal of Global Fashion Marketing, 6 (3) (2015), pp. 222-235
Podsakoff et al., 2003 P.M. Podsakoff, S.B. MacKenzie, J.Y. Lee, N.P. PodsakoffCommon method biases in behavioral research: A critical review of the literature and recommended remedies, Journal of Applied Psychology, 88 (5) (2003), pp. 879-903
Preacher and Hayes, 2008 K.J. Preacher, A.F. Hayes, Asymptotic and resampling strategies for assessing and comparing indirect effects in multiple mediator models, Behavior Research Methods, 40 (3) (2008), pp. 879-891
Punj and Hillyer, 2004 G.N. Punj, C.L. Hillyer, A cognitive model of customer-based brand equity for frequently purchased products: Conceptual framework and empirical results, Journal of Consumer Psychology, 14 (1/2) (2004), pp. 124-131
Reed et al., 2012 A. Reed, M.R. Forehand, S. Puntoni, L. Warlop, Identity-based consumer behaviour International Journal of Research in Marketing, 29 (4) (2012), pp. 310-321
Sirgy, 1982 M.J. Sirgy, Self-concept in consumer behavior: A critical review Journal of Consumer Research, 9 (1982), pp. 287-300
Solomon, 2002 M.R. Solomon, Consumer behavior: Buying, having, and being Prentice Hall, New Jersey (2002)
Sun et al., 2014 Y. Sun, K.H. Kim, J. Kim, Examining relationships among sustainable orientation, perceived sustainable marketing performance, and customer equity in fast fashion industry
Document1 20
Journal of Global Fashion Marketing, 5 (1) (2014), pp. 74-86
Tong and Hawley, 2009 X. Tong, J.M. Hawley, Measuring customer-based brand equity: Empirical evidence from the sportswear market in China, Journal of Product and Brand Management, 18 (4) (2009), pp. 262-271
Washburn and Plank, 2002 J. Washburn, R. Plank, Measuring brand equity: An evaluation of a consumer-based brand equity scale, Journal of Marketing Theory and Practice, 17 (6) (2002), pp. 46-61
Washburn et al., 2000 J.H. Washburn, D.T. Brian, R. Priluck, Co-branding: Brand equity and trial effects Journal of Consumer Marketing, 17 (7) (2000), pp. 591-604
Xu and Chan, 2010 J.B. Xu, A. Chan, A conceptual framework of hotel experience and customer‐based brand equity: Some research questions and implications, International Journal of Contemporary Hospitality Management, 2 (2) (2010), pp. 174-193
Yoo and Donthu, 2001 B. Yoo, N. Donthu, Developing and validating a multidimensional consumer-based brand equity scale, Journal of Business Research, 52 (1) (2001), pp. 1-14
Zeithaml, 1988 V. Zeithaml, Consumer perceptions of price, quality, and value: A means-end model and synthesis of the evidence, Journal of Marketing, 52 (3) (1988), pp. 2-22
Zhang et al., 2010 H. Zhang, E. Ko, K.H. Kim, The influences of customer equity drivers on customer equity and loyalty in the sports shoe industry: Comparing Korea and China, Journal of Global Fashion Marketing, 1 (2) (2010), pp. 110-118
Zhao et al., 2010 X. Zhao, J.G. Lynch, Q. Chen, Reconsidering Baron and Kenny: Myths and truths about mediation analysis, Journal of Consumer Research, 37 (2) (2010), pp. 197-206