A CRADLE-TO-GATE STUDY OF GHG EMISSIONS FROM THE...
10
120 A CRADLE-TO-GATE STUDY OF GHG EMISSIONS FROM THE TRANSPORTATION OF PALM OIL, PALM OLEIN AND PALM STEARIN USING THE LIFE CYCLE ASSESSMENT APPROACH FAUZIAH ARSHAD*; YEW AI TAN** and SUMIANI YUSOFF ǂ ABSTRACT This life cycle assessment (LCA) is a cradle-to-gate study of energy consumption and greenhouse gas (GHG) emissions in transportation of palm oil, palm olein and palm stearin along the palm oil supply chain. This includes the transportation of the oil palm pollinated bunches from the ‘mother palm’ to the seed laboratories, the germinated seeds to the nurseries, seedlings from nurseries to oil palm plantations, fresh fruit bunches (FFB) from plantations to mills, crude palm oil (CPO) from mills to refineries and refined, bleached and deodorised (RBD) palm oil (RBO PO) and its fractionated products namely RBD palm olein (RBD POo) and RBD palm stearin (RBO POs) from refineries/fractionation plants to ports and retailers. The objective of this study is to use the LCA approach to identify at which stage of the palm oil supply chain that transportation contributes the most to the environmental performance in terms of GHG emissions within the boundary of the study. The analysis of the LCI data for determining overall GHG emissions for the transportation along the oil palm supply chain, on the basis of the production of 1 t of the RBD PO, indicated that the transportation of FFB from plantation to mill and transportation of CPO from mill to refinery gave the highest GHG emissions. Based on the production of 1 t of the RBD PO, the GHG emissions during the transportation of FFB from plantation to mill and the transportation of CPO from mill to refinery were 21.94 kg CO 2 eq. and 20.86 kg CO 2 eq., respectively. Keywords: Life Cycle Assessment, greenhouse gas (GHG), transportation, palm oil, palm olein, palm stearin. Date received: 18 July 2016; Sent for revision: 20 July 2016; Received in final form: 7 October 2016; Accepted: 18 November 2016. * Malaysian Palm Oil Board, 6 Persiaran Institusi, Bandar Baru Bangi, 43000 Kajang, Selangor, Malaysia. E-mail: [email protected] ** 15 Jalan Serai Wangi, Taman Cheras, 56100 Kuala Lumpur, Malaysia. ǂ Department of Civil Engineering, Universiti Malaya, 50603 Kuala Lumpur, Malaysia. INTRODUCTION Palm oil is currently the leading edible oil traded in the world market among the 17 major oils and fats (Oil World Annual, 2015). Palm oil and palm oil products have gained worldwide market acceptance and are widely used as food products, non-foods and oleochemicals, and also as biofuels. Malaysia is one of the world’s largest producers and exporters of palm oil, second to Indonesia (Oil World Annual, 2015). In 2015, Malaysia produced 19.96 million tonnes of crude palm oil (CPO) from a total planted area of 5.64 million hectares (MPOB, 2016). Malaysia is located within 10° latitude of the equator which is suitable for oil palm cultivation. This has made it possible for Malaysia to emerge as one of the major world producers of palm oil (Yusof and Chan, 2004). While palm oil contributes significantly to the world’s demand for oils and fats, the Malaysian DOI: https://doi.org/10.21894/jopr.2017.2901.13 Journal of Oil Palm Research Vol. 29 (1) March 2017 p. 120 – 129
Transcript of A CRADLE-TO-GATE STUDY OF GHG EMISSIONS FROM THE...

JOURNAL OF OIL PALM RESEARCH 29 (1) (MARCH 2017)
120
A CRADLE-TO-GATE STUDY OF GHG EMISSIONS FROM THE TRANSPORTATION
OF PALM OIL, PALM OLEIN AND PALM STEARIN USING THE LIFE CYCLE ASSESSMENT
APPROACH
FAUZIAH ARSHAD*; YEW AI TAN** and SUMIANI YUSOFFǂ
ABSTRACTThis life cycle assessment (LCA) is a cradle-to-gate study of energy consumption and greenhouse gas (GHG) emissions in transportation of palm oil, palm olein and palm stearin along the palm oil supply chain. This includes the transportation of the oil palm pollinated bunches from the ‘mother palm’ to the seed laboratories, the germinated seeds to the nurseries, seedlings from nurseries to oil palm plantations, fresh fruit bunches (FFB) from plantations to mills, crude palm oil (CPO) from mills to refineries and refined, bleached and deodorised (RBD) palm oil (RBO PO) and its fractionated products namely RBD palm olein (RBD POo) and RBD palm stearin (RBO POs) from refineries/fractionation plants to ports and retailers. The objective of this study is to use the LCA approach to identify at which stage of the palm oil supply chain that transportation contributes the most to the environmental performance in terms of GHG emissions within the boundary of the study. The analysis of the LCI data for determining overall GHG emissions for the transportation along the oil palm supply chain, on the basis of the production of 1 t of the RBD PO, indicated that the transportation of FFB from plantation to mill and transportation of CPO from mill to refinery gave the highest GHG emissions. Based on the production of 1 t of the RBD PO, the GHG emissions during the transportation of FFB from plantation to mill and the transportation of CPO from mill to refinery were 21.94 kg CO2 eq. and 20.86 kg CO2 eq., respectively.
Keywords: Life Cycle Assessment, greenhouse gas (GHG), transportation, palm oil, palm olein, palm stearin.
Date received: 18 July 2016; Sent for revision: 20 July 2016; Received in final form: 7 October 2016; Accepted: 18 November 2016.
* Malaysian Palm Oil Board, 6 Persiaran Institusi, Bandar Baru Bangi, 43000 Kajang, Selangor, Malaysia. E-mail: [email protected]** 15 Jalan Serai Wangi, Taman Cheras, 56100 Kuala Lumpur, Malaysia.ǂ Department of Civil Engineering, Universiti Malaya, 50603
Kuala Lumpur, Malaysia.
Journal of Oil Palm Research Vol. 29 (1) March 2017 p. 120 – 129
INTRODUCTION
Palm oil is currently the leading edible oil traded in the world market among the 17 major oils and fats (Oil World Annual, 2015). Palm oil and palm oil products have gained worldwide market acceptance
and are widely used as food products, non-foods and oleochemicals, and also as biofuels. Malaysia is one of the world’s largest producers and exporters of palm oil, second to Indonesia (Oil World Annual, 2015). In 2015, Malaysia produced 19.96 million tonnes of crude palm oil (CPO) from a total planted area of 5.64 million hectares (MPOB, 2016). Malaysia is located within 10° latitude of the equator which is suitable for oil palm cultivation. This has made it possible for Malaysia to emerge as one of the major world producers of palm oil (Yusof and Chan, 2004).
While palm oil contributes significantly to the world’s demand for oils and fats, the Malaysian
DOI: https://doi.org/10.21894/jopr.2017.2901.13JOURNAL OF OIL PALM RESEARCH 29 (1) (MARCH 2017)
120
A CRADLE-TO-GATE STUDY OF GHG EMISSIONS FROM THE TRANSPORTATION
OF PALM OIL, PALM OLEIN AND PALM STEARIN USING THE LIFE CYCLE ASSESSMENT
APPROACH
FAUZIAH ARSHAD*; YEW AI TAN** and SUMIANI YUSOFFǂ
ABSTRACTThis life cycle assessment (LCA) is a cradle-to-gate study of energy consumption and greenhouse gas (GHG) emissions in transportation of palm oil, palm olein and palm stearin along the palm oil supply chain. This includes the transportation of the oil palm pollinated bunches from the ‘mother palm’ to the seed laboratories, the germinated seeds to the nurseries, seedlings from nurseries to oil palm plantations, fresh fruit bunches (FFB) from plantations to mills, crude palm oil (CPO) from mills to refineries and refined, bleached and deodorised (RBD) palm oil (RBO PO) and its fractionated products namely RBD palm olein (RBD POo) and RBD palm stearin (RBO POs) from refineries/fractionation plants to ports and retailers. The objective of this study is to use the LCA approach to identify at which stage of the palm oil supply chain that transportation contributes the most to the environmental performance in terms of GHG emissions within the boundary of the study. The analysis of the LCI data for determining overall GHG emissions for the transportation along the oil palm supply chain, on the basis of the production of 1 t of the RBD PO, indicated that the transportation of FFB from plantation to mill and transportation of CPO from mill to refinery gave the highest GHG emissions. Based on the production of 1 t of the RBD PO, the GHG emissions during the transportation of FFB from plantation to mill and the transportation of CPO from mill to refinery were 21.94 kg CO2 eq. and 20.86 kg CO2 eq., respectively.
Keywords: Life Cycle Assessment, greenhouse gas (GHG), transportation, palm oil, palm olein, palm stearin.
Date received: 18 July 2016; Sent for revision: 20 July 2016; Received in final form: 7 October 2016; Accepted: 18 November 2016.
* Malaysian Palm Oil Board, 6 Persiaran Institusi, Bandar Baru Bangi, 43000 Kajang, Selangor, Malaysia. E-mail: [email protected]** 15 Jalan Serai Wangi, Taman Cheras, 56100 Kuala Lumpur, Malaysia.ǂ Department of Civil Engineering, Universiti Malaya, 50603
Kuala Lumpur, Malaysia.
Journal of Oil Palm Research Vol. 29 (1) March 2017 p. 120 – 129
INTRODUCTION
Palm oil is currently the leading edible oil traded in the world market among the 17 major oils and fats (Oil World Annual, 2015). Palm oil and palm oil products have gained worldwide market acceptance
and are widely used as food products, non-foods and oleochemicals, and also as biofuels. Malaysia is one of the world’s largest producers and exporters of palm oil, second to Indonesia (Oil World Annual, 2015). In 2015, Malaysia produced 19.96 million tonnes of crude palm oil (CPO) from a total planted area of 5.64 million hectares (MPOB, 2016). Malaysia is located within 10° latitude of the equator which is suitable for oil palm cultivation. This has made it possible for Malaysia to emerge as one of the major world producers of palm oil (Yusof and Chan, 2004).
While palm oil contributes significantly to the world’s demand for oils and fats, the Malaysian

121
A CRADLE-TO-GATE STUDY OF GHG EMISSIONS FROM THE TRANSPORTATION OF PALM OIL, PALM OLEIN AND PALM STEARIN USING THE LIFE CYCLE ASSESSMENT APPROACH
oil palm industry faces many challenges which has to be overcome to remain competitive in the world market. Sustainable production is one of the challenges facing the world today where concerns on global warming and climate change continue to be discussed at international fora. The Kyoto Protocol under the United Nation Framework Convention on Climate Change (UNFCCC), adopted in 1997 is a major step forward in tackling the problem of global warming. The Protocol requires developed countries to reduce greenhouse gas (GHG) emissions by at least 5% against the baseline of 1990. Subsequently, the Doha Amendment to the Kyoto Protocol adopted in 2012 requires developed countries to reduce GHG emissions to at least 18% against the baseline of 1990 (UNFCCC, 2014). Malaysia, as a developing country is not required to reduce its GHG emissions under the Kyoto Protocol. However, at the United Nations Climate Change Conference in 2009 in Copenhagen, the Prime Minister of Malaysia has announced to voluntarily reduce its GHG emissions by 40% in terms of emissions intensity of gross domestic product (GDP) by the year 2020 compared to 2005 levels (Bernama, 2009). In this context, the Malaysian oil palm industry can offer many opportunities for the country to help reduce GHG emissions and contribute to slowing down climate change. One way for the industry to reduce GHG emissions is by reducing fossil fuel consumption thereby resulting in the reduction in carbon dioxide (CO2), nitrous oxide (N2O) and carbon monoxide (CO) emissions from transportation.
Life Cycle Assessment (LCA) is a methodology that is being used to assess the environmental aspects of a product over its life cycle (Goedkoop et al., 2007). LCA studies with regards to oil palm have been conducted previously by earlier researchers. Yusoff and Hansen (2007) had performed a feasibility study on CPO production in Malaysia using the LCA approach. The screening LCA study demonstrated that LCA could be used as a decision tool by the Malaysian oil palm industry to evaluate processes that could impact the environment particularly the processes that emitted CO2 to the environment such as transportation. The researchers from the Malaysian Palm Oil Board have also conducted LCA studies on the production of palm oil along the supply chain including biodiesel (Halimah et al., 2010; Puah et al., 2010; Tan et al., 2010; Vijaya et al., 2010; Zulkifli et al., 2010). The LCA study of the Malaysian oil palm products from mineral soils and including biodiesel was conducted with the objective to develop baseline information on the environmental performance of the oil palm industry (Choo et al., 2011). More recently, Halimah et al. (2014) conducted an LCA study on the production of oil palm seeds to link the data to the earlier LCA study which started from the LCA of oil palm seedlings
to the production of palm biodiesel to complete the supply chain.
Within the oil palm supply chain, the transportation incurred can be divided into four stages as follows:
1. Nursery. The nursery is to provide planting materials of the highest quality for field planting. This is vital for crop such as the oil palm which will have a life span of at least 25 years. Transportation starts from the transport of the pollinated fruit bunches obtained from ‘mother palms’ grown in selected oil palm plantations to the seed laboratory to produce the germinated seeds. The oil palm has three main fruit types – dura, pisifera and tenera, differentiated by their shell thickness. The ‘mother palm’ is the oil palm from the dura type. Pisifera is female sterile, i.e. it does not produce fruit bunches. It is used instead as the male parents to provide the pollens in the cross between the dura and pisifera. Crossing between the dura and pisifera produces the tenera (dura x pisifera or DxP) seeds which has a thicker oil-bearing mesocarp compared to the dura. Since 1960, all commercial planting in Malaysia has been the tenera planting materials (Kushairi and Rajanaidu, 2000). Transportation then continues from the seed laboratory which produce the germinated seeds to the nursery when the germinated seeds are transported to the nursery to be planted as oil palm seedlings. Ten to 12 months later, the seedlings are transported from the nursery to the oil palm plantations. In this study, the transportation of the pollinated bunches from ‘mother palms’ up to the transport of the seedlings to the plantation is referred to as the nursery stage.
2. Plantation. Good quality seedlings of around 12 months are then transported to the plantations for field planting. The oil palm starts bearing fruits two and a half to three years after field planting. Transportation of the fresh fruit bunches (FFB) to mills is normally by lorry or tractors with tippers if the mills are nearby. In plantations with flat terrain, FFB are also transported by a rail system using cages.
3. Palm oil mill. The CPO) is extracted at the mill. The palm kernels (PK) which are obtained from the nuts of the fruits are important co-product of the palm oil mills. Palm oil mills are strategically located usually at the centre of the plantations (Sivasothy, 2000). CPO is transported from palm oil mills to palm oil refineries in road tankers having capacities ranging from 17-35 t.
4. Palm oil refinery. Most of the refineries are located close to ports to facilitate exports. These refineries have facilities to refine and fractionate CPO to produce palm olein and palm stearin. The refined products are then transported to the ports either

JOURNAL OF OIL PALM RESEARCH 29 (1) (MARCH 2017)
122
by road tankers or by pipelines linking refineries directly to ports for export. Some palm oil products are also transported to packers and retailers for local consumption, e.g. palm olein as cooking oil or to manufacturers for further processing to other products. In this study, transportation from the refinery to the fractionation plants was not considered as the latter is located adjacent to the refining plant.
This article presents the improvement options that may be considered by the Malaysian oil palm industry to mitigate the GHG emissions contributed by the transportation sector by studying current practices and GHG emissions arising from transportation along the palm oil supply chain using the LCA approach. The investigation focused on the transport of the pollinated bunches from the ‘mother palm’ to the seed laboratory to produce the germinated seeds, the germinated seeds to the nurseries, seedlings from nurseries to oil palm plantations, FFB from plantation to mills, CPO from mills to refineries and the refined, bleached, deodorised (RBD) palm oil (RBO PO) and its fractionated products namely RBD palm olein (RBD POo) and RBD palm stearin (RBD POs) from refineries/fractionation plants to ports and retailers.
METHODOLOGY
The Life Cycle Inventory (LCI) for transportation includes the energy requirements and the emissions generated (US EPA, 1993). This study determines the LCI of the transportation of the RBD PO, RBD POo and RBD POs along the palm oil supply chain within the system boundary by compiling and evaluating the input (energy resources) and the output (combustion emissions). This study was carried out following the principles and requirements as stipulated in the ISO International Standards, namely, the ISO 14040:2006-Environmental Management - Life Cycle Assessment - Principles and Framework and the ISO 14044:2006 - Environmental Management - Life Cycle Assessment - Requirements and Guidelines (ISO, 2006).
Scope Definition/System Boundary
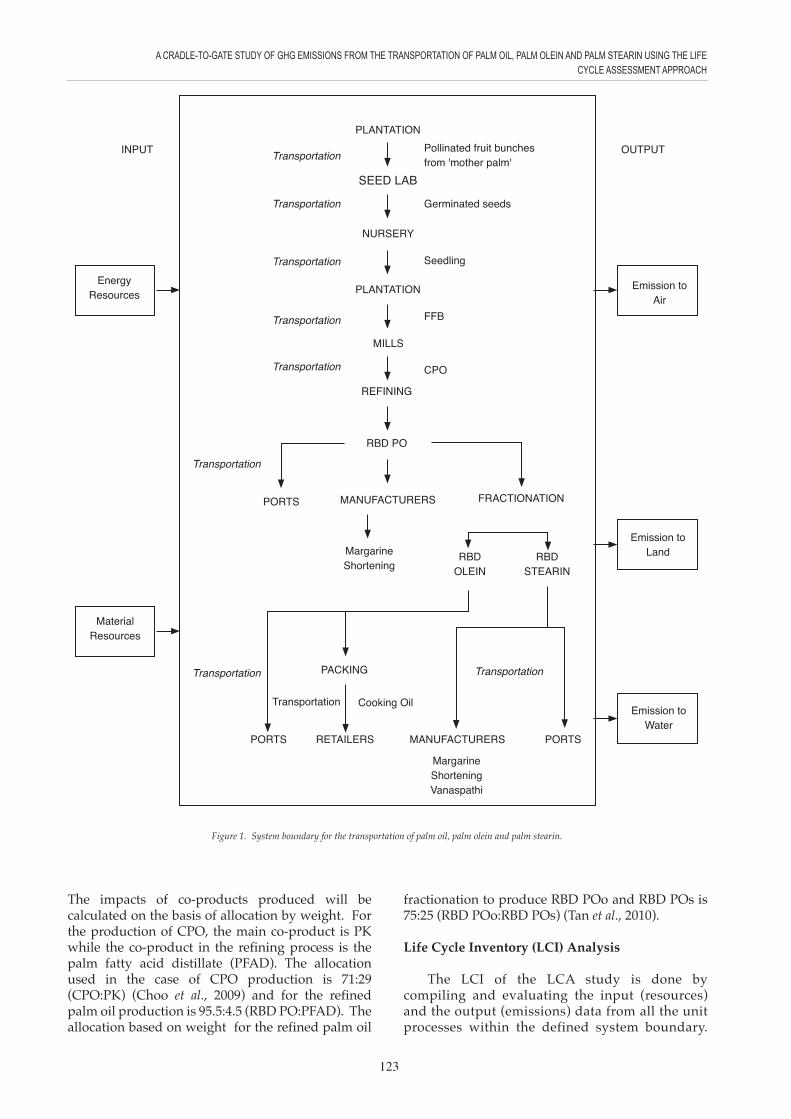
The system boundary of this cradle-to-gate study on the transportation (Figure 1) of the oil palm pollinated bunches from the ‘mother palm’ to the seed producers, the germinated seeds to the nurseries, seedlings from nurseries to oil palm plantations, FFB from plantations to mills, CPO from mills to refineries and RBD PO, RBD POo and RBD POs to ports and retailers.
Exclusion
The transportation included in the system boundary is taken at the point of exit from one stage of the product system to the next stage along the palm oil supply chain while other transportation occurred in the production of the product within the product system is not included in the study, i.e. the transportation during in-field collection of the FFB is considered part of the operation in the production of the FFB within the plantation and is not included. The transportation of pesticides and fertilisers in the nursery and plantations are also not included in the study. Halimah et al. (2010) in her study on the LCA of oil palm seedling production have shown that the transportation of pesticides and fertilisers were minimal. Tan et al. (2010) studied the LCA of refined palm oil production and fractionation and it was demonstrated that the transportation of spent bleaching earth from the refinery to the landfill was only 15 km in 16-t trucks and thus, their transport to landfills were also minimal. The transportation of other chemicals used in the refinery is also not included as it was shown that the contribution from the transportation of bleaching earth and spent bleaching earth and other chemicals were minor in comparison to the activities at the upstream, i.e. from the FFB and CPO production.
The production of capital goods such as machinery, buildings, vehicles manufacturing, vehicles maintenance and disposals, transport infrastructure and waste treatment were also excluded.
Functional Unit
The functional unit is to provide a reference to which the inputs and outputs are related. The reference is necessary to ensure comparability of LCA results. Comparability of LCA results is critical when different systems are assessed, to ensure that comparisons are made on a common basis (Goedkoop et al., 2007). In the study, the functional units for the various products at the different stages along the palm oil supply chain are as follows: pollinated fruit bunches: kgkm; seed: seedkm; seedling: seedlingkm; FFB: tkm; CPO: tkm; RBD palm oil: tkm; RBD palm olein: tkm and RBD palm stearin: tkm. 1 kgkm is defined as the transport of 1 kg of the pollinated fruit bunches over 1 km and 1 tkm is defined as the transport of 1 t of the relevant palm product over 1 km while one seedkm and one seedlingkm are defined as the transport of one unit of the seed and seedling over 1 km, respectively (Spielmann et al., 2004).
Allocation of Co-products
In cases where a system yields more than one product, allocation must be made for the product.
123
A CRADLE-TO-GATE STUDY OF GHG EMISSIONS FROM THE TRANSPORTATION OF PALM OIL, PALM OLEIN AND PALM STEARIN USING THE LIFE CYCLE ASSESSMENT APPROACH
Figure 1. System boundary for the transportation of palm oil, palm olein and palm stearin.
The impacts of co-products produced will be calculated on the basis of allocation by weight. For the production of CPO, the main co-product is PK while the co-product in the refining process is the palm fatty acid distillate (PFAD). The allocation used in the case of CPO production is 71:29 (CPO:PK) (Choo et al., 2009) and for the refined palm oil production is 95.5:4.5 (RBD PO:PFAD). The allocation based on weight for the refined palm oil
fractionation to produce RBD POo and RBD POs is 75:25 (RBD POo:RBD POs) (Tan et al., 2010).
Life Cycle Inventory (LCI) Analysis
The LCI of the LCA study is done by compiling and evaluating the input (resources) and the output (emissions) data from all the unit processes within the defined system boundary.
INPUT OUTPUT
EnergyResources
Emission toAir
Emission toLand
Margarine ShorteningVanaspathi
PORTS
FRACTIONATION
PACKING
RBDSTEARIN
RBDOLEIN
RBD PO
MILLS
PLANTATION
NURSERY
SEED LAB
PLANTATION
REFINING
PORTS RETAILERS
PORTS
MANUFACTURERS
MANUFACTURERS
Transportation
Transportation Transportation
Transportation Cooking Oil
MargarineShortening
CPO
FFB
Seedling
Germinated seeds
Pollinated fruit bunchesfrom 'mother palm'
Transportation
Transportation
Transportation
Transportation
Transportation
Emission toWater
MaterialResources
JOURNAL OF OIL PALM RESEARCH 29 (1) (MARCH 2017)
124
In this respect, the data collection includes input data on the energy and raw materials used and the gas emissions released from the transportation process as the output data. The data collection in the LCI phase is a resource-intensive process of the LCA study as well as time-consuming. Data collection in LCA studies were divided into two types, i.e. foreground data, which was site-specific data required that was obtained through questionnaires or actual on-site measurements and recordings. The background data on the other hand was data taken from literature and databases (Goedkoop et al., 2007).
The data for the tonnage of products transported as well as the kilometric distance of the journey for the GHG emission calculations in the study were based on site-specific data obtained from questionnaires sent to oil palm nursery managers, oil palm plantation managers, palm oil millers and palm oil refiners who transport the palm oil products concerned to the exporters and retailers across the Peninsular, Sabah and Sarawak. The representativeness of the inventory data was assured by sampling data from different regions in Malaysia (geographical coverage); covering different sizes: estates (example plantations with more than 1000 ha) and smallholders (less than 40 ha); processing tonnage; different management and ownership: covering privately owned companies, government and state schemes; and all the different types of transportation mode.
Validation of the data was made through verification visits and on-site interviews and other forms of communication, i.e. e-mails,
telephones and faxes. The values of the oil palm characteristics in the various stages of the palm oil supply chain used in the study are shown in Table 1.
RESULTS AND DISCUSSION
Table 2 shows the overall GHG emissions during the transportation process at each stage along the palm oil supply chain from the pollinated fruit bunches from ‘mother palm’ to the refined products based on the respective functional unit for each stage of the supply chain. These emissions are averaged values calculated from data from eight nurseries, 113 plantations, 41 mills and nine refineries. The classification of vehicles according to that used by Switzerland was used in the study, i.e. vehicle classes < 3.5 t (allocated gross vehicle weight range of < 3.5 t); vehicle 16 t (3.5-20 t); vehicle 28 t (>20-28 t) and vehicle 40 t (>28-40 t) (Speilmann et al., 2004). This classification was adopted as the classification of motor vehicles in Malaysia under Sections 5 (1) (c) and (d) of the Road Transport Act 1987 was too broad, i.e. motor vehicles carrying a load with the unladen weight (empty weight of vehicles) of more than 5 t or less than 5 t, respectively (KKR, 2007).
The amount of materials used were derived from the values as stipulated in Table 1, i.e. the average number of seeds in a fruit bunch and the percentage of seed germination were taken into account in the consideration for the amount of the pollinated fruit bunch from ‘mother palm’ to produce one germinated seed, while the amount to produce one seedling took into account the percentage of culling done at the nurseries to discard poor quality seedlings (Corley and Tinker, 2016). The FFB yield, the palm density (number of palms planted in 1 ha) and the palm lifetime (25 years before replanting) were used to consider the amount of seedling needed to produce 1 t of the FFB. The amount of FFB used in the production of 1 t CPO was lower at 3.61 (i.e. 5 t FFB is normally processed to produce 1 t CPO) to take into account the allocation by weight for the production of PK, a co-product in CPO production (Choo et al., 2009) while 1.05 t of the CPO was consumed in the production of the refined palm oil to take into account the allocation by weight for the production of PFAD which is a co-product of CPO processing to produce the refined palm oil (Tan et al., 2010). For the refined products, it was also noted that 1.29 t and 4.62 t of RBD PO were needed for the production of 1 t RBD POo and RBD POs, respectively (Tan et al., 2009). However, in the study, the emission for the RBD POo and the RBD POs was based on the production of 1 t RBD PO in view that the refined POo and POs were transported from the same location and using similar vehicles as the refined palm oil.
TABLE 1. THE OIL PALM CHARACTERISTICS USED IN THE STUDY
Note: FFB - fresh fruit bunches. CPO - crude palm oil. PO - palm oil. RBD - refined, bleached and deodorised. POo - palm olein. POs - palm stearin.
Average plantation area (ha) 1 495.82Average weight of fruit bunch (kg) 20Average No. of fruits in a bunch 1 500Germination of seeds (%) 85Weight of germinated seeds with box (2500 seeds/box) (kg) 11Culling of seedlings (%) 25Average weight of a 12-month old seedling (kg) 20FFB yield (t ha yr-1) 21.51Palm per ha 142Palm lifetime (yr) 25FFB to produce 1 t CPO (t) 3.61CPO to produce 1 t RBD PO (t) 1.05RBD PO to produce 1 t RBD POo (t) 1.29RBD PO to produce 1 t RBD POs (t) 4.62

125
A CRADLE-TO-GATE STUDY OF GHG EMISSIONS FROM THE TRANSPORTATION OF PALM OIL, PALM OLEIN AND PALM STEARIN USING THE LIFE CYCLE ASSESSMENT APPROACH
The GHG emissions were calculated based on the exhaust emission factors (g vkm-1) for an average (50%) load factor for light-duty vehicle (transport vehicle < 3.5 t) and exhaust emission factors (g tkm-1) for an average 50% load factor for the heavy duty vehicles (vehicle 16 t, 28 t and 40 t) sourced from the Ecoinvent database (data v1.1) (Speilmann et al., 2004). The values in vehicle kilometre (vkm) for the emission factors were converted to tkm values by dividing the vkm values with the average load factor (Frischknecht, 2010). For this transportation study, the load was considered full load capacity on its outward journey and the return trips was empty, therefore a load factor of 0.5 (50%) was given (Speilmann et al., 2004). The CO2 eq. values were the total of the emission gases for methane (CH4), carbon dioxide (CO2) and nitrous oxide (N2O). The conversion factor to CO2 eq. was based on IPCC
2006: 1 kg of CH4 is equivalent to 23 kg CO2, 1 kg of N2O is equivalent to 296 kg CO2 (IPCC, 2006). The emission factor in the Malaysian Database produced by SIRIM Bhd is 0.69 kg CO2/kWhr electricity (Mohd Nazri Ahmad, 2009).
During the study, it was found that the transportation involved was mostly road transport, where the fuel used was petroleum diesel. However, pipelines were also used to transport the RBD PO, RBD POo and the RBD POs from some of the refineries to the ports, while for the transportation of some of the seeds to the nursery, the train was also used as one of the modes of transportation. This was combined with road transportation to transport the seeds from the seed producer to the railway station and from the railway station to the nursery. It was also found that transport vehicles of < 3.5 t were used only during the transportation of
TABLE 2. GREENHOUSE GAS (GHG) EMISSIONS FOR THE TRANSPORTATION OF THE POLLINATED FRUIT BUNCHES FROM ‘MOTHER PALM’, GERMINATED SEEDS, SEEDLINGS, FRESH FRUIT BUNCHES (FFB) AND REFINED, BLEACHED
AND DEODORISED (RBD) PALM OIL, RBD PALM OLEIN AND RBD PALM STEARIN BASED ON THE RESPECTIVE FUNCTIONAL UNIT FOR EACH STAGE OF THE PALM OIL SUPPLY CHAIN
Product transported From Average distance Amount material Based on the GHG emission (km) used production of (kg CO2 eq.)
Nursery Fruit bunches from Plantation 51 15.69 g 1 unit of 9.89 x 10⁻⁴ ‘mother palm’ to seed producer germinated seed
Germinated Seed producer 86 1.33 seeds 1 unit of 5.32 x 10⁻³ seeds to nursery seedling Seedlings Nursery to 70 0.26 seedling 1 t of FFB 8.36 x 10⁻² plantation
Plantation Fresh fruit bunches Plantation to mill 31 3.61 t 1 t of CPO 20.90
Palm oil mill Crude palm oil (CPO) Mill to refinery 164 1.05 t 1 t of RBD PO 20.86
Palm oil refinery Refined oils - - - - - for export
RBD palm oil (PO) Refinery to ports 67 1 t 1 t of RBD PO Electricity: 0.45 kWhr (0.31 kg) Diesel: 7.37 kg Total (7.68 kg CO2eq.)
RBD palm olein Refinery to ports 21 1 t 1 t of RBD PO Electricity: 0.47 kWhr (0.32 kg) Diesel: 2.14 kg Total (2.46 kg CO2eq.)
RBD palm stearin Refinery to ports 18 1 t 1 t of RBD PO Electricity: 0.46 kWhr (0.32 kg) Diesel: 1.93 kg Total (2.25 kg CO2eq.)Refined oils for retailers RBD palm oil Refinery to retailers 44 1 t 1 t of RBD PO 4.78 RBD palm olein Refinery to retailers 53 1 t 1 t of RBD PO 6.80 RBD palm stearin Refinery to retailers 63 1 t 1 t of RBD PO 8.50

JOURNAL OF OIL PALM RESEARCH 29 (1) (MARCH 2017)
126
the pollinated fruit bunches from the plantation to the seed laboratory and from the seed laboratory to the nursery. This is in view of the small quantity of thepollinatedfruitbunchesfromtheʻmotherpalmʼtransported, i.e. less than 1 t at a particular time. Vehicles with capacity ranging from 3 t to 25 t were used to transport seedlings from the nurseries to the plantations. For the transportation of the FFB from the plantations to the mills, it was found that 16 t; 28 t and 40 t vehicles were used. The vehicle type ranges from tractors with tippers when the mills are nearby, to single unit lorries and articulated lorries with trailers with capacity of up to 30 t when the mills are further away.
CPO was transported from palm oil mills to palm oil refineries in lorry tankers of various capacities ranging from 17 - 35 t but mostly CPO was transported in 40 t vehicles (28-40 t gross weight). For the transportation of the refined palm oil and its fractionated products, it was found that while some of the refined products were transported to ports using pipelines, the transportation of the RBD POs by road using lorry tanker was preferred. This is due to the fact that POs has a higher melting point compared to RBD POo and RBD PO and thus, may not be suitable to be transported by pipelines because of clogging problems. The transportation by road of these refined oils was also by lorry tankers of similar capacity with the lorry transporting the CPO.
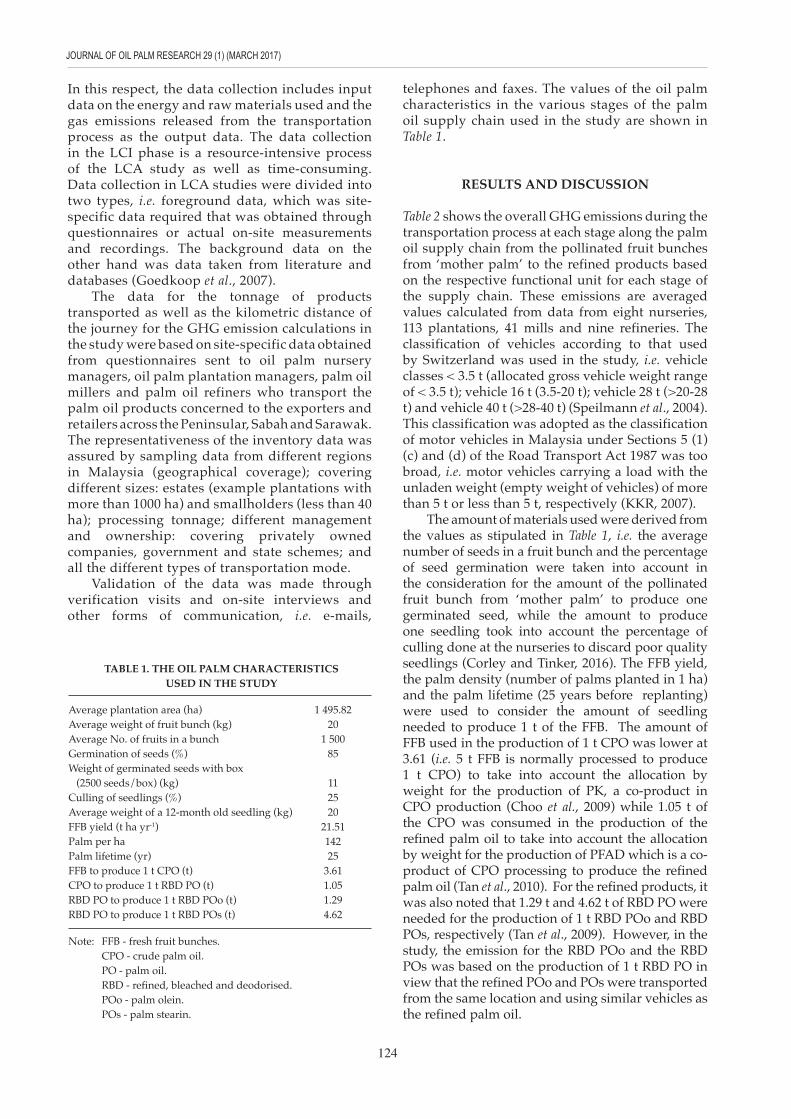
Figure 2 shows the comparison for the transportation during the different stages along the supply chain on the basis of the production of 1 t of the refined PO. As shown in Figure 2, the study showed
that for the overall GHG emission, the highest emissions were during the transportation of the FFB from plantations to mills and the transportation of CPO from palm oil mills to refineries. The higher value for the GHG emissions from FFB transport was due to the amount needed (i.e. 3.61 t) for the production of 1 t CPO. For the transport of the CPO, the long distance from the mills to the refineries was the contributing factor for the higher emissions as it was observed that the average distance from the mill to the refinery was the furthest compared to the average distance of the other stages along the palm oil supply chain. This was due to the distribution of the palm oil mills in the country where most of the refineries were located near the ports whereas the mills were located nearer to the plantations thereby resulting in the transportation of the CPO over longer distances to be refined.
The GHG emission during the transportation of the refined PO to the port was also relatively high. This was because some refineries were located inland. The GHG emissions were also relatively high when the refined PO, refined POo and refined POs were transported to retailers. This was due to the fact that these oils were being transported within and across the states in the country to repacking plants to be re-packed as cooking oil and for further processing into other products. For the GHG emission, the transportation at the nursery stage contributed the least in comparison to the other stages.
In view that the highest emissions were during the transportation of FFB from plantations to mills and the transportation of CPO from palm oil mills
Figure 2. Greenhouse gas (GHG) emission for the transportation of the pollinated fruit bunches from 'mother palm', germinated seeds, seedlings, fresh fruit bunches, crude palm oil and refined, bleached and deodorised (RBD) palm oil, RBD palm olein and RBD palm stearin based on the production
of 1 t of RBD palm oil.
GH
G E
mis
sion
(kg
CO
2 eq.
)
Product transported
Pollinatedfruit bunches
from 'Mother Palm'
Germinatedseeds
Seedlings Fresh fruitbunches
Crude palmoil
RBD palm oil to ports
RBD palm olein
to ports
RBD palm stearin
to ports
RBD palm oil
to retailers
RBD palm oleinto retailers
RBD palm stearinto retailers
25
20
15
10
5
0
1.3
× 10
-3
5.24
× 1
0-3
3.2
× 10
-1
21.9420.86
7.68
2.46 2.25
4.786.80
8.50

127
A CRADLE-TO-GATE STUDY OF GHG EMISSIONS FROM THE TRANSPORTATION OF PALM OIL, PALM OLEIN AND PALM STEARIN USING THE LIFE CYCLE ASSESSMENT APPROACH
to refineries, improvement in the transportation at these stages can have a very significant impact on the overall environmental performance of the oil palm industry in terms of GHG emissions from transportation. In this respect, for plantations close to mills and with suitable terrain, the use of rail system with cages are encouraged rather than transporting using tractors.
For the transportation of CPO and its refined products, the use of other mode of transport could be explored in view of the long distances involved for transporting these products. The use of rail transport as another alternative could be considered especially when mills or refineries are near railway stations. The emissions for CO2 using rail transport is 3146 g CO2/kg diesel (Spielmann et al., 2004). In comparison, the CO2 emission to transport CPO in a 30 t capacity lorry tanker by road, is 7984 g CO2/kg diesel (1 litre is equal to 0.84 kg diesel (Spielmann et al., 2004). The savings in terms of diesel consumption from the use of rail transport is even greater at 0.68 g/t km (Spielmann et al., 2004) as compared to 14.28 g/t km when using road transport. This was based on the assumption that the CPO was transported in a 30 t capacity lorry tanker over an average distance of 164 km to the refinery, and consumed 36 litres/100 km of diesel (including the empty return trip). The lower diesel consumption in rail transport was due to the fact that the train was able to carry a much bigger load than the road tanker at any one time.
CONCLUSION AND RECOMMENDATIONS
The results of the LCI for the overall GHG emissions based on the transportation for the production of 1 t of RBD PO indicated that transportation of FFB from plantations to mills and transportation of CPO from mills to refineries gave the highest GHG emissions. This was followed by transportation of RBD PO, RBD POo and RBD POs from the refinery to retailers respectively. The nursery contributed the least in terms of GHG emissions.
Improvement options and recommendations based on the outcome of this study could be used by policy-makers and stakeholders in their strategies to improve the existing transportation system for a more positive impact on the environment, thus contributing to the sustainable development of the Malaysian oil palm industry.
As the highest emissions were emitted during the transportation of FFB from plantations to mills, the use of rail system with cages are encouraged rather than transporting using tractors particularly for plantations close to mills and with suitable terrain. The use of rail transport for the transportation of CPO from mills to refineries can also be considered especially when mills or refineries are near railway stations. In view of the high GHG
emissions resulting from the long distance to transport the RBD PO from refineries to ports that are located inland, the use of rail transport is also recommended to transport the RBD PO to ports rather than transporting by road. The development of new ports or the upgrading of existing ports involved in the transportation of refined PO, POo and POs should give priority to infrastructures like pipelines to reduce road transport from refineries to ports. This move is supported by results from this study which showed that the GHG emissions from electricity to pump the products along the pipelines were much lower than the emissions generated by road transport.
The implementation of the B7 programme by the Malaysian government requires the mandatory blending of 7% biodiesel with petroleum diesel. This move is in line with the National Biofuel Policy to reduce dependency on petroleum diesel especially in the transport sector. The use of higher percentage of biodiesel in diesel blends should be encouraged to further reduce the emissions (MPIC, 2006). Beer et al. (2007) have shown that the use of palm biodiesel can reduce carbon dioxide emissions when compared to petroleum diesel.
The system boundary in the study was based on ‘cradle-to-gate’ along the palm oil supply chain from the transportation of the pollinated fruit bunches from ‘mother palm’ to the transportation of the RBD PO, POo and POs to ports and retailers only. Future studies are recommended to expand the system boundary to ‘cradle-to-grave’ on the LCA study of the handling and transporting of the RBD PO, POo and POs during shipment until the products arrive at the manufacturer’s or consumers doorsteps in selected overseas countries.
ACKNOWLEDGEMENT
The authors wish to thank the Director-General for permission to publish this article.
REFERENCES
BEER, T; GRANT, T and CAMPBELL, P K (2007). Life cycle results. The Greenhouse and Air Quality Emissions of Biodiesel Blends in Australia. Report for Caltex Australia Limited. Report number KS54C/1/F2.28. p. 50-92.
BERNAMA (2009). Malaysia announces conditional 40 percent cut in emissions. http://ww2.utusan.com.my/utusan/special.asp?pr=theMessenger&y=2009&dt=1218&pub=theMessenger&sec=Home_News&pg=hn_09.htm. accessed on 16 June 2016.
CHOO, Y M; MOHD BASRI, W; VIJAYA, S; HALIMAH, M and ZULKIFLI, H (2009). Life cycle

JOURNAL OF OIL PALM RESEARCH 29 (1) (MARCH 2017)
128
assessment of palm oil. Paper presented at the 6th
International Planters Conference 2009, 22-24 June 2009, Kuala Lumpur, Malaysia.
CHOO, Y M; HALIMAH, M; ZULKIFLI, H; VIJAYA, S; PUAH, S W and TAN, Y A (2011). Determination of GHG contributions by subsystems in the oil palm supply chain using the LCA approach. Int J Life Cycle Assess Vol. 16(7): 669-681.
CORLEY, R H V and TINKER, P B (2016). Seed germination and nurseries. The Oil Palm. Fifth edition. Wiley Blackwell, UK. p. 225-239.
FRISCHKNECHT, R (2010). Personal communi-cation. ESU-services Ltd, Uster, Switzerland.
GOEDKOOP, M; SCHRYVER, A D and OELE, M (2007). Defining goal and scope. SimaPro 7.1 Introduction to LCA with SIMAPRO. Pre Consultants, Amersfoort, Netherlands. p. 4-9.
HALIMAH, M; ZULIFLI, H; VIJAYA, S; TAN, Y A; PUAH, C W; CHONG, C L and CHOO, Y M (2010). Life Cycle Assessment of oil palm seedling production (part 1). J. Oil Palm Res. Vol. 22(3): 878-886.
HALIMAH, M; TAN, Y A; NIK SASHA, K K, MOHD DIN, A and CHOO, Y M (2014). Life Cycle Assessment for the production of oil palm seeds. Tropical Life Sciences Research Vol. 25(2): 41-51.
IPCC (2006). Guidelines for National Green House Gas Inventories. Intergovernmental Panel on Climate Change (IPCC), IPCC/OECD/IEA, Paris, France.
ISO 14040 (2006). Environmental Management- Life Cycle Assessment - Principles and Framework. International Organization for Standardization, Geneva, Switzerland.
ISO 14044 (2006). Environmental Management - Life Cycle Assessment – Requirements and Guidelines. International Organization for Standardization, Geneva, Switzerland.
KKR (2007). Road Transport Act 1987 (Act 333). Ministry of Works (Malaysia), Kuala Lumpur, Malaysia.
KUSHAIRI, A and RAJANAIDU, N (2000). Breeding populations, seed production and nursery management. Advances in Oil Palm Research. Vol. 1. MPOB, Bangi. p. 39-96.
MPIC (2006). The National Biofuel Policy. Ministry of Plantation Industries and Commodities, Putrajaya, Malaysia.
MOHD NAZRI AHMAD (2009). LCI for electricity for Malaysia. Paper presented at the Seminar on Life Cycle Assessment for the Petrochemical and Plastics Industry, Kuala Lumpur, Malaysia.
MPOB (2016). Malaysian Oil Palm 2015 Statistics. MPOB, Bangi.
OIL WORLD ANNUAL (2015). Oilseeds & Oils/Fats Annual Stocks/Usage Ratios. ISTA Mielke GmbH, Hamburg, Germany.
PUAH, C W; CHOO, Y M and MA, A N (2010). Life Cycle Assessment for the production and use of palm biodiesel (part 5). J. Oil Palm Res. Vol. 22(3): 927-933.
SIVASOTHY, K (2000). Palm oil milling technology. Advances in Oil Palm Research. Vol. 1. MPOB, Bangi. p. 744-782.
SPIELMANN, M; KAGI, T; STADLER, P and TIETJE, O (2004). Life Cycle Inventories of transport services, Data v1.1. Ecoinvent Report No. 14. Swiss Centre for Life Cycle Inventories, Dübendorf.
TAN YEW, A I; MEE CHIN CHOW; HALIMAH MUHAMAD; ZULKIFLI HASHIM; VIJAYA SUBRAMANIAM; CHIEW WEI PUAH; PUTRI NOR FAIZAH; YUN PING NEO; NOORLIN HARYANTIE; CHIEW LET CHONG; AH NGAN MA; YUEN MAY CHOO and MOHD BASRI WAHID (2009). Life Cycle Assessment (LCA) for food: refined palm oil and its fractions. Paper presented at the 2009 International Conference on Oil Palm and the Environment, 14-15 August 2009.
TAN, Y A; HALIMAH, M; ZULKIFLI, H; VIJAYA, S; PUAH, C W; CHONG, C L; MA, A N and CHOO, Y M (2010). Life Cycle Assessment of refined palm oil production and fractionation (part 4). J. Oil Palm Res. Vol. 22(3): 913-926.
UNFCCC (2014). Kyoto Protocol. http://unfccc.int/kyoto_protocol/items/2830.php, accessed on 14 June 2014.
US EPA (1993). Life Cycle Assessment: Inventory Guidelines and Principles. US Environmental Protection Agency, Washington DC, USA.
VIJAYA, S; CHOO, Y M; HALIMAH, M; ZULKIFLI, H; TAN YEW AI and PUAH, C W (2010). Life Cycle Assessment of the production of crude palm oil (part 3). J. Oil Palm Res. Vol. 22(3): 895-903.
YUSOF, B and CHAN, K W (2004). The oil palm and its sustainability. J. Oil Palm Res. Vol.16 (1): 1-10.

129
A CRADLE-TO-GATE STUDY OF GHG EMISSIONS FROM THE TRANSPORTATION OF PALM OIL, PALM OLEIN AND PALM STEARIN USING THE LIFE CYCLE ASSESSMENT APPROACH
YUSOFF, S and HANSEN, S B (2007). Feasibility study of performing life Cycle Assessment on crude palm oil production in Malaysia. Int J Life Cycle Assess. Vol. 12 (1): 50-58.
ZULKIFLI, H; HALIMAH, M; CHAN, K W; CHOO, Y M and MOHD BASRI, W (2010). Life Cycle Assessment for oil palm fresh fruit bunch production from continued land use for oil palm planted on mineral soil (part 2). J. Oil Palm Res. Vol. 22 (3): 887-89.