A Conceptual Model on the Impact of Mattering, Sense of ...
336
Claremont Colleges Scholarship @ Claremont CGU eses & Dissertations CGU Student Scholarship 2013 A Conceptual Model on the Impact of Maering, Sense of Belonging, Engagement/Involvement, and Socio-Academic Integrative Experiences on Community College Students’ Intent to Persist Esau Tovar Claremont Graduate University is Open Access Dissertation is brought to you for free and open access by the CGU Student Scholarship at Scholarship @ Claremont. It has been accepted for inclusion in CGU eses & Dissertations by an authorized administrator of Scholarship @ Claremont. For more information, please contact [email protected]. Recommended Citation Tovar, Esau, "A Conceptual Model on the Impact of Maering, Sense of Belonging, Engagement/Involvement, and Socio-Academic Integrative Experiences on Community College Students’ Intent to Persist" (2013). CGU eses & Dissertations. Paper 81. hp://scholarship.claremont.edu/cgu_etd/81 DOI: 10.5642/cguetd/81
Transcript of A Conceptual Model on the Impact of Mattering, Sense of ...

Claremont CollegesScholarship @ Claremont
CGU Theses & Dissertations CGU Student Scholarship
2013
A Conceptual Model on the Impact of Mattering,Sense of Belonging, Engagement/Involvement, andSocio-Academic Integrative Experiences onCommunity College Students’ Intent to PersistEsau TovarClaremont Graduate University
This Open Access Dissertation is brought to you for free and open access by the CGU Student Scholarship at Scholarship @ Claremont. It has beenaccepted for inclusion in CGU Theses & Dissertations by an authorized administrator of Scholarship @ Claremont. For more information, pleasecontact [email protected].
Recommended CitationTovar, Esau, "A Conceptual Model on the Impact of Mattering, Sense of Belonging, Engagement/Involvement, and Socio-AcademicIntegrative Experiences on Community College Students’ Intent to Persist" (2013). CGU Theses & Dissertations. Paper 81.http://scholarship.claremont.edu/cgu_etd/81
DOI: 10.5642/cguetd/81

A Conceptual Model on the Impact of Mattering, Sense of Belonging, Engagement/Involvement, and Socio-Academic Integrative Experiences on
Community College Students’ Intent to Persist
By Esau Tovar
A dissertation submitted to the Faculty of Claremont Graduate University in partial fulfillment of the requirements for the degree of Doctor of Philosophy in Education.
Claremont Graduate University 2013
© Copyright Esau Tovar, 2013 All rights reserved.

APPROVAL OF THE REVIEW COMMITTEE
This dissertation has been duly read, reviewed, and critiqued by the Committee listed below, which hereby approves the manuscript of Esau Tovar as fulfilling the scope and quality requirements for meriting the degree of Doctor of Philosophy.
Dr. Daryl G. Smith, Chair Claremont Graduate University
Professor of Education and Psychology
Dr. David Drew Claremont Graduate University
Joseph B. Platt Chair Professor of Education
Dr. William Perez Claremont Graduate University
Associate Professor of Education

Abstract
A Conceptual Model on the Impact of Mattering, Sense of Belonging,
Engagement/Involvement, and Socio-Academic Integrative Experiences on Community College Students’ Intent to Persist
By
Esau Tovar
Claremont Graduate University: 2013
Community colleges continue to experience high levels of student attrition and low
degree/certificate completion rates. Given extant literature, there appears to be a need to
reexamine how interactions between students and the institution, and students and institutional
agents are taking place, with the aim of identifying institutional practices that deleteriously or
positively impact degree completion and thus guide colleges to develop action plans to improve
conditions for student success.
This study examined how factors such as institutional commitment to students, mattering,
sense of belonging, interactions with diverse peers, perceptions of the campus climate,
engagement/involvement, socio-academic integrative experiences, and goal commitment
collectively affected community college students’ intent to persist to degree completion. The
proposed model tested the tenability of seven propositions examining how the above constructs
interact to influence intent to persist.
The sample consisted of 2,088 multiply diverse community college students. The
conceptual model was grounded on Astin’s (1991) Input-Environment-Outcome model and was
tested in the context of structural equation modeling. Multiple group invariance analyses for
race/ethnicity were conducted. The conceptual model explained 28% of the variance on intent to
persist for Asian students, 21% for White students, and 19% for Latino/a students.

Results indicated that transition support from family/friends exerted the highest effect on
intent to persist across all racial/ethnic groups, followed by engagement/involvement,
perceptions of mattering, interactions with diverse peers, GPA, goal commitment, and socio-
academic integrative experiences, albeit varying by group. This study was the first in the
literature to empirically demonstrate a causal effect between institutional commitment to
students and perceptions of mattering. Mattering, in turn, exerted a moderate to strong influence
on engagement/involvement, socio-academic integrative experiences, sense of belonging, and
indirectly on intent to persist. Evidence in support of an omnibus “student development and
success” construct, as alluded to by Wolf-Wendel, et al. (2009) is also presented. Of import to
these findings is that while this construct explained a significant proportion of the variance for
engagement/involvement, belonging, mattering, and interactions with diverse peers, the
individual factors exerted an independent effect on intent to persist. Implications for theory,
research, and practice are also discussed.

v
Dedication
To the institutional agents (instructors and counselors) who made a difference in my life.
Thank you for making me feel like I mattered!

vi
Acknowledgements
Acknowledging all the individuals who ever had an impact on my educational journey—
professors, counselors, family members, and friends—would likely take many pages, but I will
keep it short. I am very grateful to you all for your support, in whatever form it came. While I
always dreamed of earning a college degree, the challenges and opportunities presented along the
way were many. Who would have thought that after completing only middle school and
dropping out, I would one day earn a Ph.D.? I certainly did not envision it.
I realize that acknowledgements are typically reserved for individuals. Nevertheless, in
my case, I would like to start by recognizing community colleges as a whole. It was only at a
community college that I could have started my quest for a higher education, and this could have
happened only in the United States. Lacking a high school diploma/GED did not prove an
impediment to furthering my education thanks to a community college in my backyard—Los
Angeles Mission College. I personally believe in the community college mission, and I am
grateful that so many students like me get a “second chance” at making our educational dreams a
reality. It is for this very reason that I have proudly chosen to work within the community
college system.
I am very grateful to my dissertation committee members—Daryl G. Smith, David Drew,
and William Perez—for your ongoing support and guidance. I was also privileged from your
teaching. Dr. Smith, you were the first professor at Claremont Graduate University from whom I
took a course. After reviewing the list of reading assignments for each week (hundreds of pages
each time), I thought I would simply not make it. I sometimes thought of “giving up.” Yet, I
took three courses from you. You challenged me intellectually and pushed me to leave my
comfort zone with respect to my coursework and research. I was fortunate to collaborate with

vii
you on a project culminating in the publication of a co-authored journal article. Thank you! I
am also beholden to you for instilling in me a greater appreciation for the value of professional
involvement, and of the need to contribute to our community of scholars.
Dr. Drew, your kindness and capacity to reach students fearful of quantitative methods
and your love for teaching deserves our admiration. Thank you for supporting my research for a
“qual” paper that culminated in its publication; and for asking important questions that led to the
refinement on my conceptual model. Dr. Perez, I am first and foremost thankful for having had
the opportunity to take two courses from you on such important topics as the immigrant youth
experience and social/cultural capital. Your command of this literature is simply phenomenal.
Your courage to study undocumented youth and to advocate on their behalf is admirable. You
questioned aspects of my conceptual framework and provided me with guidance on how to
improve it. I am most grateful for this.
To my dear friend and colleague Dr. Merril A. Simon: What can I say? You have been
most encouraging and supportive since the day I met you and became one of your students (well,
except for the thesis thing! ). I had the honor of working with you not only in a professional
capacity, but also in our scholarship. You introduced me to the concept of mattering and
allowed me to participate in your research studies. These really pushed me to the max, and in
doing so, I independently learned about structural equation modeling! I am pleased that our
work has been recognized by counseling/measurement professionals and that we shared the 2011
Patricia B. Elmore Award for Outstanding Research in Measurement and Evaluation. Thank
you, my friend!
There have been other individuals—institutional agents—along the way that played
important roles in my educational endeavors and I would like to name them here: Joanne Kalter-

viii
Fink—my community college counselor—thank you for your love and support. To the late
Benny Scott—my community college psychology instructor/dean of academic affairs, who gave
me the chance to develop and then run the Center for Student Success aimed at facilitating
student retention. To Levinia Hutner—my community college ESL instructor—I am grateful for
the interest you took in me and for encouraging me to pursue an associate degree. I never
recognized you for this, but I can sincerely say your support meant much to me. I am also
thankful to other professors/advisors, including Phillip V. Lozano, Adrienne Foster, Gwen
Walker, Barbara Tabachnick, Donna Hardy, and especially to Dr. James E. Elias.
Now to my family and friends. While you may not have been able to assist me in my
academic work, your love and emotional support have been crucial. I am most appreciative to
my parents (Maria de Jesus Tovar and Amador Tovar) and siblings (Alba, Mayra, Ismael, and
Amador—aka, Madito); to my cousins/friends (Patty Manzano, Mariza Manzano, and Flora
Mendoza). You all were there in one way or another. I also wish to thank my tias Reyna
Manzano and Rafaela Manzano for offering me your support since I arrived to the U.S. and for
taking an interest in my development. I am indebted to you all.

ix
Table of Contents
CHAPTER 1 INTRODUCTION .....................................................................................1
Statement of the Problem ...............................................................................................3 Importance of the Study .................................................................................................5 Purpose of the Study ......................................................................................................6 Overview of the Conceptual Model ...............................................................................6 Summary of Research Questions and Hypotheses .........................................................8 Organization of the Dissertation ....................................................................................9
CHAPTER 2 LITERATURE REVIEW .......................................................................10 Student Retention and Persistence to Degree ................................................................10
Definition of Retention and Persistence ......................................................................11 Student Retention Theories and Conceptual Models ...................................................13
Spady’s Sociological Model of the Dropout Process ............................................14 Tinto’s Theory of Individual Student Departure ...................................................15 Critiques of Tinto’s model .....................................................................................19 Bean and Metzner’s Conceptual Model of Nontraditional Undergraduate Student Attrition ..................................................................................................................23
Moving Away From Retention Theory to Practice ......................................................24 College Student Engagement/Involvement and its Effect on Educational Outcomes29
Definition of Engagement ............................................................................................29 Propagation of the Engagement Construct ..................................................................30 Student Engagement at the Community College .........................................................32
Sense of Belonging............................................................................................................35 Definition of Sense of Belonging ................................................................................35 The Measurement of Sense of Belonging ....................................................................35 Research on Sense of Belonging in College Settings ..................................................36 Sense of Belonging, Student Persistence, and the Classroom Experience ..................38 A Need for Further Elaboration ...................................................................................40
Mattering ..........................................................................................................................42 Definition of Mattering ................................................................................................42 Mattering and the Self-Concept ...................................................................................43 The Study of Mattering ................................................................................................45 Psychological Correlates of Mattering .........................................................................46 Mattering and the College Student ..............................................................................49 Mattering and Student Persistence ...............................................................................57
Conclusion: Summary of the Literature ........................................................................59 CHAPTER 3 METHODOLOGY ..................................................................................61 Data Source.......................................................................................................................61 Sampling ...........................................................................................................................62 Conceptual Model ............................................................................................................62 Conceptual Model Propositions ......................................................................................66 Variables in the Model and Support from the Literature ............................................67
Input Variables (Exogenous) .......................................................................................67

x
Environment Variables (Exogenous and Endogenous) ...............................................70 Output Variables (Exogenous) .....................................................................................77
Research Questions and Hypotheses ..............................................................................85 Selection of Quantitative Methodology, Model Specification, and Hypothesis Testing ...............................................................................................................................88 Procedures for Carrying Out Structural Equation Modeling .....................................89
Model Specification .....................................................................................................89 Model Identification .....................................................................................................89 Sample Size and Power ................................................................................................89 Data Screening .............................................................................................................90 Model Estimation .........................................................................................................91 Model Evaluation/Fit ...................................................................................................91 Model Respecification .................................................................................................92
Data Screening Results ....................................................................................................93 Missing Values.............................................................................................................93 Normality, Identification, and Disposition of Outliers ................................................93
Assessment of Normality. ......................................................................................93 Identification of Univariate Outliers ......................................................................93 Disposition of Univariate Outliers .........................................................................94 Identification and Disposition of Multivariate Outliers .......................................100
Descriptives for Final Sample ....................................................................................105 Data Analyses for Research Questions ........................................................................109
Descriptive Statistics ..................................................................................................109 Analyses for Research Question 1 .............................................................................109 Analyses for Research Question 1.1 ..........................................................................110 Analyses for Research Question 2 .............................................................................110 Analyses for Research Question 2.1 ..........................................................................111 Analyses for Research Question 3 .............................................................................111 Analyses for Research Question 4 .............................................................................111
Conclusion ......................................................................................................................112 CHAPTER 4 RESULTS ...............................................................................................113 Descriptives for Conceptual Model Variables: Differences by Race/Ethnicity, Gender, and Length of College Attendance ................................................................113
Differences by Race/Ethnicity ...................................................................................113 Differences by Gender ...............................................................................................116 Differences by Length of College Attendance ...........................................................117 Conclusion of Differences .........................................................................................119
Structural Equation Modeling Analyses ......................................................................130 Research Question 1: The Measurement Model .........................................................130
Preliminary Confirmatory Factor Analyses by Construct .........................................131 CFA of Institutional Commitment to Students ....................................................131 CFA of Interactions with Diverse Peers ..............................................................133 CFA of Perceptions of a Hostile Campus Climate ..............................................135 CFA of Sense of Belonging .................................................................................136 CFA of Mattering .................................................................................................137 CFA of Socio-academic Integrative Experiences ................................................139

xi
CFA of Engagement/Involvement .......................................................................143 Confirmatory Factor Analysis for the Conceptual Model .........................................144
Model Specification .............................................................................................144 Model Identification. ............................................................................................146 Evaluation of Model Fit—Seven Factors/30 Indicators ......................................146 Evaluation of Fit for Respecified Model 1—Seven Factors/27 Indicators ..........148 Evaluation of Fit for Respecified Model 2—Seven Factors/24 Indicators ..........149
Research Question 1 Conclusion ...............................................................................150 Research Question 1.1: Invariance Analysis of Measurement Model for Race/Ethnicity ................................................................................................................156
Configural, Measurement, and Structural Invariance ................................................158 Latent Means Analysis for Measurement Model .......................................................159 Research Question 1.1 Conclusion ............................................................................161
Research Question 2: The Structural Model ...............................................................162 Assessment of the Structural Model for Intent to Persist ..........................................163
Model Specification .............................................................................................163 Model Identification .............................................................................................163 Evaluation of Model Fit .......................................................................................164 Respecification of Structural Model—Respecified Structural Model 1 ..............170 Respecified Structural Model 1—Model Identification ......................................171 Evaluation of Model Fit—Respecified Structural Model 1 .................................171 Respecified Structural Model 2—Model Identification ......................................173 Evaluation of Model Fit—Respecified Structural Model 2 .................................173
Research Question 2 Conclusion—The Structural Model of Best Fit .......................174 Research Question 2.1: Invariance Analysis of the Structural Model for Race/Ethnicity ................................................................................................................178
Configural, Measurement, and Structural Invariance ................................................179 Model Fitness by Race/Ethnicity .........................................................................179 The Baseline Model .............................................................................................183 Measurement Invariance for Causal Structure .....................................................183 Structural Invariance for Causal Structure Model ...............................................184
Research Question 2.1 Conclusion ............................................................................185 Research Question 3: The Effects of Directional Hypotheses on Intent to Persist ..191
Findings for Hypothesis 1 ....................................................................................192 Findings for Hypothesis 2 ....................................................................................195 Findings for Hypothesis 3 ....................................................................................197 Findings for Hypothesis 4 ....................................................................................200 Findings for Hypothesis 5 ....................................................................................203
Conclusion for Research Question 3 ..........................................................................205 Direct and Indirect Effects of the Respecified Conceptual Model on Intent to Persist, Mattering, Sense of Belonging, Engagement/Involvement, and Socio-Academic Integrative Experiences ..............................................................................................209
Direct and Indirect Effects of Intent to Persist .....................................................209 Direct and Indirect Effects of Perceptions of Mattering to the College ..............211 Direct and Indirect Effects of Sense of Belonging ..............................................212 Direct and Indirect Effects of Engagement/Involvement ....................................214

xii
Direct and Indirect Effects of Socio-academic Integrative Experiences .............215 Research Question 4: The Omnibus “Student Success” Construct? ........................228
Second-Order Confirmatory Factor Analysis ............................................................228 Model Specification .............................................................................................228 Model Identification .............................................................................................230 Evaluation of Model Fit—Five Factors/19 Indicators .........................................230 Evaluation of Model Fit for Respecified Omnibus Model—Four Factors/15 Indicators..............................................................................................................231
Research Question 4 Conclusion ...............................................................................232 Chapter 4 Conclusion .................................................................................................235
CHAPTER 5 CONCLUSIONS ....................................................................................245 Summary and Discussion of Findings .......................................................................249 Rearticulation of Conceptual Model Propositions on Intent to Persist ......................259 Implications for Theory .............................................................................................261 Implications for Research & Limitations ...................................................................263 Implications for Practice ............................................................................................264 Conclusion .................................................................................................................266
References ........................................................................................................................268 Appendix A .....................................................................................................................299 Appendix B .....................................................................................................................313
xiii
List of Figures
Figure
1. A Conceptual Model on the Impact of Mattering, Sense of Belonging, Engagement/Involvement, and Socio-academic Integrative Experiences on Intent to Persist ..........................................................................................................65
2. Hypothesized relationships in conceptual model .......................................................87
3. Graphical representation of the measurement model for the hypothesized Conceptual Model as produced by AMOS. ...............................................................145
4. Standardized coefficients for Respecified Model 2 ...................................................152
5. Unstandardized coefficients for Respecified Model 2 ...............................................153
6. Hypothesized structural model for intent to persist. ..................................................164
7. Standardized coefficients for Respecified Structural Model 2 on intent to persist: Model of best fit. ...........................................................................................176
8. Unstandardized coefficients for Respecified Structural Model 2 on intent to persist: Model of best fit. ..........................................................................................177
9. Standardized coefficients for Respecified Structural Model 2 (Model of best fit) on intent to persist: White students (n = 737). .....................................................188
10. Standardized coefficients for Respecified Structural Model 2 (Model of best fit) on intent to persist: Latino/a students (n = 460). .................................................189
11. Standardized coefficients for Respecified Structural Model 2 (Model of best fit) on intent to persist: Asian students (n = 435).. ..........................................................190
12. Hypothesis 1: Hypothesized, deleted, and confirmed paths in model. ......................194
13. Hypothesis 2: Hypothesized, deleted, and confirmed paths in model. ......................196
14. Hypothesis 3: Hypothesized, deleted, and confirmed paths in model. ......................198
15. Hypothesis 4: Hypothesized, deleted, and confirmed paths in model. ......................202
16. Hypothesis 5: Hypothesized, deleted, and confirmed paths in model. ......................204

xiv
17. Hypothesized second-order confirmatory factor analysis model for Omnibus construct. ....................................................................................................................229
18. Standardized coefficients for Respecified Omnibus Second-Order CFA Model. .....234
19. Total direct (D) and indirect (I) effects on intent to persist for community college students by race/ethnicity.. .........................................................................................235
20. Total direct (D) and indirect (I) effects on intent to persist for community college students: (a) all students, (b) White, (c) Latino/a, (d) Asian ......................................236
21. Total direct and indirect (I) effects on mattering to college for community college students by race/ethnicity. ..........................................................................................237
22. Total direct indirect (I) effects on mattering to college for community college students: (a) all students, (b) White, (c) Latino/a, (d) Asian ......................................238
23. Total direct and indirect (I) effects on sense of belonging for community college students by race/ethnicity ...........................................................................................239
24. Total direct indirect (I) effects on sense of belonging for community college students: (a) all students, (b) White, (c) Latino/a, (d) Asian ......................................240
25. Total direct and indirect (I) effects on engagement/involvement for community college students by race/ethnicity ..............................................................................241
26. Total direct indirect (I) effects on engagement/involvement for community college students: (a) all students, (b) White, (c) Latino/a, (d) Asian .........................242
27. Total direct and indirect (I) effects on socio-academic integrative experiences for community college students by race/ethnicity .....................................................243
28. Total direct indirect (I) effects on socio-academic integrative experiences for community college students: (a) all students, (b) White, (c) Latino/a, (d) Asian ......244

xv
List of Tables
Table
1. Variables in Conceptual Model and Coding Scheme ................................................79
2. Non-Standardized and Select Standardized Descriptives for Variables in Study Before Univariate Outlier Truncation (N = 2,200) ..........................................96
3. Non-Standardized and Select Standardized Descriptives for Variables in Study After Univariate Outlier Truncation in Seven Variables (N = 2,200) .......................97
4. Variables Predicting Multivariate Outliers (N = 112) from Non-Outliers (N = 2,088) .................................................................................................................102
5. Demographic Characteristics for Final Sample (N = 2,088) .....................................106
6. Descriptive Statistics for Final Sample by Race/Ethnicity (N = 2,088) ....................121
7. Descriptive Statistics for Final Sample by Gender (N = 2,088) ................................124
8. Descriptive Statistics for Final Sample by Length of College Attendance (N = 2,088) .................................................................................................................126
9. Summary of Goodness-of-Fit Indices for Alternate Models of Institutional Commitment to Students............................................................................................133
10. Summary of Goodness-of-Fit Indices for Alternate Models of Interactions with Diverse Peers .....................................................................................................134
11. Summary of Goodness-of-Fit Indices for Perceptions of a Hostile Campus Climate .......................................................................................................................135
12. Summary of Goodness-of-Fit Indices for Alternate Models of Sense of Belonging...............................................................................................................137
13. Summary of Goodness-of-Fit Indices for Alternate Models of Mattering ................139
14. Summary of Goodness-of-Fit Indices for Alternate Models of Socio-academic Integrative Experiences ...................................................................142
15. Summary of Goodness-of-Fit Indices for Engagement/Involvement Model ............144

xvi
16. Summary of Goodness-of-Fit Indices for Alternate Models of the Conceptual Measurement Model ...............................................................................154
17. Goodness of Fit Measures for the Measurement Model (Respecified Measurement Model 2) by Race/Ethnicity ................................................................157
18. Goodness-of-Fit Statistics for Tests of Multigroup (All Races) Invariance: Respecified Model 2 ..................................................................................................159
19. Latent Means Differences by Race/Ethnicity for Measurement Model (Respecified Model 2)................................................................................................161
20. Summary of Goodness-of-Fit Indices for Alternate Models of the Structural Model for Intent to Persist .........................................................................................169
21. Summary of Goodness-of-Fit Indices for the Structural Mode/ (Respecified Structural Model 2) by Race/Ethnicity ......................................................................182
22. Summary of Goodness-of-Fit Indices for Race/Ethnicity Structural Invariance Analysis (Respecified Structural Model 2) ..............................................186
23. Direct effects of Conceptual Model components by Race/Ethnicity .........................218
24. Indirect effects of Conceptual Model components by Race/Ethnicity ......................221
25. Total effects of Conceptual Model components by Race/Ethnicity ..........................224
26. Summary of Goodness-of-Fit Indices for Alternate Models of the Omnibus Second-Order CFA Model .........................................................................................233

1
CHAPTER 1
INTRODUCTION
Colleges and universities across the nation continue to face ever-increasing demands for
accountability and for the effective use of limited public resources dedicated to educating
millions of students in the country. Public policy advocates, governmental agencies, and
academic researchers have issued calls for greater attention to the shortage of individuals with a
college credential (e.g., degree, certificate) who are needed to meet the needs of an expanding
knowledge-based national and international economy (Lumina Foundation for Education, 2010;
Organization for Economic Co-operation and Development, 2011; Santiago & Reindl, 2000). It
has been noted that without a significant increase in degree attainment, the United States will
experience a shortage of approximately 16 million degrees of the number required to meet the
country’s workforce needs of 2025 (National Center for Higher Education Management Systems
and Jobs for the Future, 2007).
If the United States is to remain competitive, and if individuals are to reap the benefits
associated with a middle-class life, such as cognitive gains, higher earnings over a lifetime,
increased civic engagement, reduced unemployment, reduced crime rates, better health
(Pascarella & Terenzini, 2005), it will be crucial that a minimum of 60% of Americans attain
some form of postsecondary education in the coming years (Lumina Foundation for Education,
2010). Many now recognize that “A bachelor degree is no longer considered a potential
stepping-stone to a better life. Rather, it is now fully acknowledged as a gatekeeper to myriad
social and individual benefits” (Cabrera, Burkum, La Nasa, & Bibo, 2012; original emphasis).
Additionally, numerous studies synthesized by Pascarella and Terenzini (2005) attest to the
many benefits associated with college attendance and degree completion.

2
According to the 2010 issue of the Digest of Education Statistics (Snyder & Dillow,
2011), the percentage of high school completers (including those with a GED) attending college
rose from 45.1% in 1960 to 70.1% in 1999. The same report notes that the percentage of
students attending college increased by 38% between 1999 and 2009, while the percentage of
students at community colleges alone rose by 36.8%. Albeit significant differences by
race/ethnicity have been observed. Community college students accounted for 36.5% of the 19.1
million students attending degree-granting institutions in fall 2008. The Digest also notes that the
percentage of students over the age of 24 increased by a phenomenal rate of 43% in the same
period, surpassing that of their traditional-age counterparts who experienced a 27% growth rate.
This trend is expected to continue well into 2020 (Hussar & Bailey, 2011), and it is likely to be
impacted by the prolonged economic crisis facing the country (Betts & McFarland, 1995;
Levine, 2004, October 29; Smith, 2011).
If the United States is to reach what the Lumina Foundation has termed "the big goal"
(Lumina Foundation for Education, 2010), that is, increase to 60% the number of adults
possessing a postsecondary certificate or degree by 2025, colleges and universities, along with
governmental and public policy organizations must all work together to improve college
outcomes. Specifically, they must find ways to ensure that every adult attending college leaves
with a "high quality" credential that will enable him/her to compete in today's economy. This
will be particularly challenging for community colleges whose students traditionally experience
a variety of barriers to degree attainment (Cohen & Brawer, 2008; Kim, Sax, Lee, & Hagedorn,
2010). However, a confluence of events and recent developments in the areas of student
engagement, learning outcomes, and a renewed focus on finding solutions to boost student
retention and graduation rates via policies and practices that impact student transition and

3
academic experiences—all under the direct control of college administrators, student services
personnel, and faculty—can help facilitate this ambitious goal (Center for Community College
Student Engagement, 2012; Lumina Foundation for Education, 2010; Tinto, 2012a).
Statement of the Problem
During the fall 2009, 7.1 million students attended a public community college in in the
United States (Snyder & Dillow, 2011). Nearly 1.3 million were freshmen students. Despite this
record-breaking number, degree attainment remains substantially low. Community colleges
serve as the entry point into higher education for many impacted groups including traditionally
underrepresented ethnic minorities like Black and Latino students, low-income, and first-
generation college students (Almanac of Higher Education 2011, 2011; Cabrera et al., 2012;
Cohen & Brawer, 2008). In contrast to four-year college students, those attending public
community colleges tend to be African American or Latino, attend on a part-time basis and more
varied daytime/evening basis, work a significant number of hours per week, commute, have
family responsibilities such as child care, and have lower degree aspirations (Bean & Metzner,
1985; Cohen & Brawer, 2008; Crisp & Mina, 2012; Nora & Crisp, 2012; Skomsvold, Radford, &
Berkner, 2011). Additionally, community college students are often unprepared for college-level
coursework as evidenced in their reading, writing, and mathematics skills. Several recent studies
have noted that the vast majority of students attending community colleges are in need of
remediation in one or all areas above (Attewell, Lavin, Domina, & Levey, 2006; Bailey, Jeong,
& Cho, 2010; Snyder & Dillow, 2011). Taken together, the above characteristics place public
community college students at greater risk of not succeeding academically (Tovar & Simon,
2006) or of increasing the probability of students dropping out of college before completing a
certificate or degree, and thus require institutional assistance to support their success.

4
Four decades of student retention research has shown that the vast majority of students
who dropout of college will do so within their first-year of college (Horn, Berger, & Carroll,
2004; Tinto, 1993; Wood, 2012), but stopout and dropout occur throughout the college years.
Recent statistics compiled by ACT (American College Testing, 2011) noted that the national
first-to-second year retention rate for public community colleges was 55.4%. Federal statistics
put this figure at 60% for full-time students and 40.1% for part-time students across the nation
(Snyder & Dillow, 2011). By contrast, the first-to-second year retention rate for students at
public four-year institutions was 73.3%.
Moreover, the retention rates for traditionally underrepresented students, including
African American, Latino, American Indian/Alaskan Native, and East Asian students have been
reported as lower than those of White and Asian students. In fact, a recent six-year nationwide
longitudinal analysis of a 2005 cohort of students attending college glaringly noted that retention
and withdrawal rates for underrepresented students at public two-year institutions differed
markedly from their White and Asian counterparts, and especially from students at four-year
institutions (Skomsvold et al., 2011, Table 2.1-C). The study showed that approximately half of
all Latino (53.3%) and Black (49.0%) students starting at a public community college had
stopped attending higher education altogether, but fewer White (44.4%) and Asian (31.5%)
students at the same institutions had stopped attending. The corresponding dropout percentages
at four-year institutions were 24.1%, 29.4%, 21.7%, and 13.9%, respectively.
With respect to graduation rates, the Digest of Education Statistics reported that 20.6% of
first-time, full-time degree-seeking students attending public community colleges comprising the
2005 cohort obtained an associate degree or certificate within 150% of the expected "normal
time," or three years (Snyder & Dillow, 2011). This percentage differed markedly by

5
race/ethnicity: 29.9% non-resident aliens, 25.8% for Asian/Pacific Islanders, 22.9% for Whites,
18.2% for American Indian/Alaskan Native, 15.6% for Hispanics, and 12.1% for Blacks. The
study showed that women graduated at a slightly higher rate than males (21.2% vs. 19.9%). Yet
another cohort-based longitudinal study (Skomsvold et al., 2011) tracking students who started
attending public community colleges in 2003-04 found that only 22.9% had received a certificate
or an Associate’s degree at any institution in the United States by spring 2009, six years later—
regardless of institution of origin. Graduation rates for Whites (25.4%) and Asian (21.3%)
students were significantly higher than those of Blacks (19.9%) and Latinos (17.7%).
While the statistics above certainly portray degree attainment in a negative light,
examining this data over time demonstrates that the number of Black and Latino students
receiving an associate degree/certificate at public community colleges in the United States
increased by 77% and 101%, respectively, between 1998 and 2009 (Hussar & Bailey, 2011); far
outpacing graduation rates for students of other races/ethnicities (e.g., 28% for Whites and 48%
for Asian/PI). Yet, completion rates for these students lag behind.
Importance of the Study
One potential means to address this degree/credential shortcoming is for colleges to re-
examine, how and to what degree, interactions between students and the institution, and students
and institutional agents are taking place. This examination may enable institutions to identify
specific interactions, curricular, or co-curricular activities that deleteriously impact degree
completion. Concomitantly, such examination may also identify specific factors or practices
within the institution’s control that may enhance the probability of students completing a
degree/certificate. While previous studies have attempted to do this to varying degrees, via the
development of college impact and persistence-based models that examine how factors such as

6
student characteristics, finances, involvement, engagement, and integration impact student
retention, these models have not been a panacea to our completion agenda. Design and
methodological limitations frequently hamper their generalizability across sectors and college
student populations. Moreover, the collective impact of constructs such as those noted above
(i.e., mattering, sense of belonging, involvement, engagement, integration)—among others—has
not been studied purposefully or extensively at either community colleges or four-year
institutions; nor have their findings conclusively ascertained how these concepts interact to
impact student outcomes.
Purpose of the Study
This study seeks to examine how factors such as institutional commitment to students,
mattering, sense of belonging, interactions with diverse peers, perceptions of the campus climate,
engagement/involvement, socio-academic integrative experiences, and goal commitment
collectively impact community college students’ intention to persist. Whereas much has been
written independently about each of these areas of the literature, the constructs are frequently
poorly identified, measured, or are often reported to be one and the same, or simply to be closely
associated. In an effort to further this literature, this study also examines if
engagement/involvement, sense of belonging, mattering, perceptions of the campus climate, and
peer relationships might form part of an overarching construct.
Overview of the Conceptual Model
At the heart of the model, is the proposition that perceived institutional commitment to
students directly or indirectly impacts student perceptions of mattering to the college, sense of
belonging, institutional engagement/involvement, socio-academic integrative experiences, goal
(educational) commitment, and ultimately intent to persist. Following this omnibus proposition,

7
six additional sub-propositions are also integrated in the model as discussed in Chapter 3. The
conceptual model depicted in Figure 1 (below) is grounded on the Input-Environment-Outcome
model (Astin, 1991b, 1993). The I-E-O model posits that various college outcomes (O), such as
student persistence, are mediated by students’ pre-college characteristics and experiences (I), as
well as, their actual experiences while in college (E). As way of introduction, four variables
compose the “inputs” in the model: college transition support from family and friends, financial
concerns, gender, and unit load; seven latent variables and three indicator variables take the place
of aspects of the “environment:” institutional commitment to students, interactions with diverse
peers, perceptions of a hostile campus climate, mattering to college, sense of belonging,
engagement/involvement, socio-academic integrative experiences, length of college attendance,
goal commitment, and grade point average. A single variable encompasses the “outputs” in the
model: intention to persist.
While no conceptual framework or theory will likely account for the experiences of every
student attending college, the conceptual model in Figure 1 seeks to explore its relevance to
community college students by accounting for various input and environment variables on their
intentions to persist. The works discussed in the literature review (Chapter 2), theoretically
support the interrelationships modeled in Figure 1—directly or indirectly. The hypothesized
directionality of construct impact depicted in the model is based on the works reviewed. Straight,
single-arrow lines denote hypothesized causal relationships among the constructs. The model is
tested in the context of structural equation modeling and multiple group invariance analyses for
ethnicity, namely Asian, Latino, and White.

8
Summary of Research Questions and Hypotheses
Five research questions and five directional hypotheses encompassing this study are
briefly summarized below. These are described in full-detail in Chapter 3.
Research Question 1 and 1.1 concern the evaluation of the goodness of fit for a
measurement model for institutional commitment, interactions with diverse peers, perceptions of
a hostile campus climate, sense of belonging, mattering, engagement/involvement, and socio-
Input Environment Output
Figure 1. A Conceptual Model on the Impact of Mattering, Sense of Belonging, Engagement/Involvement, and Socio-academic Integrative Experiences on Intent to Persist

9
academic integrative experiences. Moreover, they address the respecification and analysis of the
model and a multiple group invariance analysis for race/ethnicity.
Research Question 2 and 2.1 address the assessment of goodness of fit for a structural
model derived from the measurement model above, supplemented by other control variables and
the outcome variable, intent to persist. These also investigate how the structural model differs by
race/ethnicity by conducting a multiple group invariance analysis. Based on this model, five
directional hypotheses are proposed, which examine how institutional commitment, interactions
with diverse peers, perceptions of a hostile campus climate, sense of belonging, mattering,
engagement/involvement, and socio-academic integrative experiences interact to predict several
intermediate outcomes and intent to persist.
Lastly, Research Question 4 investigates if the constructs of engagement/involvement,
sense of belonging, mattering, perceptions of the campus climate, and peer relationships might
form part of an omnibus construct.
Organization of the Dissertation
Chapter 1 presented an introduction to a “crisis” currently facing the nation; namely, the
significant shortage of individuals with college degrees sufficient to meet our economic needs.
The chapter also elaborated upon the significance of the study described in this manuscript,
presented the research questions and hypotheses guiding it, and provided an overview of a
conceptual model. Chapter 2 presents a comprehensive literature review supporting and guiding
the study. Chapter 3 discusses the methodology employed, including a full explanation of the
conceptual model being tested, research methods, and research design. Chapter 4 then discusses
the results of all analyses conducted. Lastly, Chapter 5 presents a summary of findings,
conclusions, a discussion of limitations, and implications for theory, research, and practice.

10
CHAPTER 2
LITERATURE REVIEW
Various areas of the literature that bear directly on the success of college students,
particularly on their retention and persistence to degree completion are reviewed below. While I
intended to craft a literature review focusing on community college students, the fact remains
that theoretical models and serious empirical research devoted exclusively to community college
students is not extensively available. Given this, the literature review incorporates relevant
works descriptive of four-year college students and institutions, and to the extent possible, it
supplements these works with available community college literature. This section reviews a
number of theories and research studies that provide general support for the transition
experiences of entering college students and the interactions they have with members of the
college community and institutional support services with the ultimate aim of facilitating student
retention and graduation. These include several theoretical models and research studies on
college student persistence, socio-academic integrative experiences, college
engagement/involvement, sense of belonging, and interpersonal mattering.
Student Retention and Persistence to Degree
To understand the degree to which college student retention is a concern for higher
education, it is important that we understand how it is framed in the literature and in practice; to
know the language researchers employ to describe complex processes leading to retention and
persistence decisions; and to understand the meaning of terms like retention and persistence,
dropouts, stopouts, and transfers. Any review of the literature will readily demonstrate how
these terms are used in specific contexts, in specific institutional settings, systems, or to denote
the completion of degree programs.

11
Definition of Retention and Persistence
Common to most theoretical models are “classic” constructs such as academic and social
integration or involvement (now called engagement) in academic, co-curricular, and extra-
curricular activities, but how these have evolved or been defined over time has been the subject
of contention (Barnett, 2006, p. 5; Wolf-Wendel, Ward, & Kinzie, 2009).
Oftentimes the terms retention and persistence are used interchangeably, and in other
occasions, the terms can mean very different things (Hagedorn, 2012; Porter, 2003; Seidman,
2012). As Hagedorn (2012) points out, there is relative agreement in definition for a student who
is a persister, that is, one who continues to attend college until completing a degree; while one
who is a non-persister, is one who departs college without completing a degree and never
returns.
Students who leave college are also often referred to as dropouts (Hagedorn, 2012) or
leavers (Tinto, 2012b), but this presupposes that students leave college never to return either to
the institution of origin or at any other college or university at any time. As noted by Alexander
Astin “the term ‘dropout’ is imperfectly defined: the so-called dropouts may ultimately become
non-dropouts and vice versa…. A ‘perfect’ classification of dropouts versus non-dropouts could
be achieved only when all of the students had either died without ever finishing college or had
finished college” (Astin, 1971, p. 15). Hence, it is important to acknowledge, as many
researchers have done, that students sometimes stopout of college for a period of time, or
transfer to another institution with the intent to complete a degree or program of study (Berger,
Ramirez, & Lyon, 2012; Hagedorn, 2012; Horn & Carroll, 1998; Mortenson, 2012; Spady, 1971;
Tinto, 2012b). Hagedorn points out that in producing its many reports, the National Center for
Education Statistics “differentiates the terms by using ‘retention’ as an institutional measure and

12
‘persistence’ as a student measure. In other words, institutions retain and students persist”
(2012, p. 85).
In addition to persistence, the term retention is also used in the higher education literature
to provide an account of the number of students remaining at an institution, a program, a major,
or a course for a specific period of time (e.g., first to second semester, first to second year,
semester) (Hagedorn, 2012).
Hagedorn (2012) also points out that an additional distinction important to measuring
student degree attainment is graduation. This is particularly important given that some students
will start and finish their studies at a single institution, yet others may dropout from one, and
then attend another (or more) college(s), where they may ultimately complete a degree.
Hagedorn notes that in the latter case, the institution of origin may count this student as a dropout
or non-persister, but the second institution as a persister or a graduate.
Given the complexity and the longitudinal nature of assessing persistence to degree
completion for students moving to institutions other than where they originally started, relatively
few studies have attempted to follow student cohorts across the higher education spectrum.
However, a few have been reported in the literature, no doubt facilitated by improvements in
data collection and tracking systems such as those available through select NCES databases and
the National Student Clearinghouse (e.g., Jones-White, Radcliffe, Huesman, & Kellogg, 2010;
Porter, 2003; Schoenecker & Reeves, 2008; Skomsvold et al., 2011).
Responding to shortcomings in methodology and problems associated with institution-
specific retention definitions, researchers advocate for colleges/universities and policymakers to
move instead to utilize measures of persistence covering the entire higher education system
(Adelman, 2006; Cabrera et al., 2012). To continue to focus on year-to-year persistence as a

13
measure of success “leads institutions to view student success through a very short-term lens….
This change in policy would also recognize the increasingly transient nature of today’s college
student population” (Cabrera et al., 2012, p. 194).
As used in this review, retention, persistence, and graduation will generally be used as
described above, and I will describe the context of how the term is employed in describing data,
models, etc.
Student Retention Theories and Conceptual Models
With the rapid increase of postsecondary institutions and students attending college
following World War II, and later during the uprise of the civil rights movement during the
1950’s and 1960s, college administrators began to systematically monitor enrollment in an
attempt to understand why so many students left college without completing a degree (Berger et
al., 2012; Cohen & Brawer, 2008; Spady, 1970, 1971). However, as Spady noted, research on
college student retention conducted until the late 1960s had been atheoretical and primarily
descriptive, philosophical, or predictive in nature. Even well into the 1980s, this was the case for
community college students (Bean & Metzner, 1985). Noting the absence of theoretically-driven
research, Spady (Spady, 1970, 1971) and Bean and Metzner (1985) called upon researchers, and
also took it upon themselves to synthesize existing literature to better understand the
undergraduate student experience and address the attrition problem (Berger et al., 2012). These
authors went on to present theoretical models on college student retention, with other researchers
soon following.
In response to the ever-present "problem" of student attrition, as evidenced in the
statistics presented above, numerous theoretical and conceptual frameworks have been proposed
and advanced over the course of the past four decades to explicate "why" attrition occurs at two-

14
year and at four-year colleges and universities (Bean, 1980, 1982; Bean & Eaton, 2000; Bean &
Metzner, 1985; Nora, Barlow, & Crisp, 2005; Pascarella & Chapman, 1983; Pascarella &
Terenzini, 1980; Spady, 1970, 1971; Swail, Redd, & Perna, 2003; Tinto, 1975, 1993). Likewise,
a number of authors and educational consultants have proposed approaches of "how" to
effectively address it, albeit their approaches differ (Barnett, 2006, 2010; Bensimon, 2006, 2007;
Center for Community College Student Engagement, 2012; Crockett, 1999; Dixon-Rayle &
Chung, 2007; Kuh, Cruce, Shoup, Kinzie, & Gonyea, 2008; Levitz, Noel, & Richter, 1999;
McClenney & Marti, 2006; Price & Tovar, In Press; Seidman, 2005, 2012; Swail et al., 2003;
Tinto, 2000, 2006, 2012a, 2012b; Yi, 2007). Described below are some of the most prominent
student retention conceptual and theoretical models described in the higher education literature.
Spady’s Sociological Model of the Dropout Process. For the first time in the history of
higher education, Spady (1970, 1971) introduced and empirically tested a sociological model
thought to explain the dropout process of students at institutions of higher education. According
to Spady, the decision to dropout rests on the interaction between student and the college
environment. Spady recognized the crucial role that student attributes (including background
characteristics, interests, skills, abilities) play in student preparation for and successful adaptation
to the academic and social systems of the college, and how these interactions in turn impacted
academic performance and college retention. Furthermore, he observed that student retention
would be facilitated to the degree to which students adapted to the normative culture of the
institution and they engaged in activities conducive to social integration. His 1971 study
partially corroborated these propositions, albeit “extrinsic reward structures” such as grades
played a determining role for men and their decision to withdraw, while commitment to the
institution and their social integration played a decreased role. For women, on the other hand,

15
the decision to remain at the institution was directly impacted by institutional commitment
followed by academic experiences.
Tinto’s Theory of Individual Student Departure. Without doubt, it is Vincent Tinto's
interactionalist theory of student departure (Tinto, 1975, 1993) that has received the most
attention since it was first introduced to higher education circles (Bensimon, 2007; Berger &
Braxton, 1998; Braxton, 1999). Because of its relative importance and frequent use and critique
by educational researchers and practitioners, his formulations will be reviewed in greater detail
below. This review will focus primarily on Tinto's revision of his theory as discussed in his
1993 book, Leaving College: Rethinking the Causes and Cures of Student Attrition, albeit, I will
subsequently note how his views have also changed over time, as a result of critiques and new
developments.
Tinto's theory of student departure from college has as its foundation the works of Spady
(1970, 1971), Arnold Van Gennep’s (1960) study of the rights of passage associated with group
membership (1960), and Emile Durkheim's theory on suicide (1951).
Van Gennep's work (1960), based on social anthropology, centers on three stages which
individuals must undergo if an “orderly transmission of the beliefs and norms of the society to
the next generation of adults and/or new members” is to take place (Tinto, 1993, p. 92). Each of
the stages is marked by a change in patterns and interactions between individuals and group
members. These are, (1) the stage of separation (separation of individual from previous
associations); (2) the stage of transition (where the individual begins to interact with those from
the new group); and (3) the stage of incorporation (where the individual takes on new patterns of
interaction with members of the new group). Consistent with Van Gennep's postulations, Tinto
believed college students must undergo a series of changes if they are to become integrated into

16
the college environment, thereby becoming successful members of the college community.
Tinto applied these changes to a longitudinal process that ultimately accounts for student
persistence and the "time-dependent process of student departure" (1993, p. 94).
Applying Van Gennep's stages, Tinto proposed that individuals attending college must
separate from past associations (high school, family, local residence), and in doing so may cause
psychological distress and perceived isolation. This is particularly characteristic for many
students moving away from their home and their families to attend college. Support or
opposition expressed by family members, Tinto contended, may influence how a given student
may transition into college life. Separation may be marked by a rejection of values instilled
upon the individual by family members or peers. Tinto argued that the transition period between
high school graduation and matriculation in college is demarcated by a period where new college
students must experience change between old and new. This period is facilitated or hampered by
the degree to which differences between old lifestyles and the norms and behaviors of the new
institution differ, and by how well the individual prepared for the transition (“getting ready”).
Tinto believed that students who withdraw from college are generally those who had a difficult
time making a smooth transition or were generally not ready for the demands of college.
According to Tinto, the last stage of incorporation had as its main task the integration of the
student into college life. This is a time when finding a place within existing college communities
or groups within the campus must take place. The student must find others similar to
him/herself, and ultimately feel a sense of belonging to the institution.
Using suicide as an analogy for departure or withdrawal from college, Tinto also relied
on Durkheim's (1951) work to elaborate upon his college student persistence model. According
to Tinto, Durkheim classified suicidal behavior into four categories: altruistic, anomie, fatalistic,
17
and egotistical. From these suicidal typologies, egotistical suicide, "which arises when
individuals are unable to become integrated and establish membership within the communities of
society," best explains individual departure from college (Tinto, 1993, p. 101). Tinto believed
that the analogy of egotistical suicide "highlights the ways in which the social and intellectual
communities that make up a college come to influence the willingness of students to stay at that
college" (Tinto, 1993, p. 104).
Combining Van Gennep (1960) and Durkheim's (1951) works, Tinto's model of student
departure (1975 and 1993) relied heavily on the integration of students into the academic and
social systems of the college. The academic system, Tinto noted, was primarily concerned with
the formal education of students (i.e., intellectual integration); whereas, the social system was
concerned with the interactions (membership) among students, faculty, and staff (i.e., social
integration). Tinto also recognized that both academic and social integration are invariably
interwoven and that the level of integration into one system needed not be the same as the other
(Tinto, 1993). Tinto's model also attempted to account for the time of the departure and whether
or not external forces and external choices led the individual to leave college. Individual
dispositions, as demonstrated in student expectations and motivations—measured by intentions
and institutional and goal commitments—affect the decision to withdraw, as well.
In presenting the model, Tinto (1993) discussed its aims. First, he indicated that the
model was longitudinal in nature and it successfully accounted for departure at individual
institutions—explaining the “how” and “why” of departure. Second, the model focused on the
longitudinal process by which voluntary withdrawal took place, not on instances such as when
students are dismissed owning to poor academic performance (e.g., academic probation). Third,
he noted the model was longitudinal and interactional in that individual interactions (or lack

18
thereof) with individuals or systems at the college would account for leaving college. The model
attempted to explain how these interactions—social or academic—led individuals possessing
certain characteristics to leave college, yet those with others stayed. Tinto stated that the model
argues that individual departure from institutions can be viewed as arising out of a
longitudinal process of interactions between an individual with given attributes,
skills, financial resources, prior educational experiences, and dispositions
(intentions and commitments) and other members of the academic and social
systems of the institution. The individual's experience in those systems, as
indicated by his/her intellectual (academic) and social (personal) integration,
continually modifies his or her intentions and commitments. Positive
experiences—that is, integrative ones—reinforce persistence through their impact
upon heightened intentions and commitments both to the goal of college
completion and to the institution in which the person finds him/herself….
Negative or malintegrative experiences serve to weaken intentions and
commitments, especially commitment to the institution, and thereby enhance the
likelihood of leaving (Tinto, 1993, p. 113).
Tinto acknowledged that the model recognized that the academic and social communities
comprising colleges were also interwoven with other external communities to which the college
student belongs, which are comprised of their own set of values and norms. It also accounted for
the fact that for many students, attending college was just one commitment among many others.
These "external" commitments were said to influence the degree to which students committed to
their educational goals and plans, thus limiting colleges in their ability to provide assistance.

19
Tinto recognized that persistence at a college might also be influenced by the level of
academic and social “fit” between the student and the institution. Students’ perceptions of
college faculty and staff commitment to their success may play a role in accounting for this fit.
If these perceptions were positive, Tinto noted, the student would likely increase his/her
commitment to the institution; thus, decreasing the chances of dropping out of college.
Additionally, the greater the interaction with other students, as well as with faculty and staff, and
the greater the number of memberships on campus, the more likely the student was to persist.
Tinto cautioned though, that
membership in a local community is a necessary minimum condition for
persistence, it is not a sufficient one. Persistence also depends on the centrality of
that community in the system of the college…. the closer one’s community is to
the center of the system, the stronger the forces which bind the individual to the
institution (p. 123).
As he recently noted, perceiving that they belong at the institution, to perceive
themselves as wanted and a part of the college community, will highly influence
students’ decisions to persist or to dropout (Tinto, 2012b).
Critiques of Tinto’s model. While Tinto’s model of student departure promotes
academic and social integration experiences, inside and outside the classroom, as cornerstones to
student retention and persistence, the model’s validity has been called into question or criticized
since it was first introduced (Tinto, 1975, 1987). Critics contend that the model places
significant onus on the student, while de-emphasizing the role of the institution and institutional
agents—faculty, staff, administrators—in promoting or impeding student success and retention
(Bensimon, 2007). Additionally, researchers have noted that Tinto's model does not sufficiently

20
account for the experiences of impacted groups such as traditionally underrepresented ethnic
minorities, first-generation to college, and low-income students, or students attending commuter
institutions and community colleges (Bean & Metzner, 1985; Bensimon, 2006, 2007; Cejda &
Hoover, 2010; Rendón, Jalomo, & Nora, 2000; Tierney, 1992).
Researchers have called into question the very idea that for students to become integrated
into the academic and social realms of the college that they must renounce their former
communities (Rendón et al., 2000; Tierney, 1992) and assimilate to the prevailing dominant
White college culture. Tierney explicitly noted that Tinto “has misinterpreted the
anthropological notions of ritual, and in doing so he has created a theoretical construct with
practical implications that hold potentially harmful consequences for racial and ethnic
minorities” (1992). He further observed that Tinto never questioned who becomes integrated
and how; and most importantly, that Tinto ignored the infinite possibilities for why individuals
may not become integrated, including those driven by institutions; for example, “an institution’s
inability to operate in a multicultural world” (p. 615).
Rendon, Jalomo, and Nora (2000) further argued that,
The assumption that minority students must separate from their cultural realities
and take the responsibility to become incorporated into colleges' academic and
social fabric in order to succeed (with little or no concern to address systemic
problems within institutions or to the notion that minority students are often able
to operate in multiple contexts) becomes central to the critique. (p. 585).
Other researchers have critiqued the fact that most research on Tinto’s theory has been
conducted on four-year college students and it has greatly emphasized the impact of out-of-the-
classroom experiences, including student involvement in clubs and activities, special programs,

21
and one-to-one interactions with faculty either during office hours, or by becoming involved in
faculty-sponsored research projects, for example (Bailey & Alfonso, 2005). Clearly, these
opportunities for interaction are either limited or not available at institutions such as community
colleges (Barnett, 2010). However, in recent years Tinto himself has come to acknowledge the
limitations of his model. He has come to recognize that "the process of student retention" differs
by institutional type and that breaking connections to students' former communities (e.g., home)
is not necessary to successfully transition and succeed in college (Tinto, 2006, p. 4).
Responding in part to the assumptions researchers and practitioners often make in
applying theoretical or conceptual models to college students, Tinto noted recently that
individuals often “make assumptions to simplify what would otherwise be very complex
analyses” (Tinto, 2012b, p. 254), particularly in the case of constructs such as academic and
social integration that have been operationalized in very different forms across studies (e.g.,
Barnett, 2006, 2010; Bean, 1982; Bean & Eaton, 2000; Berger & Braxton, 1998; Braxton, 1999;
Braxton & Hirschy, 2005; Braxton & Lien, 2000; Braxton & McClendon, 2001; Butcher, 1997;
Cabrera, Castaneda, Nora, & Hengstler, 1992a; Cabrera, Nora, & Castaneda, 1993; Crisp &
Nora, 2010; Deil-Amen, 2011; Hagedorn, Maxwell, & Hampton, 2001; Hoffman, Richmond,
Morrow, & Salomone, 2002; Hurtado & Carter, 1997; Karp, Hughes, & O'Gara, 2010; Kraemer,
1997; Nora et al., 2005; Nora & Cabrera, 1993; Nora & Crisp, 2012; Pascarella & Chapman,
1983; Pascarella & Terenzini, 1980; Rendón, 1994; Rendón et al., 2000). In sum, the
operationalization of such constructs is often simplified for the ease of data collection and
analysis.
Despite criticisms portrayed in the literature, researchers continue to promote many of the
elements associated with Tinto's model and it has been pointed out that researchers frequently

22
disregard alternative theoretical frameworks such as sense of belonging and validation theory
that purportedly speak to the experiences of all students (including nontraditional and
underserved students) and that may mediate their decisions to remain or leave college (Barnett,
2006, 2010; Bensimon, 2007; Hurtado & Carter, 1997; Rendón, 1994, 2002; Rendón et al.,
2000). In recent years, for example, research has substantiated the key role that institutional
agents play in facilitating or impeding student success, both in and out-of-the classroom (Barnett,
2010; Bensimon, 2007; Braxton & McClendon, 2001; Cejda & Hoover, 2010; Deil-Amen, 2011;
Karp et al., 2010; Lundberg & Schreiner, 2004; Stanton-Salazar, 1997). Deil-Amen (2011) and
Cejda and Hoover (2010) found that for community college students, student-faculty interactions
of both an academic and social nature served as vehicles to imparting important information to
students, increased their comfort in college, and were precursors to student retention. The
importance of these interactions as perceived by students is that they occur concomitantly.
These "socio-academic integrative moments" transpire during events or activities when students
interact with institutional agents and their peers (Deil-Amen, 2011). Barnett further contends
that in defining integration, that Tinto operationalized it in part as college students’ “sense of
‘competent membership,’ (p. 208), resulting from, among other factors, student interaction with
faculty and staff” (Barnett, 2010, p. 197), and it “connote[s] both a sense of possessing the
knowledge and skills needed for success in the college environment (competence) as well as
sense of belonging or being a part of the college community” (p. 200). Tinto himself has
expressed that with respect to students’ decisions to remain or leave college, that these decisions
are not strictly based on the number and type of interactions they have with institutional agents,
but rather “how they understand and draw meaning from those interactions” (2012b, p. 253).
Such meaning-making will impact student retention decisions.

23
Bean and Metzner’s Conceptual Model of Nontraditional Undergraduate Student
Attrition. Recognizing that much of the literature on college student retention focused primarily
on traditional college-age, residential, full-time students, and that literature on commuter and
non-traditional college students was primarily descriptive, Bean and Metzner (1985) proposed a
conceptual model based on an extended review of the literature thought to describe the dropout
process for non-traditional college students. As defined, by Bean and Metzner, non-traditional
students encompass those older than 24 years of age, commuters, those who attend college part-
time, and are primarily concerned with the academic offerings of the institutions, not their social
systems. Bean and Metzner contend that four sets of variables account for students’ decisions to
withdraw from their institutions. These are: background characteristics such as students’ age,
enrollment status, previous academic performance; academic variables, such as students’ study
habits, academic advising experiences, major certainty, and course availability; environmental
variables such as finances, employment, family responsibilities, encouragement/support; and a
variety of psychological outcomes stemming from college attendance, including the perceived
utility of a college degree, satisfaction with their institution, overall goal commitment, and the
degree of stress experienced while attending college. Bean and Metzner noted that these sets of
variables would have a direct impact on students’ decision to withdraw from college, as well as
an indirect impact, mediated through intentionality to leave college. Empirical study of their
model on commuter, nontraditional students has found that retention is mediated by students’
academic performance (i.e., grades), number of credit hours completed, absenteeism, previous
academic performance, number of hours employed, goal commitment, but not by social factors
(Bers & Smith, 1991; Metzner & Bean, 1987).

24
Moving Away From Retention Theory to Practice
Given the hundreds of studies conducted on college student retention and the many
theories and conceptual models found in the extant literature, researchers, public policy think-
tanks, and educational organizations have begun to recognize the need to “translate our research
and theory into effective practice” (Tinto, 2006, p. 2), particularly given that retention and
graduation rates have remained stagnant for several years (Mortenson, 2012). Much has been
learned over the past four decades about the nature of college student attrition, albeit imperfectly,
either as a result of poor methodology, small sample sizes, construct under-representation, etc.
Together, these shortcomings may limit the generalizability of findings across institutional types
and student populations. Nonetheless, researchers recognize, in one way or another, the need to
synthesize findings and pose from these potential solutions for institutions to follow (e.g.,
Bensimon, 2006, 2007; Center for Community College Student Engagement, 2012; Crockett,
1999; Dixon-Rayle & Chung, 2007; Kuh et al., 2008; Levitz et al., 1999; McClenney & Marti,
2006; Price & Tovar, In Press; Seidman, 2005, 2012; Swail et al., 2003; Tinto, 2000, 2006,
2012a, 2012b; Yi, 2007).
Over the course of the years, Tinto (2006) pointed out, we have learned that breaking
connections to past associations is not conducive to student retention, and that in many instances,
such connections are in fact essential (Cabrera et al., 1992a; Hurtado & Carter, 1997; Rendón,
1992; Rendón et al., 2000). Research also demonstrates that integration is impacted to a great
degree by institutional settings and of the importance of student classroom-based interactions
with their peers and high-impact pedagogy (Pike, 2012; Price & Tovar, In Press). Moreover,
researchers now recognize that the first-year of college is critical to student retention, as are the
opportunities for students to interact with teaching faculty, especially in the classroom (Tinto,

25
2001), alongside with counselors and advisors (Bean & Metzner, 1985; Bensimon, 2007; Deil-
Amen, 2011; Price & Tovar, In Press; Stanton-Salazar, 1997) . Most recently, the Center for
Community College Student Engagement at the University of Texas, Austin, advocated for
community colleges to front-load and make mandatory the use of essential academic and student
support services to increase the probability of degree completion (Center for Community College
Student Engagement, 2012).
Among leading advocates for moving from research to practice are Vincent Tinto—
arguably the best known scholar on the subject of student retention—and Alan Seidman,
founding and current editor-in-chief of the Journal of College Student Retention. Both Tinto
(Tinto, 2012a, 2012b) and Seidman (Seidman, 2012) propose separate, but related and
complimentary, models of practice to positively impact college student retention.
It is Tinto’s (Tinto, 2012a, 2012b) contention that colleges and universities are in need of
models of “institutional action” that will provide college administrators, practitioners, and
faculty with guidelines to put in place effective policies, procedures, and programs that will
support students as a whole, and particularly those with the greatest need. However, Tinto
ascertains that these models have largely been missing from the literature. In proposing his
“framework for institutional action,” Tinto noted the need to move away from “blaming the
victim” when students do not succeed (2012b, p. 254).
Tinto believes there are a minimum of four essential conditions that lay the groundwork
for student success (including retention). These are: expectations, support, assessment and
feedback, and involvement.
Briefly, Tinto indicates that colleges and universities must consistently and persistently
communicate to students our expectations “for what will be required to succeed in college”
26
(Tinto, 2012b, p. 255). This may encompass detailing for students how much and what type of
personal effort it will require of them to complete coursework successfully, and in turn, degree
requirements. These expectations may be communicated in a variety of ways or settings, such as
through orientation programs, formal and informal advising interactions, and in the classroom.
Key to students rising to these expectations will be the degree to which they feel validated by the
institution.
With respect to support, Tinto specifically noted that this may be offered in terms of
academic, social, and financial support, especially during the crucial first-year of college. The
importance of providing early support rest in the fact that this may lead students to experience
success early in their college career, and thus, increase the probability of future success (Tinto,
2012a). Examples of academic support include providing developmental reading, writing, and
mathematics courses; tutoring, study groups, and supplemental instruction. Social support may
be offered through counseling interventions to facilitate college transitions, through mentoring,
and interactions with key individuals at the institution, including faculty, staff, and other
students.
The third condition for student success proposed by Tinto is assessment and feedback.
Consistent with Chickering and Gamson’s principles of good practice (1987), Tinto noted that
frequent and timely feedback to students is key to their success and academic development. This
may begin early on as students apply and matriculate in college: require that students complete
diagnostic assessment in reading, writing, and mathematics so students may quickly start their
developmental education sequence if test scores indicate such a need. Tinto also promotes the
use of classroom-based assessments such the one-minute paper to quickly assess students’

27
understanding of topics/materials discussed in the class and remediate unclear points quickly.
Moreover, the use of early alert or early warning systems may also be used.
Lastly, the last essential condition for student success is involvement or engagement in
educationally beneficial activities during the first year of college. However, opportunities for
involvement should lead “to forms of social and academic membership and the resulting ‘sense
of belonging’” at their institution (Tinto, 2012a, p. 66). In the context of the classroom,
engagement in specific pedagogies such as collaborative learning or problem/project-based
learning may help promote student success and retention to a greater degree than traditional
Socratic lectures. This may also be accomplished through students’ participation in learning
communities and service learning activities.
Clearly, creating the conditions above necessitates careful planning, institutional
commitment, human and financial resources. Furthermore, the timely delivery of interventions
or participation in programs is crucial, and may require that institutions devote significant
resources during the first-year of college (Tinto, 2012a, 2012b).
While Tinto promotes the creation of policies, activities, and programs that are reflective
of four conditions that in his view lead to student success and retention, Alan Seidman’s
contribution to a model of practice rests in the creation of his “formula for success” (Seidman,
2012). The formula is based on his belief that college student retention can be effected by the
early identification of students with the greatest risk of not succeeding academically, and with
the subsequent provision of early, intense, and continuous intervention. Like Tinto, Seidman
recognizes that institutions must front the financial resources necessary to put in place multiple
support programs and services, in- and out-of-the-classroom, “but the payoff will result in
enhanced term-to-term retention and graduation rates” (2012, p. 269).

28
Like Tinto, Seidman also recognizes the importance of assessing students’ reading,
writing, and mathematics skills early on, and then provide them with early intervention, while
the student is still enrolled in high school or as soon as he/she starts college. With respect to the
intensity of the intervention, Seidman notes that it must be “intense or strong enough to effect the
desired change…. [and] The student must demonstrate that he/she has mastered the skill(s) or
social factor(s)” prescribed by the institution (Seidman, 2012, p. 273) until such time as change
is effected.

29
College Student Engagement/Involvement and its Effect on Educational Outcomes
The study of student engagement has gained considerable attention over the last decade,
primarily in response to demands from the public, from legislators and accreditors, for colleges
and universities to demonstrate the link between college attendance and successful student
outcomes.
Definition of Engagement
Engagement, as described by Kuh (Kuh, 2001, 2009) is characterized as the amount of
time and effort that students place in their involvement in educationally beneficial practices that
promote their learning and development. Engagement also refers to the efforts that institutions
place in investing and in promoting these activities to effect student success and academic
attainment (Kuh, 2009; McClenney, 2004; McClenney, Marti, & Adkins, 2006). “Engagement
is about two elements: what the student does and what the institution does. Engagement is about
two parties who enter into an agreement about the educational experience” (Wolf-Wendel et al.,
2009, p. 413).
Student engagement, as is currently conceptualized, is rooted in the works of Pace on
"quality of effort" (Pace, 1980, 1984), Astin's theory of student involvement (Astin, 1984), and it
largely reflects Chickering and Gamson's (1987) seven principles of effective educational
practice in undergraduate education. With respect to involvement theory, Astin proposed that
involvement referred to the amount of physical and psychological energy college students invest
to academic endeavors such as studying, participation in student clubs and organizations, formal
and informal interactions with faculty, peers, and other college staff members. Furthermore,
Astin proposed that involvement occurs on a continuum; has a qualitative and a quantitative
character; student learning is directly proportional to the amount and quality of involvement in

30
programs; and lastly, the effectiveness of policies and programs promoted by institutions may be
judged by their “capacity” to positively impact student involvement (Astin, 1984).
Like in the case of retention and persistence research, it is not uncommon that researchers
and practitioners often confuse the meaning and measurement of engagement and involvement
constructs. However, as noted recently by Wolf-Wendel, Ward, and Kinzie (2009) each of these
concepts “add[s] something unique and important to understanding student development and
success” (p. 408); albeit they acknowledged that it is important to understand how these concepts
(along with integration) have changed or have been reframed over time. Relying on elite
interviews with the key proponents of the constructs, the authors found that from the theory
proponents’ perspectives, there are few differences between involvement and engagement, and
are “’temporal representations of pretty much the same thing’” (quoting George Kuh; Wolf-
Wendel et al., 2009, p. 417), but engagement is also “more powerful” (p. 418), more
encompassing. A key difference is that in the case of engagement, it assigns greater
responsibility to institutions in facilitating student success.
Propagation of the Engagement Construct
Given its prominence in educational circles, the construct of engagement has been
promulgated significantly via the development of a few student engagement surveys
administered nationally (and in select countries), including the National Survey of Student
Engagement (NSSE) and the Community College Survey of Student Engagement (CCSSE).
These instruments are composed of dozens of items ingrained in the higher education literature
that correlate highly with educational outcomes (e.g., learning, retention, persistence, grades);
are reflective of institutional practices and student and faculty behaviors; and provide colleges
and universities with "actionable" data to improve the college student experience (Kuh, 2001;

31
McClenney, 2007; McCormick & McClenney, 2012). As noted by Kuh and colleagues (Kuh,
Kinzie, Schuh, Whitt, & Associates, 2005), high levels of engagement are required to effect
student success in college.
According to the leading proponents of the surveys, the CCSSE and NSSE were
originally developed to provide faculty and administrators with information pertinent to effective
educational practices bearing directly on student learning and retention (Kuh, 2001; McClenney,
2007; McCormick & McClenney, 2012). Moreover, the instruments are designed to permit
institutions to conduct "relative comparisons" for groups of students within and outside the
institution. For example, a recent study by Sontam and Gabriel (2012) assessed engagement
differences across CCSSE measures by gender and race with the impetus to identify student
groups that might benefit from institutional assistance. It should be noted that the survey
developers have consistently acknowledged that the five benchmarks of effective educational
practice constituting them have been described as "summative indices" of select variables, not of
latent constructs (McCormick & McClenney, 2012). Hence some of the calls questioning the
construct validation of the instruments (Campbell & Cabrera, 2011; Dowd, Sawatzky, & Korn,
2011; Nora, Crisp, & Matthews, 2011a; Porter, 2003) have been noted by the survey developers
and others, as inappropriate (McCormick & McClenney, 2012; Pike, 2012).
Benchmarks associated with the CCSEE are: active and collaborative learning, student
effort, academic challenge, student-faculty interaction, and support for learners. Similarly those
for the NSSE are: level of academic challenge, active and collaborative learning, student faculty
interaction, supportive campus environment, and enriching educational experiences.

32
Student Engagement at the Community College
Consistent with the intent described above, and with efforts to establish a connection
between student engagement behaviors and educational outcomes such as graduation rates,
research on the CCSSE has been conducted using single-institution datasets (e.g., Akin, 2009;
Balog & Search, 2006; Reynolds, 2007; Schuetz, 2008; Sontam & Gabriel, 2012), as well as,
multiple-institution, multi-state, or national datasets (e.g., Lynch Ervin, 2010; McClenney, 2007;
McClenney & Marti, 2006; Price & Tovar, In Press; Roman, Taylor, & Hahs-Vaughn, 2010).
Furthermore, the Center for Community College Student Engagement at the University of Texas
at Austin regularly analyzes and disseminates findings on student engagement to the public at-
large. Taken altogether, these studies highlight the important role that student engagement in
educationally effective practices plays on outcomes such as retention, persistence, grade point
average, and in some instances on degree completion.
Focusing on community college student engagement outcomes, a multi-year study
encompassing CCSSE benchmark scores for students enrolled across the Florida Community
College System (reported in McClenney & Marti, 2006) found a moderate effect of student
engagement as measured by the five benchmarks on GPA—accounting for well over 30% of the
variance, and after controlling for a variety of background variables. Likewise, small effects
were found for the active collaborative learning benchmark on course completion rates. With
respect to associate degree attainment, the study also found small effects for the active
collaborative learning, student effort, and the support for learners benchmarks. The active and
collaborative learning benchmark also significantly predicted persistence to the following term
and to the second year. What is particularly notable in this study is a set of conditional effects
showing that increased levels of engagement significantly improved GPA for academically

33
under-prepared students, but not for college-ready students, and for African American students.
Similarly, conditional effects for African American students were found on GPA and on course
completion rates for both African American and Latinos.
A second national study comprising 24 community colleges participating in the
Achieving the Dream Initiative (2002-2004) found that three of the CCSSE's five benchmarks
(active and collaborative learning, academic challenge, and student-faculty interaction),
positively correlated with degree or certificate attainment.
In summarizing findings from three independent studies sponsored by CCSSE,
McClenney and Marti (2006) observed that the benchmarks most closely associated with
degree/certificate attainment were active and collaborative learning, academic challenge,
student-faculty interaction (with bivariate correlations ranging from .07 to .11). All, but the
support for learners benchmark, significantly correlated with cumulative GPA. Lastly,
persistence to second term and to second year of college was most closely impacted by active
and collaborative learning, followed by faculty-student interaction, and support for learners.
Most recently, Price and Tovar (In Press) explored the relationships between student
engagement as measured by the CCSSE and institutional graduation rates. The study was based
on 261 community colleges throughout the United States that administered CCSSE in 2007 and
that reported graduation rates via IPEDS in 2009 (Integrated Postsecondary Education Data
System). Correlational and multiple regression analyses reinforced the importance of student
engagement as a predictor of college completion, particularly, the active and collaborative
learning and support for learners benchmarks; albeit, the regression models accounted for only
eight percent of the variance in graduation rates after controlling for a variety of institutional
characteristics.

34
With respect to single-institution studies, Sontam and Gabriel (2012), found differences
in reported levels of engagement by gender and race. Specifically, their studies showed that
females were much more likely to report being engaged in educationally beneficial practices, as
compared to males at the institution. For example, females were more likely to expend more
time and energy in endeavors pertaining to their coursework, whereas males were less likely to
participate in activities that might support their learning and to spend the required time to their
studies. Moreover, African American students, in comparison to students of other
races/ethnicities were also more likely to be engaged in educationally beneficial activities and to
find the academic environment more intellectually challenging and stimulating, just as they were
more likely to expend more time to their academic studies. An important conclusion drawn from
this study is that in the case of African American students, who often report feeling
marginalized, less accepted, and held to lower expectations from faculty, is that they in fact
report engaging with greater frequency and depth in activities that support their learning and
development (Sontam & Gabriel, 2012).
Lastly, consistent with recent calls for colleges and universities to move from a research
agenda to institutional practice (Seidman, 2012; Tinto, 2012a, 2012b), the Center for Community
College Student Engagement began to refocus its efforts in communicating to stakeholders
which high-impact activities and practices have the greatest potential for boosting student
achievement (Center for Community College Student Engagement, 2012), and thus increasing
degree completion. Some of these activities include mandatory assessment/placement,
orientation, and academic planning on the front end; curricular restructuring of developmental
education, participation in first-year experience seminars, student success courses, use of tutoring
and supplemental instruction, and experiential learning, to name a few.

35
Sense of Belonging
Definition of Sense of Belonging
The construct of sense of belonging (SB) while not foreign to higher education has been
studied minimally and only with select college student populations. Introduced by Hurtado and
Carter (1997) to the higher education literature, but grounded in the works of Bollen and Hoyle
(1990), sense of belonging has been defined as an individual's sense of identification or
positioning in relation to a group within or to the college community that may yield cognitive
and affective responses. Sense of belonging also characterizes a person's perceived belief of
indispensability within a social system and that he or she is recognized and accepted as a
member of that community (Anant, 1966). It also entails a need for frequent and ongoing
relational interactions to feel him/herself a part of something greater, a motivation sufficient to
drive behavior (Baumeister & Leary, 1995).
The Measurement of Sense of Belonging
In the context of college research, items pertaining to sense of belonging have been
embedded in measures of institutional fit, institutional quality, institutional commitment or
commitment to college (Bean, 1985; Bean & Metzner, 1985; Cabrera et al., 1992a; Cabrera et
al., 1993; Nora & Cabrera, 1993), as well as in independent measures (Hoffman et al., 2002;
Hurtado & Carter, 1997; Hurtado et al., 2007; Hurtado & Ponjuan, 2005; Johnson et al., 2007b;
Tovar & Simon, 2010). It is likely that these practices stem from methodological and practical
decisions researchers make when designing and carrying out their research studies. Moreover,
the dimensionality of the sense of belonging construct has remained an issue of debate for some
time. Sense of belonging has been operationalized as a unidimensional construct (Hausmann,
Schofield, & Woods, 2007; Hausmann, Ye, Schofield, & Woods, 2009; Hurtado & Carter, 1997;

36
Locks, Hurtado, Bowman, & Oseguera, 2008; Maestas, Vaquera, & Zehr, 2007) and as a
multidimensional construct (France, Finney, & Swerdzewski, 2010; Hoffman et al., 2002; Tovar
& Simon, 2010). As a unidimensional construct, Hurtado and Carter noted that the measure of
perceived sense of belonging they used was well “suited to understand a variety of collective
affiliations, formed in large environments that can contribute to an individual’s sense of
belonging to the larger community” (1997, p. 328). As a multidimensional construct, sense of
belonging has been proposed to reflect specific student-faculty relationships, student-peer
relationships, and student-classroom interactions (France et al., 2010; Hoffman et al., 2002;
Tovar & Simon, 2010). Tinto has recently noted that sense of belonging results from the
interactions students have with a variety of communities encompassing college settings and, in
turn, how supportive these experiences are perceived by students (Tinto, 2012a); “it is how you
see your connections on campus vis-à-vis other groups. Students need to feel connected in ways
that do not marginalize or ghettoize…. They need to feel welcomed not threatened” (as quoted in
Wolf-Wendel et al., 2009, p. 424).
Research on Sense of Belonging in College Settings
Most research conducted to date on sense of belonging has focused on the experiences of
select racial/ethnic minorities in navigating the college culture and to a lesser extent on its
purported link to college student persistence. Some studies have examined how the campus
racial climate affects students' sense of belonging at their institutions, particularly for students of
color (Johnson et al., 2007a; Nuñez, 2009; Strayhorn, 2008). In examining the antecedents of
Latino college students’ sense of belonging, Hurtado and Carter (1997) found that perceptions of
a hostile racial climate on the second year of college, directly and negatively impacted Latinos'
perception of belonging in their junior year. The authors noted that "Latino students are less

37
likely to feel part of the campus community if they perceive racial tension or have experienced
discrimination" (p. 337). These experiences have the potential to hinder their academic and
social development. However, they noted that early, positive transition experiences, as well as
memberships in socially and religiously-oriented campus organizations can facilitate and
enhance belonging in the later years.
In a related study, Locks, Hurtado, Bowman, and Osegura (2008) assessed how sense of
belonging was influenced by the quality of peer relationships associated with diversity on
campus for White students and students of color. Results suggested that frequent and positive
interactions with diverse students were positively associated with a higher sense of belonging.
Perceived racial tension, on the other hand, negatively impacted belonging. The study also
found an indirect, but positive effect between the number of hours students spent socializing per
week on sense of belonging, mediated through positive diverse peer interactions. Similar
findings were reported by Hurtado, Han, Saenz, Espinosa, Cabrera, and Cerna (2007) for White
and underrepresented minority science and non-science students. The value of experience with
diversity was also found to be significant in a study by Maestas, Vaquera, and Muñoz Zehr
(2007). Specifically, socializing with students different from themselves and holding positive
perceptions toward affirmative action significantly accounted for a portion of the variance on
sense of belonging. Additionally, the authors found that being socially involved in a fraternity or
sorority, holding a leadership role in a student organization, faculty expressing interest in
students' development, and living on campus, were all predictors of sense of belonging.
Similarly, Strayhorn (2008) found that grades, hours spent studying per week, and
interactions with diverse peers predicted sense of belonging among Latino students attending

38
four-year institutions. The same was true for white students, albeit hours reported studying
negatively predicted belonging.
Sense of Belonging, Student Persistence, and the Classroom Experience
Sense of belonging has also been referred to in select college persistence literature to
account for students’ decisions to remain or stopout from college. Haussman, Ye, Schofield, and
Woods (2009) contended that students’ “subjective sense of belonging” to the institution is
conceptually and empirically distinct from “behavioral indicators of participation” (p. 650), such
as academic and social integration, advanced by various researchers including Spady (1971),
Tinto (Tinto, 1987, 1993), and Cabrera and colleagues (Cabrera et al., 1992a; Cabrera et al.,
1993). Hausmann et al., specifically noted that “when students become integrated into the social
and academic systems of the university, they develop a psychological sense of belonging to the
university community” (p. 650). This statement directly contradicts recent arguments advanced
by Vincent Tinto who has noted that students’ sense of belonging, not integration, may better
explicate how college students make meaning of the interactions they have with the academic
and social systems of the college and how students’ perceived sense of belonging, in turn
influences retention and persistence decisions; in fact, Tinto explicitly advocates for abandoning
the often misunderstood, misused, and mismeasured concept of “integration” in retention
research (as reported in Wolf-Wendel et al., 2009).
As noted earlier, some authors contend that sense of belonging is inextricably linked to
college student retention, and in some instances, it has been described as critical in retaining
students (Hoffman et al., 2002; Hurtado & Carter, 1997; Rhee, 2008), especially students of
color (Maestas et al., 2007). Hausmann, Ye, Schofield, and Woods (2009) sought to determine if
an intervention designed to increase African American and White students' sense of belonging

39
would impact their level of commitment to college and persistence. Their study found that the
intervention was only effective in increasing White students' sense of belonging. However,
sense of belonging was found to have a direct and positive effect on commitment to college, and
an indirect effect on both intention to persist and on actual persistence for both groups. This
said, their results clearly indicated that while belonging significantly contributed to the total
variance in either intentionality to persist or to persistence, there were other factors that most
significantly accounted for these outcomes, including encouragement from family and friends,
institutional commitment, GPA, goal commitment, and academic development. Nonetheless, the
authors concluded that in designing interventions aimed to impact student persistence,
systematically "bolstering sense of belonging" (p. 667) may indeed impact students' behavior.
With respect to the influence of curricular and classroom-based student-peer, student-
faculty interactions, some studies have cited antecedents and correlates of belonging. The
authors of the Sense of Belonging Scales (SOBS; Hoffman et al., 2002), for example, found that
students enrolled in a learning community reported higher degrees of perceived belonging
compared to freshmen students enrolled in a freshman experience seminar across sub-measures.
Specifically, learning community students reported higher levels of support from peers and
faculty, reported greater comfort in the classroom environment, and perceived the faculty as
empathetic and understanding. Authors attributed the higher scores to the increased attention
students received from the learning community faculty and peers.
In a study seeking to assess the influence of classroom-level belonging on campus-wide
belonging, Freeman, Anderman, and Jensen (2007) found that specific instructor characteristics
such as demonstrating warmth and openness toward students, soliciting student participation
during class, and instructor organization positively impacted students’ perceptions of class-level

40
belonging. In turn, perceptions of class belonging, feeling accepted by the university
community, and instructor pedagogical caring predicted students’ university-level belonging. As
the authors noted, it would seem that students’ “sense of social acceptance” from faculty and
peers accounted for much of the variance in perceived belonging.
A Need for Further Elaboration
As evident in the works described above, the literature on sense of belonging is evolving,
but in need of further elaboration. With respect to measurement, the dimensionality of the
construct has been called into question, albeit emerging evidence supports a multidimensional
construct (France et al., 2010; Hoffman et al., 2002; Tovar & Simon, 2010). While the body of
literature is not yet extensive, it has quickly clustered around ethnic minority students'
experiences with the racial campus climate. It is interesting to note that the vast majority of
these studies have focused on the experiences of Latino and African American students, in
comparison to those of White students. Largely absent from this research are other non-White
students (i.e., Asian, American Indian/Native American).
While much has been written about the purported link between sense of belonging and
student retention, there is relatively little empirical evidence to substantiate this connection.
Hoffman et al., (Hoffman et al., 2002) noted that they found "strong evidence for the utility of a
Sense of Belonging instrument and its ability to add to the discipline’s general knowledge about
the factors that contribute to student persistence in college" (p. 251), yet no evidence was
presented in support of this claim. Given the recognition by leading higher education scholars
such as Tinto and Hurtado (Hurtado & Carter, 1997; Tinto, 2006, 2012a, 2012b) that sense of
belonging, rather than integration, may better explain the experiences of college students’
decisions to persist to degree completion, additional research will need to be conducted, and may

41
examine how sense of belonging and persistence are interconnected. It will be especially
important to determine if differential levels and type of belonging experiences to specific others,
or to the college in general will exercise an influence on students’ decisions to remain at the
college (Hurtado & Carter, 1997; Tovar & Simon, 2010).

42
Mattering
Mattering, like sense of belonging, is part of the umbrella of relatedness constructs, and
while it was introduced well over 30 years ago, it has not yet been studied extensively (France,
2011; Hagerty, Williams, Coyne, & Early, 1996). In short, mattering is our subjective perception
and interpretation that we make a difference to others in our lives; that is, when others notice our
presence and validate our actions, we in fact matter. In the context of higher education,
researchers and particularly practitioners, consistently promote the value and impact of mattering
on college student success and retention (Schlossberg, 1989).
Definition of Mattering
Initially introduced by sociologists Morris Rosenberg and Claire McCullough (1981), the
construct of mattering was described as a form of external validation of an individual by others,
both at the interpersonal level and the societal level (Rosenberg, 1985; Rosenberg &
McCullough, 1981). The interpersonal form of mattering refers to mattering to specific others in
our lives, such as our parents, siblings, friends, professors, fellow students. On the other hand, at
the societal level, mattering is manifested in our perceptions of indispensability within given
social institutions such as one’s community, church, our government, university, or to society at-
large.
According to Rosenberg and McCullough(1981), mattering consists of three distinct
elements: (1) attention—the feeling that one commands the interest or notice of others—our
presence and our absence; (2) importance—the belief that others care about what we think, want,
and have to say, or that we serve as their ego-extension—the feeling that others are proud of our
successes, saddened by our failures; and lastly, of (3) dependence—the realization that others
depend or rely on us or our efforts. Subsequent to its introduction by Rosenberg and

43
McCullough, and based on an examination of adults in transition in the college setting,
Schlossberg (1989) proposed that mattering also encompassed a fourth element—appreciation—
the feeling that we are appreciated for our efforts from significant others and those in authority.
Schlossberg, Lynch, and Chickering (1989) described mattering as “the beliefs people have,
whether right or wrong, that they matter to someone else, that they are the object of someone
else’s attention, and that others care about them and appreciate them” (p. 21). Schlossberg and
colleagues noted that to the degree that people perceive they do not matter, they will feel
marginalized or disconnected. Moreover, this sense of insignificance may lead to existential
meaninglessness and social isolation for some people and individuals may question their very
existence and engage in self-destructive behavior (Elliott, Colangelo, & Gelles, 2005; Marshall,
2001; Schlossberg, 1989). In contrast, those who perceive a sense of social purpose and meaning
for their life are more likely to feel significant to key people in their lives (Marshall, 2001),
including to individuals in a college setting (Elliott et al., 2005; France, 2011; France & Finney,
2010; Schlossberg, 1989; Schlossberg et al., 1989; Tovar, Simon, & Lee, 2009).
Mattering has also been described as a “powerful source of social integration”
(Rosenberg & McCullough, 1981, p. 165) that is consistently reinforced by our inter-dependence
with others, and others with us. It arises from the number and quality of interactions we have
with those significant to us, whether we are the object or praise or criticism (Marshall, 2001;
Tovar et al., 2009). Rosenberg and McCullough (1981) also noted that mattering can act as a
motive, sufficient to guide behavior.
Mattering and the Self-Concept
Mattering has also been described as being part of the self-concept and that it exercises
an influence on our psychological well-being (Dixon-Rayle, 2006; Dixon-Rayle & Chung, 2007;

44
Dixon-Rayle & Myers, 2004; Dixon & Kurpius, 2008; Elliott, 2009; Elliott et al., 2005; Elliott,
Kao, & Grant, 2004; Josselson, 1998; Rosenberg, 1985; Rosenberg & McCullough, 1981),
especially during the period of adolescence, young adulthood, and senescence. As will be noted
below, a low self-concept and a low sense of interpersonal and societal mattering has been
associated with depressive symptoms, anxiety, low self-esteem, suicide ideation, and generalized
psychological distress. According to France (2011), “a characteristic of a healthy self-concept is
high feelings of mattering.” In reference to mattering as a component of our self-concept, Elliott
(2009) goes on to state that
the extent to which we believe we matter to others is learned in the socialization
process that teaches us how to be human beings. Different people, with different
socialization experiences, may find themselves at different points along the
mattering continuum. Some may believe that they matter a great deal. They have
experienced the attention, investment and reliance from others. Others may have
learned from the significant others in their lives that they are nearly superfluous in
this world. It is the placement along this dimension that helps to account for
differences in behavior (p. 17).
According to Elliott (2009), there are two specific learned socialization processes that
impact the understanding of the self, and, in turn, influence our perceptions of mattering to
others. These processes are reflected appraisals and social comparisons. Reflected appraisals
are characterized by the reactions we observe in others toward us, how we make meaning of
these reactions, and how we internalize these and “make them our own” (Elliott, 2009, p. 18).
Elliott posits these reflected appraisals account for the strongest source of mattering. The second
socialization process impacting mattering, and thus, our self-concept consists of the social
45
comparisons we draw upon in contrasting ourselves to others and how we internalize these
comparisons. For example, a college student may notice that she/he is seldom called upon by an
instructor to offer her/his input in classroom discussions, while most other students are
frequently engaged by the instructor.
Lastly, Josselson (1998) postulated that mattering is an aspect of identity stemming from
interpersonal interactions that result in validation from others to create a sense of certainty about
our identity. In other words, without that connection with others, there would not be a sense of
mattering or complete sense of self or realized self. “To know that in some way we are a
significant part of the lives of those around us is essential to the way we value ourselves and
understand our place in the social order” (Elliott et al., 2005, p. 224).
The Study of Mattering
Despite the fact that the construct of mattering was introduced to the literature just over
30 years ago, it has garnered relatively little attention as evidenced in the number of works
published in social science, health science, and higher education peer reviewed journals. The
study of mattering has primarily focused on aspects of psychological and physical wellness (e.g.,
Corbière & Amundson, 2007; DeForge, Belcher, O'Rourke, & Lindsey, 2008; Elliott et al., 2005;
Elliott et al., 2004; Josselson, 1998; Lewis & Taylor, 2009; Marcus, 1991; Powers, Myers,
Tingle, & Powers, 2004; Raque-Bogdan, Ericson, Jackson, Martin, & Bryan, 2011; Schieman &
Taylor, 2001; Taylor & Turner, 2001), life and job satisfaction (e.g., Connolly & Myers, 2003;
Corbière & Amundson, 2007; Goodman, Schlossberg, & Anderson, 2006), the adolescent
experience (e.g., Dixon-Rayle, 2005; Dixon-Rayle & Myers, 2004; Dixon, Scheidegger, &
McWhirter, 2009; Dixon & Tucker, 2008; Elliott, 2009; Mak & Marshall, 2004; Marshall, 2001,
2004; Marshall & Lambert, 2006; Rosenberg & McCullough, 1981), and to a lesser degree on

46
college students and student outcomes (e.g., Butcher, 1997; Dixon-Rayle & Chung, 2007; Dixon
& Kurpius, 2008; France, 2011; France & Finney, 2010; Gibson & Myers, 2006; Gonzalez,
1989; Gruber, Kilcullen, & Iso-Ahola, 2009; Hawk & Lyons, 2008; Isaacson, 2009; Kodama,
2002; Marshall, Liu, Wu, Berzonsky, & Adams, 2010; Myers & Bechtel, 2004; Phillips, 2005;
Schlossberg, 1989; Tovar et al., 2009). Moreover, the number of attempts devoted to the
development and validation of mattering-related measures have been few (Elliott et al., 2004;
Marcus, 1991; Marshall, 2001; Rosenberg & McCullough, 1981), including those devoted to
assessing the unique experiences of college student populations (France, 2011; France & Finney,
2010; Schlossberg, LaSalle, & Golec, 1990; Tovar et al., 2009). Additionally, with the exception
of mattering measures introduced within the last 10 years, the construct validity of the earlier
works has been questioned, especially in light of scant supportive evidence on their development
(Elliott et al., 2004; France, 2011; Tovar et al., 2009).
In the sections that follow, I first discuss some psychologically-oriented works that
examine how mattering impacts relationships to significant others, and the association between
mattering, self-esteem, stress, depression, suicidal ideation, among other forms of psychological
distress. I will then elaborate on works pertaining to higher education settings and student
outcomes.
Psychological Correlates of Mattering
At its most basic level, the quality and type of interactions individuals hold with others,
along with their gender socialization, and ease of transitioning through various stages of
development, will likely impact the mattering experience. In a series of studies conducted by
Marshall (2001, 2004) and Marshall and colleagues (Mak & Marshall, 2004; Marshall &
Lambert, 2006; Marshall et al., 2010), researchers consistently found that females perceived

47
themselves as mattering more to their parents, friends, and to their romantic partners, in
comparison to men in the studies. Moreover, regardless of gender, adolescent and young adults
perceived themselves mattering more to their mothers than their fathers. Adolescents, in
comparison to young adults, perceived they mattered more to their friends than their fathers.
Having a sense of purpose for life and of relatedness to others was strongly connected
with perceived mattering, as well. Mak and Marshall (2004) noted that “mattering facilitates a
feeling of ‘we-ness’ that serves to socially locate individuals and reduce [feelings of] marginality
and isolation” (p. 481). Marshall (2004) found that mattering to parents and friends exercised an
additive effect (positive or negative) to the psychological well-being of American and Canadian
youth in her study. On the one hand, having a positive mattering experience resulted in
adolescents engaging in decreased levels of “problematic interpersonal behaviour,” (p. 599). In
contrast, perceiving that they did not matter resulted in more frequent and more serious forms of
socially undesirable behavior. These findings corroborate the early works of Rosenberg and
McCullough (1981), who despite not having constructed an empirically validated measure of
mattering, found low to moderate correlations between mattering to parents and various forms of
youth delinquency (ranging in type, frequency, and seriousness), including theft and vandalism.
Of import to this literature review are also Rosenberg and McCullough’s findings establishing
low to moderate correlations with psychological sympomotology, including depression, worry,
somatic symptoms, and anxiety, with low levels of perceived mattering. This was particularly
the case for low socioeconomic status adolescents, compared to those from middle class, and
especially those from more affluent backgrounds, who reported significantly higher levels of
mattering.

48
Given the significant importance of adolescence in establishing our self-identity and self-
esteem, researchers have emphasized the need for significant others to systematically create and
support interventions that will enhance perceptions of mattering during adolescence, including at
home and at school (Dixon-Rayle, 2005; Dixon-Rayle & Myers, 2004; Dixon et al., 2009; Dixon
& Tucker, 2008; Elliott, 2009; Rosenberg & McCullough, 1981). Recent findings from Marshall
and Lambert’s study (2006), suggests that mattering is not a global and stable trait, but rather it is
malleable, subject to how individuals make meaning of the interactions they have with others.
Thus, it stands to reason that carefully designed interventions by school counselors, by
concerned teachers and parents can go a long way in facilitating adolescent development.
Other research conducted with adult populations has also found associations between low
levels of mattering and psychological distress. For example, in a community-based study
assessing the impact of personal resources (coping mechanisms to environmental stressors) held
by individuals, DeForge and colleagues (DeForge et al., 2008) sought to identify which of these
mechanisms predicted depressive symptoms in adults. The authors found that individuals with
the greatest number of depressive symptoms were those who had low self-esteem, lower levels
of perceived belonging and mattering to those around them—even after holding constant a
variety of demographic characteristics. The authors noted that by providing support services that
enhance personal resources, chronic stressors could be alleviated. In a similar line of research,
Lewis and Taylor (2009) noted that individuals whose social resources are strong, and
characterized by high levels of support from family and friends, and possessing a strong religious
orientation, was associated with high levels of mattering. The authors found this was especially
true for African American adults who participated in this community-based study, in comparison

49
to White adults. The authors attributed this finding to the notion that African Americans tended
to report higher levels of religiosity and formal membership in religious organizations.
Yet another study by Raque-Bogdan and colleagues (Raque-Bogdan et al., 2011)
supported the need for individuals’ reassurance from others and a capacity for self-
reinforcement. This was demonstrated by significant findings noting that mattering mediates the
relationship between adult attachment orientations (i.e., anxiety, avoidance) and mental health.
The authors specifically noted that high levels of anxiety and avoidance were negatively
associated with perceptions of mattering to others, likely owning to dissatisfaction or worry
pertaining to their relationships with others.
Lastly, in examining the relationship between mattering and suicidal ideation in early- to
mid-adolescent youth, Elliott, Colangelo, and Gelles (2005) found that the likelihood for suicide
ideation decreased significantly for individuals with a strong sense of mattering to others in their
lives. However, this was mediated by self-esteem and the degree of depression experienced.
The authors found that as mattering decreased so did self-esteem; and in turn, the likelihood for
depression increased, and thus, thoughts of suicidal ideation. This was especially true for
younger men and women.
Mattering and the College Student
Nancy Schlossberg first brought to the attention of college practitioners and researchers
the construct of mattering in 1989 (Schlossberg, 1989). Schlossberg’s contribution to the
mattering literature stemmed from her work with adults in transition. Based on this work, and a
series of interviews conducted with adult students over the age of 25, Schlossberg introduced the
element of appreciation to the mattering construct, thereby expanding Rosenberg and
McCullough’s (1981) pioneering works on the subject. Schlossberg also noted that to the degree

50
that individuals perceive they do not matter to significant others or to their colleges and
universities, they will feel marginal or peripheral to the campus community. She further noted
this would be particularly the case for individuals undergoing transitions, from one role to
another, such as students who are just entering college.
Schlossberg further noted that mattering had the potential to influence how and to what
degree college students became involved and engaged at their colleges, and asserted that
individuals from different gender, role status, and social positioning would likely experience
mattering differently. Given the assertion that mattering is a motive with the potential to guide
behavior (Rosenberg & McCullough, 1981; Schlossberg, 1989), Schlossberg and colleagues
(Schlossberg et al., 1989) postulated that “institutions that focus on mattering and greater student
involvement will be more successful in creating campuses where students are motivated to learn,
where their retention is high, and ultimately, where their institutional loyalty for the short- and
long-term future is ensured” (p. 14). France (2011) also has noted that the relationship between
mattering and involvement may be recursive in nature. Both Schlossberg’s and France’s
contentions remain an empirical question in need of investigation. To date, not a single study
has been published in a peer reviewed journal investigating this, or its purported link to college
student persistence, satisfaction, or other student outcomes. However, a few doctoral
dissertations (Isaacson, 2008; Kent, 2004; Sumner, 2012; Wicker, 2004) have attempted to
establish this link with mixed results; albeit these findings can be attributed to a great degree to
poorly designed studies using relatively few participants, thus making it difficult to yield
statistically significant findings; or to studies utilizing instruments lacking construct validity
(e.g., Schlossberg’s Mattering Scales for Adult Students in Postsecondary Education;
(Schlossberg et al., 1990). Despite of this lack of evidence, college practitioners continue to

51
espouse the face value of mattering on college student outcomes (Clark, 2012; MacKinnon-
Slaney, 1994).
In a related line of research, Laura Rendón introduced her theory of validation to higher
education in 1994 (Rendón, 1994). Neither her 1994 study, nor her subsequent work on the
subject (Rendón, 2002, 2006; Rendón et al., 2000) acknowledges the work of Schlossberg in
influencing her thinking on her theory despite the many parallels found in their propositions that
both mattering or validation influence college students’ involvement; or the notion that students
in transition have difficulty connecting to their university (especially nontraditional students); or
that interventions designed to foster a sense of mattering or validation can impact student
success; or the influential and affirming role that institutional agents plays in student adjustment
and learning. In a recent article describing how validation theory has been utilized in research
and practice over the years since its introduction, Rendón Linares and Muñoz (2011)
acknowledged that Schlossberg’s mattering and marginality theory closely reflected elements of
interpersonal validation, including the need for “attention, caring, feeling needed and
appreciated, and identifying with others” (p. 23).
Regardless of how Schlossberg and Rendón conceptualized their works on
mattering/marginality and validation, respectively, both scholars have made significant and
positive contributions to theory development and academic research. In fact, one may argue that
Rendón’s work compliments and extends Schlossberg’s propositions significantly, particularly in
that they speak to the experiences of traditionally underrepresented college students and those
that feel marginalized from higher education communities. Numerous higher education scholars
have recognized Rendón’s contributions to the literature, even when her validation theory has not
garnered the kind of attention of the likes of Vincent Tinto, for example, in explicating why

52
college students stop attending college or why they may experience difficulties (e.g., Barnett,
2010, 2011; Crisp & Nora, 2010; Dowd et al., 2011; Gildersleeve, 2011; Hurtado, Cuellar, &
Guillermo-Wann, 2011; Nora, Urick, & Quijada Cerecer, 2011b; Rendón Linares & Muñoz,
2011; Tinto, 2012a).
According to Rendón (1994), it was the active interest that someone at the college took
upon marginalized students, that “affirmed them as being capable of doing academic work and
that supported them in their academic endeavors and social adjustment” (p. 44) that led to their
being successful while at college. It was this interest and proactive aid on the part of an
institutional agent that fostered their success. Rendón further asserts that “validation has helped
these kinds of students to acquire a confident, motivating, ‘I can do it’ attitude, believe in their
inherit capacity to learn, become excited about learning, feel a part of the learning community,
and feel cared about as a person, not just as a student” (Rendón Linares & Muñoz, 2011, p. 15).
Rendón (1994) posits that validation or validating experiences encompass(es) the
following elements: (1) it is enabling, confirming, and supportive; (2) it fosters student learning;
(3) it facilitates the process of student development; (4) occurs in-and-out of the classroom; and
(5) it has a greater potential to effect student development when offered early in the college
student experience. Rendón (2002) further asserts that validating experiences may be of two
types: academic and interpersonal, generally carried out by caring institutional agents who are
expected to act upon first, without students seeking these validating opportunities.
With respect to involvement, Rendón (2006) noted that it differs from validation in the
following way:
The notion of involvement leans toward students taking the initiative to get
engaged on a campus that offers services and programs for students to get

53
involved. However, validation does not assume students can form connections on
their own and asks college faculty and staff to take the initiative in reaching out to
students to assist them to learn more about college, believe in themselves as
learners, and have a positive college experience (p. 5).
Like students who perceive they do not matter to their colleges and universities or to
institutional agents, students who have experienced “invalidating” experiences are more likely
not to become involved or engaged at the college, nor to partake of programs and services
designed to facilitate their success (Rendón, 2006). Furthermore, as Tovar, Simon, and Lee
(2009) noted, how students relate to institutional agents such as counselors, professors, and
other college personnel can, in fact, positively affect students interpersonally and academically.
They may do this by demonstrating directly how important students are to them individually, or
to the college, and how they rely on them to contribute to the successful experiences of the class
or to other students. They further discuss how a thoughtful instructor will readily make students
aware that their contributions are valued, even when these are not always of the best quality; they
will communicate their appreciation to the student for having the courage to participate. In short,
if students perceive they matter (or feel validated), they will be more likely to participate; they
will become part of the “we”—participative classroom culture—versus the “they”—observer
classroom culture. Also as noted by several other scholars, faculty may instill in students a sense
of mattering and facilitate their learning by listening to them, eliciting their input, and
recognizing their achievements—regardless of how small they may be (Huff, 2009; Hult Jr.,
1979; Rendón Linares & Muñoz, 2011; Schieferecke, 2009; Wentzel, 1997). Similarly, within
the context of counseling, the relationship between the student and counselor or advisor in the
co-curricular environment also has the potential to positively impact the student. Being attended

54
to and having students’ specific needs met is likely to foster a greater sense of mattering and
connection to the institution (Tovar et al., 2009).
Research on mattering with college students continues to slowly propagate. Much of this
research supports findings from the adolescent and older adult studies previously discussed. For
example, Dixon-Rayle and Chung (2007) sought to determine, if and how, perceptions of
mattering among freshmen college students were associated with perceived support from their
college friends and their families, as well as their academic stress. The examination of social
support from significant others and college stress follows several scholars’ assertions that family
and friends can play a significant role in college student transition and adjustment (Bean &
Eaton, 2000; Bean & Metzner, 1985; Cabrera et al., 2012; Hagedorn et al., 2001; Rendón, 1992;
Rendón et al., 2000; Tinto, 1993). Dixon-Rayle and Chung’s study found that perceived social
support from family and friends, positively predicted levels of mattering to college friends. In
turn, perceptions of mattering to college friends also predicted mattering to the institution, a
finding consistent with previous studies (Rosenberg & McCullough, 1981; Schieman & Taylor,
2001). Moreover, Dixon-Rayle and Chung’s findings illustrated how perceptions of mattering
influenced academic stress among college students, particularly for female students who
experienced higher stress levels. Thus, these findings lend further support to the notion that
institutional support, and support from faculty, counselors, and other college students may help
increase feelings of mattering and to decrease the seriousness of academic stressors.
Also consistent with previous studies suggesting that feelings of mattering arise “from
social exchanges that promote a sense of belonging, identity, and commitment” (Taylor &
Turner, 2001, p. 311), and from perceived support from institutional agents (Dixon-Rayle &
Chung, 2007; Rendón, 2002), Tovar et al., (Tovar & Simon, 2010; Tovar et al., 2009) found that

55
mattering to the college, to faculty, counselors, and other students, moderately correlated with
various aspects of sense of belonging at their college; including perceived peer support,
perceived faculty support/comfort, perceived classroom comfort, empathetic faculty
understanding, and decreased feelings of isolation. The study also found that Asian students
generally reported lower levels of mattering in comparison to African American students who
reported higher levels of mattering. The study did not investigate the potential reasons for this
development.
In an earlier study, Tovar, Simon, and Fujimaki (2008) examined the impact of pre-
college student characteristics, transition to college experiences, academic factors, and socio-
academic integrative experiences on American and international students’ perceptions of
mattering to their college (a two-year institution). Collectively, these clusters of variables
accounted for 47% and 42% of the variance in college mattering, respectively. Of importance to
this review of the literature, and consistent with Dixon-Rayle and Chung’s (2007) previous
findings, college transition support from family, friends, and the institution, positively predicted
mattering to the college for both American and international students. The study also found that
socio-academic integrative experiences accounted for the largest proportion of mattering. For
American students, the ability to relate to diverse students was reported as the largest predictor,
followed by the degree of perceived relatedness to instructors, the number of times students met
with instructors outside of class, the degree of relatedness to counselors, number of hours
engaged on campus activities, holding discussions of a personal nature with instructors, the
number of times they met with counselors, and hours spent studying. For international students,
only three predictors were statistically associated with perceived mattering to their college.
These included the degree of relatedness to diverse students, the number of hours engaged on

56
campus activities, and the degree of relatedness to instructors. Given these findings, Tovar et al.,
(2008) concluded that students’ perceptions of mattering are substantially enhanced based on the
quality, and in some cases, the quantity of interactions they have with individuals at the college
including instructors, counselors and diverse students. The authors further noted that the single
most important predictor of mattering to the college for American and international students was
their ability to relate to individuals different from themselves—race, ethnicity, gender. These
findings also reinforced the positive impact of diversity among college students as evidenced in a
growing body of literature (as reviewed by Pascarella & Terenzini, 2005). This is especially
important considering that international students frequently experience a variety of acculturative
stress when coming to the United States, and interactions with other students can facilitate their
transition and adjustment (Pedersen, 1991; Poyrazil, Kavanaugh, Baker, & Al-Timimi, 2004).
Moreover, the findings also lend support to the notion that early socialization with diverse
students enhances sense of belonging to their college (Hausmann et al., 2007). Lastly, Tovar and
colleagues’ findings suggest that high levels of relatedness to institutional agents, evidenced in
how available, close, and friendly they are toward students, and how often they meet with them
to discuss matters that extend beyond the classroom, substantially and positively mediate
perceptions of mattering to the college.
Similarly, in a study seeking to validate the psychometric properties of a measure
assessing students’ sense of validation, Hurtado et al. (2011) found racial differences in students’
perceptions of academic and personal validation at 14 institutions, including two and four-year
institutions. Specifically, they noted that White students, in comparison to students of color,
reported higher levels of interpersonal validation, and much higher in academic (classroom-
based) validation. Given this, the authors noted that institutions have an obligation to quickly

57
assess students’ experiences in the classroom environment, especially when “prejudiced faculty
and staff” (p. 67) may influence the alienation of underrepresented students, and then identify
key supportive agents who may counteract the effects of negative, non-validating experiences.
Mattering and Student Persistence
As noted earlier, Schlossberg (Schlossberg, 1989; Schlossberg et al., 1989) and Dixon-
Rayle and Chung (2007) contend that mattering and student retention/persistence are intricately
interrelated. This claim has also been made of validation by various researchers (Barnett, 2006,
2010, 2011; Hurtado et al., 2011; Nora et al., 2011b; Rendón, 1994). However, their works do
not provide empirical evidence to support this claim. Relatively few studies have sought to
undertake this line of research. Chief among these is Kent (2004), whose doctoral dissertation
provided some evidence supporting the above hypothesis. Kent sought to determine if
contextualized perceptions of mattering of adult university students over the age of 25 had an
effect on their persistence, for males and females, and students enrolled in the arts and sciences
and those in health/performing-visual arts/business programs. While Kent does not explicitly
state in her study that her research encompassed junior and senior-standing students, this appears
to be the case considering that Kent defined “persisters” as students who completed their first
baccalaureate degree in “Year Two,” of what likely refers to the span of her study. Kent utilized
Schlossberg’s Mattering Scales for Adults in Postsecondary Education (MSAPE), which as has
been noted earlier, has been criticized for lacking evidence of construct validity (France, 2011;
France & Finney, 2010; Tovar et al., 2009). Despite these limitations, Kent reported that
students who persisted to degree completion had higher scores in four of the five mattering
subscales encompassing the MSAPE. Namely, administration, interactions with peers, multiple
roles, and interactions with faculty; albeit, there were no statistically significant differences by

58
gender and program of study. As may be discerned from subscale titles, these assessed the
importance of the interactions of college students with either the campus environment or with
specific others. Kent concluded her findings provided evidence of how specific college policies
and practices that support and enhance college persistence, as evidenced in the mattering scores
obtained by persisters and non-persisters. However, she also questioned if the MSAPE truly
measured perceptions of mattering.
In the case of validation, Elizabeth Barnett’s research provides some evidence of the
association between academic validation and community college students’ intention to persist to
the following semester. Barnett reported that students reporting higher levels of validation from
faculty were also more likely to express higher levels of intention to persist, especially students
of color and older students (Barnett, 2006, 2010, 2011). However, this relationship appeared to
be mediated by students’ sense of integration at the institution. Barnett defined “integration” as a
“sense of ‘competent membership resulting from… student interaction with faculty and staff”
(Barnett, 2011, p. 197). While Barnett’s studies provide limited support on the influence of
academic validation on students’ intent to persist, no study has yet provided empirical evidence
of its influence on actual student retention or persistence.

59
Conclusion: Summary of the Literature
Four bodies of literature were reviewed in some detail above. These included empirical
and theoretical works on college student retention and persistence, engagement/involvement,
sense of belonging, and mattering/validation. Each of these areas of the literature has been
studied across institutional settings and with students of varying characteristics. While hundreds
of studies related to college student persistence and involvement have been published over the
last 40 years since Spady, Tinto, and Astin published their seminal works (Astin, 1984; Spady,
1970, 1971; Tinto, 1975), many of these studies are both methodologically sophisticated and
well designed, while others are rather limited in design, sophistication, and generalizability.
Other areas of the literature such as sense of belonging, engagement, and mattering/validation
are relatively new and only begun to attract scholarly attention since the late 1980s (Hurtado &
Carter, 1997; Kuh, 2001; McClenney, 2004; Rendón, 1994; Schlossberg, 1989); thus, the number
of studies available remain limited.
Common to all areas of the literature topics reviewed, is the contention that students who
go on to persist from their first-to-second year of college or through degree completion are those
students who had successful transition experiences from high school to college; those who found
support from family, friends, and the institution itself during the crucial first few weeks of
college. Moreover, it is those students who find a place for themselves in a college environment
free of hostility, where they interact with diverse peers, with supportive and engaging faculty and
other institutional agents who provide the moral, emotional, social, and academic support needed
to succeed in college that have the greatest probabilities to complete their educational endeavors.
Obviously, students’ ability to engage, to become involved, to remain committed to their
educational goals, and to partake of all the support resources available at the institution is of

60
utmost importance. The ability to cope with myriad stressors and to seek assistance from those
“in the know,” will also enhance their opportunities for success. The works reviewed above also
noted the responsibility for institutions to anticipate, design, and front-load during the first-year
of college, in particular, various resources designed to engage students academically, socially,
and emotionally. Without carefully designed resources and direct outreach to students, many
will simply not develop a sense of belonging to their institution; poor interactions and
invalidating experiences with institutional agents and with the college environment itself will
increase the likelihood for withdrawal.
While the works discussed above have studied the impact of integration, involvement,
sense of belonging, validation, and mattering on select student outcomes, this literature review
uncovered that not a single study to date, has attempted to study the collective impact of these
constructs on students’ intention to persist or actual persistence. Hence, there is an opportunity
to engage in academic research to address this shortcoming in the higher education literature, and
this dissertation undertakes this initial step. The works discussed in this literature review,
directly and indirectly support the inter-relationships among these and other constructs with
persistence, as illustrated in Figure 1 (Chapter 3).

61
CHAPTER 3
METHODOLOGY
Chapter 3 discusses in full detail the methodology employed in this study. It begins by
describing the source of the data and sampling procedure; it then presents the conceptual model;
it discusses several conceptual model propositions, the variables encompassing the model, and
the hypothesized directionality of each path. Following this elaboration, the research questions
and corresponding hypotheses guiding this study are noted. Lastly, it discusses additional details
concerning the research methodology characterizing the study, including the research design and
data analyses conducted.
Data Source
Data for this study came from an archival database held by the author. These data stem
from a sabbatical research study conducted in the spring of 2007. The purpose of the original
study was to assess the factorial validity of the College Mattering Inventory (Tovar et al., 2009)
and later the Sense of Belonging Scales (Tovar & Simon, 2010). Data collection took place after
securing approval from two institutions’ research review boards: a large public community
college (Carnegie category: associate level, public, urban serving, single campus) and a public
university (Carnegie category: master’s level, large, urban). Only data for the community
college were utilized in this study. Data for the study was formatted in an SPSS file consisting
of approximately 276 variables covering such areas as mattering, sense of belonging, relatedness,
interactions with counselors and instructors, involvement in student activities and academics,
transition to college experiences, and multiple demographic variables. Only variables noted in
Table 1 and select demographic variables were extracted to form a working file for the present
study.

62
Sampling
Following approval from the Institutional Research Board at the community college, the
Institutional Research office generated a database of 7,500 randomly selected, currently enrolled
students 18 years of age or older. The database contained e-mail addresses and select
demographic characteristics. E-mail invitations were sent on behalf of the researcher by the
Information Technology office to these students asking them to participate in a 45-minute online
survey during week 11 of a 16-week semester. The email included instructions on how to
partake in the survey, namely “clicking” on the URL provided in their email. Students were
informed in the email, and later in the survey, that participation was voluntary. Students were
offered the opportunity to enter a drawing for an iPod Shuffle, as incentive to participate. Two
e-mail reminders were sent one week apart. A total of 2,347 (31.3%) students responded to the
survey request. However, only 2,200 (93.7%) students completed the survey sufficiently enough
and answered several validity check items to render their responses suitable for the study. Those
deemed incomplete generally did not provide responses to more than 10-15% of the survey
items, or answered the validity check items in a manner that did not conform to instructions
(e.g., “Answer #4 for item M50”), leading the researchers to believe responses were randomly
provided.
Conceptual Model
While the works discussed in the literature review (Chapter 2) have studied the impact of
integration, involvement, sense of belonging, validation, and mattering on select student
outcomes and student populations in a variety of models, not a single study has been published to
date attempting to study the collective impact of these constructs on students’ intention to persist
or actual persistence at either two-year or at four-year institutions. Moreover, no other study has

63
attempted to examine if constructs such as engagement/involvement, sense of belonging,
mattering, perceptions of the campus climate, and peer relationships might form part of an
overarching construct. This study attempts to address these important gaps in the community
college literature and examines the inter-relationship among these and other constructs on intent
to persist.
The conceptual model as depicted in Figure 1, is grounded on Astin’s
Input-Environment-Outcome (I-E-O) college impact model (Astin, 1991a, 1993). The I-E-O
model posits that various college outcomes (O), such as student persistence, are mediated by
students’ pre-college characteristics and experiences (I), as well as, their actual experiences
while in college (E). By using the I-E-O framework, this study acknowledges the impact that
pre-college student characteristics and students’ interactions with the college environment have
on student outcomes. Critics of higher education research have noted that researchers do not
always state how concepts such as involvement, engagement, integration, and sense of belonging
are used in their research—that is, they do not explicitly state how these concepts are “viewed”
in the context of inputs, environment, or outcomes; this study utilizes these constructs as
reflections of the college environment, as originally intended by those introducing the concepts
(Wolf-Wendel et al., 2009).
Accordingly, four variables serve as “inputs” in the model—college transition support
from family and friends, financial concerns in completing college, gender, and unit load.
Next, seven latent factors and three single indicator items are included to represent
student interactions with the college “environment,” which are hypothesized to directly or
indirectly affect intent to persist. These include institutional commitment to students,
interactions with diverse peers, perceptions of a hostile campus climate given a select set of

64
individual characteristics, perceptions of mattering, sense of belonging, engagement/involvement
experiences, socio-academic integrative experiences, goal commitment, length of college
attendance, and grade point average. Environmental experiences are under the influence or
direct control of the institution and its institutional agents (Astin, 1991b).
Lastly, intent to persist serves as the single “output” or dependent variable in the model.
While no conceptual framework or theory will likely account for the experiences of every
student attending college, the conceptual model in Figure 1 sought to explore its relevance to
college students by accounting for various input and environment variables on student
persistence. The works discussed in the literature review, as well as others noted below, were
thought to theoretically support the interrelationships modeled in Figure 1—directly or
indirectly. The hypothesized directionality of construct impact was based on the works
reviewed; albeit, these did not universally or explicitly posit directionality; sometimes
directionality was implied; or works contradicted each other. Straight, single-arrow lines denote
hypothesized causal relationships among the constructs.

65
Input Environment Output
Figure 1. A Conceptual Model on the Impact of Mattering, Sense of Belonging,
Engagement/Involvement, and Socio-academic Integrative Experiences on Intent to Persist

66
Conceptual Model Propositions
At the heart of the model, is the proposition that perceived institutional commitment to
students directly or indirectly impacts student perceptions of mattering, sense of belonging,
institutional engagement/involvement, socio-academic integrative experiences, goal
(educational) commitment, and ultimately intent to persist. The model further contends that:
a) Institutional commitment to students is demonstrated in the actions taken by the college
to facilitate college transition and adjustment. This is further shown by actions and
behaviors exhibited by institutional agents such as instructors and counselors in their
ongoing interactions with students that facilitate student development in a positive
learning environment. Institutional commitment will in turn influence goal commitment,
perceptions of mattering, sense of belonging, and intent to persist.
b) To the degree that students perceive a high level of institutional commitment, and have
positive relationships with racially/ethnically diverse peers characterized as close,
friendly, supportive, and available, their sense of belonging to the institution will be
enhanced. Having hostile experiences with others at the institution owning to personal
characteristics (i.e., gender, race/ethnicity, sexual orientation, age) that result in feelings
of alienation will deleteriously affect sense of belonging. A positive sense of belonging
has the potential to influence student intentions to persist.
c) Perceptions of mattering to the college will be influenced by institutional commitment to
students, by positive interactions with diverse peers, and by a positive campus climate.
In turn, perceptions of mattering to the institution will enhance students’ sense of
belonging, and facilitate engagement/involvement, and socio-academic integration.

67
d) Student involvement in campus activities and engagement in educationally beneficial
activities promoting leadership skill development and community service will enhance
feelings of belonging to the institution, and facilitate socio-academic integration at the
institution. Involvement has the potential to influence intent to persist.
e) Socio-academic integrative experiences such as meeting with instructors and counselors
outside of class, spending time studying/researching, and participating in academically
rigorous and supportive programs will directly and positively impact student’s intentions
to persist. Integrative experiences may be partially influenced by the support students
receive from family/friends, by perceived mattering to the institution, and their
involvement at the institution.
f) Institutional commitment to students, perceived mattering and sense of belonging to the
institution, engagement/involvement, socio-academic integrative experiences, and goal
commitment will influence student intent to persist.
Variables in the Model and Support from the Literature
Immediately below, select literature is discussed to provide context for the hypothesized
relationships depicted in Figure 1. Table 1 presents the variables composing the entire model,
along with the coding scheme employed.
Input Variables (Exogenous)
Transition Support from Family and Friends. Research suggests that the transition to
college after high school graduation is complex and often difficult (Terenzini et al., 1994; Tinto,
1993). This is especially true for first generation college students, traditionally underrepresented
ethnic minorities, low income students, and developmental education students. Given student
background characteristics, the degree of “match and fit” between the student and the institution,

68
and the support received within and outside the college may facilitate their adjustment,
involvement, integration, and commitments, which in turn may influence decisions to remain or
prematurely leave college (Astin, 1993; Pascarella & Terenzini, 1991, 2005; Terenzini et al.,
1994; Tinto, 1975, 1993). Having the support of family members and friends to attend college
has been found to directly impact institutional and goal commitments, intent to persist, and actual
persistence, albeit often mediated thorough various intervening variables (Allen & Nora, 1995;
Hurtado & Carter, 1997; Nora et al., 2005; Nora & Cabrera, 1993; Rendón et al., 2000; Strauss
& Volkwein, 2004). Several scholars have noted that maintaining family ties, characterized by
strong support for students while at college, exercises an indirect effect through institutional fit
or institutional commitment on intent to persist (Cabrera et al., 1992a; Hurtado & Carter, 1997;
Torres, 2006).
Transition support from family and friends is operationalized in this study via a
composite variable averaging responses to two questions asking students their level of agreement
that family and friends have been supportive of them in attending college.
Financial Concerns. Students’ concern over paying for college has been cited as not
only impacting college attendance, but also their ability to engage in out-of-the classroom
curricular, co-curricular activities, and student activities (Bailey & Alfonso, 2005; Barnett, 2011;
Bean & Metzner, 1985; Cabrera, Nora, & Castañeda, 1992b; Gildersleeve, 2011; Hurtado et al.,
2011; Nora et al., 2011b; Rendón Linares & Muñoz, 2011; Wood, 2012). This is especially true
when students’ (and families) financial resources are limited and the student must work off-
campus to provide financially for him/herself, and in many cases to help support their families.
Lacking financial assistance in the form of institutional, state, or federal grants have a negative
impact on persistence for impacted minorities, first generation, and low income students;

69
whereas, concerns over loan attainment and repayment discourages students from attending
college (Chen & DesJardins, 2010).
Financial concerns is operationalized in this study via a single item asking students to
note their level of agreement that finances have been a significant obstacle while attending
college.
Gender and Race/Ethnicity. Gender and race/ethnicity are used in the model primarily as
control variables, albeit research on mattering has found gender differences across several
studies, with females generally perceiving higher degrees of mattering in relation to specific
others and to their colleges (Dixon-Rayle, 2005; Marshall, 2001; Schieman & Taylor, 2001;
Schlossberg, 1989; Tovar et al., 2008). With respect to ethnic minority students, there is a
significant body of literature examining their experiences with the college environment, peer
interactions, student-instructor interactions, etc. Some of this research demonstrates that
traditionally underrepresented ethnic minority students have a more difficult time transitioning to
the college environment, often experience discriminatory, hostile, and invalidating interactions
with peers and institutional agents, and tend to persist and graduate from institutions at
significantly lower rates their ethnic “majority” counterparts (e.g., Bensimon, 2007; Huff, 2009;
Hurtado & Carter, 1997; Hurtado & Ponjuan, 2005; Johnson et al., 2007b; Kraemer, 1997; Locks
et al., 2008; Rendón, 1994; Seidman, 2005; Snyder & Dillow, 2011).
Gender is dichotomously coded in this study. The impact of race/ethnicity will be
examined in the model via a series of multiple group invariance analyses for the resulting model.
While all ethnic groups will be incorporated into the omnibus model, invariance analyses will be
conducted for Asian/Pacific Islander, Latino, and White students. However, separate analyses

70
for African American and American Indian/Alaskan Native students were not possible given
their small samples.
Unit Load (exogenous). Much of the higher education literature speaks about the benefits
of attending college on a full-time basis. In most instances, this means carrying a minimum of
12 units per semester. With respect to community college students, full-time attendance has
been associated with higher retention and persistence rates for first-year and second-year
students (Crisp & Nora, 2010; Feldman, 1993; Snyder & Dillow, 2011).
Unit load is operationalized as the number of units in which students enrolled at the time
data was collected.
Environment Variables (Exogenous and Endogenous)
Length of College Attendance (exogenous). This variable serves as a control in the
model. As noted elsewhere, the dataset used in this study included students attending
community college for the first time and beyond. It is likely that student intent to persist differs
by length of attendance, hence the need to control for this background characteristic.
Length of college attendance is operationalized through a single question asking students
how many spring and fall semesters they have attended college.
Grade Point Average (exogenous). GPA is used as a control variable. However,
research on community college students has shown that second year GPA predicts student
persistence and degree attainment into the third year of college (Crisp & Nora, 2010).
GPA is operationalized through a single question asking students to report the GPA they
had achieved up until the time the data was collected. The GPA for first time college students
was obtained from institutional records.

71
Institutional Commitment to Students (exogenous). Tinto (1993) noted institutional
commitment in student retention research takes two forms: student commitment to the institution
and institutional commitment to the student. Tinto specifically noted that “The mirror image of
individual commitment to the institution is the commitment of the institution, as exhibited to the
behaviors of its faculty and staff, to the individual” (p. 208). This commitment is reflected in the
“ethos of caring,” characterizing the institution. Furthermore, Tinto asserted that the institutions’
commitment to students reinforces students’ commitment to the institution. Despite the fact that
institutional commitment has garnered much attention in the literature and has been incorporated
into various persistence models as a mediator between student background characteristics,
academic and social integration, goal commitments, intent to persist, and persistence (Bean,
1982; Bean & Eaton, 2000; Bean & Metzner, 1985; Braxton, 1999; Braxton, Hirschy, &
McClendon, 2004; Braxton, Sullivan, & Johnson, 1997; Cabrera et al., 2012; Cabrera et al.,
1992a; Cabrera et al., 1993; Spady, 1971; Tinto, 1975, 1987, 1993), little research has been
conducted specifically assessing the impact of institutional commitment to students on intent to
persist or persistence (Braxton et al., 2004; Braxton, Jones, Hirschy, & Hartley Iii, 2008; Jones,
2010). Furthermore, Braxton et al. (2004), noted that the organizational influence on student
departure from institutions is partially manifested in their commitment to student welfare.
Institutional commitment to students is reflected in the actions of administrators, faculty, and
staff that affect students. These may include expressing a genuine interest in students and their
development, positive relationships characterized by respect, and supportive institutional
policies. Braxton and colleagues noted that the higher the level of commitment to students, the
greater the likelihood for social integration, which in turn reinforces students’ commitment to the
college and to persist. This proposition was empirically supported by Braxton et al. (2008), who

72
found a strong association on social integration. Similarly, Jones (2010) found a strong positive
association between institutional commitment to students and subsequent student commitment to
college. Given the few studies assessing the impact of institutional commitment to students, this
study seeks to bridge this gap in the literature by examining its impact on factors such as
mattering, sense of belonging, engagement/involvement, socio-academic integrative experiences,
goal commitment, and ultimately intent to persist.
In this study, institutional commitment to students is operationalized via seven items
reflective of actions taken by the college to facilitate students’ transition and adjustment, and by
behaviors exhibited by instructors and counselors in their ongoing interactions with students,
which are thought to facilitate student development in the learning environment.
Interactions with Diverse Peers (endogenous). Research examining the influence of
student interactions with diverse peers on various student cognitive, affective, learning, and
college outcomes is vast (Pascarella & Terenzini, 2005; Smith et al., 1997). Smith and
Schonfeld (2000) have noted that interactions with diverse students decreases prejudice, and both
increases understanding of others and positively impacts academic success. In the case of White
students, they state that interactions with students of a different background has been associated
with such outcomes as satisfaction with college, openness to others, and to cognitive and
learning outcomes. With respect to the model presented in Figure 1, research also suggests that
frequent and positive interactions with diverse students exerts a positive impact on students sense
of belonging to the institution; perceived racial tension and a chilly campus climate, on the other
hand, negatively impact belonging (Hurtado & Carter, 1997; Hurtado et al., 2007; Hurtado &
Ponjuan, 2005; Locks et al., 2008; Maestas et al., 2007).

73
In the context of this study, interactions with diverse peers is operationalized by four
items characterizing student relationships with racially/ethnically diverse peers as friendly, close,
supportive, and available.
Hostile Campus Climate (endogenous). Hurtado and Carter (1997), noted that college
environments are “influenced by a historical legacy of inclusion or exclusion of groups, by the
structural diversity or numerical representation of diverse people, the nature of interactions
among diverse groups, and individual perceptions of the environment” (p. 236). They further
noted that perceptions of a hostile campus climate deleteriously affects retention and persistence
for some students. Research also notes that perceptions of a hostile campus climate deleteriously
impacts students’ sense of belonging; whereas, interactions with others deemed as positive favor
sense of belonging (Hurtado & Ponjuan, 2005).
Perceptions of a hostile campus climate is operationalized in this study via four variables
asking students to rate their level of agreement that they have experienced isolation at their
campus owning to personal characteristics (gender, race/ethnicity, sexual orientation, and age).
Mattering to College (endogenous). Mattering to college has been hypothesized to
impact student involvement on campus and student persistence (Schlossberg, 1989). Research
also contends that a sense of mattering facilitates learning and student development (Huff, 2009;
Hult Jr., 1979; Rendón Linares & Muñoz, 2011; Schieferecke, 2009; Wentzel, 1997). Dixon-
Rayle and Chung (2007) found that perceived support from family and friends, positively
predicted levels of mattering to college friends, which in turn predicted mattering to the
institution. Studies have also found moderate to strong correlations with sense of belonging,
including perceived peer support, perceived faculty support/comfort, perceived classroom
comfort, and decreased feelings of isolation. Of import to this study is the finding that students’

74
perceptions of mattering are enhanced by the quality of interactions with individuals at the
college including instructors, counselors, and diverse students (Tovar et al., 2008). While little
empirical evidence is available to support the premise that mattering exercises an influence on
student persistence, Kent (2004), reported that students who persisted to degree completion
perceived themselves as mattering to the institution, to peers, and faculty, whereas those not
persisting did not. Similarly, research on the related construct of validation has also shown that
academically validating experiences positively impacted intention to persist for students of color
and older students, mediated by integration at the college (Barnett, 2006, 2010, 2011).
With respect to this study, perceptions of mattering to the college are operationalized via
the General College Mattering subscale of the College Mattering Inventory (Tovar et al., 2009).
The subscale assesses general perceptions of mattering to the institution.
Sense of Belonging (endogenous). Research has shown that various
engagement/involvement variables such as participation in select student activities, holding
leadership roles in student organizations, number of hours studied, and demonstrated faculty
interest in students exert a positive impact on sense of belonging to the institution (Hurtado &
Carter, 1997; Hurtado et al., 2007; Hurtado & Ponjuan, 2005; Locks et al., 2008; Maestas et al.,
2007; Nuñez, 2009). As noted above, interactions with diverse peers and perceptions of a hostile
campus climate also affect belonging to the institution. Several works examining students’
perceptions of belonging and attachment have found a positive relationship with intent to persist
and persistence at two-year and four-year institutions (Allison, 1999; Hausmann et al., 2007;
Hausmann et al., 2009; Karp et al., 2010).

75
With respect to this study, sense of belonging is operationalized using the Mattering
versus Marginality subscale of the College Mattering Inventory (Tovar & Simon, 2010), which is
reflective of students’ perceptions of belonging, fit, acceptance or rejection at the institution.
Engagement/Involvement (endogenous). Research on college student involvement and
engagement in educational beneficial practices is vast and continues to evolve. Astin, Pace, Kuh
and many others have noted over the years that student efforts to partake in academic and social
activities supporting their learning and development is linked to college outcomes such as
retention, persistence, and degree attainment (Astin, 1984, 1993, 1999; Kuh, 2006; Kuh et al.,
2008; Kuh et al., 2005; Pace, 1980, 1984; Pascarella & Terenzini, 1991, 2005). Kuh et al. (2008)
found that student participation in co-curricular activities (6-20 hours per week) had a strong
positive effect of second year persistence. Berger and Milem (1999) found that early
involvement (with students or faculty) is strongly connected to social and academic integration,
subsequent commitment to college, and persistence. However, scholars have also noted that
students at community colleges are less likely to be involved in activities traditionally associated
with those of senior universities, and thus we must account for this limitation in student
persistence research (Rendón, 2006; Rendón Linares & Muñoz, 2011). Some studies have found
that younger students attending community colleges are more likely to be involved than older
students, and they are also more likely to report gains in cognitive, social, and personal domains
(Glover & Murrell, 1998; Miller, Pope, & Steinmann, 2005; Schmid & Abell, 2003). Students
who serve as leaders of clubs and of student government organizations have the opportunity to
work directly with administrators, faculty senates, and other constituencies to represent the needs
and concerns of their peers as it applies to institutional policy. In doing so, they develop a
stronger sense of community and belonging to their institution, and form informal relationships

76
with faculty that enable them to integrate into the college community and connect them to
beneficial capital resources that facilitate college completion and transfer (Miles, 2010).
Engagement/involvement in this study is operationalized via three items pertaining to
their involvement in student activities, student government, and in community service.
Socio-academic Integrative Experiences (Endogenous). Research on the academic and
social integration of students to the institution has been the subject of study in hundreds of
studies as noted in the literature review. The operationalization for these two cornerstones of
student retention (Tinto, 1993) has ranged widely and attempts at “precise measurement” have
yielded ever-changing “definitions” of the constructs. Braxton and colleagues argue that social
integration and institutional commitment are two “reliable sources” influencing student
persistence (Braxton, 1999; Braxton & Hirschy, 2005; Braxton et al., 2004; Braxton & Lien,
2000; Braxton & McClendon, 2001). However, it has also been noted that academic and social
integration activities or experiences do not always take place apart from each other, but may co-
occur in and out of the classroom. These “socio-academic integrative moments” transpire during
events or activities when students interact with institutional agents and other students (Deil-
Amen, 2011). Researchers have found that for community college students, student-faculty
interactions of an academic and social nature serve as vehicles for imparting important
information to students, increase their comfort in college, and are precursors to student retention
(Cejda & Hoover, 2010; Deil-Amen, 2011).
This study adopts Deil-Amen’s conceptualization of “socio-academic integrative
moments” in operationalizing academic and social integration. This construct is measured by
eight variables accounting for students’ interactions with institutional agents—instructors and
counselors—hours spent studying/researching, participating in an academically rigorous program

77
characterized by high student-faculty and student-counselor contact, and academic challenges
experienced.
Goal Commitment (Endogenous). Consistent with institutional commitment discussed
above, goal commitment has been the subject of much study and is incorporated into student
persistence models. Goal commitment specifically refers to students; commitment to their
educational or occupational goals (Tinto, 2003). Tinto asserts that initial goal commitment
exercises a direct impact on subsequent goal and institutional commitment, and an indirect effect
on student persistence. Hausmann et al. (2009) found a strong direct effect on intentions to
persist for African American students and a moderate effect for White students. On the other
hand, Cabrera et al. (1992a), found a small effect on intent to persist, but not directly on
persistence. Nora and colleagues also found small to moderate effects between institutional
commitment and goal commitment and academic/social integration and goal commitment.
In this study, goal commitment is operationalized using a single variable asking students
the highest degree they intend to complete.
Output Variables (Exogenous)
Intent to Persist (exogenous). Intent to persist serves as the only output variable in this
study and is operationalized using a single 5-point Likert scale variable asking students to rate
their agreement that no matter what, they intended to complete their educational goal. Such
variable has been used in several studies, including (Bean, 1982; Cabrera et al., 2012; Cabrera et
al., 1992a; Cabrera et al., 1993).
Note should be taken that this study did not examine actual persistence to degree
completion. This data was not available to the researcher. However, the retention literature

78
suggests that intent to persist predicts persistence (Bers & Smith, 1991; Hausmann et al., 2009;
Voorhees, 1987; Webb, 1989).

79
Table 1
Variables in Conceptual Model and Coding Scheme
Variable/Factor Variable
Number in
Dataset
Items Used to Assess Variable
Outcome Variable (Endogenous)
Intent to Persist Q177 No matter what, I intend to complete my educational goal
(Scale: 1 = Strongly Disagree; 5 = Strongly Agree)
Distribution: 4% strongly disagreed, 8% disagreed, 16% neither
agreed nor disagreed, 19% agreed, and 53% strongly agreed. Mean
score is 4.11 (1.16), skewness of -1.12.
Input Variables (Exogenous—Controls)
Unit Load Q125 In how many units did you enroll this semester?
(scaled item; range = 1-23 units)
Gender Q119 0=male; 1=female
Financial Concerns Q180 Finances have been a significant obstacle while attending college
(Scale: 1 = Strongly Disagree; 5 = Strongly Agree)
Transition Support to
College
SupFamFrd Composite of support from family and friends
(Scale: 1 = Strongly Disagree; 5 = Strongly Agree)
Family supportive of attending college
Friends supportive of attending college
Environment Variables (Exogenous)
Length of attendance
(serving as control)
Q126 How many full semesters (fall and spring) have you attended college
(including this spring)?
(1=Only this semester so far; 2=2 semesters; 3=3-4 semesters; 4=5-6

80
Variable/Factor Variable
Number in
Dataset
Items Used to Assess Variable
semesters; 5 = 7 or more semesters)
Grade Point Average
(serving as control)
GPA What is your current GPA?
(0 = Under 2.0; 1= 2.0-2.49; 2 = 2.5 – 2.99; 3 = 3.0-3.49; 4 = 3.5-4.0)
Institutional Commitment
to Students
6 items
(Unless noted, scored with scale: 1 = not at all; 5 = very much)
M59 Counselors at the college generally show their concern for students'
well-being
M17 My counselor is generally receptive to what I have to say
M39 If I had a personal problem, I believe that counselors would be
willing to discuss it with me
M07 It is comforting to know that my contributions are valued by my
instructors
M38 My instructors sometimes ignore my comments or questions (reverse
coded)
Q176 I received all the assistance I needed to successfully transition and
adjust to the college
(Scale: 1 = Strongly Disagree; 5 = Strongly Agree)
Interactions with Diverse
Peers
Q70
Q74
4 semantic differential scale items with 5 answer choices (5/1)
answering to the following prompt: The quality of my interactions
and relationships with students of another race/ethnicity can best be
characterized as:
friendly (5)/unfriendly (1)
close (5)/distant (1)

81
Variable/Factor Variable
Number in
Dataset
Items Used to Assess Variable
Q78
Q82
supportive (5)/unsupportive (1)
available (5)/unavailable (1)
Environment Variables (Endogenous)
Perceptions of a Hostile
Campus Climate
4 Items
(Scale: 1 = not at all; 5 = very much)
M18neg I sometimes feel alone and isolated at the college because of my
gender (reverse coded)
M55neg I sometimes feel alone and isolated because of my race/ethnicity
(reverse coded)
M36neg I sometimes feel alone and isolated because of my sexual orientation
(reverse coded)
M63neg I sometimes feel alone and isolated because of my age (reverse
coded)
Perceptions of Mattering
to the College
General College Mattering Subscale—8 items
(Tovar, Simon, & Lee, 2009)
(Scale: 1 = not at all; 5 = very much)
M48 There are people on campus who are sad for me when I fail in
something I set out to do
M52 Some people on campus are disappointed in me when I do not
accomplish all I should
M53 People on campus are generally supportive of my individual needs
M40 People on campus seem happy about my accomplishments
M62 I sometimes feel pressured to do better because people at the college

82
Variable/Factor Variable
Number in
Dataset
Items Used to Assess Variable
would be disappointed if I did not
M61 There are people at the college who are concerned about my future
M54 There are people at the college who are genuinely interested in me as
a person
M26 Other students are happy for me when I do well in exams or projects
Sense of Belonging
Operationalized via the Mattering versus Marginality Subscale
7 items; (Tovar, Simon, & Lee, 2009)
(All items reverse coded; Scale: 1 = not at all; 5 = very much)
M31 Sometimes I feel alone at the college
M30 Sometimes I feel that no one at the college notices me
M56 I often feel socially inadequate at school
M08 Sometimes I feel that I am not interesting to anyone at the college
M32 Sometimes I get so wrapped up in my personal problems that I isolate
myself from others at the college
M34 I often feel isolated when involved in student activities
M49 I often feel that I do not belong at this college
Engagement/Involvement 3 items answering to the following prompt:
On average, how many hours per week do you spend on the following
activities?
(Scale: 1=None; 2=1-5; 3=6-10; 4=11-15; 5=16-20; 6=21-30; 7=31-
40; 8=41+)
Q129 Campus activities (e.g., student clubs, organizations, events on

83
Variable/Factor Variable
Number in
Dataset
Items Used to Assess Variable
campus)
Q134 Volunteering (community service)
Q173_1 Are you currently or have you been a member of any of the
following: Associated Students or Club Officer
(0=No; 1=Yes)
Socio-Academic
Integrative Experiences
5 items encompassing socio-academic experiences with institutional
agents and activities.
AcadValidInst Academic Validation from Instructor
Composite variable resulting from averaging five variables:
M09. Instructors sometimes tell me how much they appreciate my
comments and participation in class; M21. If I stopped attending
college, most of my instructors would be disappointed; M35. I receive
thoughtful and timely comments on my work from my instructors;
M57. Most of my instructors know my name; M43. If I asked my
instructors for help, I am confident that I would receive it.
(Scale: 1 = not at all; 5 = very much; derived via Principal
Components Analysis; alpha = .75)
InsSup
InsAvail
2 semantic differential scale items with 5 answer choices (5/1)
answering to the following prompt:
The quality of my interactions and relationships with instructors can
best be characterized as:
supportive (5)/unsupportive (1);
available (5)/unavailable (1)
Q116 Since starting college, I have met with my instructors outside of class
at least:

84
Variable/Factor Variable
Number in
Dataset
Items Used to Assess Variable
(Scale: 1=not yet; 2=once only; 3=2-3 times; 4=4-5 times; 5=More
than 5 times)
Q115 Since starting college, I have met with a counselor at least:
(Scale: 1=not yet; 2=once only; 3=2-3 times; 4=4-5 times; 5=More
than 5 times)
Q128 On average, how many hours per week do you spend on the following
activities? Studying (e.g., reading, homework, research)
(Scale: 1=None; 2=1-5; 3=6-10; 4=11-15; 5=16-20; 6=21-30; 7=31-
40; 8=41+)
Q182 I have experienced significant academic difficulties while attending
college
(Scale: 1 = Strongly Disagree; 5 = Strongly Agree)
Q173_9 Are you currently or have you been a member of any of the
following: Scholars Program (Honors Program)
(0=No; 1=Yes)
Goal Commitment Q123 What is the highest degree you intend to complete?
(Scale: 0=personal interest; 1=Career/Vocational Certificate; 2=AA
degree; 3=Bachelor’s degree; 4=Master’s degree; 5=Doctorate or
Professional Degree (MD, JD, DD))

85
Research Questions and Hypotheses
Consistent with the model propositions discussed above and depicted in Figure 1, the
following research questions and hypotheses are posed:
Q1. Does the implied measurement model for institutional commitment, interactions
with diverse peers, perceptions of a hostile campus climate, sense of belonging,
mattering, engagement/involvement, and socio-academic integrative experiences
adequately fit the observed data? If not, what respecified model results in
improved model fit?
Q1.1. Is the respecified measurement model race/ethnicity invariant? If not invariant,
how do the measurement models differ?
Q2. Does the hypothesized structural model regressing intent to persist on student
background characteristics, institutional commitment, interactions with diverse
peers, perceptions of a hostile campus climate, sense of belonging, mattering,
engagement/involvement, socio-academic integrative experiences, and goal
commitment adequately fit the observed data? If not, what respecified structural
model results in improved model fit?
Q2.1. Is the hypothesized structural model for intent to persist race/ethnicity invariant?
If not, how do the structural models differ?
Q3. Given a good fit for the global structural model, are the following directional
hypotheses (as depicted in Figure 2) supported?
H1. Institutional commitment to students will exert a positive and direct effect
on sense of belonging, mattering, involvement, goal commitment, and
intent to persist.

86
H2. Institutional commitment to students and interactions with
racially/ethnically diverse peers will positively impact sense of belonging
to the institution. By contrast, perceptions of a hostile campus climate will
negatively impact sense of belonging. Sense of belonging will exert a
direct and positive effect on intent to persist.
H3. Institutional commitment to students and interactions with
racially/ethnically diverse peers will positively impact students’
perceptions of mattering to the institution. By contrast, perceptions of a
hostile campus climate will negatively impact mattering. Mattering, in
turn will exert a direct positive effect on sense of belonging,
engagement/involvement and socio-academic integrative experiences, and
an indirect effect on intent to persist through sense of belonging,
engagement/involvement and socio-academic integrative experiences.
H4. Institutional commitment to students and perceptions of mattering to the
college will positively impact students’ engagement/involvement.
Involvement/ engagement will exert a positive and direct effect on sense
of belonging, socio-academic integrative experiences, and on intent to
persist. Involvement/ engagement will exert an indirect effect on
persistence through socio-academic integrative experiences and goal
commitment.
H5. Perceptions of mattering to the college and engagement/involvement at the
institution will positively impact socio-academic integrative experiences.
Socio-academic integrative experiences will have a positive and direct

87
effect on intent to persist, and an indirect effect mediated by goal
commitment.
Q4. Is there evidence to support the notion that the constructs of involvement/
engagement, sense of belonging, mattering, perceptions of the campus climate,
and peer relationships might form part of an overarching construct?
Figure 2. Hypothesized relationships in conceptual model

88
Selection of Quantitative Methodology, Model Specification,
and Hypothesis Testing
Given the nature of the research questions and the hypothesized model summarized in
Figure 1, a quantitative research design was selected. Specifically, structural equation modeling
(SEM) was deemed the most appropriate method to assess the goodness of fit of the model with
the observed data. The model integrates both latent and measured variables, and as such, it may
be described as a “hybrid” path analysis model (Kline, 2005). While it is conceivable that this
model could be empirically tested with OLS multiple regression using all predictor variables
found in Table 1 to predict the dependent variable (with some limitations), such method does not
permit the researcher to simultaneously assess the interrelationships among latent and measured
variables in the model or assess model fit (Byrne, 2010; Kline, 2005). These interrelationships
are of prime import to this study.
Kline (2005) notes that SEM (1) may be used to evaluate the implied “causal”
relationship for the variables under study; (2) takes a confirmatory approach (albeit not
exclusively) in that models must be specified a priori; (3) permits the simultaneous use of both
latent and observed (measured) variables; (4) is concerned primarily with the analysis of
covariance structures and error measurement; (5) direct and indirect effects may be derived; (6)
enables the researcher to assess differences between the hypothesized and alternative models
subjected to respecification; and (7) provides a means to assess model fit with a variety of
indices, while placing less emphasis on significance testing in comparison to other statistical
techniques.

89
Procedures for Carrying Out Structural Equation Modeling
All SEM analyses were conducted in IBM SPSS AMOS 21. Non-SEM analyses were
carried out in IBM SPSS 21. The following sequential steps (and associated tasks) derived from
the literature were followed when conducting SEM analyses (Byrne, 2010; Kline, 2005; Ullman,
2006).
Model Specification
The hypothesized model in Figure 1 was graphically specified as a path diagram in
AMOS. Latent variables are denoted with ellipses; observed or measured variables with
rectangles; single-headed arrows denote the directional impact of one variable upon another;
residual errors are expressed in a circle.
Model Identification
The goal of this step was to have a model that was over identified to enable hypothesis
testing; that is, the number of parameters (e.g., regression coefficients, variances, covariances) to
be estimated had to be less than the number of observations in the model [observations = p(p +
1)/2; where p is the number of observed variables]. The difference between the observations and
the number of parameters to be estimated had to be positive, thus resulting in the number of
degrees of freedom associated with the specified model (df > 0). Moreover, this step
necessitated that each latent variable be scaled to a metric. This was accomplished by fixing the
loading of the first congeneric variable for each factor to 1.0 loading and a zero loading on all
other factors.
Sample Size and Power
A large sample size (N > 200) is generally required for SEM, albeit this is dependent on
model complexity; the more complex the model, the greater the number of cases needed.

90
According to Kline (2005), the ratio of cases to the number of parameters to be estimated should
be 10:1.
Data Screening
As an initial step, the data file was examined for evidence of coding or data input errors.
Next, a missing data analysis was conducted in SPSS to determine the degree to which missing
data might present a problem and to determine if the pattern of missingness was systematic or at
random. While there are several options for handling missing data, including case deletion,
dummy variable adjustment, single stochastic regression imputation, multiple stochastic
regression imputation (i.e., “multiple imputation”), and Maximum Likelihood—EM algorithm
with multiple imputation (Puma, Olsen, Bell, & Price, 2009), multiple imputation as handled by
AMOS was expected to be carried out. Multiple imputation is currently considered “the most
respectable method of dealing with missing data” (Tabachnick & Fidell, 2006, p. 72).
Furthermore, stochastic regression imputation procedures derive missing values with the same
variance as the observed values (Puma et al., 2009). It has also been noted that AMOS, in
particular, “provides [imputed] estimates that are efficient and consistent” (Arbuckle, 2011, p.
270). Following guidelines provided by leading proponents of the multiple imputation
procedure, all variables presented in Table 1, including the outcome or dependent variable, were
to be used to estimate 10 sets of imputed values (Little & Rubin, 2002; Puma et al., 2009).
The next step of data screening was to identify outliers. The Mahalanobis distance (D2),
distributed as a chi square with degrees of freedom equal to the number of variables (set at p <
.001) was used to identify multivariate outliers (Tabachnick & Fidell, 2006). Prior to this
analysis, it was anticipated that outliers would be examined and if warranted, deleted from the
dataset.

91
Univariate and multivariate normality was also examined. Given the difficulty in
interpreting transformed scores when dealing with non-normality on the variable in question,
variable transformation was not conducted. Instead, maximum likelihood (ML) estimation with
bias corrected test statistics derived from bootstrapping procedures was used to assess model fit.
Bootstrapping is a resampling procedure whereby a sample is treated as the population and from
which subsamples equal in size are drawn randomly with replacement for a specific number of
times (generally > 1000 bootstrap samples are recommended), to determine parameter estimates
under non-normal conditions (Efron, 1988). While traditional ML estimation is subjected to
meeting multivariate normality, bootstrapping techniques do not require meeting this assumption
(Arbuckle, 2011; Byrne, 2010).
Model Estimation
During this step of the process, all parameters characterizing the hypothesized model
were estimated in AMOS using maximum likelihood. ML is the most common method used in
SEM and it requires that data be multivariate normal (Kline, 2005). While other estimation
methods are available, these generally require excessively large samples to implement (N >
2,500) or work best with a limited number of variables (< 25). Despite the non-normality in the
data, ML was selected, and as noted previously, ML bootstrap estimates were requested. This
included the calculation of the Bollen-Stine bootstrap bias corrected p-value to aid in the
interpretation of model fit, instead of the usual ML p-value used with normally distributed data.
Model Evaluation/Fit
Given the significant lack of consensus in the literature for preferred means to assess
model fit, methodologists recommend researchers use a variety of indices of fit (Byrne, 2010;
Kline, 2005; Ullman, 2006). Whereas, statistical significance is desired in other multivariate
92
techniques, SEM is not strictly concerned with significance testing. One of the most common
criterions reported in SEM studies is the chi square test statistic (CMIN). A statistically non-
significant p-value is said to demonstrate good model fit. However, chi square values are sample
size dependent and sensitive to model complexity, and models otherwise judged of “good fit”
may be rejected when sample sizes are “large” (N > 200, according to Kline, 2005). Hence, the
following goodness of fit indices were also used in this study. Optimal values for each is
reported in parentheses: the χ2 to df ratio (with values ≤ 4.0); the comparative fit index (CFI; ≥
.90-95); the root mean square error of approximation and RMSEA 90% confidence interval
(RMSEA; ≤ .06, although values ≤ .10 may be acceptable); and, lastly, the standardized root
mean square residual (SRMR; ≤ .10). These indices account for such things as sample size,
number of parameters in the model, model complexity, and degrees of freedom (Byrne, 2010;
Kline, 2005; Ullman, 2006).
Model Respecification
In the course of evaluating model fit as noted above, careful attention was placed on the
examination of standardized residuals, modification indices, and their expected parameter change
statistic. These pointed to potential sources of model misspecification. For example,
modification indices point to variables cross-loading on more than one factor (a threat to
discriminant validity), or to error covariances that might result in improved model fit (Byrne,
2010). While the model presented in Figure 1 was hypothesized a priori, all attempts at model
trimming or model building took on an exploratory post hoc approach. All attempts at model
modification were grounded on theory (MacCullum, 1995).

93
Data Screening Results
Missing Values
As an initial step, the working data file was examined for evidence of coding or data
input errors. Frequency analyses were conducted for each variable and no evidence of
miscoding, or of values outside the expected range for each variable was found. Next, a missing
value analysis (MVA) was conducted in SPSS to determine the degree to which missing data
might present a problem and to help establish if the pattern of missingness, if any, was
systematic or at random. Based on an examination of the output generated by the SPSS MVA
procedure, there were no cases with missing values on any of the variables of interest to the
study. Given this finding, the planned multiple imputation analysis was not conducted.
Normality, Identification, and Disposition of Outliers
Assessment of Normality. The next step involved in the data screening process was to
examine the distribution of scores across variables. Using the Kolmogorov-Smirnov and the
Shapiro-Wilk tests in SPSS, the output readily revealed that the distributions for all variables
departed significantly from normality (p < .001). However, as noted by many methodologists,
these tests are extremely sensitive to large sample sizes, and small departures from normality
may still lead to significant findings (Field, 2009; Tabachnick & Fidell, 2006). Thus, a visual
inspection of histograms and P-P plots was performed, along with an examination of the values
for skewness and kurtosis. In doing so, several variables “appeared” to depart from normality.
Identification of Univariate Outliers. Anticipating the use of maximum likelihood
estimation in conducting SEM analyses (as reported in Chapter 4), a decision was made to
transform all variables into Z-scores to help identify cases responsible for departures from
normality in some variables. Since the sample for this study was rather large, a Z-score > |3.29|,

94
(p < .001) was set as a cutoff to identify possible outliers (Tabachnick & Fidell, 2006). Based on
this analysis, seven variables contained extreme scores beyond the cutoff of 3.29. Of the 2,200
cases in the dataset, 1,944 (88.4%) had no univariate outliers in any variable; 227 (10.3%) had an
outlier in a single variable; 26 (1.2%) had an outlier in two variables; 2 (0.1%) had an outlier in
three variables; and 1 (0.04%) had an outlier in four variables. The variables in question were:
transition support from family/friends (n = 43); “My instructors sometimes ignore my comments
or questions” (n = 31); “I sometimes feel alone and isolated at the college because of my gender”
(n = 26); “I sometimes feel alone and isolated at the college because of my sexual orientation” (n
= 70); students’ perception that instructors are supportive of them (n = 23); hours spent per week
on campus activities (n = 61); and hours spent per week volunteering (n = 35).
Disposition of Univariate Outliers. In considering whether or not the “outlying” cases
above are representative of the population under study, one must consider these in light of the
purpose of the study and the sample before a decision is made to remove them from the dataset
and further consideration (Tabachnick & Fidell, 2006). Generally speaking, the research
questions in this study interrogate if students attending community colleges experience the
college environment in a similar manner. To the degree they do or do not, is relevant to the
study. The variables with outlying cases above are indicative of the college experience. It is
very likely that while most students have satisfactory and supportive interactions with the
institution and institutional agents, other students may not. Experiencing a hostile campus
climate, for example, may be in fact a reality for many students (Hurtado & Carter, 1997;
Hurtado & Ponjuan, 2005; Locks et al., 2008; Rhee, 2008; Strayhorn, 2012; Tovar et al., 2008;
Tovar et al., 2009; Yi, 2007).

95
Despite the methodological challenges that outliers may have on the multivariate
analyses planned, it was concluded that removing “extreme cases” for the variables above would
have been deleterious to the study. Thus, the next decision made was how to handle these
univariate outliers: pursue data transformations or change the scores (Field, 2009; Osborne &
Overbay, 2004; Tabachnick & Fidell, 2006).
As noted previously, a decision was made prior to examining the dataset that data
transformations would not be carried out. This was based on the difficulty that such
transformations have in the interpretability of findings. Hence, the only viable option was to
change scores on the variables with the outlying cases, “so that they are deviant, but not as
deviant as they were… Because measurement of variables is sometimes rather arbitrary anyway,
this is often an attractive alternative to reduce the impact of a univariate outlier” (Tabachnick &
Fidell, 2006, p. 77). As noted by Osborne and Overbay (2004), truncating values for outlying
scores to “the highest (or lowest) reasonable score” is an acceptable solution (n.p., section: “How
to deal with outliers,” ¶ 5).
Using the above methodological “guidelines” and the researcher’s justification for not
deleting cases, outlying cases were truncated to the next highest or lowest value with the
recognition this was not a “perfect solution.” Table 2 presents standardized and non-
standardized descriptive statistics for the seven variables containing extreme outlying cases—
with Z-scores above |3.29| before univariate outlier truncation. Table 3, on the other hand
presents the same information for all variables after univariate outlier truncation.

96
Table 2
Non-Standardized and Select Standardized Descriptives for Variables in Study Before
Univariate Outlier Truncation (N = 2,200)
Descriptives (Non-Standardized)
Standardized
Skewa
Variablee Min Max Mean SD Skewa Kurb Min Max
N Casesc
|z > 3.29|
SupFamFrdd 1 5 4.49 0.87 -1.98 3.71 -4.02 0.59 43
M38r 1 5 4.27 0.95 -1.25 0.97 -3.44 0.76 31
M18neg 1 5 1.37 0.83 2.42 5.42 -0.45 4.38 26
M36negd 1 5 1.28 0.75 3.08 9.60 -0.37 4.96 70
Q129d 1 8 1.38 0.79 3.36 16.42 -0.49 8.42 61
Q134d 1 8 1.45 0.88 3.03 12.84 -0.51 7.40 35
InsSup 1 5 4.04 0.89 -0.69 0.11 -3.41 1.07 23 a S.E. = .052 b S.E. = .104 c Extreme scores noted in this column were subsequently truncated to the next highest or lowest value in
the corresponding variable. r Item was reverse coded before analysis. e Refer to Table 1 (page 79) for full variable names.

97
Table 3
Non-Standardized and Select Standardized Descriptives for Variables in Study After Univariate
Outlier Truncation in Seven Variables (N = 2,200)
Descriptives (Non-Standardized)
Standardized
Skewa
Variablee Min Max Mean SD Skewa Kurb Min Max
N Casesc
|z > 3.29|
Q177 1 5 4.11 1.16 -1.12 0.22 -2.68 0.77
Q125 1 23 10.37 4.03 -0.33 -0.60 -2.33 3.14
Q119 1 2 1.59 0.49 -0.37 -1.87 -1.20 0.83
Q180 1 5 3.47 1.44 -0.44 -1.13 -1.72 1.07
SupFamFrd 2 5 4.51 0.81 -1.68 1.92 -3.10 0.61 0
Q126 1 5 2.87 1.20 0.20 -0.80 -1.56 1.77
GPA 0 4 2.84 1.14 -0.76 -0.33 -2.49 1.02
M59 1 5 3.32 1.23 -0.30 -0.79 -1.88 1.37
M17 1 5 3.46 1.19 -0.42 -0.60 -2.07 1.30
M39 1 5 3.32 1.33 -0.29 -1.04 -1.75 1.26
M07 1 5 3.88 1.04 -0.73 -0.04 -2.77 1.07
M38 r 2 5 4.29 0.91 -1.04 0.01 -2.51 0.78 0
Q176 1 5 3.31 1.23 -0.27 -0.84 -1.88 1.37
Q70 1 5 4.12 0.96 -0.84 -0.02 -3.25 0.92
Q74 1 5 3.36 1.11 -0.23 -0.52 -2.14 1.48
Q78 1 5 3.68 1.11 -0.53 -0.37 -2.41 1.19
Q82 1 5 3.53 1.16 -0.38 -0.62 -2.18 1.26
M18neg 1 4 1.36 0.78 2.18 3.73 -0.46 3.38 90

98
Descriptives (Non-Standardized)
Standardized
Skewa
Variablee Min Max Mean SD Skewa Kurb Min Max
N Casesc
|z > 3.29|
M36neg 1 4 1.25 0.63 2.61 6.02 -0.39 4.39 29
M55neg 1 5 1.59 1.06 1.78 2.20 -0.56 3.21
M63neg 1 5 1.78 1.19 1.37 0.68 -0.66 2.71
M48 1 5 2.76 1.22 0.08 -0.93 -1.45 1.84
M52 1 5 2.49 1.14 0.30 -0.78 -1.31 2.19
M53 1 5 3.00 1.11 -0.12 -0.61 -1.80 1.80
M40 1 5 3.09 1.14 -0.11 -0.64 -1.83 1.67
M62 1 5 2.46 1.23 0.40 -0.85 -1.19 2.06
M61 1 5 3.26 1.20 -0.23 -0.81 -1.88 1.45
M54 1 5 3.32 1.17 -0.30 -0.69 -1.98 1.44
M26 1 5 3.26 1.15 -0.31 -0.60 -1.96 1.50
M31 r 1 5 3.49 1.38 -0.43 -1.08 -1.81 1.10
M30 r 1 5 3.74 1.27 -0.69 -0.61 -2.15 0.99
M56 r 1 5 3.93 1.23 -0.85 -0.40 -2.38 0.87
M08 r 1 5 3.68 1.23 -0.58 -0.68 -2.18 1.07
M32 r 1 5 3.30 1.33 -0.23 -1.08 -1.74 1.28
M34 r 1 5 3.91 1.17 -0.81 -0.26 -2.49 0.93
M49 r 1 5 4.08 1.18 -1.12 0.22 -2.60 0.78
Q129 1 4 1.36 0.68 2.15 4.70 -0.53 3.90 61
Q134 1 4 1.42 0.75 1.90 3.15 -0.57 3.45 77
Q173_1 0 1 0.11 0.31 2.58 4.65 -0.34 2.92

99
Descriptives (Non-Standardized)
Standardized
Skewa
Variablee Min Max Mean SD Skewa Kurb Min Max
N Casesc
|z > 3.29|
AcadValidInst 1 5 3.48 0.83 -0.26 -0.40 -3.00 1.85
InsAvail 1 5 4.01 0.93 -0.69 -0.05 -3.24 1.06
InsSup 1.25 5 4.05 0.86 -0.49 -0.70 -3.25 1.10 0
Q116 1 5 2.99 1.43 0.00 -1.22 -1.39 1.40
Q115 1 5 3.36 1.24 -0.16 -0.92 -1.91 1.33
Q128 1 8 3.61 1.54 0.90 0.15 -1.69 2.86
Q182 1 5 2.65 1.28 0.29 -0.94 -1.29 1.84
Q173_9 0 1 0.09 0.29 2.88 6.28 -0.31 3.19
Q123 0 5 3.62 1.13 -0.83 0.70 -3.21 1.22
a S.E. = .052 b S.E. = .104 c Extreme scores noted in this column were subsequently truncated to the next highest or lowest value in
the corresponding variable. d Variables predicting multivariate outliers from non-outliers. r Item was reverse coded before analysis. e Refer to Table 1 (page 79) for full variable names.

100
As noted in Table 3, the truncation of extreme scores in the seven variables in question
was generally successful in reducing the impact of univariate outliers—the standardized scores
saw a significant drop in their values, and certainly closer to the desired 3.29. Specifically, three
of the variables (SupFamFrd—transition support from family/friends; M38—My instructors
sometimes ignore my comments or questions; and InsSup—students’ perception that instructors
are supportive of them) had no cases with a standardized score above the 3.29. The largest Z-
scores for the remaining four variables ranged from |3.38-4.39|, down from the previous |3.41-
8.42|. Note should be taken, however, that in reducing the overall influence of univariate outliers
as indicated in their standardized value, the number of univariate outliers increased for two
variables (M18—I sometimes feel alone and isolated at the college because of my gender; and
Q134—hours spent per week volunteering).
Identification and Disposition of Multivariate Outliers. In order to identify the
presence of multivariate outliers, all variables in Table 1, forming part of the Input-Environment-
Outcome clusters were regressed (OLS multiple regression) on Case ID number. Tabachnick
and Fidell (2006) have noted that multivariate outliers are not affected by the dependent variable
(p. 99), hence the use of Case ID. The purpose of this analysis was to derive the Mahalanobis
distance (D2) for every case in the dataset to aid in the identification of multivariate outliers. The
Mahalanobis distance is distributed as a χ2 with degrees of freedom equal to the number of
variables, χ2 (48) = 84.04, set at p < .001 (Tabachnick & Fidell, 2006). Based on this analysis
112 (5.1%) cases exceeded the 84.04 critical value and were thus classified as multivariate
outliers. Only 50 (19.5%) of the 256 univariate outlying cases were also found to be multivariate
outliers.

101
While not specifically of interest to this study, 17 of the 48 variables collectively
discriminated between multivariate outliers from non-outliers. An examination of
multicollinearity statistics (VIF, tolerance, conditioning index, and excessive variance on two or
more variables) did not identify any issues of concern. All values were within expectations.
Moreover, bivariate correlations did not exceed |.60|.
However, an examination of means for each of the 17 variables did uncover statistically
significant differences (p < .01) between multivariate outliers and non-outliers in 13 variables as
noted in Table 4. Given the nature of the variables, the outlying cases were of students who
could be classified as marginalized from the college environment and who were more involved
on student activities and volunteer work.

102
Table 4
Variables Predicting Multivariate Outliers (N = 112) from Non-Outliers (N = 2,088)
Mean* SD
Variable Not
Outlier Outlier
Not
Outlier Outlier
SupFamFrd. Transition support from family and friends 4.53 4.14 0.78 1.11
GPA 2.86 2.44 1.12 1.37
M59. Counselors at the college generally show their
concern for students' well-being
3.34 2.93 1.21 1.52
Q74. The quality of my interactions and relationships
with students of another race/ethnicity can best be
characterized as: close (5)/distant (1)
3.39 2.73 1.07 1.47
Q78. The quality of my interactions and relationships
with students of another race/ethnicity can best be
characterized as: available (5)/unavailable (1).
3.56 2.91 1.13 1.54
M36. I sometimes feel alone and isolated because of my
sexual orientation (reverse coded)
1.23 1.47 0.60 0.96
M52. Some people on campus are disappointed in me
when I do not accomplish all I should
2.52 2.09 1.12 1.42
M62. I sometimes feel pressured to do better because
people at the college would be disappointed if I did not
2.49 1.88 1.21 1.45
61. There are people at the college who are concerned
about my future
3.29 2.68 1.18 1.51
M32. Sometimes I get so wrapped up in my personal
problems that I isolate myself from others at the college
(reverse coded)
3.34 2.66 1.30 1.65
M49. I often feel that I do not belong at this college
(reverse coded)
4.11 3.42 1.15 1.64

103
Mean* SD
Variable Not
Outlier Outlier
Not
Outlier Outlier
Q129. Average number of hours per week spent on
campus activities
1.35 1.59 0.65 1.03
Q134. Average number of hours per week spent
volunteering
1.41 1.64 0.72 1.06
*All differences significant at p < .01

104
Despite the earlier proposition that univariate outlying cases were relevant to the analyses
in this study, after careful consideration of the nature of the multivariate outlying cases, it would
appear that the decision not to delete all univariate outlying cases was correct. However, in face
of the evidence presented above, it is very likely that with respect to multivariate outliers and
non-outliers, that the two sets of cases may indeed represent two different populations of
students: (1) representing the “typical” community college student (at least for the institution
where data was collected); and (2) representing students who despite their desire to be in and
partake of the full college experience, they cannot, since they are confronted with multiple and
varying marginalizing and alienating encounters with the institution and institutional agents.
The options for how to handle multivariate outliers, especially given the above, was to
either delete the 13 variables responsible for the outlying cases, to delete the outlying cases
themselves, or keep them all in the analyses. The latter option was deemed untenable since
multivariate normality is a requirement for SEM procedures. Additionally, since the variables
are of primary concern to the study, a decision was made to delete the multivariate outliers from
further consideration. This action was consistent with recommendations from leading
methodologists (Field, 2009; Osborne & Overbay, 2004; Tabachnick & Fidell, 2006). Hence the
final sample for the study consisted of 2,088 cases.
Despite the elimination of the multivariate outliers, it seems appropriate that future
research consider analyzing them further, as they speak to the experiences of significantly
marginalized students.
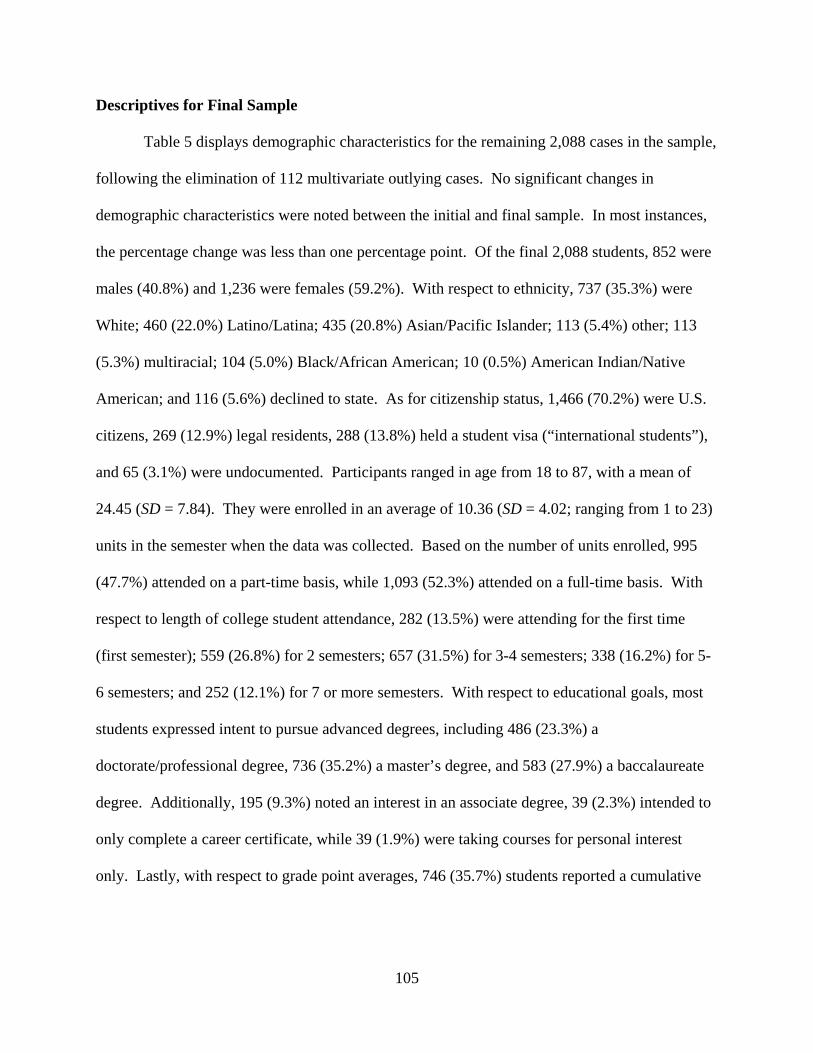
105
Descriptives for Final Sample
Table 5 displays demographic characteristics for the remaining 2,088 cases in the sample,
following the elimination of 112 multivariate outlying cases. No significant changes in
demographic characteristics were noted between the initial and final sample. In most instances,
the percentage change was less than one percentage point. Of the final 2,088 students, 852 were
males (40.8%) and 1,236 were females (59.2%). With respect to ethnicity, 737 (35.3%) were
White; 460 (22.0%) Latino/Latina; 435 (20.8%) Asian/Pacific Islander; 113 (5.4%) other; 113
(5.3%) multiracial; 104 (5.0%) Black/African American; 10 (0.5%) American Indian/Native
American; and 116 (5.6%) declined to state. As for citizenship status, 1,466 (70.2%) were U.S.
citizens, 269 (12.9%) legal residents, 288 (13.8%) held a student visa (“international students”),
and 65 (3.1%) were undocumented. Participants ranged in age from 18 to 87, with a mean of
24.45 (SD = 7.84). They were enrolled in an average of 10.36 (SD = 4.02; ranging from 1 to 23)
units in the semester when the data was collected. Based on the number of units enrolled, 995
(47.7%) attended on a part-time basis, while 1,093 (52.3%) attended on a full-time basis. With
respect to length of college student attendance, 282 (13.5%) were attending for the first time
(first semester); 559 (26.8%) for 2 semesters; 657 (31.5%) for 3-4 semesters; 338 (16.2%) for 5-
6 semesters; and 252 (12.1%) for 7 or more semesters. With respect to educational goals, most
students expressed intent to pursue advanced degrees, including 486 (23.3%) a
doctorate/professional degree, 736 (35.2%) a master’s degree, and 583 (27.9%) a baccalaureate
degree. Additionally, 195 (9.3%) noted an interest in an associate degree, 39 (2.3%) intended to
only complete a career certificate, while 39 (1.9%) were taking courses for personal interest
only. Lastly, with respect to grade point averages, 746 (35.7%) students reported a cumulative

106
GPA of 3.5-4.0; 676 (32.4%) of 3.0-3.49; 369 (17.7%) of 2.5-2.99), 222 (10.6%) of 2.0-2.49;
and 75 (3.6%) below 2.0.
Table 5
Demographic Characteristics for Final Sample (N = 2,088)
Student Characteristic n Pct.
Gender
Male 852 40.80%
Female 1236 59.20%
Race/Ethnicity
American Indian/Native American 10 0.50%
Asian/Pacific Islander 435 20.80%
Black/African American 104 5.00%
Latino/a 460 22.00%
White 737 35.30%
Multiracial 113 5.40%
Other 113 5.40%
Declined to state 116 5.60%
Length of Attendance
1 semester 282 13.50%
2 semesters 559 26.80%
3-4 semesters 657 31.50%
5-6 semesters 338 16.20%
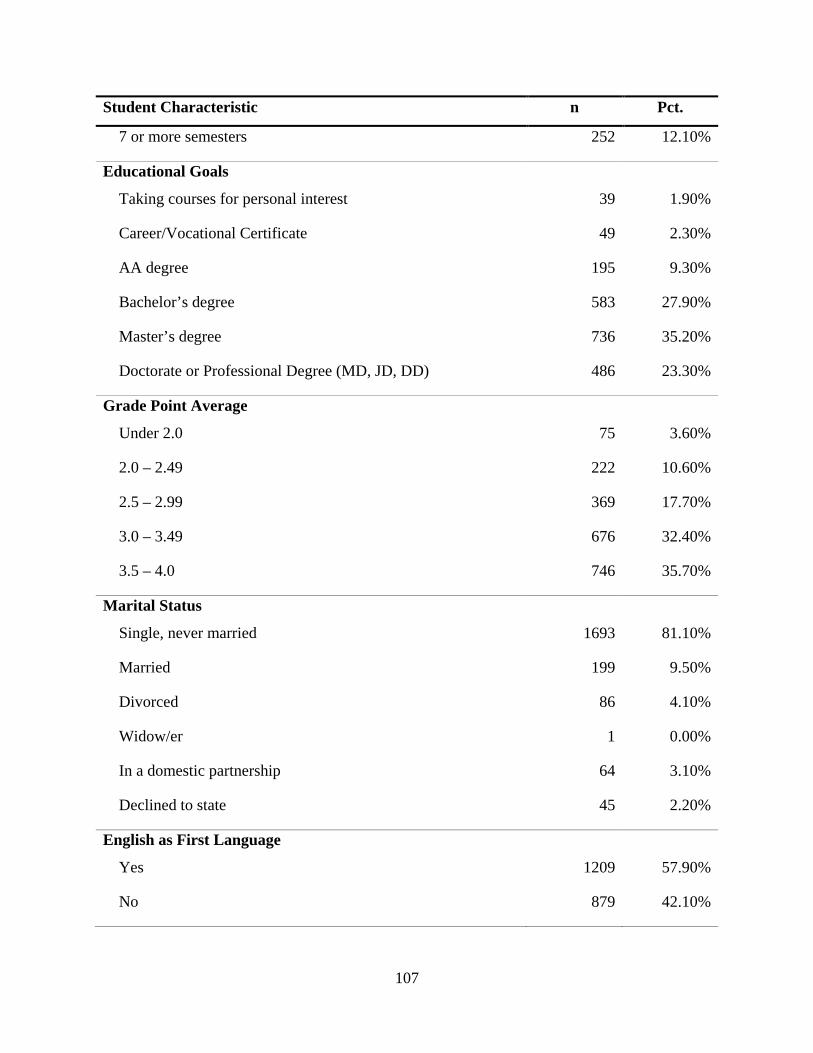
107
Student Characteristic n Pct.
7 or more semesters 252 12.10%
Educational Goals
Taking courses for personal interest 39 1.90%
Career/Vocational Certificate 49 2.30%
AA degree 195 9.30%
Bachelor’s degree 583 27.90%
Master’s degree 736 35.20%
Doctorate or Professional Degree (MD, JD, DD) 486 23.30%
Grade Point Average
Under 2.0 75 3.60%
2.0 – 2.49 222 10.60%
2.5 – 2.99 369 17.70%
3.0 – 3.49 676 32.40%
3.5 – 4.0 746 35.70%
Marital Status
Single, never married 1693 81.10%
Married 199 9.50%
Divorced 86 4.10%
Widow/er 1 0.00%
In a domestic partnership 64 3.10%
Declined to state 45 2.20%
English as First Language
Yes 1209 57.90%
No 879 42.10%

108
Student Characteristic n Pct.
Number of Units Enrolled (Mean = 10.36; SD = 4.02)
1 - 6 units 481 23.10%
7-11 units 514 24.6%
12 or more 1093 52.30%
Citizenship Status
U.S. Citizen 1466 70.20%
Legal Resident (permanent, temporary, refugee) 269 12.90%
Student Visa 288 13.8%
Undocumented 65 3.10%
Income (family)
Under $10,000 355 17.10%
$10,000 - $19,999 316 15.20%
$20,000 - $29,999 265 12.80%
$30,000 - $39,999 179 8.60%
$40,000 - $49,999 131 6.30%
$50,000 - $59,999 109 5.30%
$60,000 - $69,999 70 3.40%
$70,000 - $79,999 56 2.70%
$80,000 - $89,999 39 1.90%
$90,000 - $99,999 36 1.70%
Over $100,000 146 7.00%
Decline to state 373 18.00%
Age (Mean = 24.45; SD = 7.84)
18 to 24 1411 67.5%

109
Student Characteristic n Pct.
25-34 449 21.4%
35-45 173 8.3%
46+ 54 2.5%
Data Analyses for Research Questions
Descriptive Statistics
SPSS 21 was used to help describe student characteristics. Frequencies and proportions
with respect to the entire sample, by gender (male; female), ethnicity, length of college
attendance (1-2 semesters; 3-4 semesters; more than 4 semesters), and unit load (part-time; full-
time) were examined. Means and standard deviations for all continuous variables were also
calculated. Statistical significance was assessed via independent sample t-tests and one-way
ANOVA. Where violations of equal variances, the Brown-Forsythe statistic was examined and
reported, instead of the F statistic. Statistical significance was set to p < .01.
Analyses for Research Question 1
Research Question 1 is concerned with the assessment of the measurement model. Each
factor is composed of multiple variables. The initial step of the analysis was the identification of
the measurement model. The number of data points and parameters encompassing the model
were estimated. Since the resulting degrees of freedom were > 0, the confirmatory factor
analysis (CFA) proceeded as planned. An omnibus CFA was conducted to ascertain model fit by
examining several goodness of fit measures, including the CFI, RMSEA, and SRMR.
Unstandardized and standardized residuals, modification indices, and expected parameter change
statistics were also checked to determine, if and how, the measurement model should be

110
improved. A simple structure with no cross-loading items was pursued; however, theoretical
principles also guided plausible cross-loadings. While seeking model respecification, several
indicators from several factors were either deleted or merged with a different factor. Error
correlations were permitted when supported by theory (Byrne, 2010; MacCullum, 1995). Such
error covariances often derive from characteristics of either the items in question (e.g., tapping
into similar constructs, redundancy) or the respondents.
Analyses for Research Question 1.1
Research Question 1.1 was concerned with the assessment of race/ethnicity invariance for
the measurement model above. Byrne (2010) notes that the assessment of invariance
encompasses the comparison of a baseline model with no constraints, against increasingly
restrictive models to determine if they are significantly different (not invariant) for the groups in
question. The analysis started with the invariance of factor loadings. Given invariant
parameters, the analysis continued by imposing additional equality constraints in error
covariances and factor covariances. Since the purpose of this invariance analysis was to identify
how the measurement model might differ by race/ethnicity, and not to develop an invariant
model, all statistically significant differences found led to freely estimating the parameter in
question. Before invariance analysis was conducted, residual path coefficients were set to 1.0 to
enable the analysis to proceed (Byrne, 2010).
Analyses for Research Question 2
Research Question 2 was concerned with assessing the goodness of fit for the structural
model. The model controlled for the effects of gender, financial concerns, support from
family/friends, length of college attendance, unit load, and GPA. The same analytic procedure
described for Research Question 1 was followed.

111
Analyses for Research Question 2.1
Research Question 2.1 is concerned with the assessment of race/ethnicity invariance for
the structural model. Consistent with Research Question 1.1, the same analytic procedure was
pursued.
Analyses for Research Question 3
Research Question 3 outlines five hypotheses that examine the effects of institutional
commitment to students, interactions with diverse peers, perceptions of a hostile campus climate,
mattering, sense of belonging, engagement/involvement, socio-academic integrative experiences,
and goal commitment on students’ intent to persist. The hypotheses collectively proposed
expected relationships among the constructs—positive or negative (Figure 2). The analysis
entailed an examination and reporting of the direct, indirect, and total effects of constructs in the
structural model on intent to persist. Statistically significant path coefficients guided the
interpretability of factor and variable interrelationships, as reported in Chapter 4.
Analyses for Research Question 4
Research Question 4 sought to determine if the constructs of engagement/involvement,
sense of belonging, mattering, perceptions of the campus climate, and peer relationships might
form part of an omnibus construct. To this end, a second-order confirmatory factor analysis
composed of five factors was examined. The variables composing each factor are reported in
Table 1. Consistent with SEM procedures, a first-order confirmatory factor analysis was initially
conducted. Model fit was assessed in the same manner as for Research Question 1. Once an
acceptable model was found, the second-order confirmatory factor analysis was pursued.

112
Conclusion
Chapter 3 presented a discussion of the methodology employed in this study. The
conceptual model being tested was explained in detail, including the model’s propositions, and
the variables encompassing it. The research questions and corresponding directional hypotheses
guiding this study were also presented. It discussed the research methodology characterizing the
study, including research design, sample, data used, data analyses conducted, and data screening
procedures/results. A description of the demographic characteristics of the final sample was also
discussed. Chapter 4 will present the results of the study.

113
CHAPTER 4
RESULTS
This chapter begins by describing the results of several univariate analyses conducted on
the variables constituting the conceptual model in the study by race/ethnicity, gender, and length
of college attendance. It then proceeds to describe the results associated with each of the
research questions investigated in the study.
Descriptives for Conceptual Model Variables: Differences by Race/Ethnicity, Gender, and
Length of College Attendance
Before proceeding with the structural equation modeling analyses, mean differences by
race/ethnicity (ANOVA—four levels), gender (independent samples t-tests), and length of
college attendance (ANOVA—three levels) were assessed. The Levene test for homogeneity of
variance and the appropriate p-value was examined to determine if statistically significant
differences between or among groups existed. For ANOVAs showing that the variances for
groups could not be assumed, the Brown-Forsythe statistic was examined. Given the large
sample, statistical significance was set at p < .01. Based on this examination, the following
statistically significant differences were found and are noted in Tables 6, 7, and 8, alongside the
means and standard deviations. Moreover, the correlation matrix for the final sample is included
in Appendix B for reference.
Differences by Race/Ethnicity
White Students. In comparison to students of other race/ethnicity (Asian, Latino/a, and
Black), White students were most likely to report:
• having a higher GPA.
They were also least likely to report:

114
• finances were a concern for them while attending college;
• having close or supportive relationships with diverse peers;
• feeling alone or isolated because of their race/ethnicity;
• spending a significant number of hours per week on campus activities;
• meeting with a counselor;
• experiencing academic difficulties while attending college.
Latino/a Students. In comparison to students of other race/ethnicity (White, Black,
Asian), Latino/a students were most likely to report:
• finances were a concern for them while attending college;
• that if they had a personal problem, counselors would be willing to discuss it with
them;
• experiencing academic difficulties while attending college.
They were also least likely to report:
• feeling alone at the college;
• feeling isolated from student activities;
• not belonging at the college;
Asian/PI Students. In comparison to students of other race/ethnicity (White, Latino/a,
Black), Asian/PI students were most likely to report:
• enrolling in more units during the semester;
• feeling alone at the college, and particularly feeling alone and isolated because of
their gender, sexual orientation, and race/ethnicity;
• instructors sometimes ignoring their comments or questions;

115
• spending a significant number of hours per week on campus activities and
studying.
They were also least likely to report:
• their contributions were valued by their instructors;
• having friendly and supportive relationships with diverse peers;
• there were people at the college who were concerned about their future or who
were genuinely interested in them as a person;
• feeling isolated when involved in student activities;
• instructors were available to them and be academically validated by them;
• meeting with instructors outside of class.
Black Students. In comparison to students of other race/ethnicity (White, Latino/a,
Asian), Black students were most likely to report:
• counselors at the college generally showed their concern for students' well-being;
• their contributions were valued by their instructors;
• receiving all the assistance needed from the institution to successfully transition
and adjust to the college;
• having friendly, close, and supportive relationships with diverse peers;
• there were people at the college who were concerned about their future and who
were genuinely interested in them as a person;
• instructors as available to them and be academically validated by them;
• meeting with a counselor.
They were also least likely to report:
• instructors ignored their comments or questions;

116
• feeling alone at the college, and particularly isolated because of their gender;
• feeling socially inadequate at the college;
• not feeling interesting to anyone at the college.
Differences by Gender
Female vs. Male Students. In comparison to male students, females were most likely to
report:
• finances were a concern for them while attending college;
• enrolling in fewer units during the semester;
• having a higher GPA;
• counselors at the college generally showed their concern for students' well-being,
believed counselors would be willing to discuss personal problems with them;
• their contributions were valued by their instructors;
• receiving all the assistance needed from the institution to successfully transition
and adjust to the college;
• having friendly, close, and supportive relationships with diverse peers;
• feeling alone at the college, and particularly feeling alone and isolated because of
their gender, sexual orientation, and race/ethnicity;
• there were people at the college who were concerned about their future and who
were genuinely interested in them as a person;
• feeling socially inadequate and not belonging at the college;
• instructors as available to them and be academically validated by them;
• meeting with a counselor;
• spending a significant number of hours per studying.

117
They were also least likely to report:
• instructors ignored their comments or questions;
• not feeling interesting to anyone at the college;
• meeting with an instructor outside of class;
• spending a significant number of hours per week on campus activities;
• experience academic difficulties while attending college.
Differences by Length of College Attendance
First Semester Students. In comparison to students attending for two or more semesters,
first-time college students were most likely to report:
• counselors would be willing to discuss personal problems with them;
They were also least likely to report:
• instructors ignored their comments or questions;
• isolating themselves from others at the college;
• not belonging at the college;
• spending a significant number of hours per week on campus activities,
volunteering, or be part of a club;
• meeting with a counselor or instructor outside of class;
• being a member of the Scholars Program;
• lower degree aspirations.
Second Semester Students. In comparison to students attending college for other lengths
of time, second semester students were most likely to report:
• enrolling in more units;
• not belonging at the college;

118
They were also least likely to report:
• holding a leadership role in the Associated students or a student club.
Second-Year Students. In comparison to students attending college for other lengths of
time, second-year students were most likely to report:
• spending a significant number of hours per week on campus activities;
• being a member of the Scholars Program.
They were also least likely to report:
• isolating themselves from others at the college.
Third-Year Students. In comparison to students attending college for other lengths of
time, third-year students were most likely to report:
• holding a leadership role in the Associated Students or a student club;
• the highest degree aspirations.
They were also least likely to report:
• counselors would be willing to discuss personal problems with them;
• instructors ignored their comments or questions;
• feeling alone and isolated because of their age.
Fourth-Year and Beyond Students. In comparison to students attending college for a
shorter length of time, fourth-year (an above) students were most likely to report:
• enrolling in fewer units;
• feeling alone and isolated because of their age.
• spending a significant number of hours per week volunteering;
• meeting with a counselor or instructor outside of class;
They were also least likely to report:

119
• holding a leadership role in the Associated Students or a student club.
Conclusion of Differences
As noted in the preceding sections, statistically significant differences (p < .01) were
observed across many variables by race/ethnicity, gender, and length of college attendance.
While it is beyond the scope of this study to examine differences at the univariate level, select
findings are noted below.
As a group, Asian students, in comparison to other students appear to have more
marginalizing and alienating experiences than students of any other race/ethnicity. While they
immersed themselves into their academic studies and made an effort to engage in student
activities, they also reported having few relationships characterized as friendly and supportive
with diverse peers. Black students, on the other hand, seem to have found a college environment
conducive to their learning and development, where they believed institutional agents are
available to them from the time they transitioned to college, to the time they established
themselves in it, particularly in the classroom. They also noted having more interactions with
diverse peers characterized as close, supportive, and friendly. Latino/a students, while being
concerned about their finances and experiencing more academic difficulties while in college,
also expressed higher levels of belonging—the polar opposite of alienation and loneliness.
Lastly, White students, while being academically successful, were least likely to have
relationships with diverse peers, or feel isolation owning to their race, and were also somewhat
disconnected from campus activities.
With respect to gender, female students tended to be academically successful and
generally perceived the classroom environment favorably, where instructors made them feel
welcome and elicited their participation. They also believed counselors were available to them

120
to discuss personal and other problems, and visited them more often than males. Females were
also most likely to have interactions with diverse peers characterized as close, supportive, and
friendly; albeit they tended to also experience alienating experiences given their identity—
race/ethnicity, gender, and sexual orientation.
As for length of college attendance, first-semester students generally reported good
classroom-based interactions. While not highly involved academically or socially, they reported
a high sense of belonging. However, second semester students, reported the lowest sense of
belonging in comparison to students attending college for any other period of time. Second year
students, seem to have thrived academically and socially and devoted more time to campus
activities and participated in the college’s honors program to a greater degree. Third year
students, seem to have maintained their involvement in student activities, while also holding the
most leadership roles in campus clubs and organizations. However, they also showed more
alienating classroom experiences. Lastly, fourth year students reported the lowest degree
aspirations, but they met more often with a counselor, and spent more hours volunteering. They
also tended to experience more age-related marginalizing experiences.

121
Table 6
Descriptive Statistics for Final Sample by Race/Ethnicity (N = 2,088)
Mean SD
Variablea
White
(n=737)
Latino
(n=460)
Asian
(n=435)
Black
(n=104)
Other
(n=352)
Total
White
(n=737)
Latino
(n=460)
Asian
(n=435)
Black
(n=104)
Other
(n=352) Total
Q177 4.04 4.17 4.13 4.16 4.18 4.12 1.18 1.09 1.12 1.19 1.15 1.14
Q125*** 10.16 9.59 11.86 9.25 10.28 10.36 4.13 3.58 3.94 4.04 3.96 4.02
Q119* 1.62 1.56 1.55 1.67 1.60 1.59 0.49 0.50 0.50 0.47 0.49 0.49
Q180*** 3.27 3.70 3.43 3.63 3.59 3.47 1.48 1.32 1.39 1.43 1.37 1.42
SupFamFrd* 4.59 4.48 4.45 4.55 4.53 4.53 0.74 0.83 0.79 0.83 0.78 0.78
Q126* 2.89 2.90 2.70 2.95 2.96 2.87 1.21 1.21 1.12 1.30 1.22 1.20
GPA*** 3.15 2.35 2.94 2.44 2.94 2.86 1.02 1.14 1.12 1.06 1.09 1.12
M59*** 3.33 3.55 3.22 3.61 3.16 3.34 1.21 1.18 1.16 1.18 1.29 1.21
M17 3.44 3.56 3.45 3.54 3.35 3.46 1.20 1.18 1.05 1.17 1.25 1.17
M39*** 3.30 3.57 3.21 3.54 3.17 3.33 1.29 1.28 1.29 1.30 1.36 1.31
M07*** 3.94 3.89 3.70 4.01 3.93 3.88 1.05 0.98 1.02 0.98 1.00 1.02
M38 r *** 4.29 4.40 4.17 4.45 4.28 4.30 0.89 0.86 0.93 0.81 0.90 0.90
Q176** 3.38 3.43 3.33 3.47 3.11 3.34 1.20 1.25 1.07 1.32 1.24 1.20
Q70*** 4.13 4.21 3.90 4.38 4.21 4.13 0.95 0.91 0.99 0.77 0.89 0.94
Q74*** 3.30 3.51 3.32 3.72 3.44 3.39 1.13 1.05 1.05 0.91 1.04 1.07
Q78*** 3.66 3.80 3.62 4.06 3.71 3.71 1.11 1.09 1.05 0.87 1.06 1.08
Q82* 3.50 3.67 3.53 3.74 3.55 3.56 1.14 1.15 1.11 1.01 1.12 1.13
M18neg*** 1.26 1.29 1.52 1.24 1.38 1.34 0.67 0.72 0.89 0.57 0.80 0.75

122
Mean SD
Variablea
White
(n=737)
Latino
(n=460)
Asian
(n=435)
Black
(n=104)
Other
(n=352)
Total
White
(n=737)
Latino
(n=460)
Asian
(n=435)
Black
(n=104)
Other
(n=352) Total
M36neg*** 1.19 1.17 1.34 1.26 1.27 1.23 0.58 0.55 0.64 0.64 0.63 0.60
M55neg*** 1.32 1.52 2.00 1.66 1.58 1.57 0.81 0.94 1.24 1.15 1.00 1.02
M63neg 1.80 1.63 1.80 1.81 1.75 1.76 1.17 1.11 1.14 1.21 1.16 1.15
M48 2.76 2.72 2.87 2.80 2.82 2.79 1.19 1.24 1.10 1.25 1.21 1.19
M52 2.44 2.52 2.56 2.58 2.59 2.52 1.10 1.17 1.05 1.24 1.16 1.12
M53 3.08 2.97 2.96 3.14 3.00 3.02 1.10 1.16 0.97 1.18 1.07 1.09
M40 3.15 3.09 3.04 3.17 3.11 3.11 1.15 1.18 0.98 1.09 1.13 1.12
M62 2.41 2.57 2.51 2.63 2.49 2.49 1.23 1.22 1.12 1.31 1.24 1.21
M61*** 3.27 3.44 3.07 3.54 3.35 3.29 1.19 1.22 1.06 1.11 1.21 1.18
M54*** 3.40 3.27 3.18 3.60 3.42 3.34 1.16 1.16 1.09 1.11 1.10 1.14
M26 3.27 3.25 3.26 3.47 3.30 3.28 1.14 1.18 1.05 1.13 1.07 1.12
M31 r ** 3.51 3.63 3.33 3.63 3.60 3.52 1.34 1.35 1.36 1.43 1.31 1.35
M30 r 3.80 3.81 3.62 3.80 3.88 3.78 1.24 1.22 1.26 1.41 1.18 1.24
M56 r *** 4.04 4.04 3.63 4.13 4.07 3.96 1.23 1.17 1.15 1.20 1.15 1.20
M08 r *** 3.75 3.78 3.46 3.91 3.74 3.70 1.18 1.22 1.20 1.16 1.19 1.20
M32 r 3.35 3.29 3.32 3.48 3.34 3.34 1.29 1.34 1.28 1.29 1.28 1.30
M34 r *** 3.97 4.06 3.60 4.03 4.00 3.92 1.11 1.12 1.20 1.09 1.12 1.14
M49 r *** 4.14 4.31 3.90 4.20 4.01 4.11 1.15 1.05 1.12 1.18 1.22 1.15
Q129*** 1.28 1.35 1.50 1.38 1.31 1.35 0.58 0.63 0.78 0.67 0.60 0.65
Q134 1.38 1.38 1.43 1.54 1.47 1.41 0.67 0.70 0.78 0.86 0.75 0.72
Q173_1 0.11 0.08 0.11 0.07 0.12 0.10 0.31 0.27 0.32 0.25 0.33 0.30

123
Mean SD
Variablea
White
(n=737)
Latino
(n=460)
Asian
(n=435)
Black
(n=104)
Other
(n=352)
Total
White
(n=737)
Latino
(n=460)
Asian
(n=435)
Black
(n=104)
Other
(n=352) Total
AcadValidInst*** 3.57 3.39 3.29 3.69 3.58 3.48 0.83 0.83 0.73 0.85 0.82 0.82
InsAvail** 4.06 4.09 3.90 4.15 4.00 4.03 0.94 0.90 0.85 0.88 0.94 0.91
InsSup* 4.11 4.10 3.94 4.12 4.03 4.06 0.85 0.85 0.79 0.85 0.91 0.85
Q116*** 2.95 2.94 2.89 3.12 3.28 3.00 1.44 1.38 1.44 1.44 1.42 1.43
Q115*** 3.13 3.45 3.52 3.54 3.39 3.35 1.21 1.23 1.16 1.37 1.23 1.23
Q128*** 3.59 3.34 3.89 3.55 3.57 3.59 1.51 1.37 1.65 1.43 1.56 1.53
Q182*** 2.25 2.97 2.89 2.71 2.59 2.62 1.19 1.26 1.20 1.24 1.24 1.25
Q173_9* 0.10 0.06 0.08 0.08 0.12 0.09 0.30 0.23 0.27 0.27 0.32 0.28
Q123 3.59 3.63 3.56 3.63 3.76 3.62 1.14 1.06 1.12 1.11 1.14 1.12
*** p < .001; ** p < .01; *** p < .05 a Refer to Table 1 (page 79) for full variable names.
r Item was reverse coded before analysis.

124
Table 7
Descriptive Statistics for Final Sample by Gender (N = 2,088)
Mean SD
Variablea
Male
(n = 852)
Female
(n = 1,236)
Male
(n = 852)
Female
(n = 1,236)
Q177 4.11 4.12 1.11 1.16
Q125** 10.72 10.12 3.90 4.09
Q180 3.46 3.47 1.44 1.40
SupFamFrd*** 4.45 4.58 0.82 0.76
Q126 2.84 2.88 1.17 1.22
GPA* 2.80 2.90 1.11 1.13
M59 3.33 3.35 1.16 1.25
M17 3.46 3.45 1.13 1.20
M39 3.28 3.37 1.26 1.34
M07* 3.82 3.93 1.03 1.01
M38 r * 4.24 4.33 0.91 0.88
Q176 3.33 3.35 1.21 1.20
Q70*** 4.01 4.21 0.99 0.90
Q74** 3.31 3.45 1.06 1.08
Q78*** 3.58 3.80 1.07 1.07
Q82*** 3.46 3.63 1.13 1.13
M18neg*** 1.41 1.29 0.82 0.70
M36neg*** 1.31 1.18 0.69 0.53
M55neg*** 1.65 1.51 1.07 0.98
M63neg 1.79 1.73 1.14 1.16
M48** 2.69 2.85 1.18 1.20
M52 2.54 2.50 1.08 1.15
M53* 2.95 3.07 1.07 1.10
M40*** 2.99 3.19 1.10 1.12
M62 2.51 2.47 1.18 1.23

125
Mean SD
Variablea
Male
(n = 852)
Female
(n = 1,236)
Male
(n = 852)
Female
(n = 1,236)
M61** 3.21 3.35 1.14 1.20
M54*** 3.19 3.44 1.13 1.13
M26*** 3.19 3.35 1.10 1.13
M31 r 3.53 3.52 1.30 1.38
M30 r 3.75 3.79 1.23 1.25
M56 r * 3.89 4.01 1.20 1.20
M08 r 3.67 3.73 1.18 1.21
M32 r 3.40 3.29 1.27 1.31
M34 r 3.89 3.94 1.14 1.15
M49 r * 4.03 4.16 1.15 1.14
Q129 1.36 1.34 0.66 0.65
Q134 1.39 1.43 0.71 0.73
Q173_1 0.10 0.10 0.30 0.31
AcadValidInst* 3.44 3.51 0.82 0.81
InsAvail*** 3.93 4.10 0.93 0.90
InsSup*** 3.96 4.13 0.86 0.84
Q116 3.01 2.98 1.46 1.41
Q115 3.34 3.35 1.21 1.24
Q128 3.54 3.63 1.50 1.54
Q182 2.68 2.58 1.22 1.28
Q173_9 0.08 0.09 0.28 0.28
Q123* 3.68 3.58 1.04 1.17
*** p < .001; ** p < .01; *** p < .05 a Refer to Table 1 (page 79) for full variable names.
r Item was reverse coded before analysis.

126
Table 8
Descriptive Statistics for Final Sample by Length of College Attendance (N = 2,088)
Mean
Semesters in College
SD
Semesters in College
Variablea
1
(n=282)
2
(n=559)
3-4
(n=657)
5-6
(n=338)
7+
(n=252)
Total
1
(n=282)
2
(n=559)
3-4
(n=657)
5-6
(n=338)
7+
(n=252) Total
Q177 4.13 4.16 4.14 4.09 3.96 4.12 1.09 1.13 1.12 1.19 1.21 1.14
Q125*** 10.04 11.06 11.06 9.84 8.09 10.36 3.98 3.84 3.87 3.93 4.02 4.02
Q119 1.60 1.58 1.58 1.61 1.63 1.59 0.49 0.49 0.50 0.49 0.49 0.49
Q180 3.53 3.34 3.49 3.54 3.54 3.47 1.45 1.44 1.41 1.35 1.42 1.42
SupFamFrd 4.46 4.56 4.51 4.54 4.54 4.53 0.83 0.76 0.78 0.80 0.79 0.78
GPA 2.83 2.85 2.90 2.89 2.78 2.86 1.16 1.21 1.08 1.05 1.07 1.12
M59* 3.48 3.34 3.31 3.21 3.43 3.34 1.16 1.21 1.20 1.26 1.21 1.21
M17 3.47 3.40 3.44 3.49 3.55 3.46 1.12 1.19 1.15 1.19 1.22 1.17
M39** 3.54 3.40 3.27 3.17 3.33 3.33 1.25 1.30 1.30 1.36 1.29 1.31
M07 3.89 3.83 3.88 3.91 3.96 3.88 0.97 1.07 1.01 0.99 1.03 1.02
M38 r ** 4.47 4.31 4.25 4.21 4.32 4.30 0.85 0.88 0.91 0.90 0.91 0.90
Q176 3.40 3.29 3.37 3.33 3.34 3.34 1.19 1.23 1.19 1.21 1.21 1.20

127
Mean
Semesters in College
SD
Semesters in College
Variablea
1
(n=282)
2
(n=559)
3-4
(n=657)
5-6
(n=338)
7+
(n=252)
Total
1
(n=282)
2
(n=559)
3-4
(n=657)
5-6
(n=338)
7+
(n=252) Total
Q70 4.11 4.13 4.14 4.11 4.13 4.13 0.96 0.92 0.96 0.97 0.88 0.94
Q74 3.39 3.42 3.38 3.38 3.40 3.39 1.07 1.10 1.09 1.06 0.98 1.07
Q78 3.78 3.70 3.70 3.69 3.71 3.71 1.04 1.11 1.10 1.08 0.99 1.08
Q82 3.61 3.62 3.52 3.54 3.54 3.56 1.11 1.14 1.17 1.14 1.01 1.13
M18neg* 1.40 1.38 1.35 1.26 1.27 1.34 0.81 0.81 0.75 0.67 0.66 0.75
M36neg 1.28 1.25 1.23 1.21 1.20 1.23 0.66 0.62 0.59 0.57 0.56 0.60
M55neg 1.60 1.61 1.55 1.59 1.46 1.57 1.06 1.06 0.99 1.04 0.94 1.02
M63neg** 1.71 1.75 1.73 1.67 2.01 1.76 1.09 1.13 1.15 1.12 1.31 1.15
M48 2.73 2.73 2.77 2.87 2.88 2.79 1.17 1.20 1.18 1.21 1.19 1.19
M52 2.49 2.51 2.53 2.63 2.38 2.52 1.09 1.16 1.08 1.17 1.11 1.12
M53 3.02 3.02 2.98 3.05 3.07 3.02 1.03 1.11 1.08 1.14 1.05 1.09
M40* 3.16 3.00 3.09 3.20 3.21 3.11 1.03 1.15 1.10 1.13 1.16 1.12
M62 2.55 2.50 2.46 2.48 2.48 2.49 1.27 1.25 1.17 1.18 1.20 1.21
M61 3.37 3.21 3.30 3.33 3.36 3.29 1.13 1.18 1.19 1.19 1.16 1.18

128
Mean
Semesters in College
SD
Semesters in College
Variablea
1
(n=282)
2
(n=559)
3-4
(n=657)
5-6
(n=338)
7+
(n=252)
Total
1
(n=282)
2
(n=559)
3-4
(n=657)
5-6
(n=338)
7+
(n=252) Total
M54 3.30 3.31 3.30 3.42 3.45 3.34 1.04 1.15 1.14 1.18 1.14 1.14
M26 3.29 3.23 3.31 3.28 3.33 3.28 1.14 1.15 1.11 1.11 1.09 1.12
M31 r * 3.58 3.44 3.44 3.63 3.71 3.52 1.31 1.41 1.35 1.32 1.26 1.35
M30 r 3.82 3.71 3.71 3.88 3.90 3.78 1.16 1.32 1.25 1.19 1.19 1.24
M56 r 4.02 3.92 3.91 4.01 4.09 3.96 1.22 1.18 1.22 1.17 1.16 1.20
M08 r 3.77 3.66 3.68 3.70 3.81 3.70 1.15 1.24 1.20 1.16 1.22 1.20
M32 r** 3.55 3.38 3.24 3.25 3.36 3.34 1.27 1.34 1.26 1.27 1.31 1.30
M34 r 3.91 3.91 3.90 4.00 3.90 3.92 1.10 1.19 1.12 1.15 1.13 1.14
M49 r *** 4.26 3.99 4.04 4.25 4.23 4.11 0.97 1.21 1.21 1.01 1.13 1.15
Q129*** 1.27 1.31 1.42 1.39 1.27 1.35 0.51 0.58 0.73 0.71 0.62 0.65
Q134*** 1.32 1.36 1.44 1.46 1.48 1.41 0.67 0.66 0.73 0.76 0.83 0.72
Q173_1*** 0.06 0.06 0.12 0.14 0.13 0.10 0.24 0.25 0.33 0.35 0.33 0.30
AcadValidInst* 3.58 3.41 3.47 3.50 3.55 3.48 0.76 0.81 0.83 0.82 0.82 0.82
InsAvail 4.10 4.04 4.01 3.97 4.03 4.03 0.86 0.94 0.90 0.95 0.90 0.91

129
Mean
Semesters in College
SD
Semesters in College
Variablea
1
(n=282)
2
(n=559)
3-4
(n=657)
5-6
(n=338)
7+
(n=252)
Total
1
(n=282)
2
(n=559)
3-4
(n=657)
5-6
(n=338)
7+
(n=252) Total
InsSup 4.11 4.07 4.05 4.00 4.09 4.06 0.80 0.88 0.86 0.83 0.85 0.85
Q116*** 2.19 2.66 3.16 3.45 3.60 3.00 1.24 1.38 1.37 1.39 1.35 1.43
Q115*** 2.54 3.08 3.53 3.72 3.87 3.35 1.05 1.14 1.19 1.25 1.10 1.23
Q128 3.64 3.48 3.61 3.75 3.55 3.59 1.59 1.45 1.54 1.58 1.49 1.53
Q182 2.45 2.65 2.62 2.62 2.73 2.62 1.18 1.22 1.26 1.27 1.35 1.25
Q173_9*** 0.02 0.09 0.11 0.09 0.10 0.09 0.15 0.28 0.31 0.29 0.31 0.28
Q123** 3.40 3.67 3.65 3.72 3.55 3.62 1.23 1.14 1.08 1.03 1.13 1.12
*** p < .001; ** p < .01; *** p < .05 a Refer to Table 1 (page 79) for full variable names.
r Item was reverse coded before analysis.

130
Structural Equation Modeling Analyses
This section reports findings for Research Questions 1, 1.1, 2, 2.1, 3, and 4. The analyses
entailed several confirmatory factor analyses (CFA), multiple group invariance analyses, and
hybrid path analyses, which were guided by the conceptual model depicted in Figure 1 (p. 65).
All were conducted in the context of structural equation modeling (SEM) in AMOS 21. Since
the dataset was multivariate non-normal, Maximum Likelihood estimation with 2,000 bootstrap
samples was used in each analysis. Bollen-Stine bootstrap bias corrected p-values were used in
the interpretation of model fit, instead of the usual ML p-value used with normally distributed
data. A non-significant χ2 is indicative of good fit and is regarded as the “gold standard” by
SEM methodologists, albeit it is also recognized it is highly susceptible to large sample sizes and
may lead to the rejection of models, all too frequently, even if the model is correct (Byrne, 2010;
Hayduk & Littvay, 2012; Kline, 2005; MacCullum, 1995; West, Taylor, & Wu, 2012). Several
indices of fit were used in addition to the χ2 p-value. These included : the χ2 to df ratio (with
values < 4.0 desired); the comparative fit index (CFI; ≥ .90-95); the root mean square error of
approximation and RMSEA 90% confidence interval (RMSEA; ≤ .06, although values ≤ .10 may
be acceptable); and, lastly, the standardized root mean square residual (SRMR; ≤ .10). These
indices account for such things as sample size, number of parameters in the model, model
complexity, and degrees of freedom (Byrne, 2010; Kline, 2005; Ullman, 2006; West et al.,
2012).
Research Question 1: The Measurement Model
Research Question 1 is concerned with the assessment of the measurement model
depicted in Figure 1, with the exception of all control variables. Accordingly, the key task was
to demonstrate that the implied measurement model for institutional commitment, interactions

131
with diverse peers, perceptions of a hostile campus climate, sense of belonging, mattering,
engagement/involvement, and socio-academic integrative experiences adequately fit the
observed data. While each factor was originally proposed to encompass the specific variables
denoted in Table 1 (p. 79), it was also a goal to develop as parsimonious a model as possible, and
where appropriate, model trimming or model building was to be pursued.
With respect to the number of items forming a factor, questions have been raised in the
literature as to just how many indicators should “compose” or represent a given construct in
SEM. Based on a recent review of the literature, discussions on the SEM Network (SEMNET
listserv), and statistical evidence, Hayduk and Littvay (2012, p. 1), noted that using the “few best
indicators… are often sufficient. More than three indicators are rarely warranted because
additional redundant indicators provide less research benefit.”
As an initial step in assessing the identification of the measurement model for Research
Question 1, and given the exploratory nature of this study, a series of confirmatory factor
analyses were conducted to ascertain that the proposed indicators were in fact representative of
the construct. Once the individual CFAs were conducted, the analysis of the omnibus
measurement model depicted in Figure 1 followed.
Preliminary Confirmatory Factor Analyses by Construct
CFA of Institutional Commitment to Students. The hypothesized model for
institutional commitment was composed of six items: M59—Counselors at the college generally
show their concern for students' well-being; M17—My counselor is generally receptive to what I
have to say; M39—If I had a personal problem, I believe that counselors would be willing to
discuss it with me; M07—It is comforting to know that my contributions are valued by my
instructors; M38—My instructors sometimes ignore my comments or questions; and Q176—I

132
received all the assistance I needed to successfully transition and adjust to the college. A
review of the CFA results, suggested the model was of poor fit for the data and should be
rejected, bootstrap Bollen-Stine χ2(9, N = 2,088) = 78.61, p < .001, χ2/df = 8.74, CFI = .98,
SRMR = .04, RMSEA = .06 (90% CI = .049, .074). A review of factor loadings, univariate and
multivariate normality estimates, standardized residuals, MIs, and EPC statistics pointed that
indicators M38 (instructors sometimes ignore comments or questions) and M07 (student
contributions being valued by instructors) might be problematic as they were associated with
error covariances with other items. Hence, these items were eliminated from further
consideration. The respecified model resulted in improved fit, bootstrap Bollen-Stine χ2(2, N =
2,088) = 2.15, p = .40, χ2/df = 1.07, CFI = 1.0, SRMR = .01, RMSEA = .01 (90% CI = .001,
.044).
Thus, institutional commitment to students was represented with four indicators (M59,
M17, M39, Q176) as noted on Table 9, which also presents a summary of the goodness of fit
statistics for the alternate models discussed above.
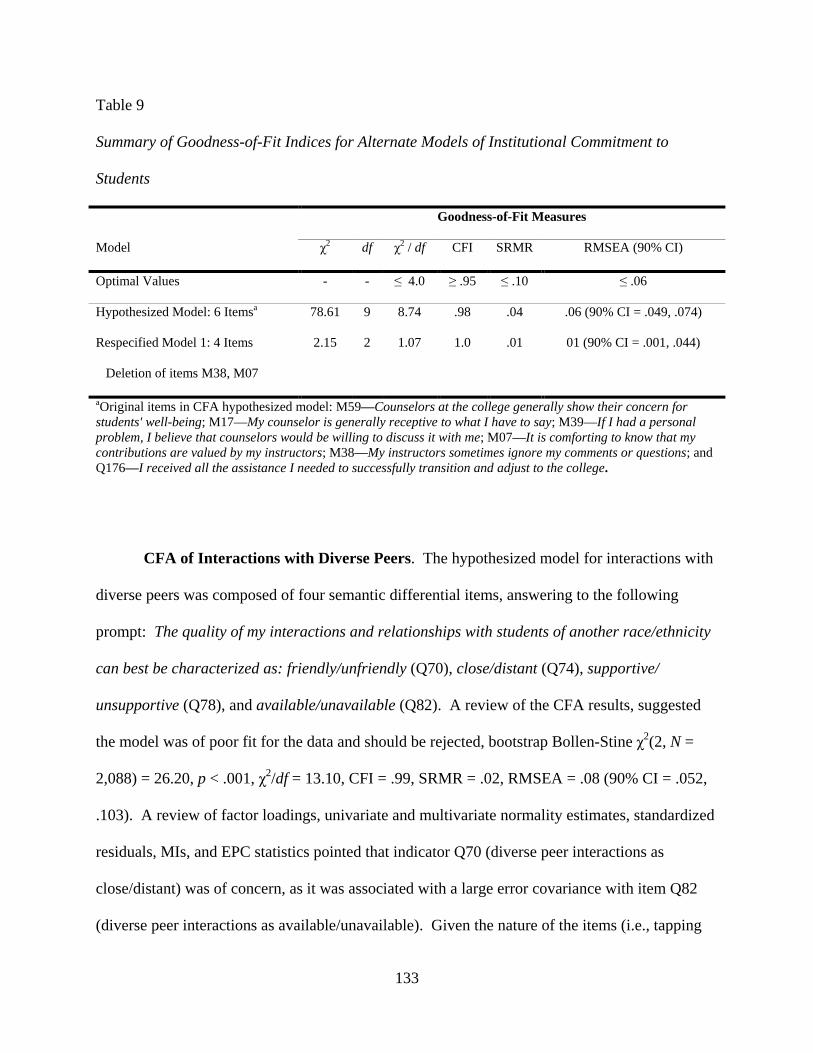
133
Table 9
Summary of Goodness-of-Fit Indices for Alternate Models of Institutional Commitment to
Students
Goodness-of-Fit Measures
Model χ2 df χ2 / df CFI SRMR RMSEA (90% CI)
Optimal Values - - ≤ 4.0 ≥ .95 ≤ .10 ≤ .06
Hypothesized Model: 6 Itemsa 78.61 9 8.74 .98 .04 .06 (90% CI = .049, .074)
Respecified Model 1: 4 Items
Deletion of items M38, M07
2.15 2 1.07 1.0 .01 01 (90% CI = .001, .044)
aOriginal items in CFA hypothesized model: M59—Counselors at the college generally show their concern for students' well-being; M17—My counselor is generally receptive to what I have to say; M39—If I had a personal problem, I believe that counselors would be willing to discuss it with me; M07—It is comforting to know that my contributions are valued by my instructors; M38—My instructors sometimes ignore my comments or questions; and Q176—I received all the assistance I needed to successfully transition and adjust to the college.
CFA of Interactions with Diverse Peers. The hypothesized model for interactions with
diverse peers was composed of four semantic differential items, answering to the following
prompt: The quality of my interactions and relationships with students of another race/ethnicity
can best be characterized as: friendly/unfriendly (Q70), close/distant (Q74), supportive/
unsupportive (Q78), and available/unavailable (Q82). A review of the CFA results, suggested
the model was of poor fit for the data and should be rejected, bootstrap Bollen-Stine χ2(2, N =
2,088) = 26.20, p < .001, χ2/df = 13.10, CFI = .99, SRMR = .02, RMSEA = .08 (90% CI = .052,
.103). A review of factor loadings, univariate and multivariate normality estimates, standardized
residuals, MIs, and EPC statistics pointed that indicator Q70 (diverse peer interactions as
close/distant) was of concern, as it was associated with a large error covariance with item Q82
(diverse peer interactions as available/unavailable). Given the nature of the items (i.e., tapping

134
into the same aspect of student interactions), an error covariance between these items (Q70 and
Q82) was imposed and freely estimated in the subsequent run. The respecified model resulted in
significant improved fit, bootstrap Bollen-Stine χ2(1, N = 2,088) = 1.33, p = .31, χ2/df = 1.33, CFI
= 1.0, SRMR = .01, RMSEA = .01 (90% CI = .001, .061). Table 10 presents a summary of the
goodness of fit statistics for the alternate models discussed above.
Thus, interactions with diverse peers was represented with the four indicators originally
hypothesized (Q70, Q74, Q78, and Q82) and with an error covariance for indicators Q70 and
Q82 in the assessment of the measurement model in Figure 1, as summarized in Table 10.
Table 10
Summary of Goodness-of-Fit Indices for Alternate Models of Interactions with Diverse Peers
Goodness-of-Fit Measures
Model χ2 df χ2 / df CFI SRMR RMSEA (90% CI)
Optimal Values - - ≤ 4.0 ≥ .95 ≤ .10 ≤ .06
Hypothesized Model: 4 Itemsa 26.20 2 13.10 .99 .02 .08 (90% CI = .052, .103)
Respecified Model 1: 4 Items
Addition: error covariance
between eQ70-eQ82
1.33 1 1.33 1.0 .01 .01 (90% CI = .001, .061)
a Original items in CFA hypothesized model: The quality of my interactions and relationships with students of another race/ethnicity can best be characterized as: friendly/unfriendly (Q70), close/distant (Q74), supportive/ unsupportive (Q78), and available/unavailable (Q82).

135
CFA of Perceptions of a Hostile Campus Climate. The hypothesized model for
perceptions of a hostile campus climate was composed of four items: M18—I sometimes feel
alone and isolated at the college because of my gender (reverse coded); M55—I sometimes feel
alone and isolated because of my race/ethnicity (reverse coded); M36neg—I sometimes feel
alone and isolated because of my sexual orientation (reverse coded); M63—I sometimes feel
alone and isolated because of my age (reverse coded).
A review of the CFA results (Table 11) suggested the model was of good fit for the data,
bootstrap Bollen-Stine χ2(2, N = 2,088) = 7.11, p = .10, χ2/df = 3.55, CFI = 1.00, SRMR = .01,
RMSEA = .04 (90% CI = .010, .064). A review of factor loadings, univariate and multivariate
normality estimates, standardized residuals, MIs, and EPC statistics were also within expected
parameters.
Thus, perceptions of a hostile campus climate was represented with the four indicators
(M18, M55, M36, and M63), as originally planned, in the assessment of the measurement model
in Figure 1.
Table 11
Summary of Goodness-of-Fit Indices for Perceptions of a Hostile Campus Climate
Goodness-of-Fit Measures
Model χ2 df χ2 / df CFI SRMR RMSEA (90% CI)
Optimal Values - - ≤ 4.0 ≥ .95 ≤ .10 ≤ .06
Hypothesized Model: 4 Itemsa 7.11 2 3.55 1.00 .01 .04 (90% CI = .010, .064)
a Original items in CFA hypothesized model: M18—I sometimes feel alone and isolated at the college because of my gender (reverse coded); M55—I sometimes feel alone and isolated because of my race/ethnicity (reverse coded); M36neg—I sometimes feel alone and isolated because of my sexual orientation (reverse coded); M63—I sometimes feel alone and isolated because of my age (reverse coded).

136
CFA of Sense of Belonging. The hypothesized model for sense for belonging was
composed of seven items: M31—Sometimes I feel alone at the college; M30—Sometimes I feel
that no one at the college notices me; M56—I often feel socially inadequate at school; M08—
Sometimes I feel that I am not interesting to anyone at the college; M32—Sometimes I get so
wrapped up in my personal problems that I isolate myself from others at the college; M34—I
often feel isolated when involved in student activities; M49—I often feel that I do not belong at
this college.
A review of the CFA results, suggested the model was of poor fit for the data and should
be rejected, bootstrap Bollen-Stine χ2(14, N = 2,088) = 120.78, p < .001, χ2/df = 8.63, CFI = .98,
SRMR = .04, RMSEA = .06 (90% CI = .051, .071). Factor loadings, univariate and multivariate
normality estimates, standardized residuals, MIs, and EPC statistics indicated that items M56
(social inadequacy) and M08 (not of interest to anyone at the college) were associated with large
error covariances with multiple other items. Moreover, it appeared that M30 (no one notices
student) and M32 (self-isolation from others) shared a degree of redundancy, and allowing their
error covariances to be freely estimated might result in improved model fit. Hence, items M56
and M08 were deleted from further consideration. A freely estimated error covariance for M30
and M32 was permitted in the next run. The respecified model resulted in improved fit, with a
bootstrap Bollen-Stine χ2(4, N = 2,088) = 9.99, p = .09, χ2/df = 2.20, CFI = 1.00, SRMR = .02,
RMSEA = .03 (90% CI = .005, .048). Table 12 presents a summary of the goodness of fit
statistics for the alternate models discussed above.
Thus, sense of belonging was represented with five (M31, M30, M32, M34, and M49)
indicators and with an error covariance between item M30 and M32 in the assessment of the
measurement model in Figure 1.

137
Table 12
Summary of Goodness-of-Fit Indices for Alternate Models of Sense of Belonging
Goodness-of-Fit Measures
Model χ2 df χ2 / df CFI SRMR RMSEA (90% CI)
Optimal Values - - ≤ 4.0 ≥ .95 ≤ .10 ≤ .06
Hypothesized Model: 7 Itemsa 120.78 14 8.63 .98 .04 .06 (90% CI = .051, .071)
Respecified Model 1: 5 Items
Deletion of items M56, M08
Addition: error covariance
between M30-M32
9.99 4 220 1.00 .02 .03 (90% CI = .005, .048)
a Original items in CFA hypothesized model: M31—Sometimes I feel alone at the college; M30—Sometimes I feel that no one at the college notices me; M56—I often feel socially inadequate at school; M08—Sometimes I feel that I am not interesting to anyone at the college; M32—Sometimes I get so wrapped up in my personal problems that I isolate myself from others at the college; M34—I often feel isolated when involved in student activities; M49—I often feel that I do not belong at this college.
CFA of Mattering. The hypothesized model for mattering was composed of eight items:
M48—There are people on campus who are sad for me when I fail in something I set out to do;
M52—Some people on campus are disappointed in me when I do not accomplish all I should;
M53—People on campus are generally supportive of my individual needs; M40—People on
campus seem happy about my accomplishments; M62—I sometimes feel pressured to do better
because people at the college would be disappointed if I did not; M61—There are people at the
college who are concerned about my future; M54—There are people at the college who are
genuinely interested in me as a person; M26—Other students are happy for me when I do well in
exams or projects.

138
CFA results suggested the model was of very poor fit for the data and should be rejected,
bootstrap Bollen-Stine χ2(20, N = 2,088) = 432.21, p < .001, χ2/df = 21.61, CFI = .95, SRMR =
.05, RMSEA = .10 (90% CI = .091, .108). A review of factor loadings, univariate and
multivariate normality estimates, standardized residuals, MIs, and EPC statistics indicated that
items M52 (Some people on campus are disappointed in me when I do not accomplish all I
should) and M40 (People on campus seem happy about my accomplishments) were connected to
large error covariances with several other items. Item M52 appeared to be especially tapping
into the same aspect of mattering as item M48 (There are people on campus who are sad for me
when I fail in something I set out to do), and had a higher kurtosis value. The same was true for
M40 with M26 (Other students are happy for me when I do well in exams or projects). Other
items of concern were M62 (I sometimes feel pressured to do better because people at the
college would be disappointed if I did not) and M26, albeit to a lesser degree. Hence, items M52
and M40 were deleted from further consideration in the subsequent run. The respecified model
resulted in improved fit; though not to an acceptable degree, bootstrap Bollen-Stine χ2(9, N =
2,088) = 132.19, p < .001, χ2/df = 14.67, CFI = .98, SRMR = .04, RMSEA = .08 (90% CI = .069,
.093). Again, an examination of the results reinforced the suspicion that indicators M62 and
M26 were exercising undue influence on model fit, with excessive MI values owning to error
covariances with several items. A decision was made to pursue an additional modification to the
model by removing these indicators. Indices of fit readily pointed to the soundness of this
decision, suggesting a good model: bootstrap Bollen-Stine χ2(2, N = 2,088) = 2.88, p = .32, χ2/df
= 1.44, CFI = 1.00, SRMR = .01, RMSEA = .02 (90% CI = .001, .048). Table 13 presents a
summary of the goodness of fit statistics for the alternate models discussed above.

139
Thus, mattering was represented with four indicators (M48, M53, M61, and M54) in the
assessment of the measurement model in Figure 1.
Table 13
Summary of Goodness-of-Fit Indices for Alternate Models of Mattering
Goodness-of-Fit Measures
Model χ2 df χ2 / df CFI SRMR RMSEA (90% CI)
Optimal Values - - ≤ 4.0 ≥ .95 ≤ .10 ≤ .06
Hypothesized Model: 8 Itemsa 432.21 20 21.61 .95 .05 .10 (90% CI = .091, .108)
Respecified Model 1: 6 Items
Deletion of items M52, M40
132.19 9 14.67 .98 .04 .08 (90% CI = .069, .093)
Respecified Model 2: 4 Items
Deletion of items M62, M26
a Original items in CFA hypothesized model: M48—There are people on campus who are sad for me when I fail in something I set out to do; M52—Some people on campus are disappointed in me when I do not accomplish all I should; M53—People on campus are generally supportive of my individual needs; M40—People on campus seem happy about my accomplishments; M62—I sometimes feel pressured to do better because people at the college would be disappointed if I did not; M61—There are people at the college who are concerned about my future; M54—There are people at the college who are genuinely interested in me as a person; M26—Other students are happy for me when I do well in exams or projects.
CFA of Socio-academic Integrative Experiences. The hypothesized model for socio-
academic integrative experiences was composed of eight items: AcadValidInst—academic
validation from instructors; InsAvail—quality of student interactions and relationships with
instructors as available/unavailable; InsSup—quality of student interactions and relationships
with instructors as supportive/unsupportive; Q116—times meeting with instructors outside of
class, Q115—times meeting with a counselor; Q128—hours spent per week studying; Q182—I

140
have experienced significant academic difficulties while attending college; and Q173_9—
Scholars Program (honors program) participant.
The CFA results suggested the model was of very poor fit for the data and should be
rejected, bootstrap Bollen-Stine χ2(20, N = 2,088) = 784.69, p < .001, χ2/df = 39.23, CFI = .78,
SRMR = .15, RMSEA = .14 (90% CI = .127, .144). Item Q173_9 (participation in Scholars
Program) was severely skewed and kurtotic, and showed a very high standardized residual with
Q115 (times meeting with a counselor). The MI for the error covariance between items Q115
and Q116 (number of times meeting with instructors) was the highest at 302.69 units. Before
proceeding with additional analyses, and given the apparent redundancy or overlap between the
two items (number of times meeting with institutional agents), the two items were combined and
averaged into a new variable named InstAgents.
Thus, the hypothesized model was respecified by deleting Q115 and Q116, and
substituting them with the new variable, number of times meeting with institutional agents—
InstAgents. However, the fit statistics for the model continued to show a significant lack of fit,
bootstrap Bollen-Stine χ2(14, N = 2,088) = 411.85, p < .001, χ2/df = 29.42, CFI = .87, SRMR =
.09, RMSEA = .12 (90% CI = .107, .117). Factor loadings for meetings with institutional agents,
hours spent per week studying, experiencing academic difficulties, and participation in Scholars
Program, were relatively small (loadings < .20), in comparison to the other three items (academic
validation from instructor, perceived instructor availability, perceived instructor support), which
had much higher loadings (.60-.90). Given this, three items were deleted from the next
respecified model (hours spent studying, experiencing academic difficulties while in college, and
Scholars Program participation), while keeping the variable InstAgents (number of times

141
meeting with institutional agents), partially justified on theoretical grounds; but also out of
concern that the resulting CFA model would be under-identified with just three indicators.
Analyses with three items on a single factor in the context of a CFA, results in an
unidentified model, with zero degrees of freedom; thus AMOS will not allow the analysis to
continue. This is often not an issue of concern when such factor (with 3 indicators) is combined
with others into a multifactor model (such as the measurement model shown in Figure 1). Thus,
by permitting InstAgents to remain in the socio-academic integrative experiences factor, the
analysis proceeded.
Fit indices for the second respecified model consisting of four items (meetings with
institutional agents, academic validation from instructors, perceived instructor availability,
perceived instructor support) resulted in significant improvement, bootstrap Bollen-Stine χ2(2, N
= 2,088) = 47.19, p < .001, χ2/df = 23.59, CFI = .98, SRMR = .03, RMSEA = .10 (90% CI =
.080, .131). However, the significant χ2 suggested the model was of poor fit to the data. While
examining the MIs, it was noted that allowing an error covariance between meetings with
institutional agents and academic validation from instructors would result in a better model. The
covariance was guided by theory suggesting that faculty-student relationships might be affected
in part by the type and frequency of informal interactions students have with instructors outside
of class to discuss academic, personal, career, or social issues (Deil-Amen, 2011; Tinto, 1993,
2012a). After imposing the error covariance, the model’s fit was significantly improved,
bootstrap Bollen-Stine χ2(1, N = 2,088) = 2.63, p = .12, χ2/df = 2.63, CFI = 1.00, SRMR = .01,
RMSEA = .03 (90% CI = .001, .072). Table 14 presents a summary of the goodness of fit
statistics for the alternate models discussed above.

142
Socio-academic integrative experiences was represented with four indicators (meetings
with institutional agents, academic validation from instructors, perceived instructor availability,
perceived instructor support) and an error covariance between academic validation from
instructors and meetings with institutional agents) in the assessment of the measurement model
in Figure 1.
Table 14
Summary of Goodness-of-Fit Indices for Alternate Models of Socio-academic Integrative
Experiences
Goodness-of-Fit Measures
Model χ2 df χ2 / df CFI SRMR RMSEA (90% CI)
Optimal Values - - ≤ 4.0 ≥ .95 ≤ .10 ≤ .06
Hypothesized Model: 8 Itemsa 784.69 20 39.23 .78 .15 .14 (90% CI = .127, .144)
Respecified Model 1: 7 Items
Averaged items Q115, Q116 into
InstAgents
411.85 14 29.42 .87 .09 .12 (90% CI = .107, .117).
Respecified Model 2:4 Items
Deletion of items Q128, Q182,
173_9
47.19 2 23.59 .98 .03 .10 (90% CI = .080, .131)
Respecified Model 3:4 Items
Error covariance for
AcadValidInst and InstAgents
2.63 1 2.63 1.00 .01 .03 (90% CI = .001, .072).
a Original items in CFA hypothesized model: AcadValidInst—academic validation from instructors; InsAvail—quality of student interactions and relationships with instructors as available/unavailable; InsSup—quality of student interactions and relationships with instructors as supportive/unsupportive; Q116—times meeting with instructors outside of class, Q115—times meeting with a counselor; Q128—hours spent per week studying; Q182—I have experienced significant academic difficulties while attending college; and Q173_9—Scholars Program (honors program) participant.

143
CFA of Engagement/Involvement. The hypothesized model for
engagement/involvement was originally conceptualized with three items (Q129—hours spent on
campus activities; Q173_1—currently holding leadership role in the Associated Students
organization or a club officer; Q134—hours per week spent volunteering). Since two items
originally thought to reflect socio-academic integrative experiences were in fact of poor fit for
that construct, a decision was made to incorporate these (Q128—hours per week spent studying;
and Q173_9—Scholars Program[honors] participation) into the engagement/involvement factor.
These items measure “efforts” students devote to academic endeavors: hours studying and
participation in an honors program. These indicators seem to reflect “good practices” associated
with the general engagement framework (Kuh, 2001, 2006; Kuh, Whitt, & Strange, 1989;
McClenney, 2007; McClenney & Marti, 2006; McClenney et al., 2006). Thus, the
engagement/involvement model was specified with five variables. The CFA results (Table 15)
suggested the model was of good fit for the data, bootstrap Bollen-Stine χ2(5, N = 2,088) =
10.24, p = .17, χ2/df = 2.05, CFI = .99, SRMR = .01, RMSEA = .02 (90% CI = .001, .042). No
additional constraints were imposed on the model.
Engagement/involvement was represented with the five indicators above (Q128, Q129,
Q134, Q173_1, and Q173_9) in the assessment of the measurement model in Figure 1.

144
Table 15
Summary of Goodness-of-Fit Indices for Engagement/Involvement Model
Goodness-of-Fit Measures
Model χ2 df χ2 / df CFI SRMR RMSEA (90% CI)
Optimal Values - - ≤ 4.0 ≥ .95 ≤ .10 ≤ .06
Hypothesized Model: 5 Items 10.24 5 2.05 .99 .01 .02 (90% CI = .001, .042)
a Original items in CFA hypothesized model: Q129—hours spent on campus activities; Q173_1—currently holding leadership role in the Associated Students organization or a club officer; Q134—hours per week spent volunteering; Q128—hours per week spent studying; and Q173_9—Scholars Program[honors] participation.
Confirmatory Factor Analysis for the Conceptual Model
Model Specification. Following the preliminary analyses above, the full measurement
model associated with the conceptual model illustrated in Figure 1 was specified in AMOS with
seven factors. Each factor was represented by the indicators and error covariances noted for the
individual CFAs above. A graphical representation of the measurement model as produced by
AMOS is shown in Figure 3. As illustrated, the model is hypothesized to consist of seven
factors: institutional commitment to students, interactions with diverse peers, perceptions of a
hostile campus climate, sense of belonging, mattering, engagement/involvement, and socio-
academic integrative experiences. The key research question guiding the analysis was: Does the
hypothesized model adequately fit the observed data? If not, what respecified model results in
improved model fit?
Since the dataset exhibited evidence of skewness and kurtosis in the preliminary
descriptive analyses, maximum likelihood estimation with 2,000 bootstrap samples was used in
AMOS 21. The bootstrap procedure produced the Bollen-Stine corrected χ2 p-value to help

145
Figure 3. Graphical representation of the measurement model for the hypothesized Conceptual
Model as produced by AMOS.

146
assess model fit. Several indices of fit were also used to assess the overall goodness of fit for the
model, including the χ2/df ratio, CFI, SRMR, and RMSEA.
Model Identification. The goal of this step was to have a model that was over identified
to enable hypothesis testing. Thus, the number of parameters (e.g., regression coefficients,
variances, covariances) to be estimated had to be less than the number of observations in the
model [observations = p(p + 1)/2; where p is the number of observed variables]. The difference
between the observations and the number of parameters to be estimated had to be positive, thus
resulting in the number of degrees of freedom associated with the specified model (df > 0). The
resulting number of observations was 465 [observations = 30(30 + 1)/2]. Accordingly, the CFA
model noted in Figure 3 consisted of 84 parameters to be estimated. Thus the resulting number
of degrees of freedom was 381 [465 - 84 = 381]. With respect to sample size and power, the
ratio of cases to the number of parameters to be estimated should be 10:1, although this is often
not met in SEM studies (Kline, 2005). The resulting ratio for the CFA was 25:1, exceeding the
threshold significantly. Moreover, this step necessitated that each latent variable be scaled to a
metric. The first congeneric variable for each factor was set to a 1.0 loading and a zero loading
on other factors.
Evaluation of Model Fit—Seven Factors/30 Indicators. Results of the confirmatory
factor analysis revealed the hypothesized model was a poor fit to the data and should be rejected,
bootstrap Bollen-Stine χ2(381, N = 2,088) = 2516.26, p < .001, χ2/df = 6.60, CFI = .91, SRMR =
.06, RMSEA = .05 (90% CI = .050, .059). While the SRMR and RMSEA values fell within
acceptable thresholds, the significant bias corrected χ2, the χ2/df ratio, and the CFI value did not.
The standardized residual covariance matrix included multiple residual values in excess
of 2.58, which are considered large and indicative of model misfit (Byrne, 2010). Indicators

147
M61— There are people at the college who are concerned about my future—and academic
validation from instructors had the largest standardized residual of 11.14. Academic validation
from instructors also shared excessive standardized covariances with other indicators (M30—
Sometimes I feel that no one at the college notices me; M48— There are people on campus who
are sad for me when I fail in something I set out to do; M53— People on campus are generally
supportive of my individual needs; M61— There are people at the college who are concerned
about my future; M54— There are people at the college who are genuinely interested in me as a
person; and Q128—hours per week spent studying).
Meetings with institutional agents (InstAgents) also had eight covariances with other
items (M48, M61, M54, Q173_9—Scholar Program member, Q129—hours per week spent on
campus activities, Q134—hours per week spent volunteering, Q128, and Q173_1—currently
hold leadership role in Associated Students organization of college club).
Item Q176 (transition assistance to college) also exhibited large standardized residuals
with 19 other indicators, although those associated with M49 (I often feel that I do not belong at
this college), AcadValidInst, and M61 were of greater concern since the residual values were
above 6.0. Indeed, a review of the MIs for the regression weights showed that meetings with
institutional agents—originally hypothesized to represent the Socio-academic Integrative
Experiences (SAIE) factor—cross-loaded with the Engagement/Involvement factor. The MI was
the largest at 233.91 (EPC = 1.11). Additionally, academic validation from instructors, with a
MI value of 201.73 (EPC = 0.26) showed evidence of cross-loading with the Mattering factor,
and possibly with Institutional Commitment to Students factor (IC2S; MI = 2.57; EPC = 0.14);
although such cross-loadings did not support the temporal and causal nature implied in the
Conceptual Model in Figure 1. Item Q176 also showed moderate MIs indicative of possible

148
cross-loadings on the Perceived Hostile Campus Climate (HCC) factor, Sense of Belonging
(SOB) factor, and Interactions with Diverse Peers (IWDP) factor, not to mention multiple error
covariances.
Reviewing the content of the items, it appears that academic validation from
instructors—an indicator intended for the SAIE factor), shares a strong covariance with items
primarily tapping into the constructs of mattering and sense of belonging. The same may be said
for meetings with institutional agents (also an indicator for the SAIE factor) being closely
associated with aspects of Mattering and Engagement/Involvement. As for Q176 (transition
assistance to college), it is conceivable that in receiving transition support from the institution to
aid in the adjustment to college, students consider all those institutional agents, programs, and
services that came to their aid. Moreover, these actions, in turn affected students’ perceptions of
the campus climate and their relationships with agents and diverse peers.
Given the above sources of concern and evidence of misfit, the hypothesized
measurement model above was rejected. Consistent with the exploratory nature of this study,
model respecification was pursued. Details follow.
Evaluation of Fit for Respecified Model 1—Seven Factors/27 Indicators. The
respecified model consisted of seven factors with 27 indicators, after the deletion of three items:
academic validation from instructors, meetings with institutional agents, and transition assistance
to college. The previous error covariance between academic validation from instructors and
meetings with institutional agents was also removed. A total of 77 parameters were estimated,
with a resulting 301 degrees of freedom. The ratio of parameters to be estimated to cases in the
analysis was 27:1. Results of the confirmatory factor analysis revealed the respecified model
was a poor fit to the data and should be rejected, bootstrap Bollen-Stine χ2(378, N = 2,088) =
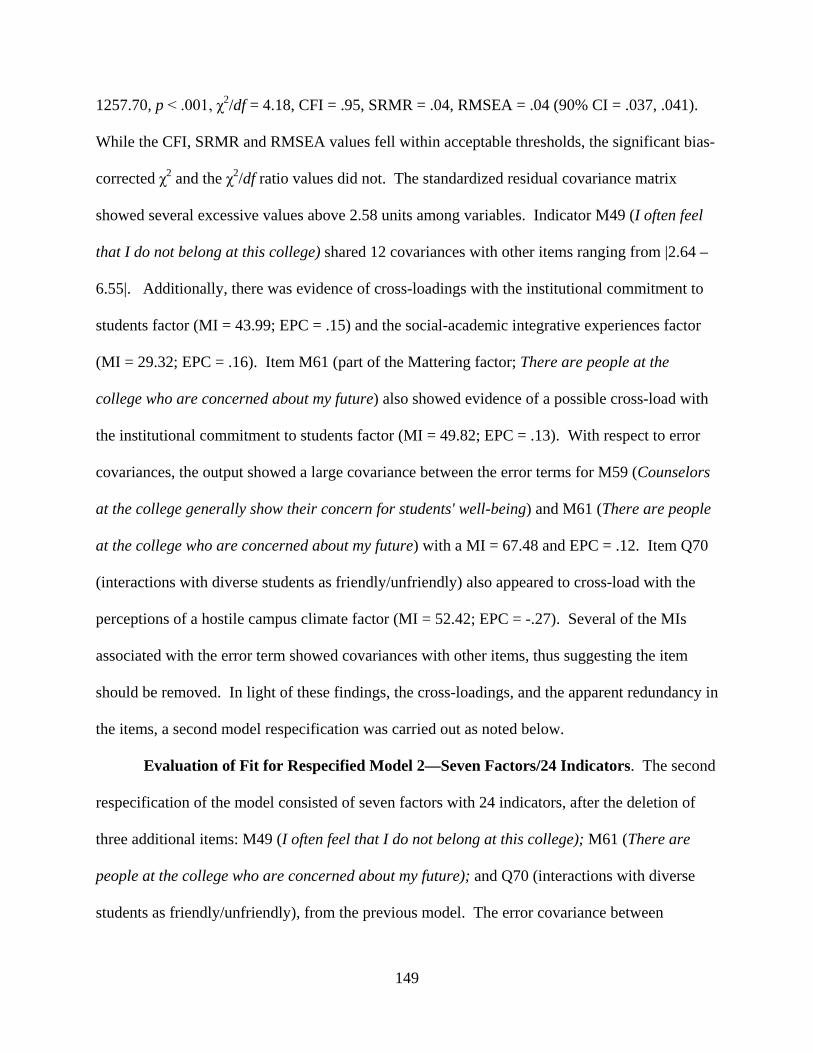
149
1257.70, p < .001, χ2/df = 4.18, CFI = .95, SRMR = .04, RMSEA = .04 (90% CI = .037, .041).
While the CFI, SRMR and RMSEA values fell within acceptable thresholds, the significant bias-
corrected χ2 and the χ2/df ratio values did not. The standardized residual covariance matrix
showed several excessive values above 2.58 units among variables. Indicator M49 (I often feel
that I do not belong at this college) shared 12 covariances with other items ranging from |2.64 –
6.55|. Additionally, there was evidence of cross-loadings with the institutional commitment to
students factor (MI = 43.99; EPC = .15) and the social-academic integrative experiences factor
(MI = 29.32; EPC = .16). Item M61 (part of the Mattering factor; There are people at the
college who are concerned about my future) also showed evidence of a possible cross-load with
the institutional commitment to students factor (MI = 49.82; EPC = .13). With respect to error
covariances, the output showed a large covariance between the error terms for M59 (Counselors
at the college generally show their concern for students' well-being) and M61 (There are people
at the college who are concerned about my future) with a MI = 67.48 and EPC = .12. Item Q70
(interactions with diverse students as friendly/unfriendly) also appeared to cross-load with the
perceptions of a hostile campus climate factor (MI = 52.42; EPC = -.27). Several of the MIs
associated with the error term showed covariances with other items, thus suggesting the item
should be removed. In light of these findings, the cross-loadings, and the apparent redundancy in
the items, a second model respecification was carried out as noted below.
Evaluation of Fit for Respecified Model 2—Seven Factors/24 Indicators. The second
respecification of the model consisted of seven factors with 24 indicators, after the deletion of
three additional items: M49 (I often feel that I do not belong at this college); M61 (There are
people at the college who are concerned about my future); and Q70 (interactions with diverse
students as friendly/unfriendly), from the previous model. The error covariance between

150
interactions with diverse peers as friendly/unfriendly and Q82 (interactions with diverse students
as available/unavailable) was also removed since Q70 was removed from the model. A total of
70 parameters were estimated, resulting in 230 degrees of freedom. The ratio of parameters to be
estimated to cases in the analysis was 30:1.
Results of the respecified confirmatory factor analysis revealed the second respecification
of the model resulted in improved fit. The goodness of fit measures for this model were:
bootstrap Bollen-Stine χ2(230, N = 2,088) = 804.56, p < .001, χ2/df = 3.50, CFI = .97, SRMR =
.04, RMSEA = .04 (90% CI = .032, .037). Based on the indices of fit criteria selected for this
study, Respecified Model 2 met all but the non-significant χ2 threshold. However, as has been
discussed, a significant χ2 may be due to the large sample size employed in this analysis. In
reviewing the modification indices associated with regression weights and covariances, none
“stood out” to signal a significant misspecification in the model. There were three sets of error
covariances that could possibly have been freely estimated in the model (eH63-eS31; eM54-
eS30; and eH55-eE128). The MI for these sets were MI = 23.34 (EPC = -.10), MI = 19.86 ( =
.07), and MI = 13.28 (EPC = .10), respectively. These values were not considered sufficiently
large to justify the error covariances, despite the fact that an argument based on theoretical
grounds could have been made.
In the interest of parsimony, Respecified Model 2 is presented as the model of best fit for
the data in this study.
Research Question 1 Conclusion
In response to the research question proposed, the hypothesized measurement model
depicted in Figure 3 did not fit the data adequately. Consistent with the research question, an
alternate model of best fit (Respecified Model 2) is presented in its place. Figures 4 and 5

151
present standardized and non-standardized coefficients for the model. All regression weights
(factor loadings) are statistically significant at p < .001. All correlations among the factors are
statistically significant at p < .001, with the exception of perceptions of a hostile campus climate
and engagement/involvement, which was not significant (p = .06). The error covariance between
eS30 and eS32 was significant at p < .05. Table A-1 presents these coefficients in tabular form.
Table 16 below presents a summary of goodness-of-fit indices for the Hypothesized
model, Respecified Model 1, and Respecified Model 2—model of best fit.

152
Figure 4. Standardized coefficients for Respecified Model 2

153
Figure 5. Unstandardized coefficients for Respecified Model 2

154
Table 16
Summary of Goodness-of-Fit Indices for Alternate Models of the Conceptual Measurement
Model
Goodness-of-Fit Measures
Model χ2 df χ2 / df CFI SRMR RMSEA (90% CI)
Optimal Values - - ≤ 4.0 ≥ .95 ≤ .10 ≤ .06
Hypothesized Model: 30 Itemsa
(with covariances between:
Q70-Q82; M30-M31;
AcadValidInst-InstAgents)
2516.26 381 6.60 .91 .06 .05 (90% CI = .050, .059)
Respecified Model 1: 27 Items
(Deleted: AcadValidInst,
InstAgents, Q126)
1257.70 301 4.18 .95 .04 .04 (90% CI = .037, .041)
Respecified Model 2: 24 Items
(Deleted: M49, M61, Q70)
Best-Fit Model
804.56 230 3.50 .97 .04 .04 (90% CI = .032, .037)
aOriginal items in CFA hypothesized model: Institutional Commitment to Students Factor (M59—Counselors at the college generally show their concern for students' well-being; M17—My counselor is generally receptive to what I have to say; M39—If I had a personal problem, I believe that counselors would be willing to discuss it with me; M07—It is comforting to know that my contributions are valued by my instructors; M38—My instructors sometimes ignore my comments or questions; and Q176—I received all the assistance I needed to successfully transition and adjust to the college); Interactions with Diverse Peers Factor (The quality of my interactions and relationships with students of another race/ethnicity can best be characterized as: friendly/unfriendly (Q70), close/distant (Q74), supportive/ unsupportive (Q78), and available/unavailable (Q82)). Perceptions of a Hostile Campus Climate Factor (M18—I sometimes feel alone and isolated at the college because of my gender (reverse coded); M55—I sometimes feel alone and isolated because of my race/ethnicity (reverse coded); M36neg—I sometimes feel alone and isolated because of my sexual orientation (reverse coded); M63—I sometimes feel alone and isolated because of my age (reverse coded)). Sense of Belonging Factor (M31—Sometimes I feel alone at the college; M30—Sometimes I feel that no one at the college notices me; M56—I often feel socially inadequate at school; M08—Sometimes I feel that I am not interesting to anyone at the college; M32—Sometimes I get so wrapped up in my personal problems that I isolate myself from others at the college; M34—I often feel isolated when involved in student activities; M49—I often feel that I do not belong at this college). Mattering Factor (M48—There are people on campus who are sad for me when I fail in something I set out to do; M52—Some people on campus are disappointed in me when I do not accomplish all I should; M53—People on campus are generally supportive of my individual needs; M40—People on campus seem happy about my accomplishments; M62—I

155
sometimes feel pressured to do better because people at the college would be disappointed if I did not; M61—There are people at the college who are concerned about my future; M54—There are people at the college who are genuinely interested in me as a person; M26—Other students are happy for me when I do well in exams or projects). Socio-Academic Integrative Experiences Factor (AcadValidInst—academic validation from instructors; InsAvail—quality of student interactions and relationships with instructors as available/unavailable; InsSup—quality of student interactions and relationships with instructors as supportive/unsupportive; Q116—times meeting with instructors outside of class, Q115—times meeting with a counselor; Q128—hours spent per week studying; Q182—I have experienced significant academic difficulties while attending college; and Q173_9—Scholars Program (honors program) participant). Engagement/Involvement Factor (Q129—hours spent on campus activities; Q173_1—currently holding leadership role in the Associated Students organization or a club officer; Q134—hours per week spent volunteering; Q128—hours per week spent studying; and Q173_9—Scholars Program[honors] participation).

156
Research Question 1.1: Invariance Analysis of Measurement Model for Race/Ethnicity
Research Question 1.1 was concerned with the assessment of multiple group invariance
of the respecified measurement model (Respecified Model 2) for race/ethnicity. Of particular
import to this study was the invariance analysis for White, Latino, Asian, Black and American
Indian/Alaskan Native students. However, the sample size for Black (N = 104) and American
Indian/Alaskan Native (N = 12) students were relatively small to carry out confirmatory factor
analyses of the groups to assess the adequacy of fit of the measurement model. Typically SEM
requires a minimum 200 cases—more in cases of complex models and when multivariate non-
normality may be of concern (Byrne, 2010; Kline, 2005).
The goal of this analysis was to determine (1) if the measurement model was invariant
across groups, or (2) in the absence of invariance, to determine how the groups’ configural and
structural models might differ. As discussed by Byrne (2010), invariance analyses encompass
the comparison of a baseline model with no constraints, against increasingly restrictive models to
determine if they are significantly different (not invariant). The initial step establishes a baseline
model against which other models will be compared—the configural model. Next, factorial
measurement and structure of the model across groups is examined. Byrne further notes that the
baseline and the more restrictive models may be compared by examining the difference in χ2
(Δχ2), degrees of freedom, and the resulting p value. A statistically significant difference would
indicate non-invariance in the model. However, the χ2 approach to invariance testing has been
judged as “too restrictive,” particularly since SEM studies only emulate “real life.”
Methodologists have proposed that a change in the CFI value (ΔCFI) be examined instead of the
Δχ2. A difference > .01 in the CFI value has been proposed as the cutoff by which to judge the
presence of non-invariance (Byrne, 2010; Cheung & Rensvold, 2002).

157
Table 17
Goodness of Fit Measures for the Measurement Model (Respecified Measurement Model 2) by
Race/Ethnicity
Goodness-of-Fit Measures
Model χ2 df χ2 / df CFI SRMR RMSEA (90% CI)
Optimal Values - - ≤ 4.0 ≥ .95 ≤ .10 ≤ .06
Respecified Model 2: 24 Items
(Deleted: M49, M61, Q70)
Best-Fit Model
804.56 230 3.50 .97 .04 .04 (90% CI = .032, .037)
Race/Ethnicity Models:
White (N = 737)
Latino/a (N = 460)
Asian (N = 435)
Black (N = 104)
Other (N = 352)
392.39
326.43
402.28
316.77
388.14
230
230
230
230
230
1.71
1.42
1.67
1.38
1.93
.97
.97
.95
.90
.95
.04
.04
.05
.07
.06
.03 (90% CI = .026, .036)
.03 (90% CI = .024, .036)
.04 (90% CI = .035, .048)
.06 (90% CI = .043, .076)
.04 (90% CI = .037, .052)
Consistent with SEM practices, and before the multiple group invariance analysis for
race/ethnicity was carried out, the goodness of fit for Respecified Model 2 with 24 indicators
distributed across seven factors was examined for each group. As noted in Table 17, Respecified
Model 2 fit the data exceptionally well for White [χ2(230, N = 737) = 392.39, CFI = .97, SRMR
= .04, RMSEA = .03 (90% CI = .026, .036)]; Latino/a [χ2(230, N = 460) = 326.43, CFI = .97,
SRMR = .04, RMSEA = .03 (90% CI = .024, .036)]; and Asian students [χ2(230, N = 435) =
402.28, CFI = .95, SRMR = .05, RMSEA = .05 (90% CI = .035, .048)]. While not specifically,
of interest to this study, the model was also of good fit for students of Other races/ethnicities

158
[χ2(230, N = 352) = 388.14, CFI = .95, SRMR = .06, RMSEA = .04 (90% CI = .037, .052)]. As
expected, the model was of poor fit for Black students [χ2(230, N = 104) = 316.77, CFI = .90,
SRMR = .07, RMSEA = .06 (90% CI = .043, .076)]. Given these findings, the multiple group
invariance analyses followed.
Configural, Measurement, and Structural Invariance
For this particular study, the baseline model was specified for all groups at once with no
constraints imposed. The resulting measures of fit were χ2(690, N = 1632) = 1121.20, CFI =
.967, SRMR = .04 RMSEA = .02 (90% CI = .017, .022). Based on this information, the
hypothesized multigroup model (Respecified Model 2 with 7 factors and 24 indicators) was
characterized as exceptionally well fitting across groups.
The next step in the analysis entailed an evaluation of measurement invariance (factor
loadings) of the model across groups. The resulting fit statistics once again reinforced the
findings from the baseline model suggesting that factor loadings behaved similarly across
groups, χ2(724, N = 1632) = 1203.42, Δχ2 =88.22, Δdf = 34, CFI = .963, SRMR = .05, RMSEA =
.02 (90% CI = .018, .028). While the more stringent χ2 difference test argued for a model that
was non-invariant, the negligible change of .004 in the CFI value pointed to a model that was
indeed invariant across groups (Table 18). Based on the ΔCFI criterion (ΔCFI = .004) it was
concluded the loadings were similar across groups.
In the next step of the analysis, the structural invariance of the model across groups was
tested. Goodness-of-fit statistics showed evidence of a generally well-fitting model with respect
to factor covariances across groups, χ2(780, N = 1632) = 1333.13, Δχ2 =211.94, Δdf = 90, CFI =
.958, SRMR = .07, RMSEA = .02 (90% CI = .019, .023). The ΔCFI was .009, suggesting
invariant covariance structures.

159
Table 18
Goodness-of-Fit Statistics for Tests of Multigroup (All Races) Invariance: Respecified Model 2
Model Description Comparative
Model
χ2 df Δχ2 Δdf Sig. CFI ΔCFI
1. Configural model; no
constraints imposed
- 1121.20 690 - - - .967 -
2. Measurement Model
(Model A). All factor
loadings constrained
equal.
2A v. 1 1203.42 724 34 82.22 < .001 .963 .004
3. Structural Model
(Model 2A with
covariances among
all factors constrained
equal).
3 v. 1 1333.13 780 90 211.94 < .001 .958 .009
Latent Means Analysis for Measurement Model
A latent means structure analysis was conducted to determine if the scores on the latent
constructs of the measurement model (Respecified Model 2) significantly differed by
race/ethnicity. White students were coded as the reference group for two of the analyses.
Latino/as were also coded as the reference group for one analysis. Table 19 presents a summary
of the findings. Notably, there were statistically significant differences in some of the factor
means by race/ethnicity.
In comparison to White students, Latino/a students had higher latent means on the
Institutional Commitment to Students and Interactions with Diverse Peers factors (p < .01).
Asian students, also in comparison to White students had statistically significant higher means on
160
three factors—Hostile Campus Climate, Socio-academic Integrative Experiences,
Engagement/Involvement—and lower means on Mattering and Sense of Belonging. Assessing
differences between Latino/a (the reference group) and Asian students, Asians had higher means
on Institutional Commitment to Students, Perceptions of a Hostile Campus Climate, and
Engagement/Involvement; and lower means on Interactions with Diverse Peers, Socio-academic
Integrative Experiences, and Sense of Belonging (p < .01).
Generally speaking, it was not unexpected that the latent means by race/ethnic groups
would be different. While it is certainly possible that the meaning of the items in the
questionnaire that students completed at the time of data collection might be interpreted
differently, and that cultural factors might be at play (to a degree in their interpretation), it is
plausible that the means reflect the actual experiences of students at the college.

161
Table 19
Latent Means Differences by Race/Ethnicity for Measurement Model (Respecified Model 2)
White Students as
Reference Group
Latino/a Students
as Reference Group
Factor Latino/a Asian Asian
Institutional Commitment to Students 0.227*** -0.085 -0.319***
Interactions with Diverse Peers 0.15** -0.009 -0.162**
Perceptions of a Hostile Campus Climate 0.034 0.312*** 0.26***
Socio-academic Integrative Experiences -0.001 0.17*** -0.174**
Engagement/Involvement -0.024 0.182*** 0.167***
Perceptions of Mattering -0.099 -0.103* -0.008
Sense of Belonging 0.058 -0.209** -0.28***
*** p < .001; ** p < .01; * p < .05
Research Question 1.1 Conclusion
In considering the invariance analysis findings above (summarized on Table 19), it
appears that Respecified Measurement Model 2 is invariant across race/ethnic groups with
respect to the configural, measurement, and structural models. In moving forward with the
assessment of the full structural model implied in Figure 1 (the conceptual model), it appears that
the hypothesized model was correctly conceptualized. Results also suggest the latent means for
the seven factors in the measurement model do differ to some extent by race.

162
Research Question 2: The Structural Model
The focus of Research Question 2 was to assess the goodness-of-fit for a hypothesized
structural model regressing intent to persist on student background characteristics, institutional
commitment to students, interactions with diverse peers, perceptions of a hostile campus climate,
sense of belonging, mattering, engagement/involvement, socio-academic integrative experiences,
and goal commitment (Figure 1). In the absence of a well-fitting model, the research question
called for the respecification of the hypothesized model to produce a better-fitting model.
This research question follows a call by researchers to continue to test extant college
student development and success theories and conceptual frameworks that dominate the higher
education literature, and in particular, “to tease out the nuances of these concepts [i.e.,
involvement, engagement, integration, sense of belonging] in research related to student
development and success” (Wolf-Wendel et al., 2009, p. 426).
Given that most theoretical models have been developed and empirically tested with four-
year, White students, the present study offers advantages over existing frameworks in that it
incorporates some of the “classic” student persistence and success theoretical tenets, while also
expanding upon these with a community college population. The hypothesized structural model
also integrates some of the newer concepts in the literature, such as sense of belonging (which
has been researched primarily with minority, four-year student populations), and
mattering/validation (which has also investigated racially\ethnically diverse college student
populations at four-year and two-year institutions). This study employees a large dataset
corresponding to a multiply diverse community college student sample. Details of the analysis
of the structural model follow.

163
Assessment of the Structural Model for Intent to Persist
Model Specification. The hypothesized structural model for this study was specified in
AMOS 21. It was based on the Conceptual Model illustrated in Figure 1. The model
encompassed seven factors (institutional commitment to students, interactions with diverse peers,
perceptions of a hostile campus climate, sense of belonging, mattering, engagement/involvement,
and socio-academic integrative experiences) with a total of 24 indicators distributed among the
factors, five single variables serving as controls, and the outcome variable—intent to persist.
The measurement aspect of the model was based on Respecified Model 2 (Figure 4). A
graphical depiction of the hypothesized structural model as implemented in AMOS is shown in
Figure 6, which hypothesized 36 regression paths (illustrated, along with residual error and
covariances in the model). The key research questions guiding the analysis were: Does the
hypothesized structural model adequately fit the observed data? If not, what respecified model
results in improved model fit?
As with all previous analyses, maximum likelihood estimation with 2,000 bootstrap
samples was used owning to the presence of multivariate non-normality. The bootstrap
procedure produced the Bollen-Stine corrected χ2 p-value to help assess model fit. The Bollen-
Stine p-value was used, in lieu of the traditional ML χ2 p-value, which is sensitive in the presence
of multivariate non-normality and large sample sizes. Several indices of fit were also used to
assess the overall goodness of fit for the model, including the χ2/df ratio, CFI, SRMR, and
RMSEA.
Model Identification. The goal of this step was to derive a model that was over
identified to enable hypothesis testing. The number of parameters in the model to be estimated
were 105, with 33 observed variables. Thus, the resulting degrees of freedom consisted of 456.

164
With respect to sample size and power, the ratio of cases to the number of parameters to be
estimated was 20:1—twice the number recommended for SEM (Kline, 2005). As with the CFAs
above, the first congeneric variable for each factor was set to a 1.0 loading and a zero loading on
all other factors. Unlike the CFA, residual error terms were included in all endogenous
variables.
Evaluation of Model Fit. Results of the SEM analysis for the hypothesized structural
model showed it was of poor fit to the data and should be rejected, bootstrap Bollen-Stine
χ2(456, N = 2,088) = 2794.59, p < .001, χ2/df = 6.13, CFI = .88, SRMR = .10, RMSEA = .05
Figure 6. Hypothesized structural model for intent to persist.

165
(90% CI = .048, .051). The only index of fit falling within the required thresholds was the
RMSEA.
A review of the regression weights associated with paths among factors and control
variables in the model revealed a few non-significant (p < .05) paths in the model, including:
perceptions of a hostile campus climate to mattering; institutional commitment to students to
engagement/involvement; engagement/involvement to sense of belonging; and
engagement/involvement to socio-academic integrative experiences. Moreover, the following
regression paths were also not significant: financial concerns to engagement/involvement;
financial concerns to goal commitment; financial concerns to intent to persist; length of college
attendance to sense of belonging; unit load to socio-academic integrative experiences; unit load
to interactions with diverse peers; institutional commitment to students to goal commitment; and
socio-academic integrative experiences to goal commitment.
The modification indices (MI) and the expected parameter (EPC) statistics also pointed to
several sources of misfit. Based on the MI and EPC values, it appeared that adding several
regression paths to model might result in improved fit. For example, the variable college
transition support from family/friends shared large MIs/EPCs with several other variables: intent
to persist (MI of 227.11; EPC = .456), perceptions of a hostile campus climate (MI = 74.71; EPC
= -.16); institutional commitment to students (MI = 39.82, EPC = .20); and interactions with
diverse peers (MI = 48.15, EPC = .13). Together, these MIs point out that families and friends
play a significant role in the college student experience, particularly as students are faced with a
college environment and experiences that challenge them academically, socially, and
emotionally.

166
Consistent with theory and literature, several large MI/EPC statistics also supported the
addition of paths for interactions with diverse peers and other variables: institutional
commitment to students (MI = 195.30; EPC = .77) and socio-academic integrative experiences
(MI = 130.57; EPC = .28). Another large MI encompassed institutional commitment to students
to interactions with diverse peers (MI = 194.61; EPC = .22)—a reversed path from interactions
with diverse peers to institutional commitment to students shown above. These MIs also suggest
that diverse peer interactions may exercise a role in student’s view of the institution and
ultimately on their intent to persist.
Other MIs of interest were engagement/involvement to goal commitment (MI = 161.43;
EPC = .62); GPA to goal commitment (MI = 58.74, EPC = .17); and gender to sense of
belonging (MI = 23.40, EPC = -.22). The addition of these paths were also theoretically
consistent.
With respect to cross-loading items, two large MIs/EPCs suggested that item Q70 (the
characterization of student interactions with diverse peers as friendly/unfriendly—part of the
interactions with diverse peers factor), and item M34 (I often feel isolated when involved in
student activities—part of the sense of belonging factor), might also be tapping into aspects of
the hostile campus climate factor (MI = 59.17, EPC = -.25; MI = 23.02, EPC = -.21,
respectively). However, given the interest in preserving a simple structure to the degree
possible, the deletion of these two items from further consideration in lieu of retaining them as
cross-loading items was supported.
Lastly, the evaluation of error covariances among all variables revealed two covariances
of interest given their large MI/EPC values: unit load with goal commitment (MI = 97.50, EPC =
.95) and unit load with item Q128 (hours spent studying per week; MI = 19.67, EPC = .55). It is

167
certainly reasonable to conclude that as students set and commit to the pursuit of an educational
goal, that they are likely to decide just how many units per semester they need to take in order to
achieve said goal in the timeframe they specified. Similarly, the more units a student takes, the
greater the time they are expected to, and more likely devote preparing for class, doing
homework, researching, etc. Thus, the addition of these error covariances to a respecified model
were favored.
Note should be taken that while two of the MIs above correspond to the same set of
factors (interactions with diverse peers to institutional commitment to students and institutional
commitment to students to interactions with diverse peers), the directionality implied by the MIs
is different. Adding a path from interactions with diverse peers to institutional commitment to
students would result in approximately a .77 path loading, whereas adding a path from
institutional commitment to students to interactions with diverse peers would result in a smaller
regression loading of approximately to .22. Given that the model is not strictly developmental in
nature, it is certainly theoretically consistent to expect that positive interactions with students
may exercise a positive effect on students’ views of the institution and the commitment of these
toward students; particularly, when colleges and universities make a concerted effort to establish
programs and services that cater to the needs of, and promote interactions among diverse
students (e.g., multicultural centers, affinity-based programs—Latino Center, African American
Center—international student clubs, diversity workshops). Moreover, adding a regression path
from interactions with diverse peers to institutional commitment to students is consistent with the
Conceptual Model’s second Proposition (p. 66):
To the degree that students perceive a high level of institutional commitment, and have
positive relationships with racially/ethnically diverse peers characterized as close,

168
friendly, supportive, and available, their sense of belonging to the institution will be
enhanced. Having hostile experiences with others at the institution owning to personal
characteristics (i.e., gender, race/ethnicity, sexual orientation, age) that result in feelings
of alienation will deleteriously affect sense of belonging. A positive sense of belonging
has the potential to influence student intentions to persist.
Based on the evidence presented above, the structural model was judged of poor fit and
rejected. Consistent with the research question, respecification of the model was pursued with
the intent of deriving a model of best fit. This step was undertaken with the understanding that
the evaluation of model fit was post hoc and exploratory. While statistical significance was
desired, it was not the sole guiding factor in the respecification process. The addition of paths in
the model needed to be consistent with theory (as elaborated above). Additionally, a
parsimonious model was championed. Table 20 presents goodness-of-fit statistics for alternate
models of the structural model for intent to persist.

169
Table 20
Summary of Goodness-of-Fit Indices for Alternate Models of the Structural Model for Intent to
Persist
Goodness-of-Fit Measures
Model χ2 df χ2 / df CFI SRMR RMSEA (90% CI)
Optimal Values - - ≤ 4.0 ≥ .95 ≤ .10 ≤ .06
Hypothesized Model: 7 factors 2794.59 456 6.13 .88 .10 .05 (90% CI = .048, .051)
Respecified Structural Model 1:
(Deleted: 12 regression paths and
2 cross-loading items. Added: 10
regression paths; 2 error
covariances).
1393.89 395 3.53 .94 .06 .04 (90% CI = .033, .037)
Respecified Structural Model 2:
(Deleted: 2 regression paths.
Added: 3 regression paths).
1344.38 394 3.41 .95 .06 .03 (90% CI = .032, .036)
Δχ2 in Respecified Models = 49.51
Δdf = 1
p < .001

170
Respecification of Structural Model—Respecified Structural Model 1. Using
findings from the evaluation of the hypothesized model, Respecified Structural Model 1
incorporated the deletion of 12 regression paths found not to be statistically significant in the
evaluation of the hypothesized model. Two cross-loading items, M34 (I often feel isolated when
involved in student activities) and Q70 (diverse peer interactions as friendly/unfriendly) were
also omitted. Ten regression paths and two error covariances were added to the model. These
revisions were based on the examination of MI and EPC parameters derived from covariance and
regression paths in the hypothesized model. All changes are consistent with theory and the
Conceptual Model Propositions.
The deleted paths included: perceptions of a hostile campus climate to mattering;
institutional commitment to students to engagement/involvement; engagement/involvement to
sense of belonging; engagement/involvement to socio-academic integrative experiences;
financial concerns to engagement/involvement; financial concerns to goal commitment; financial
concerns to intent to persist; length of college attendance to sense of belonging; unit load to
socio-academic integrative experiences; unit load to interactions with diverse peers; institutional
commitment to students to goal commitment; and socio-academic integrative experiences to goal
commitment. The deletion of the three regression paths pertaining to financial concerns resulted
in no paths remaining for this variable in the model. Rather than eliminating the variable from
the model at this juncture, a new path from financial concerns to GPA was added based on a MI
of 15.33 (EPC = -.07) found in the hypothesized structural model.
The other added paths were: from college transition support from family/friends to intent
to persist, to perceptions of a hostile campus climate, to institutional commitment to students,
and to interactions with diverse peers; interactions with diverse peers to institutional commitment

171
to students; interactions with diverse peers to socio-academic integrative experiences;
engagement/involvement to goal commitment; GPA to goal commitment; and gender to sense of
belonging; and financial concerns to GPA. Lastly, two error covariances were also specified
between unit load and goal commitment and between unit load and Q128 (hours per week spent
studying).
Respecified Structural Model 1—Model Identification. As with the hypothesized
model, the respecified exploratory structural model on intent to persist was over identified. The
number of parameters in the model to be estimated were 101, with 31 observed variables. Thus,
the resulting degrees if freedom were 395. With respect to sample size and power, the ratio of
cases to the number of parameters to be estimated was 20:1—twice the number recommended
for SEM (Kline, 2005). As with the hypothesized structural model above, the first congeneric
variable for each factor was set to a 1.0 loading and a zero loading on all other factors. No cross-
loading items were permitted. Residual error terms were included in all endogenous variables,
and two error covariances were added between unit load and goal commitment and between unit
load and Q128 (hours per week spent studying).
Evaluation of Model Fit—Respecified Structural Model 1. The resulting respecified
model showed evidence of improved fit, in comparison to the hypothesized model, bootstrap
Bollen-Stine χ2(395, N = 2,088) = 1393.89, p < .001, χ2/df = 3.53, CFI = .944 SRMR = .06,
RMSEA = .04 (90% CI = .033, .037). As can be observed in Table 20, the χ2 value, while still
significant, dropped by nearly 50% and the CFI nearly reached the cutoff of .95. The χ2/df ratio,
the SRMR, and the RMSEA also showed evidence of a good model with all values reaching the
desired levels.

172
The regression weights associated with paths among factors and control variables in the
model were nearly all statistically significant (most at p < .001). However, a few paths ceased
being significant: college transition support from family/friends to mattering (p = .16); sense of
belonging to GPA (p = .06); sense of belonging to intent to persist (p = .09); and institutional
commitment to students to intent to persist (p = .13). The regression modification indices
suggested three additional paths should be incorporated into the model: gender to interactions
with diverse peers (MI = 15.44, EPC = .16); length of college attendance to
engagement/involvement (MI = 28.16, EPC = .06); and perceptions of a hostile campus climate
to goal commitment (MI = 8.44, EPC = -.14). While the output suggested that adding some error
covariances to the model, these would not likely result in a vastly improved model, but would no
doubt result in a much more complex model. Hence, error variances were not considered.
In considering the next steps to improve model fit, there was an interest in maintaining a
model with a simple structure—if feasible—while also anticipating how the model might
generalize to different student populations (i.e., racial/ethnic minorities). The addition of the
three paths suggested above by the MIs/EPCs would also help explain the experiences of college
students with respect to their intent to persist in a more nuanced manner. The decision to delete
two paths from college transition support from family/friends to mattering and institutional
commitment to students to intent to persist was favored primarily because of the large p-value
(.16 in both cases), and a belief that the path was not likely to differ significantly from one
racial/ethnic group to another once an invariance analysis was conducted. However, the deletion
of the two other paths from sense of belonging to GPA and sense of belonging to intent to persist
was rejected on theoretical grounds. Specifically, a growing body of literature on sense of
belonging suggests that college students of different racial/ethnic backgrounds do experience

173
college climates differently and are impacted by these differently (Freeman et al., 2007;
Hausmann et al., 2007; Hoffman et al., 2002; Hurtado & Carter, 1997; Locks et al., 2008; Nuñez,
2009; Saenz, Ngai, & Hurtado, 2007; Strayhorn, 2008; Tovar & Simon, 2010). Given the p-
values of < .10 for both of these paths, it was anticipated these regression paths would achieve
statistical significance for some student groups.
Given the findings above, respecification of the model was sought a second time.
Respecified Structural Model 2—Model Identification. The second respecification of
the structural model implemented the addition of three regression paths: gender to interactions
with diverse peers; length of college attendance to engagement/involvement; and perceptions of
a hostile campus climate to goal commitment. Two regression paths were also deleted: college
transition support from family/friends to mattering and institutional commitment to students to
intent to persist. After executing these changes, the respecified model on intent to persist was
over identified. The number of parameters in the model to be estimated were 102, with 31
observed variables. Thus, the resulting degrees if freedom were 394. The ratio of cases to the
number of parameters to be estimated was 20:1. As with the previous models, the first
congeneric variable for each factor was set to a 1.0 loading and a zero loading on all other
factors. No cross-loading items were permitted. Residual error terms were included in all
endogenous variables, and three error covariances remained between M30 (Sometimes I feel that
no one at the college notices me) and M32 (Sometimes I get so wrapped up in my personal
problems that I isolate myself from others at the college); unit load and goal commitment; and
unit load and Q128 (hours spent per week studying).
Evaluation of Model Fit—Respecified Structural Model 2. The resulting nested
respecified model showed evidence of increased fit, in comparison to the previous model, Δχ2(1)

174
= 49.51, p < .001. The resulting fit indices for the model were: bootstrap Bollen-Stine χ2(394, N
= 2,088) = 1344.38, p < .001, χ2/df = 3.41, CFI = .95, SRMR = .06, RMSEA = .03 (90% CI =
.032, .036). As can be observed in Table 20, the χ2 value while still significant, dropped by an
additional 50 units, the χ2/df ratio, SRMR, CFI, and RMSEA all showed evidence of a good
fitting model. Figures 7 and 8 present standardized and unstandardized estimates for the path
loadings in the model, respectively. All parameters were significant at p < .001, except for the
path loadings from gender to mattering (p < .05); institutional commitment to students to
perceptions of a hostile campus climate (p < .01); sense of belonging to GPA (p < .05); GPA to
goal commitment (p < .01); perceptions of a hostile campus climate to goal commitment (p <
.01); sense of belonging to intent to persist (p = .06); GPA to intent to persist (p < .01); socio-
academic integrative experiences to intent to persist (p < .01). Tables A-2 through A-6 (in
Appendix A) provide the full complement of parameter estimates in standardized and
unstandardized form, including the squared multiple correlations.
Research Question 2 Conclusion—The Structural Model of Best Fit
Respecified Structural Model 2 is presented as the model of best fit to the data.
Comparing the hypothesized model to the accepted best-fitting model, the following conclusions
are drawn:
1) 14 of the original 36 hypothesized causal paths in the model were removed
owning to non-significant regression weights. The most significant path deletions
from a theoretical standpoint were: engagement/involvement to socio-academic
integrative experiences, institutional commitment to students to goal commitment,
and socio-academic integrative experiences to goal commitment . The
significance of these deletions will be explored in Chapter 5.

175
2) Two items, M34 (I often feel isolated when involved in student activities) and Q70
(interactions with diverse peers as friendly/unfriendly) were deleted from the
model given they cross-loaded on two factors each.
3) 13 regression paths not specified a priori were added to the model, all
theoretically justified and proven to better account for the inter-relationships
among latent variables with the outcome variable—intent to persist.
4) Two error covariances were added between two single-indicator items (unit load
and goal commitment; and unit load and Q128—hours spent per week studying).
The original error covariance for M30 (Sometimes I feel that no one at the college
notices me) and M32 (Sometimes I get so wrapped up in my personal problems
that I isolate myself from others at the college) remained in the model.

176
Figure 7. Standardized coefficients for Respecified Structural Model 2 on intent to persist:
Model of best fit.

177
Figure 8. Unstandardized coefficients for Respecified Structural Model 2 on intent to persist:
Model of best fit.

178
Research Question 2.1: Invariance Analysis of the Structural Model for Race/Ethnicity
Research Question 2.1 was concerned with the assessment of multiple group invariance
of the respecified structural model (Respecified Structural Model 2) for race/ethnicity,
particularly as it applied to structural regression (causal) paths. The causal structure implies that
student background characteristics, institutional commitment, interactions with diverse peers,
perceptions of a hostile campus climate, sense of belonging, mattering, engagement/
involvement, socio-academic integrative experiences, and goal commitment exert an effect on
community college students’ intent to persist.
The cornerstone of the analysis focused on the equivalence of the model across
racial/ethnic groups. To the degree that the causal model was not invariant, it was deemed a
central question in the study. Hence, the goal was not to explicitly derive a model that was
completely race/ethnicity invariant. It was believed that any differences in regression causal
paths would be indicative of the unique set of experiences associated with any given racial/ethnic
group. Of particular import to this study was the invariance analysis for White (the reference
group), Latino, Asian, Black and American Indian/Alaskan Native students. However, the
sample sizes for Black (N = 104) and American Indian/Alaskan Native (N = 12) students were
exceptionally small for a causal model as complex as the one in question, as specified in Figure
7. While the students of “other” race/ethnicities participated in the study, they do not form part
of the invariance analysis since their racial/ethnic background is unknown.
As discussed by Byrne (2010), invariance analyses encompass the comparison of a
baseline model with no constraints, against increasingly restrictive models to determine if they
are significantly different (not invariant). The initial step establishes a baseline model against
which other models are compared—the configural model. Next, factorial measurement and the

179
structure of the model across groups is examined. Byrne further notes that the baseline and the
more restrictive models may be compared by examining the differences in χ2 (Δχ2), degrees of
freedom, and the resulting p value. A statistically significant difference indicates non-invariance
in the model. However, the χ2 approach to invariance testing has been judged “too restrictive.”
Instead, it is recommended that changes in the CFI value (ΔCFI) be examined. A difference >
.01 in the CFI value has been proposed as the cutoff by which to judge the presence of non-
invariance (Byrne, 2010; Cheung & Rensvold, 2002).
Configural, Measurement, and Structural Invariance
Model Fitness by Race/Ethnicity. As recommended by Byrne (2010), fitness of the
proposed causal model should be tested for each group separately before establishing a baseline
model with no constraints. As seen in Table 21, Respecified Structural Model 2—the model of
best fit—adequately fit the data for all student groups, except for Black students as expected.
Indices of fit indicated the model had exceptional fit for White [χ2(394, N = 737) = 699.88, CFI =
.95, SRMR = .07, RMSEA = .03 (90% CI = .029, .036)] and Latino/a students [χ2(394, N = 460)
= 557.31, CFI = .96, SRMR = .07, RMSEA = .03 (90% CI = .024, .036)]. The model showed
evidence of misfit for Asian [χ2(394, N = 737) = 660.44, CFI = .93, SRMR = .09, RMSEA = .04
(90% CI = .034, .045)] and Other [χ2(394, N = 352) = 602.36, CFI = .93, SRMR = .08, RMSEA
= .04 (90% CI = .033, .045)]. The CFI vale for Asian and Other students fell just below the
desired level of .95. With respect to Black students, the model clearly showed a lack of fit
[χ2(394, N = 104) = 575.22, CFI = .82, SRMR = .17, RMSEA = .07 (90% CI = .055, .078)].
However, as stated previously, the sample size was considerably small (N = 104) and a much
larger sample size was required to assess the adequacy of fit. Given the small sample size, no

180
further analyses pertaining to the equivalency of the structural model were conducted for Black
students.
In reviewing some of the potential sources of misfit in the model corresponding to each
racial/ethnic group, the following observations were noted:
White students. Twelve non-significant regression causal paths were found: college
transition support from family/friends to institutional commitment to students, gender to
mattering, gender to sense of belonging, institutional commitment to students to perceptions of a
hostile campus climate, institutional commitment to students to sense of belonging, sense of
belonging to GPA, sense of belonging to intent to persist, perceptions of a hostile campus
climate to goal commitment, financial concerns to GPA, GPA to goal commitment, socio-
academic integrative experiences to intent to persist, and goal commitment to intent to persist.
Additionally, modification indices and the expected parameter change statistic suggested that
adding a path from gender to GPA might improve the model slightly.
Latino/a students. Twelve non-significant regression causal paths were found:
engagement/involvement to intent to persist, gender to interactions with diverse peers, gender to
mattering, gender to sense of belonging, GPA to goal commitment, GPA to intent to persist,
institutional commitment to students to sense of belonging, socio-academic integrative
experiences to intent to persist, interactions with diverse peers to perceptions of a hostile campus
climate, length of attendance to intent to persist, sense of belonging to GPA, and sense of
belonging to intent to persist. Additionally, MI and EPC statistics suggested that adding a path
from financial concerns to sense of belonging might improve the model slightly.
Asian students. Seven non-significant regression causal paths were found:
engagement/involvement to intent to persist; financial concerns to GPA, length of attendance to

181
intent to persist, mattering to socio-academic integrative experiences; sense of belonging to
GPA, sense of belonging to intent to persist, and college transition support from family/friends to
socio-academic integrative experiences. MI and EPC statistics suggested that adding a path from
unit load to GPA might improve model fit.
Summary of observed differences for all groups. Based on the above, Latino students
shared seven non-significant paths with White students (gender to mattering, gender to sense of
belonging, GPA to goal commitment, institutional commitment to students to sense of belonging,
socio-academic integrative experiences to intent to persist, sense of belonging to GPA, and sense
of belonging to intent to persist); four non-significant paths with Asian students (financial
concerns to GPA, sense of belonging to GPA, sense of belonging to intent to persist, and college
transition support from family/friends to socio-academic integrative experiences). Asian and
Latino students shared four non-significant paths (engagement/involvement to intent to persist,
length of attendance to intent to persist, sense of belonging to GPA, and sense of belonging to
intent to persist); and White students did not share three non-significant paths with either
Latino/a and Asian students (goal commitment to intent to persist, perceptions of a hostile
campus climate to goal commitment, and institutional commitment to students to perceptions of
a hostile campus climate).
In considering the above findings, it is important to point out that the removal of non-
significant paths from Respecified Model 2 for some of the racial/ethnic groups above would
result in the removal of complete factors from the model. However, given that the goodness of
fit for the model is exceptional to adequate, there seems to be little incentive to do so.
Additionally, their removal would result in a different model not consistent with the Conceptual
Model. After all, the purpose of the present study was to assess how the constructs collectively

182
interact to impact community college students’ intent to persist. Lastly, while parsimony in the
model was sought, over-fitting it was also a concern.
Following these preliminary analyses for the assessment of fit for each racial/ethnic
group, multiple group invariance analyses continued as elaborated below.
Table 21
Summary of Goodness-of-Fit Indices for the Structural Mode/ (Respecified Structural Model 2)
by Race/Ethnicity
Goodness-of-Fit Measures
Model χ2 df χ2 / df CFI SRMR RMSEA (90% CI)
Optimal Values - - < 4.0 > .95 < .10 < .06
Model of Best Fit:
Respecified Structural Model 2
1344.38 394 3.41 .95 .06 .03 (90% CI = .032, .036)
Race/Ethnicity Models:
White (N = 737)
White (N = 737)a
Latino/a (N = 460)
Asian (N = 435)
Black (N = 104)
Other (N = 352)
699.88
706.18
557.31
660.44
575.22
602.36
394
394
394
394
394
394
1.78
1.79
1.41
1.67
1.46
1.53
.95
.95
.96
.93
.82
.93
.07
.07
.07
.09
.17
.08
.03 (90% CI = .029, .036)
.03 (90% CI = .029, .037)
.03 (90% CI = .024, .036)
.04 (90% CI = .034, .045)
.07 (90% CI = .055, .078)
.04 (90% CI = .033, .045)
aAfter the removal of a non-significant error covariance found for items M30-M32 in the invariance analysis for the measurement model in Research question 2.1.

183
The Baseline Model. The baseline model with no constraints imposed in Respecified
Model 2 resulted in χ2(1182, N = 1632) = 1917.78, CFI = .948, SRMR = .08, RMSEA = .02
(90% CI = .018, .021). Based on this information, the baseline multigroup model (Respecified
Structural Model 2) was characterized as well-fitting across groups. Consistent with invariance
procedures, this baseline model was used to compare differences in the next set of models.
Measurement Invariance for Causal Structure. The next step in the analysis entailed
an evaluation of measurement invariance of the model across the three groups (White, Latino/a,
and Asian students). Factor loadings for the indicator variables were set equal across groups.
The resulting fit statistics were χ2(1228, N = 1632) = 2028.22, CFI = .943, SRMR = .08, RMSEA
= .02 (90% CI = .018, .022). While the more stringent χ2 difference test argued that factor
loadings differed across groups, the negligible change of .005 in the CFI value pointed to a
model that was indeed invariant across groups. As may be observed in Figures 9, 10, and 11, the
standardized regression loadings for White, Latino/a, and Asian students did not differ
significantly overall, according to the ΔCFI criterion. However, comparing individual paths, the
magnitude of the loadings appear to differ somewhat in some instances. For example, the
magnitude of the path loadings from college transition support from family/friends for Latino/a
students to institutional commitment to students and interactions with diverse peers, were three
times as large as those for White students (albeit, they were still considered small). Notably, the
path between financial concerns to GPA was negative and significant for Latino students, but not
for White students; suggesting that financial concerns have a deleterious effect for Latino
students, but are of no consequence for White students as a group. The magnitude of the loading
between engagement/involvement and intent to persist was nearly three times as large for White
students than for Latino/as, suggesting this construct may be of greater importance for White

184
students than for Latino/as. With respect to differences between White and Asian students, the
magnitude of path loadings generally favored Asian students; although, the path from
perceptions of a hostile campus climate to goal commitment was significantly higher, but
negative for Asian students.
Structural Invariance for Causal Structure Model. A summary of the invariance
analysis conducted is presented on Table 22. In an effort to expedite the invariance analysis, the
parameters for the three groups were initially constraint equal. The configural and measurement
models, however, suggested some parameters might not be equivalent across the three groups
(Model 2A and 3A as noted on Table 22). The corresponding CFI values were .943 and .940. In
contrast, the CFI value for the unconstrained base model was .948. While the CFI values
approximated each other, the analysis was taken a step further by examining differences between
White and Latino/a students and between White and Asian students.
Goodness-of-fit statistics showed that the measurement model, the structural regression
paths model, and the structural covariances model was invariant for White and Latino students.
The resulting CFI values for each model were .953, .952, and .949, respectively. The
corresponding CFI value for the unconstrained baseline model was .954.
Moving forward to the equivalence of models between White and Asian students, the
baseline model’s CFI value was .944. By comparison, the measurement model setting all factor
loadings equal, resulted in a CFI value of .938. While the ΔCFI was .006, below the .01 cutoff
recommended (Byrne, 2010)—suggesting a good model—but out of abundance for caution, a
series of models constraining equal one factor loading at a time were run. The end result for
these models was the need to freely estimate eight loadings. The CFI value for the measurement
model with eight loadings freely estimated was .942, or a ΔCFI was .002. Examining the content

185
of these items, three “favored” White students, and five, Asian students. Those for White
students were M30 (reversed: Sometimes I feel no one at the college notices me), Q173_9
(Scholars Program participation), and InsSup (quality of interaction with instructor as available
to student). Items “favoring” Asian students included M36 (isolation and loneliness owning to
sexual orientation), M18 (isolation and loneliness owning to gender), M39 (counselors
willingness to assist with personal problem), Q173_1 (has held a leadership role in Associated
Students or campus club), and Q134 (hours spent per week volunteering). Taken together, it
would appear that some indicators in the measurement model are indeed sensitive to the campus
climate experiences for Asian students, in particular. These findings are consistent with the
univariate analyses reported at the beginning of Chapter 4.
Following the above analysis for the measurement model (with some constraints
imposed), a review of the structural regression paths was undertaken. Goodness-of-fit statistics
showed the regression paths model and the structural covariances model were invariant for
White and Asian students (summarized on Table 22). The CFI values for both models were .939
(ΔCFI was .005).
Research Question 2.1 Conclusion
The collective findings of the invariance studies conducted suggest that the configural,
measurement, and structural models for Respecified Structural Model 2 are fully invariant for
White and Latino/a students. Partial invariance (Dimitrov, 2010) was found for the measurement
model between White and Asian students, albeit their configural and structural models were
equivalent. All in all, it appears that Respecified Structural Model 2 is operating equally across
groups and thus, the direct, indirect, and total effects for the model may be examined and
compared across groups (examined in Research Question 3 below).

186
Table 22
Summary of Goodness-of-Fit Indices for Race/Ethnicity Structural Invariance Analysis
(Respecified Structural Model 2)
Model Description
Comparative
Model
Goodness-of-Fit Measures
χ2 df Δχ2 Δdf Sig. CFI ΔCFI
1. Configural baseline
model; no constraints
imposed (Model 1)
‒ 1917.78 1182 ‒ ‒ ‒ .948 ‒
2. Measurement Model (Model
2A) All factor loadings
constrained equal.
2A v. 1 2028.22 1228 110.44 46 < .001 .943 .005
3. Structural Model (Model 3A)
factor loadings constrained
equal; structural regression
paths set equal (All Groups)
3 v. 1 2126.88 1284 209.10 102 < .001 .940 .008
White – Latino/a Comparisons
WL0. White-Latinos
unconstrained
‒ 1257.24 788 ‒ ‒ < .001 .954 ‒
WL1. Measurement Model WL0 1293.25 811 36.01 23 .04 .953 .001
WL2. Structural regression path
Model
WL0 1329.85 839 72.61 51 .025 .952 .002
WL3. Structural covariances WL0 1371.17 855 113.93 67 <.001 .949 .004
White – Asian Comparisons
WA0. White-Asian
unconstrained
‒ 1360.46 788 ‒ ‒ < .001 .944 ‒
WA1. Measurement Model WA0 1441.76 811 81.33 23 <.001 .938 .006

187
Model Description
Comparative
Model
Goodness-of-Fit Measures
χ2 df Δχ2 Δdf Sig. CFI ΔCFI
All factor loadings equal
WA2. Measurement Model
with M36, M18,M39, M48,
Q173_9, Q173_1, Q134,
InsSup, M30 freely estimated.
WA0 1392.23 796 31.77 8 <.001 .942 .002
WA3. Structural Regression
Paths
WA0 1450.39 824 89.23 36 <.001 .939 .005
WA4. Structural Covariances WA0 1462.8 836 102.41 48 <.001 .939 .005

188
Figure 9. Standardized coefficients for Respecified Structural Model 2 (Model of best fit) on
intent to persist: White students (n = 737).

189
Figure 10. Standardized coefficients for Respecified Structural Model 2 (Model of best fit) on
intent to persist: Latino/a students (n = 460).
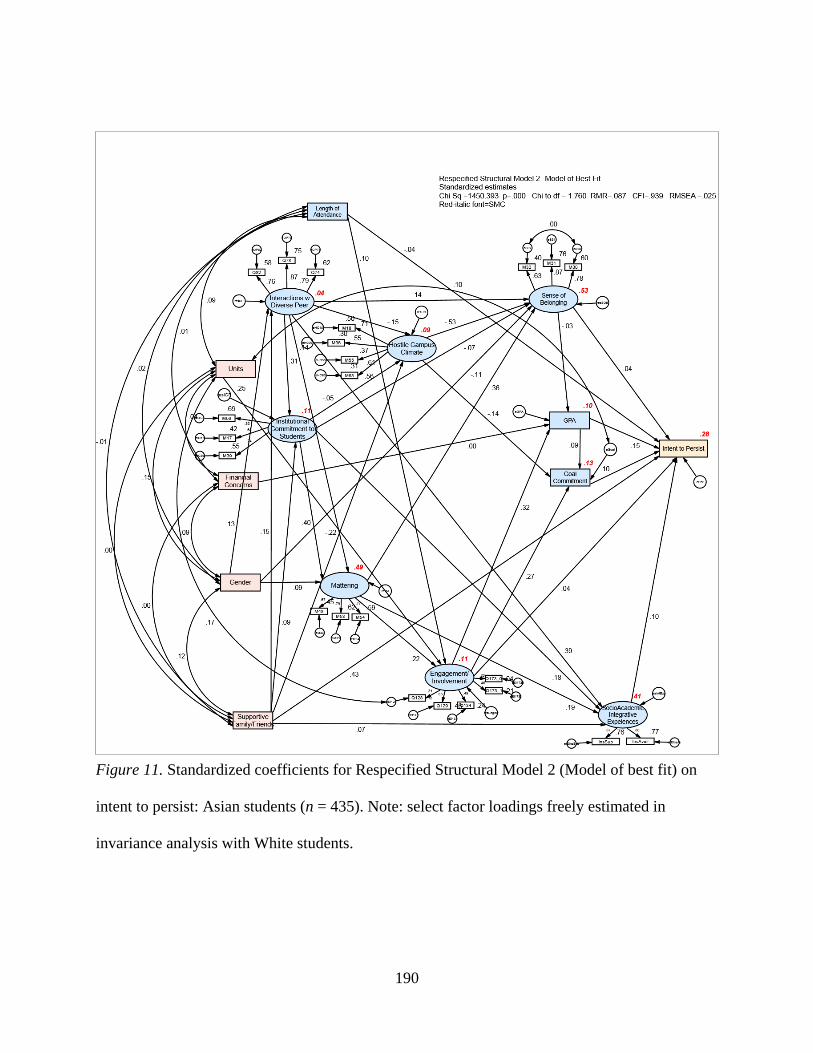
190
Figure 11. Standardized coefficients for Respecified Structural Model 2 (Model of best fit) on
intent to persist: Asian students (n = 435). Note: select factor loadings freely estimated in
invariance analysis with White students.

191
Research Question 3: The Effects of Directional Hypotheses on Intent to Persist
Direct, Indirect & Total Effects for Structural Model
Research Question 3 outlined five directional hypotheses that examined the effects of
institutional commitment to students, interactions with diverse peers, perceptions of a hostile
campus climate, mattering, sense of belonging, engagement/involvement, socio-academic
integrative experiences, and goal commitment on community college students’ intent to persist.
The hypotheses collectively proposed expected relationships among the constructs—positive or
negative (Figure 2). While the five directional hypotheses were exclusively based on the factors
above, other student background characteristics (i.e., units enrolled, transition support from
family/friends, financial concerns, gender, length of attendance, GPA) formed part of the model
tested, and their effect will be reported as well—and in context with the former.
The analysis for Research Question 3 entailed an examination of the direct, indirect, and
total effects of constructs in the structural model (Respecified Structural Model 2) on intent to
persist. Since Respecified Structural Model 2 was found to be invariant (or partially invariant)
across three racial/ethnic groups, findings could be reported based on the analysis of a single
model that includes all students in the sample. However, much would be lost in doing this since
the structural model accounts for a different proportion of the variance by race/ethnicity; and
despite the overall finding that the model was invariant, such analyses did not point to a perfectly
and completely equivalent structural model. Therefore, findings will be reported for the entire
group of students (White, Latino/a, Asian, Black, Other; referred to as ALL hereafter), as well as
for White, Latino/a, and Asian students separately. Tables 23, 24, and 25 present summaries of
the direct, indirect, and total effects of Conceptual Model components by race/ethnic group.

192
While many are the findings associated with the direct, indirect and total effects in the
model, I will initially discuss findings pertaining to the five directional hypotheses described in
Chapter 3. Following this, additional effects for each of the seven factors and three endogenous
variables (GPA, goal commitment, and intent to persist) will also be discussed—albeit this is an
ancillary presentation of findings.
Findings for Hypothesis 1
Hypothesis 1 contended that institutional commitment to students would exert a positive
and direct effect on sense of belonging, mattering, engagement/involvement, goal commitment,
and intent to persist. As noted in Figure 12, two of the five hypothesized paths from the
Conceptual Model involving Hypothesis 1were confirmed or partially confirmed (institutional
commitment to students to mattering and institutional commitment to students to sense of
belonging). The other three paths (from institutional commitment to students to
engagement/involvement, to goal commitment, and to intent to persist) did not obtain a
statistically significant loading (p < .05) and were deleted from the model. The path from
institutional commitment to students to mattering was significant and positive (as hypothesized)
for all students as a group (.43, p <.001), White (.40, p <.001), Latino/a (.57, p <.001), and Asian
students (.40, p <.001). The path from institutional commitment to students to sense of
belonging was only significant for ALL (-.10, p <.001), albeit in the opposite direction than
hypothesized.
As noted in the Research Question 2 section, Respecified Structural Model 2—the
Conceptual Model—called for the addition of several structural paths, two of which directly
impacted Hypothesis 1. The two added paths were institutional commitment to students to
perceptions of a hostile campus climate, which was significant for ALL students only (-.10, p
<.001). The second added path, institutional commitment to students to socio-academic

193
integrative experiences attained statistical significance across groups (ALL =.20, p <.001; White
= .15, p <.001; Latino/a = .24, p <.001; and Asian = .18, p <.01). Thus, Hypothesis 1 was
partially supported.
Based on these findings, it appears that institutional commitment to students has a greater
and direct impact on issues pertaining to the campus climate and to relationships with
institutional agents. Given that three paths were removed from the model, it appears that
institutional commitment to students has very little or no impact on student’s intentions or
commitments (goals and persistence), or ability to readily partake in curricular or co-curricular
activities designed to engage them at the college. Notice should be taken that a perceived lack of
commitment to students from the institution, appears to influence students’ views of a hostile
campus climate and to decreased levels of sense of belonging. Counteracting these negative
findings is the fact that institutional commitment to students exerts a high level of influence on
students’ perceptions of mattering to the college. This is true for all races/ethnicities, but it is
especially influential with Latino/a’s sense of mattering. Feelings of mattering to the institution
are developed by students when they are genuinely noticed by
instructors/counselor/administrators; when they feel supported/understood by them; or when
others praise them for their accomplishments or take notice of their failures—while still
expressing support (Dixon-Rayle & Chung, 2007; France, 2011; Rosenberg & McCullough,
1981; Schlossberg, 1989; Schlossberg et al., 1989; Tovar & Simon, 2010; Tovar et al., 2008;
Tovar et al., 2009).

194
Figure 12. Hypothesis 1: Hypothesized, deleted, and confirmed paths in model.

195
Findings for Hypothesis 2
Based on Figure 2, Hypothesis 2 pronounced that institutional commitment to students
and interactions with racially/ethnically diverse peers would positively impact their sense of
belonging to the institution. By contrast, perceptions of a hostile campus climate would
negatively influence sense of belonging. Moreover, it noted that sense of belonging would exert
a direct and positive effect on intent to persist. As illustrated on Figure 13, the paths
corresponding to the three factors in question (institutional commitment to students, interactions
with diverse peers, and perceptions of a hostile campus climate), did exercise a direct effect on
sense of belonging, albeit to a different degree. As has been previously noted, institutional
commitment to students had a small and negative effect on sense of belonging for ALL students
as a group (-.10, p < .001), but a non-significant effect on the individual racial/ethnic groups.
Interactions with diverse peers also had a small and positive effect on sense of belonging for all
groups (ALL = .14, p < .001; White = .15, p < .01, Asian = .14, p < .001), except Latino/s (.12,
n.s). Finally, the hypothesized path from perceptions of a hostile campus climate to sense of
belonging was highly significant and negative (as expected) for all student groups, and the
magnitude of the coefficients can be characterized as large (ALL = -.50, p < .001; White = -.43,
p < .01; Latino /a = -.44; Asian = -.53, p < .001). Despite these three significant paths leading to
sense of belonging, the direct path from belonging to intent to persist was not statistically
significant for any racial/ethnic group. Thus, Hypothesis 2 was partially supported.
As may also be observed on Figure 13, two additional paths also led directly to sense of
belonging: mattering to sense of belonging and gender to sense of belonging. The mattering to
belonging path, while not incorporated into Hypothesis 2, had been diagrammed into the
Conceptual Model and its effects were analyzed in the full structural model. The path
coefficients were significant, positive, and large in magnitude for all student groups (ALL = .40,

196
p < .001; White = .41, p < .01; Latino /a = .52; Asian = .36, p < .001). This clearly is a good
addition to Hypothesis 2. This effect had been observed in two previous studies published by the
author of this study while assessing the factorial validity of the College Mattering Inventory and
the Sense of Belonging Scales (Tovar & Simon, 2010; Tovar et al., 2009). The final addition to
the path structure corresponding to Hypothesis 2 was gender to sense of belonging. Albeit, this
negative path was significant only for ALL students as a group (-.10, p < .001), but not for any of
the individual racial/ethnic groups. Given the negative loading, it appears that men have a lower
sense of mattering to the institution, in comparison to female students.
Figure 13. Hypothesis 2: Hypothesized, deleted, and confirmed paths in model.

197
Findings for Hypothesis 3
This hypothesis established that institutional commitment to students and interactions
with racially/ethnically diverse peers would positively impact students’ perceptions of mattering
to the institution. By contrast, perceptions of a hostile campus climate would negatively impact
mattering. Mattering, in turn would exert a direct positive effect on sense of belonging,
engagement/involvement and socio-academic integrative experiences, and an indirect effect on
intent to persist through sense of belonging, engagement/involvement and socio-academic
integrative experiences.
As noted in Figure 14, seven of the nine hypothesized paths were confirmed (or partially
supported) in the model (institutional commitment to students to mattering; interactions with
diverse peers to mattering; mattering to socio-academic integrative experiences; mattering to
engagement/involvement; mattering to sense of belonging; socio-academic integrative
experiences to intent to persist; and engagement/involvement to intent to persist). An additional
path was not supported (sense of belonging to intent to persist), albeit it was retained in the
model since it was an integral part of the Conceptual Model and at the time this decision was
made, it was expected that a statistically significant path would be found for some student
groups. However, this expectation was not met. Lastly, one path was not supported in the SEM
analysis and was removed from the model entirely (perceptions of a hostile campus climate to
mattering).

198
Examining the magnitude and direction of the path coefficients for institutional
commitment to students and interactions with diverse peers, both leading to mattering, it is clear
these factors greatly influence community college students’ perceptions of mattering to the
institution, regardless of their race/ethnicity. With respect to some ethnic differences in the
model, institutional commitment to students seems to have a much higher impact on Latino/a
students than on any other group (loading = .57, p < .001). While still statistically significant at
p < .001, the path loading from interactions with diverse peers to mattering was the lowest
among the groups. It appears that institutional actions exert a higher degree of influence on
perceptions of mattering for Latino/a students than do interactions with diverse peers. These two
constructs seem to impact all other students approximately equally.
As was discussed previously, mattering influences student perceptions of belonging at the
college to a statistically significant degree for all students, but as seen in Figure 14, this is
especially true for Latino/as (loading = .52, p <.001), and less so for Asian students (loading =
Figure 14. Hypothesis 3: Hypothesized, deleted, and confirmed paths in model.

199
.36, p <.01). Similarly, and given the magnitude of the path loading, mattering also influences
quite significantly Latino/as’ decisions/ability to engage in educationally purposeful activities,
but less so for Asians (.46, p <.001; .22, p <.01, respectively). The impact of mattering on
engagement/involvement was also high for White and ALL students.
Just as mattering had a significant influence on engagement/involvement, it also
exhibited a statistically significant relationship to students’ socio-academic integrative
experiences for all racial/ethnic groups. However, this was particularly true for White students
(.27, p <.001). Mattering appears to influence socio-academic integrative experiences to a lesser
degree on Latino/as (.16, p <.05).
Of the three factors in the model directly predicting intent to persist,
engagement/involvement had a particular influence for ALL students collectively, and White
students, in particular. No statistically significant path from engagement/involvement to intent to
persist was found from Asian or Latino/as. Lastly, the role of socio-academic integrative
experiences on intent to persist was particularly important for Asian students (.10, p <.05) and
ALL students as a group (.07, p <.01). socio-academic integrative experiences did not exert a
statistically significant impact of intent to persist for White and Latino/a students.
Taking all of these findings as a group, the conclusion is that Hypothesis 3 was “mostly”
correct in asserting the inter-relationship among the constructs with mattering as the moderator
and mediator for group differences in student experiences with sense of belonging,
engagement/involvement, socio-academic integrative experiences, and ultimately intent to
persist. Recontextualizing the hypothesis, one may conclude that institutional commitment to
students and interactions with racially/ethnically diverse peers positively impacts students’
perceptions of mattering to the institution. Mattering, in turn exerts a direct and positive effect

200
on sense of belonging, engagement/involvement and socio-academic integrative experiences, and
an indirect effect on intent to persist through sense of belonging, engagement/involvement and
socio-academic integrative experiences. Albeit, how influential each of these factors is in
ultimately predicting intent to persist is subject to the unique experiences of racial and ethnic
groups.
Findings for Hypothesis 4
Hypothesis 4 predicted that institutional commitment to students and perceptions of
mattering to the college would positively impact students’ engagement/involvement. Moreover,
it asserted engagement/involvement would exert a positive and direct effect on sense of
belonging, socio-academic integrative experiences, and on intent to persist. In turn,
engagement/involvement would exert an indirect effect on persistence through socio-academic
integrative experiences and goal commitment. These hypothesized relationships are depicted in
Figure 15. As may be noted, four of the nine hypothesized paths were confirmed in the model
(mattering to engagement/involvement; engagement/involvement to intent to persist; socio-
academic integrative experiences to intent to persist; and goal commitment to intent to persist).
Four paths were removed owning to a lack of a relationship with a target variable (institutional
commitment to students to engagement/involvement; engagement/involvement to sense of
belonging; socio-academic integrative experiences to goal commitment; and
engagement/involvement to socio-academic integrative experiences). Another such path was
kept in the model, although its path loadings were not statistically significant (sense of belonging
to intent to persist). As reported above, it was believed that sense of belonging would directly
impact intent to persist beliefs of students. Additionally, after a full analysis and respecification
of the structural model—the Conceptual Model—an additional path from

201
engagement/involvement to goal commitment was added. This new path resulted in an
additional indirect path leading to intent to persist.
As noted above, perceptions of mattering had a strong influence on
engagement/involvement for all student groups, but particularly for Latino/as, and significantly
less for Asians (.46, p <.001; .22, p <.01, respectively). Engagement/involvement had a small
direct effect on intent to persist for ALL and White students only (.13, p <.001; .18, p <.001,
respectively) and an indirect effect on persistence through goal commitment. The path from
socio-academic integrative experiences to intent to persist had small, positive, and significant
loading for ALL and Asian students only (.07, p <.01; .10, p <.05, respectively). The influence
of engagement/involvement on goal commitment can be appreciated in Figure 15. Based on
these loadings, all students regardless of race/ethnicity seem to be affected equally (loadings
from .26-.27).
Similar to the construct of mattering, engagement/involvement appears to play a pivotal
role in reinforcing students’ commitment to their educational goals and in turn their intentions to
complete their degree. Socio-academic integrative experiences, on the other hand, appears to
exert its effect independently. Thus, reinforcing the assertion that social/academic integration
plays a role in student decision to remain at the institution, albeit not necessarily with
traditionally underrepresented students like Latino/as (Rendón et al., 2000; Rendón Linares &
Muñoz, 2011; Tinto, 1993).

202
Figure 15. Hypothesis 4: Hypothesized, deleted, and confirmed paths in model.

203
Findings for Hypothesis 5
The last directional hypothesis concerning Research Question 3 was Hypothesis 5, which
proposed that perceptions of mattering to the college and engagement/involvement at the
institution would positively impact socio-academic integrative experiences. Socio-academic
integrative experiences would also have a positive and direct effect on intent to persist, and an
indirect effect mediated by goal commitment.
As observed in Figure 16, mattering was found to exercise a moderate direct effect on
socio-academic integrative experiences for all community college students in the study (ALL
=.19, p <.001; White = .27, p <.001; Latino/a = .16, p <.05; and Asian = .19, p <.01). Both
socio-academic integrative experiences and goal commitment also had small direct effect on
intent to persist for ALL students as a group (ALL = .07, p <.01; ALL = .09, p <.01,
respectively). The path from goal commitment to intent to persist was also significant for
Latino/a and Asian students (Latino/a = .11, p <.05; Asian = .10, p <.01), but not for White
students (White = .06, p > .05). Contrary to the hypothesis, two paths were not statistically
significant and were deleted from the structural model. Engagement/involvement did not
directly influence socio-academic integrative experiences. Similarly, socio-academic integrative
experiences did not directly impact goal commitment. Given the elimination of the two non-
significant paths from the model, engagement/involvement did not indirectly impact intent to
persist through socio-academic integrative experiences as was hypothesized.

204
Figure 16. Hypothesis 5: Hypothesized, deleted, and confirmed paths in model.

205
Conclusion for Research Question 3
In accounting for all the findings above, the directional hypotheses proposed in Chapter 3
were only partially supported in the respecified Conceptual Model (Respecified Structural Model
2—fully illustrated in Figure 7). The following are some brief conclusions derived from testing
the hypotheses (in no particular order):
• This study did not find support for the hypothesized direct relationship from sense
of belonging to intent to persist, unlike findings from a four-year college for
African American and White students (Hausmann et al., 2007).
• Nancy Schlossberg famously asserted that institutions that were concerned with
students’ perceptions of mattering would find students who were highly
involved/engaged on campus, and where their retention was high (Schlossberg,
1989). Until the time of this study, this assertion had remained an empirical
question to be investigated. As noted in several of the hypotheses above,
mattering did in fact exert moderate to strong influences on several key factors,
which among them were engagement/involvement, socio-academic integrative
experiences, and sense of belonging. However, mattering did not directly impact
intent to persist to degree completion as Schlossberg and the Conceptual Model
had anticipated. As will be noted later in another section, the standardized total
effect (direct plus indirect as noted on Table 25) of mattering on intent to persist
was .094 (p = .002) for ALL students, .11 for White students, .10 for Latino/a
students and .06 for Asian students. That is, when mattering goes up by 1
standard deviation, intent to persist goes up by 0.094 standard deviations. The
total effects of mattering can also be observed in its relationship with socio-

206
academic integrative experiences, with standardized total effects ranging from .16
for Latino/a students to .27 for White students. Similarly, mattering exerted
strong positive total effects on engagement/involvement from .22 for Asian
students to .47 for Latino/a students. While the effect of sense of belonging on
intent to persist was not statistically significant for any students in the study,
Hypothesis 1 did confirm the importance of mattering on community college
students’ sense of belonging to their institution. Some of the strongest total
effects in the model entailed the mattering-sense of belonging relationship.
Standardized total effects were .40 for all students, .41 for White students, .52 for
Latino/as, and .36 for Asian students. Thus, mattering appears to play an
important role for all students across several intermediate college outcomes.
• Another key finding from the hypotheses was the role of engagement/involvement
in impacting several intermediate variables such as socio-academic integrative
experiences, sense of belonging, and ultimately intent to persist, especially for
White students and students as a whole (though not for Latino/as or Asians).
Referring once again to the total effects of engagement/involvement on intent to
persist, this study found a small to moderate and positive relationship. The
standardized total effect (direct plus indirect) of engagement/involvement on
intent to persist was .18 (p < .001) for ALL students, .23 (p < .001) for White
students, .13 for Latino/a students (n.s.), and .12 (p < .05) for Asian students.
• With respect to socio-academic integrative experiences, much of the statistically
significant findings based on Hypotheses 1-5, were that it exerted a small direct
effect on intent to persist for all students as a group, as well as for Asian student.

207
This finding carried through when reviewing the total effects of socio-academic
integrative experiences on intent to persist, with a standardized total effect of .07
for all students and .10 for Asian students.
• As noted in another section, the literature on college climates for students is well
developed and continues to grow. However, much of this literature has
concentrated on the experiences of four-year students, like so many other research
areas, including those above and in the Conceptual Model. In this study,
perceptions of a hostile campus climate had a strong, negative, and total effect on
sense of belonging for all students regardless of race/ethnicity, but particularly for
Asian students (-.53), and ALL students closely following (-.50). The effect on
sense of belonging for White and Latino/a students was influenced quite
significantly by perceptions of a hostile campus climate experiences (-.43, -.44,
respectively).
• Also characterized by a rich and growing literature, this study as noted in
Hypothesis 1 findings, interactions with diverse peers had a very strong direct
effect on mattering and a small to moderate effect on SOB. The total effects of
interactions with diverse peers on mattering was .55 for ALL students, .57 for
White students, .50 for Latino/as, and .57 for Asian students. While these total
effects are quite strong for everyone in the study, it is also significant to note that
both interactions with diverse peers had the strongest effect on White and Asian
students, albeit the differences for Latino/as are minor. With respect to the
influence of interactions with diverse peers on sense of belonging, a similar, if
smaller pattern was found by race/ethnicity, ranging from .40 for Latino/as to .45
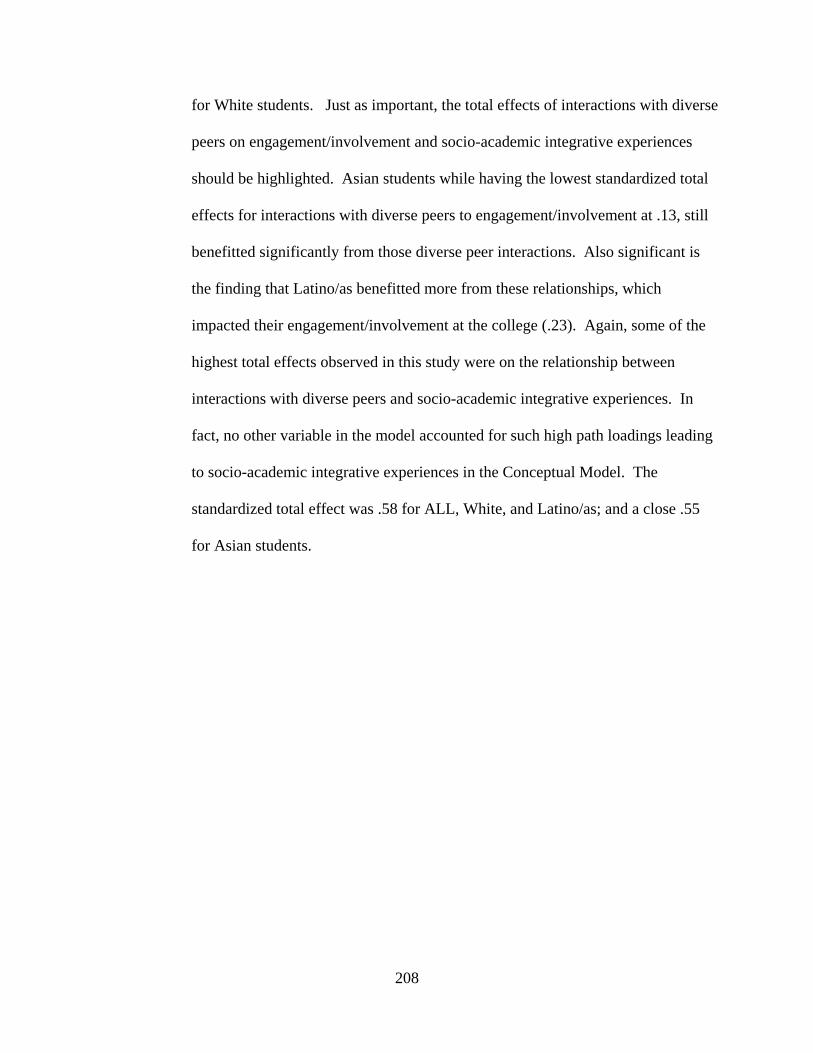
208
for White students. Just as important, the total effects of interactions with diverse
peers on engagement/involvement and socio-academic integrative experiences
should be highlighted. Asian students while having the lowest standardized total
effects for interactions with diverse peers to engagement/involvement at .13, still
benefitted significantly from those diverse peer interactions. Also significant is
the finding that Latino/as benefitted more from these relationships, which
impacted their engagement/involvement at the college (.23). Again, some of the
highest total effects observed in this study were on the relationship between
interactions with diverse peers and socio-academic integrative experiences. In
fact, no other variable in the model accounted for such high path loadings leading
to socio-academic integrative experiences in the Conceptual Model. The
standardized total effect was .58 for ALL, White, and Latino/as; and a close .55
for Asian students.

209
Direct and Indirect Effects of the Respecified Conceptual Model on Intent to Persist,
Mattering, Sense of Belonging, Engagement/Involvement, and Socio-Academic Integrative
Experiences
In this section, the decomposition of effects for the Conceptual Model are discussed in
greater detail for several of the key constructs in the model. Research Question 3 addressed
these on a limited basis and only as they applied to the five directional hypotheses constituting it.
As has been noted several times, the Conceptual Model is complex, with a total of 37 unique
paths, most of which are statistically significant for the four groups in the study: all students
(ALL), White, Latino/a, and Asian. The sections that follow will discuss the standardized direct
and indirect effects associated with intent to persist to degree completion based on the inter-
relationships noted in the corresponding versions of the Conceptual Model. Recall that the
model was found invariant for White and Latino/a students, and that a few factor loadings were
freely estimated for Asian students (as discussed in the results section for Research Question
2.1). As may be observed on Table 23, the total variance on intent to persist was similar for
three of the racial/ethnic groups, and significantly higher for one: ALL = .21, White = .21,
Latino/a = .19, and Asian = .28. Some of the paths contributing differently in the model by
race/ethnicity, will be noted as the direct, indirect, and total effects for the Conceptual Model are
discussed below. As a point of information, Table 23 summarizes the direct effects for the
Conceptual Model, while Table 24 presents the indirect effects. Lastly, the total effects are
summarized on Table 25.
Direct and Indirect Effects of Intent to Persist
Table 23 presents the direct effects of several variables on intent to persist. These
include, engagement/involvement, sense of belonging, socio-academic integrative experiences,
goal commitment, GPA, length of attendance, and college transition support from family/friends.

210
Judging by the magnitude and statistical significance of the path loadings, transition support
from family and friends was the only variable in the model to exert a direct, and highest degree
of influence on intent to persist across all racial/ethnic groups (ranging from .31 for Latino/as to
.43 for Asians). Higher levels of support were associated with higher intentions to persist. As
suggested in the retention literature, the direct effect of goal commitment on intent to persist was
significant for three groups of students, ALL, Latino/as, and Asian students. A higher GPA was
also correlated with persistence intentions for all students as a group, for White and Asian
students, but not for Latino/as. Engagement/involvement in educationally purposeful and co-
curricular activities positively impacted intent to persist, albeit only for White (.18) and ALL
(.13). Socio-academic integrative experiences, namely, perceiving instructors as available and
supportive, was a positive factor on persistence for ALL and Asian students only. Lastly, length
of college attendance was the only variable in the model to negatively impact persistence
intentions for ALL and White students; although non-significant, negative effects were also
found for Latino/a and Asian students. While it was believed based on limited extant literature
that sense of belonging would directly and positively impact persistence intentions, this was not
the case in this study. It is plausible, that sense of belonging may affect actual persistence.
However, this study was unable to assess this.
Although several of the hypothesized paths in the Conceptual Model were not found to
have a direct effect on intent to persist, these exercised an indirect influence. Interactions with
diverse peers was influential for all students in the study, regardless of race/ethnicity (.09-.11),
exerting its influence through sense of belonging, hostile campus climate, institutional
commitment, engagement/involvement, and socio-academic integrative experiences. A similar
relationship was found for institutional commitment to students, whose impact was exerted

211
through the mediating effects of a hostile campus climate, sense of belonging, mattering, and
socio-academic integrative experiences. Engagement/involvement also carried a small, but
significant indirect effect on persistence for all students. Of the other variables in the model,
GPA had a small, positive influence on intent to persist for ALL and Asian students. Lastly, and
notably, transition support from family and friends also had a small indirect effect through
several of the same variables above for all, but White students.
Direct and Indirect Effects of Perceptions of Mattering to the College
Three factors/variables accounted for approximately 50% of the variance on mattering to
the college for all ethnic groups in the study (.48-.49 for ALL, Whites, and Asians), and slightly
higher for Latino/as (.54). Higher levels of perceived institutional commitment to students was
related to higher perceptions of mattering, particularly for Latino/as (.57). Interactions with
diverse peers exerted a higher positive direct effect for White and Asian students (.44);
interestingly, the effect was significantly lower—albeit still positive—for Latino/as (.28).
Females as a group, and Asian females in particular, reported higher levels of mattering, in
contrast to male students.
With respect to indirect effects for mattering to the college, interactions with diverse
peers, mediated through institutional commitment had a higher positive effect for Latino/as (.22)
than for other students (.12-.14). Similarly, transition support from family/friends, mediated
through interactions with diverse peers and institutional commitment, had a higher indirect effect
on Latino/as (.18) than other students (.06-.12). These differences are largely based in the
stronger direct effects of supportive family/friends on interactions with diverse peers and
institutional commitment to students on mattering, for Latino/as.
No other studies in the higher education literature had directly examined the relationship
between institutional commitment to students and perceptions of mattering and interactions with

212
diverse peers and mattering. Thus, this study is the first of its kind to empirically demonstrate
there exists a causal positive effect between the two sets of factors. Based on these findings, it
would appear that institutional commitment to students plays a particularly significant role in
communicating to students an “ethic of care” as suggested by Tinto (1993), which in turn
influences perceptions of mattering to the institution. Likewise, the importance of interactions
with diverse peers also played a significant role in facilitating perceptions of mattering. While
other studies had examined this relationship on a limited basis, by examining differences by
race/ethnicity, such analyses had been correlational in nature (Tovar et al., 2008; Tovar et al.,
2009). Thus, this study provides stronger support for diverse peer interactions on intermediate
college outcomes such as mattering.
Direct and Indirect Effects of Sense of Belonging
Similar to mattering, five factors/variables accounted for just over half the variance in
sense of belonging to the institution for ALL, Latino/as, and Asian students, and exactly 50% for
White students. Perceptions of mattering had the highest direct effect on belonging, especially
for Latino/as (.52) and significantly less for Asians (.36). Interactions with diverse peers also
exerted a positive significant effect for all, but Latino/as, albeit not to the degree that mattering
did. In contrast to these positive predictors of sense of belonging, three factors in the model
were associated with lower levels of belonging: institutional commitment to students (for ALL),
gender (male-ALL and Asians), and noticeably, perceptions of a hostile campus climate. Based
on the magnitude of the direct effects loadings, Asian students’ sense of belonging to the
institution (-.53) was most affected when confronting a campus environment that was not
welcoming owning to their personal characteristics. While the effect for White and Latino/a
students was also negative, perceptions of a hostile campus climate had a lower impact on their
sense of belonging (-.43, -.44, respectively).

213
The indirect effects associated with sense of belonging are generally consistent with those
found for perceptions of mattering to the college. This comes as no surprise considering the
similarities the constructs share. Of import to this analysis is the finding that institutional
commitment to students appears to counteract the effects of perceptions of a hostile campus
climate, which otherwise exerts a strong negative effect on belonging. Results of the analysis
indicates this is particularly true for Latino/as (indirect effect = .35), although it is also
significant for other students (.17-.20). This same mediating effect was found for interactions
with diverse peers, albeit the effect was similar across groups (.27-.30). The indirect effects of
supportive family/friends on belonging was more complex, but nonetheless it accounted for a
statistically significant portion of the variance (with indirect standardized loadings ranging from
.14 to .19). Lastly, gender also exercised a small indirect effect mediated through both
interactions with diverse peers and perceptions of a hostile campus climate.
Consistent with previous studies, these findings confirm the deleterious effect that hostile
campus environments exercise on community college students’ perceptions of belonging to the
campus (Hausmann et al., 2007; Hausmann et al., 2009; Hurtado & Carter, 1997; Locks et al.,
2008; Nuñez, 2009; Tovar & Simon, 2010). However, counteracting the “chilly” campus
climate are positive interactions students have with diverse peers and institutional commitment to
students. Of these only the former relationship has been reported in the literature. Additionally,
perceptions of mattering to the institution clearly have a strong positive effect on sense of
belonging. While the relationship between mattering and sense of belonging has been theorized
(Strayhorn, 2012), and correlations reported (Tovar & Simon, 2010; Tovar et al., 2009), this
study is the first to report the causal effect of mattering on belonging, and it is particularly
noteworthy to highlight the fact that this relationship carries through regardless of students’

214
race/ethnicity. Given the above, this study makes two unique contributions: (1) the finding that
institutional commitment to students has the potential to counteract perceptions of a hostile
campus climate, thus increasing students’ sense of belonging at the institution; and (2) the
positive causal nature of the effects of mattering on sense of belonging.
Direct and Indirect Effects of Engagement/Involvement
Three variables in the conceptual model empirically demonstrated a direct effect on
engagement/involvement: perceptions of mattering, units enrolled, and length of college
attendance. Together they accounted for 29% of the variance for White and Latino/as, 24% for
all students, and 11% for Asian students. Both the number of units enrolled and perceptions of
mattering had a similar positive impact as a whole. However, mattering had a stronger positive
effect for Latino/as (.46) than for any other racial/ethnic group, and especially Asian students
(.22). With respect to units enrolled, the greater the number of units in which they enrolled, the
more students were engaged/involved on campus, although this appears to be moderated by
race/ethnicity (White =. 37, Latino/a/Asian = .25).
The review of indirect effects on engagement/involvement highlighted the importance of
mattering as a mediator variable between institutional commitment to students and their
engagement in educationally beneficial activities. In addition, this relationship was found to be
particularly significant for Latino/as (.26), compared to other students (.09-15). Similarly,
interactions with diverse peers exercised a moderate indirect relationship with engagement,
mediated by mattering, and was especially influential for White and Latino/as (.23-.23). Also
significant were the indirect effects of transition support from family/friends and gender, albeit to
a lesser degree—but for all student groups.
While it may be expected that the more courses/units a student takes per semester may in
fact result in higher levels of engagement/involvement in educationally purposeful and co-

215
curricular activities, the causal relationship between mattering and engagement/involvement had
also only been alluded to in the literature (France & Finney, 2009; Schlossberg, 1989; Strayhorn,
2012). Indeed these authors have also articulated that a sense of belonging to the institution
engenders involvement. However, as described in an earlier section (findings for Research
Question 2), the structural model confirmed the directionality hypothesized in this study
(mattering to engagement/involvement), and there was no evidence as suggested by modification
indices and expected parameter change statistics to suggest that sense of belonging impacted
engagement/involvement. Again, this study provides empirical support on the causal nature of
mattering to engagement/involvement. Moreover, the study also established the mediating role
of mattering and helps highlights the importance of institutional commitment to students
(especially for Latino/as) and of diverse peer interactions (for White and Latino/as). The study
also shows that the lack of a significant implied path from sense of belonging to
engagement/involvement in the respecified Conceptual Model, evidences a lack of support for
previously held beliefs of the impact of sense of belonging on involvement. It seems the
directionality of the relationship is just the opposite.
Direct and Indirect Effects of Socio-academic Integrative Experiences
Four variables in the conceptual model empirically supported a direct effect on socio-
academic integrative experiences: institutional commitment to students, interactions with diverse
peers, perceptions of mattering, and transition support from family/friends. All four of the path
coefficients were statistically significant for ALL, White, Latino/a, and Asian students.
However, the percentage of variance accounted for was different. The lowest percentage of
variance was among Asian students (.41), followed by ALL and White (.45), and the highest was
for Latino/as (.49). The factor to exert the highest direct impact on integration was interactions
with diverse peers to a similar degree among all students (.38-.41). Perceived institutional

216
commitment to students had a slightly different influence by race/ethnicity: White: .15, Asian =
.18, ALL = .20 and Latino/a = .24. The effect of perceptions of mattering to the college was
similar for ALL and Asian students. However, mattering was most influential on socio-
academic integrative experiences for White students (.27) and least influential for Latino/as
(.16). Lastly, support from family/friends had a small, significant, and positive effect on
integration for all students in the study (.07-.10).
As with engagement/involvement, interactions with diverse peers held an important
indirect effect on integrative experiences, which had a stronger effect for White than for any
other students. The indirect role of institutional commitment and transition support from
family/friends was also significant for all groups, with all showing a similar (small) effect.
Gender also exerted a small positive indirect effect through mattering for White and ALL
students.
These findings reinforce to a degree, Tinto’s conceptualization of the interactional nature
of institutional commitments and participation in the social/academic communities of the college
(Tinto, 1975, 1987, 1993). Whereas Tinto’s interactionalist model has been the subject of much
review and criticism, and much has been said about this framework not accounting for the
experiences of impacted groups or of community colleges, researchers have also failed to
examine a key element in that model; namely, institutional commitment to students. Researchers
have focused primarily on students’ commitment to the institution. However, Tinto explicitly
acknowledged that “The mirror image of individual commitment to the institution is the
commitment of the institution, as exhibited by the behaviors of its faculty and staff, to the
individual” (1993; p. 208). This commitment is reflected in the “ethos of caring” characterizing
the institution. This study has demonstrated the important value that institutional commitment

217
and perceptions of mattering (as a proxy for an “ethos of caring’) in influencing student
participation in the social and academic communities of the college—regardless of
race/ethnicity. While other studies have examined on a limited basis the influence of
institutional commitment on students’ subsequent commitment to the institution, this study was
the first to investigate the influence of institutional commitment to students on a community
college population. Importantly, the study found that indeed, institutional commitment plays a
crucial role in integrative experiences for ethnic minorities, including Asian and Latino/as. As
well, this is the first study to examine the role of mattering on socio-academic integrative
experiences and it was noted that higher perceptions of mattering are associated with higher
levels of socio-academic integration.

218
Table 23
Direct effects of Conceptual Model components by Race/Ethnicity
Direct effects on: All Studentsa (N = 2,088)
White (n = 737)
Latino (n = 460)
Asianb (n = 435)
b p β b p β b p β b p β
Intent to Persist to Degree Completion R2
.205
.214
.190
.281 Engagement/Involvement .301 *** .134 .411 *** .177 .157 .070 .084 .040 Sense of Belonging .045 ǂ .045 .077 ǂ .072 .045 .047 .041 .043 Socio-academic integrative experiences .105 ** .071 -.045
-.030 .133 .095 .145 * .100
Goal commitment .090 ** .089 .065
.063 .115 * .112 .093 ** .095 GPA .066 ** .065 .123 ** .107 .083 ǂ .087 .147 ** .151 Length of attendance -.062 *** -.065 -.065 * -.067 -.064
-.072 -.037
-.038
Transition support from family and friends .491 *** .338 .538 *** .340 .398 *** .307 .598 ** .434
Interactions with Diverse Peers R2
.031
.015
.036
.044 Transition support from family and friends .154 *** .143 .090 * .077 .172 *** .171 .155 *** .152 Gender .158 *** .092 .164 * .091 .122
.073 .204 ** .126
Institutional Commitment to Students R2
.129
.108
.197
.113 Transition support from family and friends .132 ** .099 .069
.049 .207 *** .169 .104 * .086
Interactions with Diverse Peers .411 *** .331 .383 *** .320 .463 *** .381 .366 ** .310
Perceptions of Mattering to the College R2
.478
.477
.540
.491 Institutional Commitment to Students .333 *** .425 .332 *** .399 .457 *** .566 .314 ** .396 Interactions with Diverse Peers .400 *** .411 .440 *** .443 .276 *** .281 .415 ** .444

219
Direct effects on: All Studentsa (N = 2,088)
White (n = 737)
Latino (n = 460)
Asianb (n = 435)
b p β b p β b p β b p β
Gender .078 * .046 .078
.044 .104
.063 .129 ** .086
Perceptions of a Hostile Campus Climate R2
.111
.092
.078
.090 Institutional Commitment to Students -.053 *** -.096 -.014
-.024 -.080 ǂ -.135 -.031
-.045
Interactions with Diverse Peers -.106 *** -.155 -.119 *** -.175 -.077
-.107 -.117 *** -.145 Transition support from family and friends -.166 *** -.224 -.180 *** -.225 -.106 * -.147 -.182 ** -.222
Engagement/Involvement R2
.239
.285
.292
.113 Perceptions of mattering to the college .207 *** .336 .219 *** .377 .269 *** .461 .153 *** .221 Units enrolled .043 *** .342 .045 *** .368 .033 ** .250 .032 *** .246 Length of attendance .065 *** .154 .063 ** .151 .064 * .162 .049 *** .105
Sense of Belonging R2
.523
.495
.527
.528 Institutional Commitment to Students -.109 *** -.100 -.019
-.018 -.141 ǂ -.125 -.084 ǂ -.070
Interactions with Diverse Peers .183 *** .136 .182 ** .145 .156 ǂ .115 .199 ** .140 Perceptions of a hostile campus climate -.977 *** -.498 -.795 *** -.432 -.842 *** -.444 -.940 *** -.533 Perceptions of mattering to the college .557 *** .404 .509 *** .405 .722 *** .519 .551 ** .362 Gender -.229 *** -.099 -.130 ǂ -.058 -.181 ǂ -.079 -.242 ** -.106
Socio-Academic Integrative Experiences R2
.457
.452
.490
.409 Institutional Commitment to Students .144 *** .195 .110 ** .146 .181 ** .239 .141 ** .179 Interactions with Diverse Peers .374 *** .409 .339 *** .378 .373 ** .406 .361 ** .388 Perceptions of mattering to the college .182 *** .194 .243 *** .269 .151 * .161 .190 ** .190

220
Direct effects on: All Studentsa (N = 2,088)
White (n = 737)
Latino (n = 460)
Asianb (n = 435)
b p β b p β b p β b p β
Transition support from family and friends .080 *** .081 .094 ** .089 .093 * .101 .067 * .070
Grade Point Average R2
.116
.111
.137
.101 Engagement/Involvement .699 *** .316 .641 *** .318 .753 ** .318 .688 ** .320 Sense of Belonging .047 * .048 .049
.053 .077
.078 -.033
-.034
Financial concerns -.069 *** -.087 .025
.037 -.109 ** -.128 -.001
-.001
Goal Commitment R2
.120
.113
.116
.133 Perceptions of a hostile campus climate -.138 ** -.071 -.020
-.010 -.193 ǂ -.110 -.248 * -.144
Engagement/Involvement .604 *** .274 .616 *** .272 .574 ** .261 .581 ** .270 GPA .062 * 0.062 .063
.056 .056
.060 .093 * .093
***p < .001; ***p < .01; ***p < .05; ǂp < .10 a Encompasses all students in the study based on the finding that Respecified Structural Model 2 (the adjusted Conceptual Model) was race/ethnicity invariant for White, Latino, and Asian students. b The following factor loadings were freely estimated based on a minor indication the model might not be fully invariant for Asian students: M36, M18,M39, M48, Q173_9, Q173_1, Q134, InsSup, M30.

221
Table 24
Indirect effects of Conceptual Model components by Race/Ethnicity
Indirect effects on: All Studentsa (N = 2,088)
White (n = 737)
Latino (n = 460)
Asianb (n = 435)
b p β b p β b p β b p β
Intent to Persist to Degree Completion Institutional Commitment to Students .056 *** .052 .044 ** .039 .084 *** .079 .046 ** .040
Interactions with Diverse Peers .129 *** .096 .090 *** .067 .139 ** .108 .118 ** .087 Perceptions of a hostile campus climate -.059 * -.030 -.068 * -.034 -.066
-.037 -.057
-.034
Perceptions of mattering to the college .130 *** .094 .148 *** .110 .135 ** .103 .085 ** .058 Engagement/Involvement .105 *** .047 .121 ** .052 .133 * .059 .161 ** .077 Sense of Belonging .003 *** .003 .006
.006 .007
.007 -.005
-.005
Units .017 *** .062 .024 *** .084 .010 ǂ .032 .008 * .029 Financial concerns -.005 ** -.006 .003
.004 -.010 * -.012 .000
.000
Transition support from family and friends .046 *** .031 .019 ǂ .012 .061 *** .047 .043 ** .031 Length of attendance .027 *** .028 .034 ** .035 .019 ǂ .021 .012 ** .012 Gender .019 * .008 .015
.006 .022
.010 .026 * .012
GPA .006 *** .096 .004
.067 .006
.108 .009 * .087
Interactions with Diverse Peers Transition support from family and friends Gender
Institutional Commitment to Students Transition support from family and friends .063 *** .047 .035 * .025 .080 *** .065 .057 *** .047
Gender .065 *** .030 .063 * .029 .057
.028 .074 ** .039
Perceptions of Mattering to the College Interactions with Diverse Peers .137 *** .141 .127 *** .128 .211 *** .216 .115 ** .123

222
Indirect effects on: All Studentsa (N = 2,088)
White (n = 737)
Latino (n = 460)
Asianb (n = 435)
b p β b p β b p β b p β
Transition support from family and friends .127 *** .121 .074 * .064 .178 *** .181 .115 ** .121 Gender .085 *** .050 .093 * .052 .060
.036 .108 ** .072
Perceptions of a Hostile Campus Climate Interactions with Diverse Peers -.022 *** -.032 -.005
-.008 -.037 ǂ -.052 -.011
-.014
Transition support from family and friends -.027 *** -.036 -.012 * -.015 -.036 ** -.050 -.023 *** -.028 Gender -.020 *** -.017 -.020 * -.017 -.014 ǂ -.011 -.026 *** -.020
Engagement/Involvement Institutional Commitment to Students .069 *** .143 .073 *** .150 .123 *** .261 .048 *** .087
Interactions with Diverse Peers .111 *** .185 .124 *** .215 .131 *** .229 .081 *** .125 Transition support from family and friends .026 *** .041 .016 ** .024 .048 *** .083 .017 *** .027 Gender .034 *** .033 .037 ** .036 .044 ** .046 .036 *** .035
Sense of Belonging Institutional Commitment to Students .237 *** .220 .180 *** .172 .397 *** .354 .202 ** .168
Interactions with Diverse Peers .379 *** .283 .381 *** .304 .382 *** .280 .382 *** .268 Transition support from family and friends .265 *** .183 .205 *** .139 .235 *** .172 .273 *** .189 Gender .132 *** .057 .132 ** .059 .141 * .061 .189 ** .083
Socio-Academic Integrative Experiences Institutional Commitment to Students .061 *** .083 .081 *** .108 .069 * .091 .059 ** .075
Interactions with Diverse Peers .157 *** .172 .180 *** .201 .157 *** .171 .152 *** .163 Transition support from family and friends .109 *** .110 .060 ** .057 .143 *** .155 .100 *** .106 Gender .098 *** .062 .104 ** .064 .080 ǂ .052 .129 ǂ .086
Grade Point Average Institutional Commitment to Students .054 *** .051 .054 *** .056 .112 *** .101 .029 ** .025

223
Indirect effects on: All Studentsa (N = 2,088)
White (n = 737)
Latino (n = 460)
Asianb (n = 435)
b p β b p β b p β b p β
Interactions with Diverse Peers .104 *** .078 .107 *** .092 .140 *** .104 .036
.026 Perceptions of a hostile campus climate -.046 * -.024 -.039
-.023 -.065
-.035 .031
.018
Perceptions of mattering to the college .171 *** .125 .165 *** .141 .258 *** .187 .087 * .058 Units enrolled .030 *** .108 .029 *** .117 .025 ** .079 .022 *** .079 Transition support from family and friends .031 *** .022 .021 ** .015 .054 *** .040 .003
.002
Length of attendance .046 *** .049 .041 ** .048 .048 * .052 .033 *** .034 Gender .019 * .008 .024 * .012 .030
.013 .027 ** .012
Goal Commitment Institutional Commitment to Students .052 *** .049 .048 *** .044 .092 *** .089 .038 ** .032
Interactions with Diverse Peers .091 *** .069 .086 *** .066 .105 *** .083 .082 *** .059 Perceptions of a hostile campus climate -.003 * -.001 -.002
-.001 -.004
-.002 .003
.002
Perceptions of mattering to the college .136 *** .100 .145 *** .110 .169 *** .131 .097 *** .065 Sense of Belonging .003 * .003 .003
.003 .004
.005 -.003
-.003
Engagement/Involvement .043 * .020 .041
.018 .042
.019 .064 * .030 Units enrolled .028 *** .100 .030 *** .107 .021 ** .070 .021 *** .073 Financial concerns -.004 ** -.005 .002
.002 -.006
-.008 .000
.000
Transition support from family and friends .044 *** .031 .015
.010 .058 *** .046 .061 ** .043 Length of attendance .042 *** .045 .041 * .044 .040 * .045 .031 *** .031 Gender .024 *** .011 .025 * .011 .030 ** .014 .030 ** .013
***p < .001; ***p < .01; ***p < .05; ǂp < .10 a Encompasses all students in the study based on the finding that Respecified Structural Model 2 (the adjusted Conceptual Model) was race/ethnicity invariant for White, Latino, and Asian students. b The following factor loadings were freely estimated based on a minor indication the model might not be fully invariant for Asian students: M36, M18,M39, M48, Q173_9, Q173_1, Q134, InsSup, M30.

224
Table 25
Total effects of Conceptual Model components by Race/Ethnicity
Total effect on: All Studentsa (N = 2,088)
White (n = 737)
Latino (n = 460)
Asianb (n = 435)
b Sig. β b Sig. β b Sig. β b Sig. β
Intent to Persist to Degree Completion Institutional Commitment to Students .056 *** .052 .044 ** .039 .084 *** .079 .046 ** .040
Interactions with Diverse Peers .129 *** .096 .090 ** .067 .139 ** .108 .118 ** .087 Perceptions of a hostile campus climate -.059 * -.030 -.068 * -.034 -.066
-.037 -.057
-.034
Perceptions of mattering to the college .130 *** .094 .148 *** .110 .135 ** .103 .085 ** .058 Engagement/Involvement .405 *** .181 .532 *** .229 .290
.129 .245 * .117
Sense of Belonging .048 ǂ .048 .083 * .078 .052
.055 .036
.038 Socio-academic integrative experiences .105 ** .071 -.045
-.030 .133
.095 .145 * .100
Goal commitment .090 ** .089 .065
.063 .115 * .112 .093 ** .095 GPA .072 ** .071 .127 ** .110 .089 ǂ .094 .156 ** .160 Length of attendance -.035 ǂ -.037 -.031
-.032 -.046
-.051 -.025
-.026
Units enrolled .017 *** .062 .024 *** .084 .010 ǂ .032 .008
.029 Financial concerns -.005 ** -.006 .003
.004 -.010 * -.012 .000
.000
Gender .019 * .008 .015
.006 .022
.010 .026 * .012 Transition support from family and friends .536 *** .369 .557 *** .353 .459 *** .354 .641 ** .465
Interactions with Diverse Peers Transition support from family and friends .154 *** .143 .090 * .077 .172 *** .171 .155 *** .152
Gender .158 *** .092 .164 * .091 .122
.073 .204 ** .126
Institutional Commitment to Students Transition support from family and friends .195 *** .146 .104 * .074 .286 *** .235 .160 ** .134
Interactions with Diverse Peers .411 *** .331 .383 *** .320 .463 *** .381 .366 ** .310 Gender .065 *** .030 .063 * .029 .057
.028 .074 ** .039

225
Total effect on: All Studentsa (N = 2,088)
White (n = 737)
Latino (n = 460)
Asianb (n = 435)
b Sig. β b Sig. β b Sig. β b Sig. β
Perceptions of Mattering to the College Institutional Commitment to Students .333 *** .425 .332 *** .399 .457 *** .566 .314 ** .396
Interactions with Diverse Peers .537 *** .551 .567 *** .570 .487 *** .497 .529 ** .567 Gender .162 *** .097 .171 * .096 .163 * .099 .236 ** .157 Transition support from family and friends .127 *** .121 .074 * .064 .178 *** .181 .115 ** .121
Perceptions of a Hostile Campus Climate Institutional Commitment to Students -.053 *** -.096 -.014 *** -.024 -.080 ǂ -.135 -.031
-.045
Interactions with Diverse Peers -.128 *** -.187 -.124 *** -.183 -.114 * -.158 -.128 *** -.159 Transition support from family and friends -.192 *** -.260 -.193 ** -.241 -.142 *** -.197 -.205 ** -.250 Gender -.020 *** -.017 -.020 * -.017 -.014 ǂ -.011 -.026 *** -.020
Engagement/Involvement Institutional Commitment to Students .069 *** .143 .073 *** .150 .123 *** .261 .048 *** .087
Interactions with Diverse Peers .111 *** .185 .124 *** .215 .131 *** .229 .081 *** .125 Perceptions of mattering to the college .207 *** .336 .219 *** .377 .269 *** .461 .153 *** .221 Units enrolled .043 *** .342 .045 *** .368 .033 ** .250 .032 *** .246 Transition support from family and friends .026 *** .041 .016 ** .024 .048 *** .083 .017 *** .027 Length of attendance .065 *** .154 .063 ** .151 .064 * .162 .049 *** .105 Gender .034 *** .033 .037 ** .036 .044 ** .046 .036 *** .035
Sense of Belonging Institutional Commitment to Students .129 *** .119 .161 *** .154 .257 ** .229 .118 ** .098
Interactions with Diverse Peers .562 *** .419 .562 *** .449 .539 *** .395 .581 ** .408 Perceptions of a hostile campus climate -.977 *** -.498 -.795 *** -.432 -.842 *** -.444 -.940 *** -.533 Perceptions of mattering to the college .557 *** .404 .509 *** .405 .722 *** .519 .551 ** .362 Gender -.097 * -.042 .002
.001 -.040
-.018 -.053
-.023
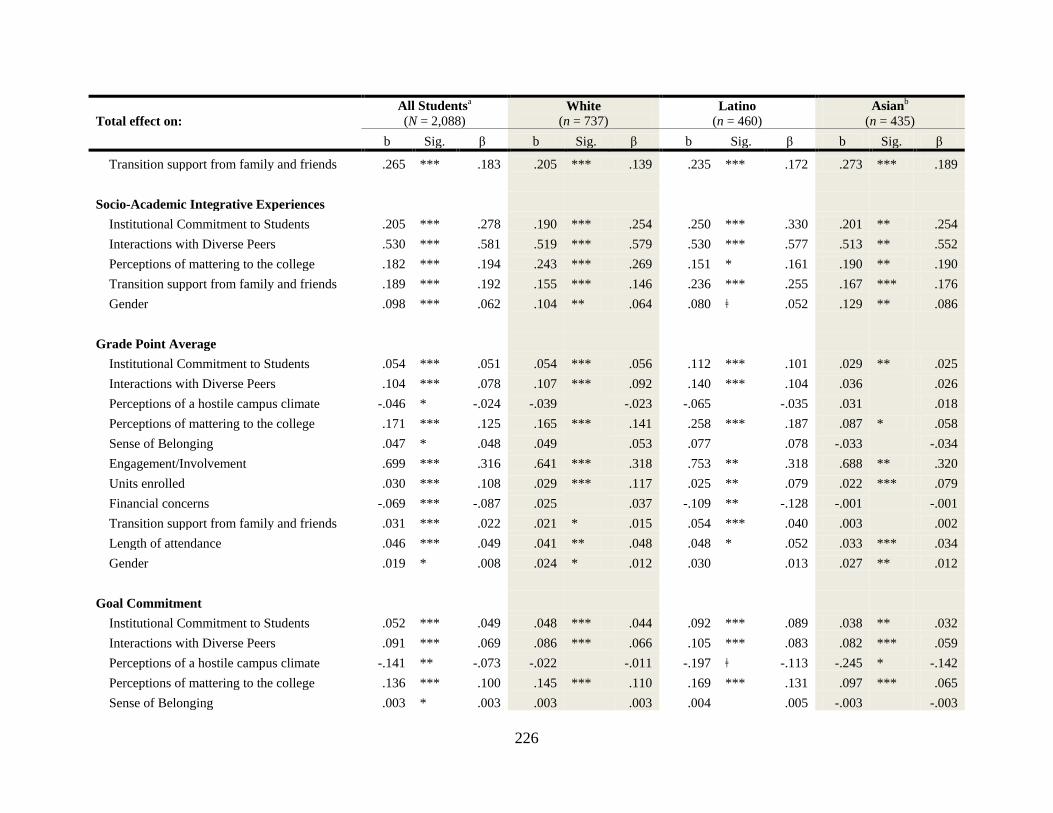
226
Total effect on: All Studentsa (N = 2,088)
White (n = 737)
Latino (n = 460)
Asianb (n = 435)
b Sig. β b Sig. β b Sig. β b Sig. β
Transition support from family and friends .265 *** .183 .205 *** .139 .235 *** .172 .273 *** .189
Socio-Academic Integrative Experiences Institutional Commitment to Students .205 *** .278 .190 *** .254 .250 *** .330 .201 ** .254
Interactions with Diverse Peers .530 *** .581 .519 *** .579 .530 *** .577 .513 ** .552 Perceptions of mattering to the college .182 *** .194 .243 *** .269 .151 * .161 .190 ** .190 Transition support from family and friends .189 *** .192 .155 *** .146 .236 *** .255 .167 *** .176 Gender .098 *** .062 .104 ** .064 .080 ǂ .052 .129 ** .086
Grade Point Average Institutional Commitment to Students .054 *** .051 .054 *** .056 .112 *** .101 .029 ** .025
Interactions with Diverse Peers .104 *** .078 .107 *** .092 .140 *** .104 .036
.026 Perceptions of a hostile campus climate -.046 * -.024 -.039
-.023 -.065
-.035 .031
.018
Perceptions of mattering to the college .171 *** .125 .165 *** .141 .258 *** .187 .087 * .058 Sense of Belonging .047 * .048 .049
.053 .077
.078 -.033
-.034
Engagement/Involvement .699 *** .316 .641 *** .318 .753 ** .318 .688 ** .320 Units enrolled .030 *** .108 .029 *** .117 .025 ** .079 .022 *** .079 Financial concerns -.069 *** -.087 .025
.037 -.109 ** -.128 -.001
-.001
Transition support from family and friends .031 *** .022 .021 * .015 .054 *** .040 .003
.002 Length of attendance .046 *** .049 .041 ** .048 .048 * .052 .033 *** .034 Gender .019 * .008 .024 * .012 .030
.013 .027 ** .012
Goal Commitment Institutional Commitment to Students .052 *** .049 .048 *** .044 .092 *** .089 .038 ** .032
Interactions with Diverse Peers .091 *** .069 .086 *** .066 .105 *** .083 .082 *** .059 Perceptions of a hostile campus climate -.141 ** -.073 -.022
-.011 -.197 ǂ -.113 -.245 * -.142
Perceptions of mattering to the college .136 *** .100 .145 *** .110 .169 *** .131 .097 *** .065 Sense of Belonging .003 * .003 .003
.003 .004
.005 -.003
-.003

227
Total effect on: All Studentsa (N = 2,088)
White (n = 737)
Latino (n = 460)
Asianb (n = 435)
b Sig. β b Sig. β b Sig. β b Sig. β
Engagement/Involvement .648 *** .294 .656 *** .290 .616 *** .280 .645 ** .299 GPA .062 * .062 .063
.056 .056
.060 .093 * .093
Units enrolled .028 *** .100 .030 *** .107 .021 ** .070 .021 *** .073 Financial concerns -.004 ** -.005 .002
.002 -.006
-.008 .000
.000
Transition support from family and friends .044 *** .031 .015
.010 .058 *** .046 .061 ** .043 Length of attendance .042 *** .045 .041 ** .044 .040 * .045 .031 *** .031 Gender .024 *** .011 .025 * .011 .030 ** .014 .030 ** .013
***p < .001; ***p < .01; ***p < .05; ǂp < .10 a Encompasses all students in the study based on the finding that Respecified Structural Model 2 (the adjusted Conceptual Model) was race/ethnicity invariant for White, Latino, and Asian students. b The following factor loadings were freely estimated based on a minor indication the model might not be fully invariant for Asian students: M36, M18,M39, M48, Q173_9, Q173_1, Q134, InsSup, M30.

228
Research Question 4: The Omnibus “Student Success” Construct?
Research Question 4 sought to determine if the constructs of engagement/involvement,
sense of belonging, mattering, perceptions of the campus climate, and peer relationships might
form part of an unnamed omnibus construct. Common among these constructs is the fact that
these are written about in the higher education literature with great frequency; are integrated into
various college student success and persistence models; and they are oftentimes conceptualized
or defined similarly, yet are given a different “label” (Akin, 2009; Astin, 1984, 1993; Barnett,
2010; Berger & Milem, 1999; Bers & Smith, 1991; Braxton & Hirschy, 2005; Braxton & Lien,
2000; Cabrera et al., 1992a; Crisp & Mina, 2012; Crisp & Nora, 2010; Deil-Amen, 2011; Dixon-
Rayle & Chung, 2007; Dowd et al., 2011; Feldman, 1993; France, 2011; France & Finney, 2010;
France et al., 2010; Freeman et al., 2007; Hausmann et al., 2007; Hausmann et al., 2009;
Hoffman et al., 2002; Hurtado & Carter, 1997; Kodama, 2002; Kuh, 2006; Kuh et al., 2008;
Lundberg & Schreiner, 2004; Lynch Ervin, 2010; Maestas et al., 2007; Metzner & Bean, 1987;
Nora & Crisp, 2012; Nora et al., 2011a; Nuñez, 2009; Pike, 2012; Rendón, 2006; Rendón et al.,
2000; Rhee, 2008; Schlossberg, 1989; Strayhorn, 2008, 2012; Tinto, 1993, 2006, 2012a, 2012b;
Torres, 2006; Tovar et al., 2009; Wolf-Wendel et al., 2009).
While this study was not meant to “definitively” declare that the above constructs are the
only factors would form part of this omnibus construct, the nature of the data collected lent itself
to investigate this possibility. To this end, a second-order confirmatory factor analysis composed
of five factors was examined.
Second-Order Confirmatory Factor Analysis
Model Specification. The second-order confirmatory factor analysis model was based
on Respecified Model 2 (Figure 4). The individual five factors were composed of the same

229
indictors and error covariance in that model, as illustrated in Figure 17. The model contends
that the covariation among the first-order factors is completely accounted for by their regression
on the second-order (omnibus) factor.
Figure 17. Hypothesized second-order confirmatory factor analysis model for Omnibus
construct.

230
The key research question guiding the analysis was: Does the hypothesized model
adequately fit the observed data? If not, what respecified model results in improved model fit?
As with Research Question 1, maximum likelihood estimation with 2,000 bootstrap
samples was used in AMOS 21. The bootstrap procedure produced the Bollen-Stine corrected χ2
p-value to help assess model fit. The Bollen-Stine p-value was used, in lieu of the usual ML χ2
p-value, which is inflated in the presence of multivariate non-normality. Several indices of fit
were also used to assess the overall goodness of fit for the model, including the χ2/df ratio, CFI,
SRMR, and RMSEA.
Model Identification. As specified in Figure 17, the model was over identified with 146
degrees of freedom (19 observations; 44 parameters to be estimated). With respect to sample
size and power, the ratio of cases to the number of parameters to be estimated should be 10:1,
(Kline, 2005). The resulting ratio for the CFA was 47:1, exceeding the threshold significantly.
The first congeneric variable for each first-order factor was set to 1.0 loading, and a zero loading
on all other factors.
Evaluation of Model Fit—Five Factors/19 Indicators. Results of the confirmatory
factor analysis revealed the hypothesized model was a poor fit to the data and should be rejected,
bootstrap Bollen-Stine χ2(146, N = 2,088) = 834.35, p < .001, χ2/df = 5.72, CFI = .94, SRMR =
.07, RMSEA = .05 (90% CI = .044, .051). All loadings were significant at p < .001; although,
the engagement/involvement factor had the lowest standardized loading (.29), in comparison to
the four other factors: interactions with diverse peers (.64), perceptions of a hostile campus
climate (-.49), mattering (.74), and sense of belonging (.75). Thus, it appears that the
engagement/involvement factor (as measured in this study), accounted for only a small portion of
the variance on the second-order factor. The standardized residual covariance matrix included

231
many excessive values above 2.58, which are considered large and indicative of model misfit
(Byrne, 2010). Indicators M18 (I sometimes feel alone and isolated at the college because of my
gender), M36 (I sometimes feel alone and isolated because of my sexual orientation), M55 (I
sometimes feel alone and isolated because of my race/ethnicity), and M63 (I sometimes feel
alone and isolated because of my age), all part of the perceptions of a hostile campus climate
factor were responsible for most of the large variances, which ranged from |2.69| to |9.31|.
Modification indices also indicated that adding a few error covariances from items constituting
the perceptions of a hostile campus climate to those in the other factors might result in improved
fit. Given these findings the model was rejected. In response to Research Question 4, this study
did not find support for an omnibus second-order factor based on five first-order factors:
engagement/involvement, interactions with diverse peers, perceptions of a hostile campus
climate, mattering, and sense of belonging. Consistent with the research question,
respecification of the model was pursued.
Evaluation of Model Fit for Respecified Omnibus Model—Four Factors/15
Indicators. Respecified Omnibus Model 1 dropped the perceptions of a hostile campus climate
factor from further consideration. The respecified model exhibited evidence of good fit,
bootstrap Bollen-Stine χ2(85, N = 2,088) = 253.20, p < .001, χ2/df = 2.98, CFI = .98, SRMR =
.04, RMSEA = .03 (90% CI = .026, .035). All indices of fit were better than the threshold set a
priori, as shown in Table 26. While the MIs noted the addition of error covariances among some
indicators might result in better fit, a need for parsimony prevailed. Respecified Omnibus
Second-Order Model 1 is proposed as the best fitting model. Standardized coefficients are
presented in Figure 18. All loadings and variances are significant at p < .001.

232
Research Question 4 Conclusion
Based on the evaluation of model fit, it is concluded that diverse peer interactions,
mattering, sense of belonging, and engagement/involvement encompass part of a second-order
omnibus factor—perhaps the unnamed “student development and success” factor that Wolf-
Wendel et al. (2009) allude to in their seminal work. Consistent with their argument, each of
these constructs uniquely contributes toward the “understanding of the [student success] puzzle”
(p. 426).

233
Table 26
Summary of Goodness-of-Fit Indices for Alternate Models of the Omnibus Second-Order CFA
Model
Goodness-of-Fit Measures
Model χ2 df χ2 / df CFI SRMR RMSEA (90% CI)
Optimal Values - - < 4.0 > .95 < .10 < .06
Hypothesized Model:
5 factors; 19 itemsa
(with covariances between:
eS30-eS32)
834.356 146 5.72 .94 .07 .05 (90% CI = .044, .051)
Respecified Omnibus Second-Order
Model 1:
4 factors; 15 items
(Deleted: HCC factor)
Best fit
1257.70 85 2.98 .98 .04 .03 (90% CI = .026, .035)
aOriginal items in CFA hypothesized model: Interactions with Diverse Peers Factor (The quality of my interactions and relationships with students of another race/ethnicity can best be characterized as: close/distant (Q74), supportive/ unsupportive (Q78), and available/unavailable (Q82)). Perceptions of a Hostile Campus Climate Factor (M18—I sometimes feel alone and isolated at the college because of my gender (reverse coded); M55—I sometimes feel alone and isolated because of my race/ethnicity (reverse coded); M36neg—I sometimes feel alone and isolated because of my sexual orientation (reverse coded); M63—I sometimes feel alone and isolated because of my age (reverse coded)). Sense of Belonging Factor (M31—Sometimes I feel alone at the college; M30—Sometimes I feel that no one at the college notices me; M32—Sometimes I get so wrapped up in my personal problems that I isolate myself from others at the college; M34—I often feel isolated when involved in student activities). Mattering Factor (M48—There are people on campus who are sad for me when I fail in something I set out to do; M53—People on campus are generally supportive of my individual needs; M54—There are people at the college who are genuinely interested in me as a person). Engagement/Involvement Factor (Q129—hours spent on campus activities; Q173_1—currently holding leadership role in the Associated Students organization or a club officer; Q134—hours per week spent volunteering; Q128—hours per week spent studying; and Q173_9—Scholars Program[honors] participation).

234
Figure 18. Standardized coefficients for Respecified Omnibus Second-Order CFA Model.
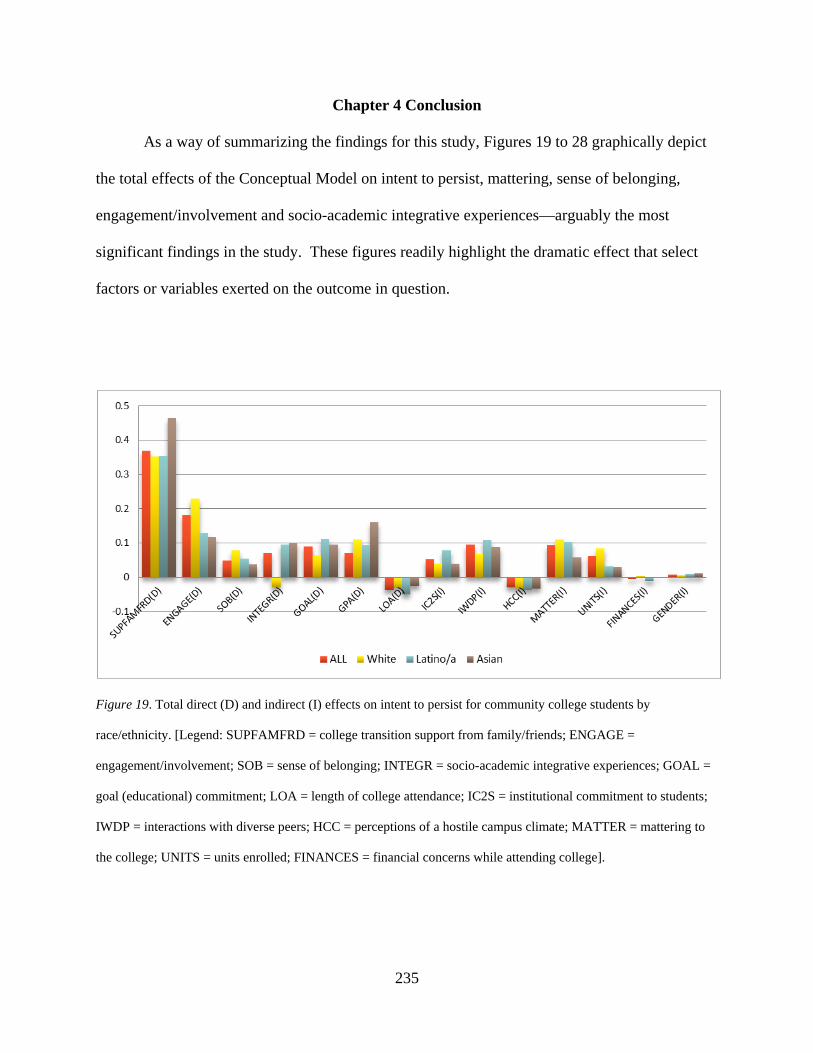
235
Chapter 4 Conclusion
As a way of summarizing the findings for this study, Figures 19 to 28 graphically depict
the total effects of the Conceptual Model on intent to persist, mattering, sense of belonging,
engagement/involvement and socio-academic integrative experiences—arguably the most
significant findings in the study. These figures readily highlight the dramatic effect that select
factors or variables exerted on the outcome in question.
Figure 19. Total direct (D) and indirect (I) effects on intent to persist for community college students by
race/ethnicity. [Legend: SUPFAMFRD = college transition support from family/friends; ENGAGE =
engagement/involvement; SOB = sense of belonging; INTEGR = socio-academic integrative experiences; GOAL =
goal (educational) commitment; LOA = length of college attendance; IC2S = institutional commitment to students;
IWDP = interactions with diverse peers; HCC = perceptions of a hostile campus climate; MATTER = mattering to
the college; UNITS = units enrolled; FINANCES = financial concerns while attending college].

236
a)
b)
c)
d)
Figure 20. Total direct (D) and indirect (I) effects on intent to persist for community college
students: (a) all students, (b) White, (c) Latino/a, (d) Asian. [Refer to Figure 19 for legend]
237
Figure 19 presents a summary of the effects of 14 variables on intent to persist for four
groups of students (all students in the study, White, Latino/a, and Asian). It may be observed
that the effect of support from family and friends was not only the largest across groups, but also
two-to-three times as large as the effect of any other variable. Figure 20 presents the same
information in isolation by individual racial/ethnic group.
Figures 21 and 22 graphically display the effects of four factors/variables on students
perceptions of mattering to the college. As may be readily noted, interactions with diverse peers
had the greatest impact on mattering for three student groups (all students, White, and Asian),
followed by institutional commitment to students. The opposite was true for Latino/a students;
that is, institutional commitment exerted a higher effect on mattering, albeit closely followed by
interactions with diverse peers. Figure 22 presents the same information in isolation by
individual racial/ethnic group.
Figure 21. Total direct and indirect (I) effects on mattering to college for community college students by
race/ethnicity. [Legend: IC2S = institutional commitment to students; IWDP = interactions with diverse peers;
SUPFAMFRD = college transition support from family/friends]

238
(a)
(b)
(c)
(d)
Figure 22. Total direct indirect (I) effects on mattering to college for community college students: (a) all students,
(b) White, (c) Latino/a, (d) Asian. [Legend: IC2S = institutional commitment to students; IWDP = interactions with
diverse peers; SUPFAMFRD = college transition support from family/friends]

239
With respect to sense of belonging, Figures 23 and 24 summarize the direct and indirect
effects of six factors/variables for students in the study. The largest effect on belonging was
perception of a hostile campus climate held by students; whereas, the largest positive effect was
perceived mattering to the college, closely followed by interactions with diverse peers. As may
be observed, Asian students were most affected by a hostile campus climate, and Latino students
by higher perceptions of mattering to the institution.
Figure 23. Total direct and indirect (I) effects on sense of belonging for community college students by
race/ethnicity. [Legend: IC2S = institutional commitment to students; IWDP = interactions with diverse peers;
HCC= hostile campus climate; MATTER = perceived mattering to the college; SUPFAMFRD = college transition
support from family/friends]

240
a)
b)
c)
d)
Figure 24. Total direct indirect (I) effects on sense of belonging for community college students: (a) all
students, (b) White, (c) Latino/a, (d) Asian. [Refer to Figure 23 for legend]

241
Continuing on to the effects of engagement/involvement, its direct and indirect effects are
depicted in Figures 25 and 26. Mattering exerted a higher effect on engagement/involvement for
Latino/a students. The effect on the outcome variable by mattering and number of units in which
students were enrolled at the time of the study was nearly identical for all students as a group and
for White students. For Asian students, the number of units enrolled exerted a higher direct
effect, albeit very closely followed by mattering.
Figure 25. Total direct and indirect (I) effects on engagement/involvement for community college students by
race/ethnicity. [Legend: MATTER = perceived mattering to the college; UNITS= units enrolled; LOA = length of
college attendance; IC2S = institutional commitment to students; IWDP = interactions with diverse peers;
SUPFAMFRD = college transition support from family/friends].

242
a)
b)
c)
d)
Figure 26. Total direct indirect (I) effects on engagement/involvement for community college students: (a)
all students, (b) White, (c) Latino/a, (d) Asian. [Refer to Figure 25 for legend]

243
Lastly, Figures 27 and 28 display a summary of the effects of five factors/variables on
socio-academic integrative experiences for community college students by race/ethnicity.
Interactions with diverse peers had the strongest direct effect—nearly twice as much as the next
factor—institutional commitment to students. The magnitude of the effect was nearly identical
for students as a whole; that is, regardless of race/ethnicity.
Figure 27. Total direct and indirect (I) effects on socio-academic integrative experiences for community college
students by race/ethnicity. [Legend: IC2S = institutional commitment to students; IWDP = interactions with diverse
peers; MATTER = perceived mattering to the college; SUPFAMFRD = college transition support from
family/friends]

244
a)
b)
c)
d)
Figure 28. Total direct indirect (I) effects on socio-academic integrative experiences for community college
students: (a) all students, (b) White, (c) Latino/a, (d) Asian. [Refer to Figure 27 for legend]
245
CHAPTER 5
CONCLUSIONS
Following a call to continue tease out the nuances associated with diverse college student
persistence and success, this study examined how factors such as institutional commitment to
students, mattering, sense of belonging, interactions with diverse peers, perceptions of the
campus climate, engagement/involvement, socio-academic integrative experiences, and goal
commitment collectively impact community college students’ intention to persist to degree
completion. Whereas much has been written independently about each of these areas in the
higher education literature, this study was the first to incorporate all these constructs into a single
conceptual framework, thus enabling the researcher to assess the multidimensional and complex
nature of persistence decisions for either two-year or four-year college students. As will be
noted below, this study broke ground on several fronts. It is the first in the literature to
empirically demonstrate a causal effect between institutional commitment to students and
perceptions of mattering and with sense of belonging. It is also the first to demonstrate that
mattering to the institution exerts a moderate to strong influence on community college students’
engagement/involvement, socio-academic integrative experiences, sense of belonging, and
indirectly on intent to persist. The study is also the first to present empirical evidence in support
of an omnibus “student development and success” construct alluded to by Wolf-Wendel, et al.
(2009) in their seminal work. Of import to these findings is that this construct explained a
significant proportion of the variance for engagement/involvement, belonging, mattering, and
interactions with diverse peers. The individual factors composing this omnibus construct were
also found to exert an independent effect on intent to persist.
246
The impetus for the study was the ongoing educational crisis facing the U.S.; namely, the
significant shortage of individuals holding college degrees (or career technical education
certificates) to adequately support the economic needs of the nation. It has been noted repeatedly
that the U.S. will experience a shortage of approximately 16 million degrees of the number
required to meet the country’s workforce needs of 2025 (Lumina Foundation for Education,
2010; National Center for Higher Education Management Systems and Jobs for the Future, 2007;
Organization for Economic Co-operation and Development, 2011; Santiago & Reindl, 2000).
Moreover, without these “credentialed” individuals, it is less likely that the U.S. will be able to
compete in a rapidly changing global economy as jobs go unfilled.
As was noted in Chapter 1, community colleges stand to play a significant role in
preparing students to join the workforce of tomorrow, by designing career/technical education
programs and services responsive to the national economy. That is, community colleges may
design short-term certificate programs or associate degree programs in areas of need and
subsequently train students for jobs requiring a college-level education. Community colleges
may also continue to promote their transfer mission (Cohen & Brawer, 2008) by preparing
students to join baccalaureate-granting institutions.
Concomitant to this degree shortage is the ongoing problem of college student
attrition/stopout. Statistics compiled by ACT (American College Testing, 2011) noted that the
national first-to-second year retention rate for public community colleges was 55.4%. Federal
statistics put this figure at 60% for full-time students and 40.1% for part-time students across the
nation (Snyder & Dillow, 2011). By contrast, the first-to-second year retention rate for students
at public four-year institutions was 73.3%. Furthermore, cross-institutional longitudinal studies
have shown that just over 20% of first-time, full-time degree-seeking students attending public
247
community colleges obtained an associate degree or certificate within 150% of the expected
"normal time," or three years (Snyder & Dillow, 2011). This percentage differed markedly by
race/ethnicity. This study, for example showed that non-resident alien, Asian, and White
students “graduated” at higher rates than Latino/a and Black students, suggesting that the factors
and dynamics leading to dropout/stopout impact students differently. But it is also likely that
practices and actions within institutional control—under the direct purview of community
colleges—may counteract the extent to which students stop attending college.
This study attempted to explore one potential means to address this degree/credential
shortcoming by examining how and to what degree, interactions between students and the
institution, and students and institutional agents are taking place and how they differ by
race/ethnicity. It was expected that such examination might uncover specific factors or practices
that may enhance the probability of community college students completing a degree/certificate.
It was noted in Chapter 2 that previous studies have attempted to do this by proposing and testing
a variety of college impact and persistence-based models, which have examined how factors
such as student background characteristics, finances, involvement, engagement, and integration
impact student retention. However, these models have not yet proven to be a panacea to the
completion agenda. Moreover, these models, have not yet examined purposefully the collective
impact of constructs such as those in this study to explain community college students’ intentions
to persist or actual persistence to degree completion. Thus, this study was the first of its kind to
have explored this shortcoming.
In reviewing the components characterizing the conceptual model presented in Figure 1,
one may ask if in fact the model is relevant to a community college population given that such
students have traditionally differed by background characteristics, degree aspirations, patterns of

248
attendance, etc. However, community colleges have varying educational missions, some of
which may be emphasized more than others in response to local community needs (Bragg, 2001;
Cohen & Brawer, 2008). Additionally, there are community colleges that have built their
reputations around attracting students interested in transferring to four-year institutions after
associate degree attainment or completion of lower-division coursework (Bahr, 2012; Gándara,
Alvarado, Driscoll, & Orfield, 2012). Recent statistics from the National Center for Education
Statistics have also shown that background characteristics between some community college
students and students attending open enrollment or least selective four-year institutions may in
fact not be very different—even with respect to remedial education enrollment (Sparks &
Malkus, 2013). Moreover, the line between who constitutes a community college student is
constantly being blurred by the “swirling” enrollment of students occurring especially in
urban/suburban areas (Borden, 2004; McCormick, 2003). Likewise, more and more “four-year
students” attend community colleges either while attending a university or because of finances
(etc.) they “reverse transfer” to community colleges (Hossler et al., 2012). Hence, it is argued
that the conceptual model for this study was relevant for this specific study. As noted in
Chapters 3 and 4, nearly 95% of the sample of students participating in this study expressed an
interest in transferring to a four-year institution. Thus, the elements of the model are all
applicable. The addition of two constructs, mattering and sense of belonging, were particularly
useful in explaining the dynamics leading to intent to persist, engagement/involvement, and
socio-academic integration. These two concepts have been acknowledged in the literature in
recent years as possibly accounting for the unique experiences of community college,
traditionally underrepresented, low income, and first-generation college students, especially with

249
respect to persistence and attrition decisions (Barnett, 2010, 2011; Rendón, 2002; Rendón
Linares & Muñoz, 2011; Tinto, 2012a; Wolf-Wendel et al., 2009).
Summary and Discussion of Findings
At the heart of the conceptual model for this study, was the proposition that perceived
institutional commitment to students directly or indirectly impacts student perceptions of
mattering, sense of belonging, institutional engagement/involvement, socio-academic integrative
experiences, goal (educational) commitment, and ultimately intent to persist. It was posited that
interactions with diverse peers and perceptions of a hostile campus climate and grade point
average might also influence persistence intentions. The conceptual model integrated several
control variables reported in the literature as influencing select college student outcomes. These
included length of attendance, enrollment intensity, financial concerns, gender, and supportive
family/friends. The study was specifically interested in examining structural differences in the
conceptual model by race/ethnicity—not with the goal of developing a “one-fits-all” underlying
structure, but to identify if students from various groups “understood” and experienced the above
constructs similarly or differently.
The study began by assessing the goodness-of-fit of a measurement model (Research
Question 1) consisting of seven factors (institutional commitment, perceptions of mattering,
sense of belonging, interactions with diverse peers, perceptions of a hostile campus climate,
institutional involvement/ engagement, and socio-academic integrative experiences). This
analysis resulted in the respecification of the measurement model, which in essence entailed the
elimination of several indicators that did not in fact adequately “represent” the factors.
The respecified measurement model was then subjected to a multiple group invariance
analysis for race/ethnicity (Research Question 1.1). Of import to the study was the invariance

250
analysis for White, Latino, Asian, Black and American Indian/Alaskan Native students.
However, given the small sample size for Black (N = 104) and American Indian/Alaskan Native
(N = 12) students the invariance analysis for these groups was not carried out, albeit these
students remained part of the whole group analyses (ALL students). In considering the
invariance analysis findings (and after post hoc adjustments), the measurement model was found
to be invariant across race/ethnic groups with respect to the configural, measurement, and
structural models. Results did suggest the latent means for the seven factors in the measurement
model differed slightly by race, but did not warrant either the exclusion of any group from the
study or prevent the comparison of groups in further analyses.
Following this, the underlying structure of the hypothesized conceptual model (as
depicted in Figure 1) was examined (Research Question 2). Factor indicators included in the
model were based on the respecified measurement model above. Moreover, five exogenous
(control variables), two endogenous, and one endogenous-outcome variables were all
incorporated into the structural model. After two post hoc respecifications, 14 of the original 36
hypothesized causal paths in the model were removed owning to non-significant regression
weights. The most significant path deletions from a theoretical standpoint were the paths from
engagement/involvement to integration, institutional commitment to goal commitment, and
integration to goal commitment (to be discussed below). Concomitantly, 13 regression paths not
specified a priori were added to the model—all theoretically justified and proven to better
account for the inter-relationships among latent variables with the outcome variable—intent to
persist. Other small adjustments (error covariances) were also made. Goodness-of-fit indices
indicated the above adjustments resulted in a good-fitting model.

251
Consistent with the multiple group invariance analysis for the measurement model, the
structural model underlying the conceptual model was examined (Research Question 2.1). The
equality of models was assessed for White, Latino/a, Asian and all students in the study as a
group (ALL=White, Latino/a, Asian, Black, American Indian/Alaskan Native, Other). Results
revealed that the structural model was clearly invariant between White and Latino/a students, but
one index of fit (i.e., CFI) suggested the structural model might differ somewhat for Asian
students. Carrying through with this examination, partial invariance for the measurement aspect
of the model between White and Asian students was found, albeit their configural and structural
models were equivalent. Upon further evaluation, it was decided that in moving to the
examination of direct, indirect, and total effects that several parameters in the measurement
model for Asian students would be freely estimated, albeit the structural model itself was
deemed race/ethnicity invariant.
Since the conceptual model incorporated several constructs reported in the literature as
impacting or mediating college students’ success and outcomes, a second-order confirmatory
factor analysis was conducted to determine if the constructs of engagement/involvement, sense
of belonging, mattering, perceptions of the campus climate, and diverse peer relationships might
form part of an omnibus construct (Research Question 4). Common among these constructs is
the fact that they are integrated into various college student success and persistence models,
college impact models, and are oftentimes conceptualized or defined similarly, yet are given
different names. Several goodness-of-fit indices supported the conclusion that the variance
associated with each of four constructs (diverse peer interactions, mattering, sense of belonging,
and engagement/involvement—but not hostile campus climate) could be explained by a second-
order omnibus factor. Despite their unique and divergent nature, it is possible the four constitute

252
what Wolf-Wendel et al. (2009) term a “student development and success” factor, and together
contribute toward our “understanding of the [student success] puzzle” (p. 426).
Lastly, the direct, indirect and total effects of the respecified conceptual model were
investigated. Five directional hypotheses were proposed (Research Question 3) on the expected
interrelationships among the constructs—positive or negative. The directional hypotheses were
partially supported by the respecified model. Given the invariant (or partially invariant) nature
of the conceptual model, comparisons across groups were deemed appropriate.
Conclusions drawn from the analysis of the five hypotheses include the following:
(1) Contrary to limited findings for four-year colleges (Hausmann et al., 2007), this study
did not find support for the hypothesized direct relationship from sense of belonging to intent to
persist for any racial/ethnic group.
(2) The posited, albeit hypothesized relationship between mattering and involvement and
mattering and persistence articulated by Schlossberg (1989) was partially supported. Until the
time of this study, this assertion had remained an empirical question to be addressed. Indeed,
mattering exerted a moderate to strong direct influence on community college student
engagement/involvement, socio-academic integrative experiences, sense of belonging, and
indirect effect on intent to persist. The relationship between mattering and sense of belonging is
consistent with previous research noting that academic validation, a related construct to
mattering, positively impacts community college students sense of “competent membership,” a
construct akin to sense of belonging thought to represent Tinto’s socio-academic integration
concepts (Barnett, 2006, 2010).
(3) Another key finding from the hypotheses was the role of engagement/involvement in
directly impacting socio-academic integrative experiences, sense of belonging, and intent to

253
persist (especially for White students and students as a whole, but not for Latino/as or Asians).
Of significance for this particular finding is that engagement/involvement, socio-academic
integrative experiences, and sense of belonging appear to be distinct constructs; supporting
previous positions expressed by leading proponents and researchers for these constructs (as noted
in Wolf-Wendel et al., 2009).
(4) Socio-academic integrative experiences accounted for a small portion of the variance
in intent to persist for all students as a whole, as well as for Asian students—but not significantly
for Latino/as or White students. This finding was significant particularly for Asian students
given that they held poor impressions of relationships with instructors and classroom-based
interactions with them (as demonstrated in the univariate analyses). Thus, it appears that actively
participating in socio-academic integrative experiences around positive instructor interactions
has real benefits for marginalized students—a finding consistent with the literature (Deil-Amen,
2011; Tinto, 2012a, 2012b). In light of previous criticisms in the literature that academic and
social integration “privilege students who best fit into the mainstream academic culture”
(Rendón, 2006, p. 4) and that these constructs poorly explain the experiences of impacted groups
with respect to persistence (Rendón et al., 2000; Tierney, 1992), the meaning of these findings is
not entirely clear. On the one hand, the low explanatory power of integration on intent to persist
could substantiate the criticism above. It could also be argued that Asian students might now be
part of the mainstream higher educational culture and thus the statistical significance between
integration and intent to persist could be expected. However, Asian students are by no means a
homogenous group. Moreover, the fact that socio-academic integrative experiences did not have
a statistically significant path loading with intent to persist for White students, questions the
generalization of the criticism above. It is very likely that individual campus cultures and the

254
degree to which specific student populations are represented, and are “seen” at those campuses
that may in fact influence how students partake in various aspects of socio-academic integration.
Recent findings from researchers have noted that classroom-based forms of socialization and
academic validation from instructors (in and outside the classroom) may in fact contribute to
community college student persistence (Barnett, 2006, 2010; Tinto, 2012a). This latter finding
approximates how socio-academic integrative experiences were measured in this study.
(5) Perceptions of a hostile campus climate had a strong negative effect on sense of
belonging for all students regardless of race/ethnicity, but particularly for Asian students. These
findings are fully consistent with the growing number of studies on sense of belonging, which
consistently report similar findings (Hausmann et al., 2007; Hausmann et al., 2009; Hurtado &
Carter, 1997; Locks et al., 2008; Nuñez, 2009; Saenz et al., 2007; Strayhorn, 2012). It should be
noted that this effect was also found for White students in this study.
(6) Interactions with diverse peers had a very strong direct effect on mattering and a
small to moderate effect on sense of belonging. Diverse peer interactions had the strongest effect
on White and Asian students’ sense of belonging. It exerted a greater influence on
engagement/involvement for Latino/as; and on socio-academic integration for all students,
regardless of race—again questioning the generalized criticism of integration in the literature.
Although, it is also acknowledged that positive interactions with diverse peers exercises a
compensatory effect on measures of the college environment, which might otherwise be judged
as privileging one group over another (Rendón, 2006).
Additional and important findings from the examination of the direct, indirect, and total
effects explained by the conceptual model are now highlighted. Several of these empirical
findings are reported for the first time in the literature.

255
(7) The total variance associated with intent to persist for the respecified conceptual
model was similar across three racial/ethnic groups, and significantly higher for one: ALL = .21,
White = .21, Latino/a = .19, and Asian = .28. This suggests that the conceptual model explains
Asian students’ experiences better than for other students. In fact, two factors appear to have
played a greater role in explaining the total effects for Asian students: higher levels of support
from family/friends and higher grade point averages. The findings for GPA are consistent with
previous studies reporting that Asian students achieve higher GPAs even after controlling for
background characteristics and high school GPA (Dennis, Phinney, & Chuateco, 2005). The
direct and indirect effects on intent to persist are graphically depicted in Figures 19 and 20 (at the
conclusion of Chapter 4).
(8) With respect to intent to persist, transition support from family and friends exerted the
highest (and direct) degree of influence on intent to persist across all racial/ethnic groups;
reinforcing the crucial role that strong support from family and friends plays in facilitating
college transition and adjustment (Allen & Nora, 1995; Cabrera et al., 1992a; Hurtado & Carter,
1997; Nora et al., 2005; Nora & Cabrera, 1993; Rendón et al., 2000; Strauss & Volkwein, 2004;
Torres, 2006). As suggested in the retention literature, the direct effect of goal commitment on
intent to persist was significant for all students as a whole, Latino/as, and Asian students. GPA
was also correlated with persistence intentions for all student groups, but not for Latino/as,
suggesting that no matter their performance in college Latino/as intend to carry through in their
commitment to earn a degree (Tovar & Simon, 2006). Engagement/involvement in
educationally purposeful and co-curricular activities directly and positively impacted intent to
persist for White students and all students as a group. This finding is generally consistent with
findings from four-year studies (Kuh et al., 2008) and at least one other community college-

256
based study (McClenney & Marti, 2006) noting the complete or near absence of compensatory
effects with respect to engagement/persistence with ethnic minority students, especially
Latino/as. Socio-academic integrative experiences—generally consisting of perceived instructor
availability and support—was a positive factor on persistence for all students as a group and
Asian students. Length of college attendance exerted a negative impact on persistence intentions
for students as a whole and White students, but as noted previously, it did not have a significant
influence for Latino/a and Asian students. Lastly, with respect to the outcome variable in the
conceptual model—intent to persist—it was hypothesized that sense of belonging would
positively impact persistence intentions. However, no direct effects were present for any student
group. The magnitude of the total effects for belonging on persistence did reach statistical
significance for White students, indicating that sense of belonging had a small total effect on the
outcome variable. This last finding, while disappointing, does suggest that other factors play a
more significant role on intentions to persist. However, this study cannot in any way ascertain
that a direct/indirect effect of belonging on actual persistence does not exist. As noted elsewhere
in this manuscript, the literature on sense of belonging is relatively new and the available studies
have primarily used this variable as an outcome variable (e.g., Hurtado & Carter, 1997; Nuñez,
2009; Strayhorn, 2008). Only one four-year study has examined thus far the effect of sense of
belonging for African American and White students on second year persistence (Hausmann et
al., 2009).
(9) With respect to perceptions of mattering to the college, this study was the first to
examine the impact of institutional commitment to students, interactions with diverse peers and
transition support from family and friends on mattering—all of which exerted positive, moderate
to strong direct effects. Diverse interactions with peers and transition support from

257
family/friends were also found to indirectly influence perceptions of mattering to a greater
degree for Latino/as. This study is the first that empirically demonstrates the causal nature
between institutional commitment and student perceptions of mattering. This finding lends
support to Tinto’s (1993) contention that institutional commitment communicates to students an
“ethic of care” on part of the institution, which in turn may exert an influence on student success
and persistence. The direct and indirect effects of mattering to the college are graphically
depicted in Figures 21 and 22 (at the conclusion of Chapter 4).
(10) This study is also the first to report the causal effect of mattering on belonging,
whereas others have only theorized it (Strayhorn, 2012). This effect was found across all
racial/ethnic groups, but it was strongest for Latino/as. Also of great significance and not
previously reported in the literature is the finding that institutional commitment to students and
interactions with diverse peers counteract the effects that a perceived hostile campus climate has
on students’ sense of belonging at the institution. This is the first community college study to
empirically demonstrate such relationship. The direct and indirect effects of sense of belonging
are graphically depicted in Figures 23 and 24 (at the conclusion of Chapter 4).
(11) Also significant to the study was the finding of mattering exerting a direct effect on
engagement/involvement, and a moderating effect between institutional commitment and
engagement especially Latino/a students. While this relationship had been implied in previous
studies (France & Finney, 2009; Schlossberg, 1989; Strayhorn, 2012), this study provides the
empirical evidence to substantiate the causal relationship. The direct and indirect effects on
intent to persist are graphically depicted in Figures 25 and 26 (at the conclusion of Chapter 4).
(12) While the role of socio-academic integrative experiences on intent to persist was
small, the role of institutional commitment to students, interactions with diverse peers,

258
perceptions of mattering, and transition support from family/friends on socio-academic
integration cannot be overstated, as they were all significant factors across all racial/ethnic
groups. Although, institutional commitment to students appears to exert a higher effect for
Latino/as, while mattering enhanced White students’ integrative experiences. The direct and
indirect effects of socio-academic integrative experiences are graphically depicted in Figures 27
and 28 (at the conclusion of Chapter 4).
(13) While it was expected that institutional commitment to students would exert a direct
positive effect on goal commitment and intent to persist, no direct link was evidenced in this
study. However, institutional commitment to students appears to play a significant, albeit
indirect role in influencing student participation in the social and academic communities of the
college—regardless of race/ethnicity, but it is especially compensatory for Asian and Latino/as.
This study was the first to investigate the influence of institutional commitment to students on a
community college population.
(14) Gender was found to influence several key factors leading to intent to persist. A
small significant negative path from gender to sense of belonging was found for all students as a
group and for Asian students, but not for Latino/as or White students. This finding suggested
that males experienced lower perceptions of belonging to the institution. Gender also influenced
interactions with diverse peers, albeit to a small degree, for all students, White students, and
Asian, but not Latino/a students. With respect to the total effects in the model, gender appeared
to impact perceptions of mattering significantly more for Asian students (favoring females), but
slightly less for other race/ethnic groups. In reference to pattern of attendance; that is, the
number of units in which students were enrolled at the time the study was conducted, exercised a
positive impact on engagement/involvement across the board—significantly higher for all

259
students as a group and for White students, but less so for Latinos/as and Asians. Number of
units enrolled also had a small, positive, and significant total effect on intent to persist for all
students and White students only, on GPA for all students, and on goal commitment for all
groups.
Rearticulation of Conceptual Model Propositions on Intent to Persist
Given the above findings and consistent with the respecification of the Conceptual
Model, a revision of its propositions is in order. Accordingly, the following revised propositions
are offered:
At the heart of the model, is the proposition that perceived institutional commitment to
students directly or indirectly impacts student perceptions of mattering, sense of belonging,
institutional engagement/involvement, socio-academic integrative experiences, goal
(educational) commitment, and ultimately intent to persist. The model further contends that:
a) Institutional commitment to students is demonstrated in the actions taken by the college
to facilitate college transition and adjustment. This is further shown by actions and
behaviors exhibited by institutional agents such as instructors and counselors in their
ongoing interactions with students that facilitate student development in a positive
learning environment. Institutional commitment will in turn directly influence student
perceptions of mattering to the college, sense of belonging, and socio-academic
integrative experiences.
b) To the degree that students perceive a high level of institutional commitment, and have
positive relationships with racially/ethnically diverse peers characterized as close,
supportive, and available, their sense of belonging to the institution will be enhanced.
Perceiving the campus climate as hostile owning to personal characteristics (i.e., gender,

260
race/ethnicity, sexual orientation, age) that result in feelings of alienation will
deleteriously affect sense of belonging. A positive sense of belonging has the potential
to exert influence on grades.
c) Perceptions of mattering to the college will be directly influenced by institutional
commitment to students and by positive interactions with diverse peers. In turn,
perceptions of mattering to the institution will enhance students’ sense of belonging, and
facilitate engagement/involvement, and socio-academic integration, and ultimately intent
to persist.
d) Student involvement in campus activities and engagement in educationally beneficial
activities promoting leadership skill development, community service, and academically
rigorous activities will wield a direct influence on grades, goal commitment, and intent
to persist.
e) Socio-academic integrative experiences characterized by informal and supportive
interactions with institutional agents—especially instructors—will directly and
positively impact student’s intentions to persist. Integrative experiences will be partially
influenced by the support students receive from family/friends, by perceived mattering to
the institution, and institutional commitment to students.
f) Perceived mattering to the college, sense of belonging to the institution,
engagement/involvement in educationally beneficial activities, socio-academic
integrative experiences, goal commitment, and grades will all directly influence student
intent to persist.

261
Implications for Theory
Findings from this study both support and question theoretical tenets about the impact of
institutional commitment to students, socio-academic integration, and sense of belonging as
directly impacting persistence. Of course, in this study, actual persistence to degree completion
was not examined. Instead, community college students’ intentions to persist served as the
outcome variable. Thus, the extent to which these findings support or contradict theory, are
likely relevant to student intentions only.
The best known and tested model on student persistence is Tinto’s longitudinal model of
institutional departure (Tinto, 1975, 1987, 1993). In this model, he asserted that institutional
commitment to students plays a significant role in reinforcing students’ intentions and
commitments (e.g., commitment to the institution), and persistence decisions. Findings from this
study did not support a direct link between institutional commitment to students and persistence
intentions for community college students of any race/ethnicity; nor did it directly influence goal
commitments. However, this study highlighted the significant role that institutional commitment
exerts on factors such as perceptions of mattering, student engagement/involvement in
educationally beneficial activities, sense of belonging, and socio-academic integrative
experiences. Institutional commitment to students was particularly important for Latino/as
across several intermediate outcome variables including engagement, mattering, sense of
belonging to the institution, and integrative experiences.
The perceived value of academic and social integration in explaining student persistence
continues to ensue; although there is a growing recognition that academic integration—as
traditionally measured—cannot sufficiently explain whether a student remains or drops out of
college (Berger & Braxton, 1998; Braxton, 1999; Braxton & Hirschy, 2005; Braxton et al., 1997;

262
Kraemer, 1997; Tinto, 2006, 2012a). Critics have rightly argued that integration as a construct
holds little to no value, and is unfair, for traditionally underrepresented college students, low
income, and first generation college students (Hurtado & Carter, 1997; Rendón et al., 2000;
Tierney, 1992). Researchers have now begun to move away from traditional notions of
academic/social integration. They now emphasize that “socio-academic integrative moments”
(Deil-Amen, 2011) occur throughout the campus, but especially through informal interactions
between students and institutional agents—namely instructors. There is also a growing
recognition that socio-academic integrative experiences occur in the classroom itself, largely
facilitated by active learning pedagogies, and group-based activities conceptualized by
instructors where students of diverse backgrounds interact with one another (Tinto, 2012a). This
study both supports and contradicts the notion that integrative experiences directly influence
intentions to persist. Results from the study supported the value of this construct for all students
as a group and for Asian students, but not for White or Latino/a students. However, direct path
coefficients in the model were relatively small. The finding for all students could be a statistical
artifact owning to the large sample size, however. As noted previously, it could also be that
integrative experiences do privilege some students over others (Rendón, 2006)—perhaps those
privileged from having had parents who attended college or whom otherwise possess higher
levels of cultural and social capital (Lareau, 2003; Nora, 2004; Stanton-Salazar, 1997), and thus
know how college works. Despite the lack of “sufficient” evidence in this study to truly validate
the integration-persistence intentions link, the findings do point out that impacted groups such as
Latino/as could still draw benefits from socio-academic integrative experiences; albeit, this
appears to be the case only if they perceive high levels of institutional commitment toward them
and can draw on the support from family/friends.

263
This study also investigated if sense of belonging to the institution could explain the
variance associated with intention to persist for community college students. Theoretical work
suggests that belonging should influence intentions to persist and actual persistence (Hurtado &
Carter, 1997; Tinto, 2012a), and at least two studies with four-year college students have found
support for this relationship (Hausmann et al., 2007; Hausmann et al., 2009). However, the
present study did not find such support. It is unclear from these findings if sense of belonging
truly lacks value for community college students’ persistence intentions, or if in fact, it exercises
a direct link to actual persistence. Unfortunately, this could not be examined in this study. It
could also be that assessing students’ general sense of belonging to the institution is not
sufficient. My previous work and those of others suggest that sense of belonging may be
multidimensional and context/object-specific (Hoffman et al., 2002; Tovar & Simon, 2010).
Hence, future research should explore this possibility.
Implications for Research & Limitations
With respect to implications for research, it is crucial that the validity of the conceptual
model be studied with a variety of community colleges, especially since their educational
missions and values differ. Whereas, the college where data was gathered had a dominant
transfer-focus, results for institutions with a strong CTE mission and programs, may find this
model not as useful. Future research should also investigate the applicability of the model to
four-year students, across institutional types.
As noted throughout, this study focused on assessing community college students’
intentions to persist. Moving forward, it will be important to test the conceptual model by
integrating longitudinal data, including actual persistence to degree completion indicators.
Focusing on urban community colleges, this might be accomplished by examining centralized

264
databases often held by statewide community college agencies, such as the California
Community Colleges Chancellor’s Office, where enrollment data for students attending
community colleges in the state are maintained. Moving this to a national level, it may be
possible to track participating students’ progression to degree completion through the National
Student Clearinghouse. This is especially important given the “swirling” nature of community
college student attendance.
On the methodological front, and before validating the conceptual model with other
institutions, it is highly recommended that “better” measures for engagement/involvement and
socio-academic integrative experiences that are reflective of community colleges and of
community college students are developed. Moreover, it will be important to collect sufficient
data for various student groups, including Black and American Indian/Alaskan Native students,
who were significantly underrepresented in this study, thus preventing the validation of the
conceptual model on them. The model’s applicability could also be assessed with an
international student (student visa) population. However, it will be important to integrate
measures of acculturation and adjustment in the validation process. Lastly, it is also
recommended that multiple group invariance analyses for the underlying structural framework of
the model for gender, socio-economic status, residency status, age, etc., be conducted. This
study only focused on race/ethnicity. Unfortunately, it is too common in higher education that
invariance analyses for college impact models and college persistence models are simply not
conducted. A review of the leading higher education journals will readily point this out.
Implications for Practice
Examining the total effects of various constructs and variables in the conceptual model
tested in this study—and as noted in the findings above—one will note that college transition

265
support from family and friends was the single factor that had the highest impact on intent to
persist for community college students, followed by engagement/involvement in educationally
beneficial activities—curricular and co-curricular. Interactions with diverse peers, institutional
commitment to students, and perceptions of mattering to the institution directly and indirectly
contributed to several intermediate outcomes (sense of belonging and socio-academic integrative
experiences), as well as intent to persist for most student groups. Given these findings and the
complex nature of the relationships associated with the factors examined in this study, it appears
that key to the success of community college students is first and foremost, the support of family
and friends. As such, community college administrators and counselors should actively integrate
specific ideas into their college orientation programs on how family and friends could be
involved in students’ education. These ideas could be disseminated as part of comprehensive
parent/significant other orientations or workshops; or in semi-formal family/friends mentoring or
academic coaching programs where college personnel teach “coaches” strategies to support their
student during key transition periods. Such a program is currently being piloted at a small scale
at Cerritos College in California, and is in the planning stages with several thousand students at
Santa Monica College.
Additionally, since institutional commitment to students, mattering, and interactions with
diverse peers play such an important role across intermediate college outcomes, there exists an
opportunity for community colleges to “exploit” the impact of these constructs in students’
academic lives. Given the nature of mattering and institutional commitment to students, it seems
that instituting cost-neutral or relatively inexpensive trainings/workshops for faculty, counselors,
and other college personnel could exercise high benefits for both the student and the institution.
Such trainings could emphasize the importance of agent-student relationships in college

266
progression and adjustment. The notion of creating and sustaining a supportive, welcoming
college and classroom environment where students feel genuinely valued and important, where
their needs are recognized, where faculty and staff outreach directly to them to discuss their
accomplishments or offer support as they experience difficulties, should be emphasized.
Moreover, as institutional agents, instructors and counselors alike can influence how
students socialize at the college, how and to what degree they are exposed to other diverse
students, and to resources supporting their success. As protective agents, instructors and
counselors serve as conduits to college-related information of various forms, particularly during
key “pivotal moments” in the college-planning process (Espinoza, 2007; Lundberg & Schreiner,
2004; Museus, 2010; Santos Laanan, 2003). Consistent with previous studies and given the very
nature of the community college system, it is often difficult for students to form relationships
with instructors—relationships that could prove essential to their success. Thus, community
college administrators and faculty must make a concerted effort to design strategies to reach-out
to students within the very places they are found, namely the classroom. More and more, there is
a growing recognition that faculty must facilitate engagement/involvement in the classroom, and
this need not always be formal in nature (Tinto, 2012a).
Conclusion
Drawing from this study and the literature, the success of community college students in
general, and of marginalized students in particular, is influenced by the availability of resources
to support their transition and adjustment to college. This includes systematic, purposeful, and
informal agent-student interactions. According to Deil-Amen (2011), marginalized populations
will successfully navigate the cultural, psychosocial, and the intellectual realms of the college
experience when they are adequately supported by institutional agents. This in turn, will

267
facilitate students’ perceptions that the college is committed to their success, that they matter to
the institution, and that they belong. Ultimately, these perceptions will likely exert an influence
on students’ decisions to remain or depart the institution.
268
References
Adelman, C. (2006). The toolbox revisited: Paths to degree completion from high school through
college. Washington, DC: U.S. Department of Education.
Akin, S. R. (2009). What does the Community College Survey of Student Engagement (CCSSE)
have to do with learning? Community College Journal of Research and Practice, 33(8),
615-617.
Allen, D., & Nora, A. (1995). An empirical examination of the construct validity of goal
commitment in the persistence process. Research in Higher Education, 36(5), 509-533.
Allison, L. M. (1999). The impact of interative experiences on persistence: A study of non-
traditional students., Unpublished doctoral dissertation, University of Muichigan.
Almanac of Higher Education 2011. (2011). Enrollment by race of students and type of
institution. The Chronicle of Higher Education.
http://chronicle.com.ccl.idm.oclc.org/article/Enrollment-by-Race-of-Students/128616/
American College Testing. (2011). National collegiate retention and persistence to degree rates.
http://www.act.org/research/policymakers/reports/graduation.html
Anant, S. S. (1966). The need to belong. Canada’s Mental Health, 14, 21-27.
Arbuckle, J. L. (2011). IBM® SPSS® Amos™ 20 User’s Guide. Chicago, IL: IBM Software
Group.
Astin, A. W. (1971). Predicting academic performance in college: Selectivity data for 2300
American colleges. New York: The Free Press.
Astin, A. W. (1984). Student involvement: A developmental theory for higher education. Journal
of college student personnel, 25(4), 297-308.
269
Astin, A. W. (1991a). Assessment for excellence: The philosophy and practice of assessment and
evaluation in higher education. Phoenix, AZ: Oryx Press.
Astin, A. W. (1991b). A conceptual model for assessment Assessment for excellence: The
philosophy and practice of assessment and evaluation in higher education (pp. 16-37).
New York: American Council on Education.
Astin, A. W. (1993). What matters in college: Four critical years revisited. San Francisco:
Jossey-Bass.
Astin, A. W. (1999). Student involvement: A developmental theory for higher education. Journal
of College Student Development, 40(5), 518-529.
Attewell, P., Lavin, D., Domina, T., & Levey, T. (2006). New evidence on college remediation.
Journal of Higher Education, 886-924.
Bahr, P. R. (2012). Classifying community colleges based on students’ patterns of use. Research
in Higher Education, 1-28. doi: 10.1007/s11162-012-9272-5
Bailey, T. R., & Alfonso, M. (2005). Paths to persistence: An analysis of research on program
effectiveness at community colleges. Lumina Foundation for Education New Agenda
Series, 6(1).
Bailey, T. R., Jeong, D. W., & Cho, S.-W. (2010). Referral, enrollment, and completion in
developmental education sequences in community colleges. Economics of Education
Review, 29(2), 255-270. doi: 10.1016/j.econedurev.2009.09.002
Balog, S. E., & Search, S. P. (2006). Using CCSSE in planning for quality enhancement. New
Directions for Community Colleges, 2006(134), 57-65.
Barnett, E. A. (2006). Validation experiences and persistence among urban community college
students. (University of Illinois at Urbana-Champaign Ph.D.), University of Illinois at

270
Urbana-Champaign, United States -- Illinois. Retrieved from
http://ezproxy.libraries.claremont.edu/login?url=http://search.proquest.com/docview/305
328452?accountid=10141 ProQuest Dissertations & Theses (PQDT) database.
Barnett, E. A. (2010). Validation experiences and persistence among community college
students. The Review of Higher Education, 34(2), 193-230.
Barnett, E. A. (2011). Faculty validation and persistence among nontraditional community
college students. Enrollment Management Journal: Student Access, Finance, and Success
in Higher Education, 5(2), 97-119.
Baumeister, R. F., & Leary, M. R. (1995). The need to belong: Desire for interpersonal
attachments as a fundamental human motivation. Psychological bulletin, 117(3), 497-
529.
Bean, J. P. (1980). Dropouts and turnover: The synthesis and test of a causal model of student
attrition. Research in Higher Education, 12(2), 155-187. doi: 10.1007/bf00976194
Bean, J. P. (1982). Student attrition, intentions, and confidence. New Directions for Higher
Education, 17, 291-320.
Bean, J. P. (1985). Interaction effects based on class level in an explanatory model of college
student dropout syndrome. American Educational Research Journal, 22(1), 35-64.
Bean, J. P., & Eaton, S. B. (2000). A psychological model of college student retention. In J. M.
Braxton (Ed.), Reworking the student departure puzzle (pp. 48-61). Nashville, TN:
Vanderbilt University Press.
Bean, J. P., & Metzner, B. S. (1985). A conceptual model of nontraditional undergraduate
student attrition. Review of educational research, 55(4), 485-540. doi:
10.3102/00346543055004485

271
Bensimon, E. M. (2006). Presidential address: The underestimated significance of practitioner
knowledge in the scholarship on student success. Paper presented at the Association for
the Study of Higher Education, Anaheim, CA.
Bensimon, E. M. (2007). The underestimated significance of practitioner knowledge in the
scholarship on student success. The Review of Higher Education, 30(4), 441-469.
Berger, J. B., & Braxton, J. M. (1998). Revising Tinto's interactionalist theory of student
departure through theory elaboration: Examining the role of organizational attributes in
the persistence process. Research in Higher Education, 39(2), 103-119. doi:
10.1023/a:1018760513769
Berger, J. B., & Milem, J. F. (1999). The role of student involvement and perceptions of
integration in a causal model of student persistence. Research in Higher Education,
40(6), 641-664.
Berger, J. B., Ramirez, G. B., & Lyon, S. (2012). Past to present: A historical look at retention.
In A. Seidman (Ed.), College student retention: Formula for student success (2nd ed., pp.
7-34). Lanham, MD: RowMan & Littlefield.
Bers, T. H., & Smith, K. E. (1991). Persistence of community college students: The influence of
student intent and academic and social integration. Research in Higher Education, 32(5),
539-556. doi: 10.1007/bf00992627
Betts, J. R., & McFarland, L. L. (1995). Safe port in a storm: The impact of labor market
conditions on community college enrollments. Journal of Human Resources, 30(4), 741–
765.
Bollen, K. A., & Hoyle, R. H. (1990). Perceived cohesion: A conceptual and empirical
examination. Social Forces, 69, 479-504.
272
Borden, V. M. H. (2004). Accommodating student swirl: When traditionl students are no longer
the tradition. Change: The Magazine of Higher Learning, 36(2), 10-17.
Bragg, D. D. (2001). Community college access, mission, and outcomes: Considering intriguing
intersections and challenges. Peabody Journal of Education, 76(1), 93-116. doi:
10.1207/S15327930PJE7601_06
Braxton, J. M. (1999). Theory elaboration and research and development: Toward a fuller
understanding of college student retention. Journal of College Student Retention, 1(2),
93-97.
Braxton, J. M., & Hirschy, A. S. (2005). Theoretical developments in the study of college
student departure. In A. Seidman (Ed.), College student retention: Formula for student
success (pp. 61-87). Westport, CT: Praeger.
Braxton, J. M., Hirschy, A. S., & McClendon, S. A. (2004). Special issue: Understanding and
reducing college student departure (Vol. 30).
Braxton, J. M., Jones, W. A., Hirschy, A. S., & Hartley Iii, H. V. (2008). The role of active
learning in college student persistence. New directions for teaching and learning,
2008(115), 71-83. doi: 10.1002/tl.326
Braxton, J. M., & Lien, L. A. (2000). The viability of academic integration as a central construct
in Tinto’s interactionalist theory of college student departure. In J. M. Braxton (Ed.),
Reworking the student departure puzzle (pp. 11-28). Nashville, TN: Vanderbilt
University Press.
Braxton, J. M., & McClendon, S. A. (2001). The fostering of social integration and retention
through institutional practice. Journal of College Student Retention: Research, Theory &
Practice, 3(1), 57-71.

273
Braxton, J. M., Sullivan, A. S., & Johnson, R. M. (1997). Appraising Tinto's theory of college
student departure. In J. C. Smart (Ed.), Higher Education: A Handbook of Theory and
Research (Vol. 12, pp. 107-164). New York: Agathon Press.
Butcher, J. L. (1997). Involvement and persistence: Nontraditional student perceptions of the
student-college relationship. West Virginia University.
Byrne, B. M. (2010). Structural equation modeling with AMOS: Basic concepts, applications,
and programming (2nd ed.). New York: Routledge.
Cabrera, A. F., Burkum, K. R., La Nasa, S. M., & Bibo, E. W. (2012). Pathways to a four-year
degree: Determinants of degree completion among socioeconomically disadvantaged
students. In A. Seidman (Ed.), College student retention: Formula for student success
(2nd ed., pp. 167-210). Lanham, MD: RowMan & Littlefield.
Cabrera, A. F., Castaneda, M. B., Nora, A., & Hengstler, D. (1992a). The convergence between
two theories of college persistence. The Journal of Higher Education, 63(2), 143-164.
Cabrera, A. F., Nora, A., & Castaneda, M. B. (1993). College persistence: Structural equations
modeling test of an integrated model of student retention. Journal of Higher Education,
64(2), 123-139.
Cabrera, A. F., Nora, A., & Castañeda, M. B. (1992b). The role of finances in the persistence
process: A structural model. Research in Higher Education, 33(5), 571-593. doi:
10.1007/BF00973759
Campbell, C. M., & Cabrera, A. F. (2011). How sound is NSSE?: Investigating the psychometric
properties of NSSE at a public, research-extensive institution. The Review of Higher
Education, 35(1), 77-103.

274
Cejda, B. D., & Hoover, R. E. (2010). Strategies for faculty-student engagement: How
community college faculty engage Latino students. Journal of College Student Retention:
Research, Theory and Practice, 12(2), 135-153.
Center for Community College Student Engagement. (2012). A matter of degrees: Promising
practices for community college student success (a first look). Austin, TX: The
University of Texas at Austin, Community College Leadership Program.
Chen, R., & DesJardins, S. L. (2010). Investigating the impact of financial aid on student dropout
risks: Racial and ethnic differences. The Journal of Higher Education, 81(2), 179-208.
Cheung, G. W., & Rensvold, R. B. (2002). Evaluating goodness-of-fit indexes for testing
measurement invariance. Structural Equation Modeling, 9(2), 233-255.
Chickering, A. W., & Gamson, Z. F. (1987). Seven principles for good practice in undegraduate
education. AAHE Bulletin, 39, 3-7.
Clark, L. (2012). When nontraditional is traditional: A faculty dialogue with graduating
community college students about persistence. Community College Journal of Research
and Practice, 36(7), 511-519.
Cohen, A. M., & Brawer, F. B. (2008). The American community college. San Francisco, CA:
Jossey-Bass Publisher.
Connolly, K. M., & Myers, J. E. (2003). Wellness and mattering: the role of holistic factors in
job satisfaction. Journal of Employment Counseling, 40(4), 152-160.
Corbière, M., & Amundson, N. E. (2007). Perceptions of the ways of mattering by people with
mental illness. Career Development Quarterly, 56(2), 141-149.

275
Crisp, G., & Mina, L. (2012). The community college: Retention trends and issues. In A.
Seidman (Ed.), College student retention: Formula for student success (2nd ed., pp. 147-
166). Lanham, MD: RowMan & Littlefield.
Crisp, G., & Nora, A. (2010). Hispanic student success: Factors influencing the persistence and
transfer decisions of Latino community college students enrolled in developmental
education. Research in Higher Education, 51(2), 175-194. doi: 10.1007/s11162-009-
9151-x
Crockett, D. S. (1999). Building and developing an effective enrollment management plan for
two-year colleges. Paper presented at the National Conference on Student Retention, San
Francisco, CA.
DeForge, B. R., Belcher, J., O'Rourke, M., & Lindsey, M. (2008). Personal resources and
homelessness in early life: Predictors of depression in consumers of homeless
multiservice centers. Journal of Loss and Trauma, 13(2-3), 222.
Deil-Amen, R. (2011). Socio-academic integrative moments: Rethinking academic and social
integration among two-year college students in career-related programs. The Journal of
Higher Education, 82(1), 54-91.
Dennis, J. M., Phinney, J. S., & Chuateco, L. I. (2005). The role of motivation, parental support,
and peer support in the academic success of ethnic minority first-generation college
students. Journal of College Student Development, 46(3), 223-236.
Dimitrov, D. M. (2010). Testing for factorial invariance in the context of construct validation.
Measurement and Evaluation in Counseling and Development, 43(2), 121-149. doi:
10.1177/0748175610373459

276
Dixon-Rayle, A. L. (2005). Adolescent gender differences in mattering and wellness. Journal of
Adolescence, 28(6), 753-763.
Dixon-Rayle, A. L. (2006). Mattering to others: Implications for the counseling relationship.
Journal of Counseling & Development, 84(4), 483-487.
Dixon-Rayle, A. L., & Chung, K.-Y. (2007). Revisiting first-year college students' mattering:
Social support, academic stress, and the mattering experience. Journal of College Student
Retention: Research, Theory and Practice, 9(1), 21-37. doi: 10.2190/x126-5606-4g36-
8132
Dixon-Rayle, A. L., & Myers, J. E. (2004). Counseling adolescents toward wellness: The roles of
ethnic identity, acculturation, and mattering. Professional School Counseling, 8(1), 81-
90.
Dixon, A. L., Scheidegger, C., & McWhirter, J. J. (2009). The adolescent mattering experience:
Gender variations in perceived mattering, anxiety, and depression. Journal of Counseling
& Development, 87(3), 302-310.
Dixon, A. L., & Tucker, C. (2008). Every student matters: Enhancing strengths-based school
counseling through the application of mattering. Professional School Counseling, 12(2),
123-126.
Dixon, S. K., & Kurpius, S. E. R. (2008). Depression and college stress among university
undergraduates: Do mattering and self-esteem make a difference? Journal of College
Student Development, 49(5), 412-424.
Dowd, A. C., Sawatzky, M., & Korn, R. (2011). Theoretical foundations and a research agenda
to validate measures of intercultural effort. The Review of Higher Education, 35(1), 17-
44.

277
Durkheim, E. (1951). Suicide. Translated by John A. Spaulding and George Simpson. Glencoe:
The Free Press. Originally published as Le suicide: Etude de sociologie. Paris: Feliz
Alcane, 1897.
Efron, B. (1988). Bootstrap confidence intervals: Good or bad? Psychological bulletin, 104, 293-
296.
Elliott, G. C. (2009). Family matters: The importance of mattering to family in adolescence.
Oxford, U.K.: Wiley-Blackwell.
Elliott, G. C., Colangelo, M. F., & Gelles, R. J. (2005). Mattering and suicide ideation:
Establishing and elaborating a relationship. Social Psychology Quarterly, 68(3), 223-238.
Elliott, G. C., Kao, S., & Grant, A. M. (2004). Mattering: Empirical validation of a social-
psychological concept. Self & Identity, 3(4), 339-354.
Espinoza, R. M. (2007). Pivotal moments: Overcoming class and racial-ethnic disadvantage in
women's doctoral education. (Ph.D. 3275409), University of California, Berkeley, United
States -- California. Retrieved from
http://ccl.idm.oclc.org/login?url=http://search.proquest.com/docview/304900001?account
id=10141 ProQuest Dissertations & Theses (PQDT) database.
Feldman, M. J. (1993). Factors associated with one-year retention in a community college.
Research in Higher Education, 34(4), 503-512.
Field, A. (2009). Discovering Statistics Using SPSS (3rd ed.). Thousand Oaks, CA: Sage.
France, M. K. (2011). Introducing the Unified Measure of University Mattering: Instrument
development and evidence of the structural integrity of scores for transfer and native
students. (Ph.D. 3453711), James Madison University, United States -- Virginia.
Retrieved from
278
http://ccl.idm.oclc.org/login?url=http://search.proquest.com.ccl.idm.oclc.org/docview/86
8185979?accountid=10141 ProQuest Dissertations & Theses (PQDT) database.
France, M. K., & Finney, S. J. (2009). What matters in the measurement of mattering?: A
construct validity study. Measurement & Evaluation in Counseling & Development,
42(2), 104-120.
France, M. K., & Finney, S. J. (2010). Conceptualization and utility of university mattering: A
construct validity study. Measurement and Evaluation in Counseling and Development,
43(1), 48-65.
France, M. K., Finney, S. J., & Swerdzewski, P. (2010). Students’ group and member attachment
to their university: A construct validity study of the university attachment scale.
Educational and Psychological Measurement, 70(3), 440-458.
Freeman, T. M., Anderman, L. H., & Jensen, J. M. (2007). Sense of belonging in college
freshmen at the classroom and campus levels. The Journal of Experimental Education,
75(3), 203-220.
Gándara, P., Alvarado, E., Driscoll, A., & Orfield, G. (2012). Building pathways to transfer:
Community colleges that break the chain of failure for students of color. Los Angeles:
University of California, The Civil Roghts Project.
Gibson, D. M., & Myers, J. E. (2006). Perceived stress, wellness, and mattering: A profile of
first-year Citadel cadets. Journal of College Student Development, 47(6-), 647-660.
Gildersleeve, R. E. (2011). Toward a neo-critical validation theory: Participatory action research
and Mexican migrant student success. Enrollment Management Journal: Student Access,
Finance, and Success in Higher Education, 5(2), 72-96.

279
Glover, J. W., & Murrell, P. H. (1998). Campus environment and student involvement as
predictors of outcomes of the community college experience. Journal of Applied
Research in the Community College, 6(1), 5-13.
Gonzalez, G. M. (1989). Understanding the campus community: An ecological paradigm. New
Directions for Student Services, 1989(48), 17-26.
Goodman, J., Schlossberg, N. K., & Anderson, M. L. (2006). Counseling adults in transition:
Linking practice with theory: Springer Publishing Company.
Gruber, K. A., Kilcullen, R. N., & Iso-Ahola, S. E. (2009). Effects of psychosocial resources on
elite soldiers' completion of a demanding military selection program. Military
Psychology, 21(4), 427-444. doi: 10.1080/08995600903206354
Hagedorn, L. S. (2012). How to define retention: A new look at an old problem. In A. Seidman
(Ed.), College student retention: Formula for student success (2nd ed., pp. 81-100).
Lanham, MD: Rowman & Littlefield.
Hagedorn, L. S., Maxwell, W., & Hampton, P. (2001). Correlates of retention for African-
American males in community colleges. Journal of College Student Retention, 3(3), 243-
263.
Hagerty, B. M., Williams, R. A., Coyne, J. C., & Early, M. R. (1996). Sense of belonging and
indicators of social and psychological functioning. Archives of Psychiatric Nursing,
10(4), 235-244.
Hausmann, L. R. M., Schofield, J. W., & Woods, R. L. (2007). Sense of belonging as a predictor
of intentions to persist among African American and White first-year college students.
Research in Higher Education, 48(7), 803-839.

280
Hausmann, L. R. M., Ye, F., Schofield, J., & Woods, R. (2009). Sense of belonging and
persistence in white and African American first-year students. Research in Higher
Education, 50(7), 649-669. doi: 10.1007/s11162-009-9137-8
Hawk, T. F., & Lyons, P. R. (2008). Please don't give up on me: When faculty fail to care.
Journal of Management Education, 32(3), 316-338.
Hayduk, L., & Littvay, L. (2012). Should researchers use single indicators, best indicators, or
multiple indicators in structural equation models? BMC Medical Research Methodology,
12(1), 159.
Hoffman, M., Richmond, J., Morrow, J., & Salomone, K. (2002). Investigating "sense of
belonging" in first-year college students. Journal of College Student Retention: Research,
Theory and Practice, 4(3), 227-256.
Horn, L., Berger, R., & Carroll, C. D. (2004). College persistence on the rise? Changes in 5-year
degree completion and postsecondary persistence rates between 1994 and 2000 (Report).
Washington, DC: US Department of Education, Institute of Education Sciences.
Horn, L., & Carroll, C. D. (1998). Stopouts or Stayouts? Undergraduates who leave college in
their first year NCES 1999-087. (142892745X). Washington, DC: National Center for
Education Statistics Retrieved from
http://www.immagic.com/eLibrary/ARCHIVES/GENERAL/US_ED/NCES9087.pdf.
Hossler, D., Shapiro, D., Dundar, A., Chen, J., Zerquera, D., Ziskin, M., & Torres, V. (2012).
Reverse transfer: A national view of student mobility from four-year to two-year
institutions. Signature [TM] Report 3. National Student Clearinghouse.
Huff, B. P. (2009). Fostering sense of relatedness in classrooms, self-determined motivation, and
institutional persistence among first-year college students. (Arizona State University

281
Ph.D.), Arizona State University, United States -- Arizona. Retrieved from
http://ezproxy.libraries.claremont.edu/login?url=http://search.proquest.com/docview/304
843958?accountid=10141 ProQuest Dissertations & Theses (PQDT) database.
Hult Jr., R. E. (1979). On pedagogical caring. Educational theory, 29(v3), 237-243.
Hurtado, S., & Carter, D. F. (1997). Effects of college transition and perceptions of the campus
racial climate on Latino college students' sense of belonging. Sociology of Education,
324-345.
Hurtado, S., Cuellar, M., & Guillermo-Wann, C. (2011). Quantitative measures of students’
sense of validation: Advancing the study of diverse learning environments. Enrollment
Management Journal: Student Access, Finance, and Success in Higher Education, 5(2),
53-72.
Hurtado, S., Han, J. C., Sáenz, V. B., Espinosa, L. L., Cabrera, N. L., & Cerna, O. S. (2007).
Predicting transition and adjustment to college: Biomedical and behavioral science
aspirants’ and minority students’ first year of college. Research in Higher Education,
48(7), 841-887.
Hurtado, S., & Ponjuan, L. (2005). Latino educational outcomes and the campus climate. Journal
of Hispanic Higher Education, 4(3), 235-251.
Hussar, W. J., & Bailey, T. M. (2011). Projections of Education Statistics to 2020 (NCES 2011-
026). . U.S. Department of Education, National Center for Education Statistics.
Washington, DC: U.S. Government Printing Office.
Isaacson, M. L. (2008). Mattering and persistence relative to a first-year seminar for residential
students at a Great Plains university. (Ed.D. 3333958), University of South Dakota,

282
United States -- South Dakota. ABI/INFORM Complete; Los Angeles Times; ProQuest
Central; ProQuest Criminal Justice; ProQuest Dissertations & Theses (PQDT) database.
Isaacson, M. L. (2009). Mattering and persistence relative to a first-year seminar for residential
students at a Great Plains university. UNIVERSITY OF SOUTH DAKOTA.
Johnson, D. R., Soldner, M., Leonard, J. B., Alvarez, P., Inkelas, K. K., Rowan-Kenyon, H., &
Longerbeam, S. (2007a). Examining sense of belonging among first-year undergraduates
from different racial/ethnic groups. Journal of College Student Development, 48(5), 525-
542.
Johnson, D. R., Soldner, M., Leonard, J. B., Alvarez, P., Inkelas, K. K., Rowan-Kenyon, H. T.,
& Longerbeam, S. D. (2007b). Examining sense of belonging among first-year
undergraduates from different racial/ethnic groups. Journal of College Student
Development, 48(5), 525-542.
Jones-White, D., Radcliffe, P., Huesman, R., & Kellogg, J. (2010). Redefining student success:
Applying different multinomial regression techniques for the study of student graduation
across institutions of higher education. Research in Higher Education, 51(2), 154-174.
doi: 10.1007/s11162-009-9149-4
Jones, W. A. (2010). The impact of social integration on subsequent institutional commitment
conditional on gender. Research in Higher Education, 51(7), 687-700. doi:
10.1007/s11162-010-9172-5
Josselson, R. (1998). Revising herself: The story of women's identity from college to midlife.
New York: Oxford University Press.

283
Karp, M. M., Hughes, K. L., & O'Gara, L. (2010). An exploration of Tinto's integration
framework for community college students. Journal of College Student Retention:
Research, Theory and Practice, 12(1), 69-86.
Kent, S. E. (2004). Persistence of adult undergraduate students and their perceptions of how
they matter to a public institution. (Ed.D. 3130530), University of Northern Colorado,
United States -- Colorado. ProQuest Dissertations & Theses (PQDT) database.
Kim, K. A., Sax, L. J., Lee, J. J., & Hagedorn, L. S. (2010). Redefining nontraditional students:
Exploring the self-perceptions of community college students. Community College
Journal of Research and Practice, 34(5), 402-422.
Kline, R. B. (2005). Principles and practice of structural equation modeling (2nd ed.). New
York: The Guilford Press.
Kodama, C. M. (2002). Marginality of transfer commuter students. NASPA Journal, 39(3), 223-
250.
Kraemer, B. A. (1997). The academic and social integration of Hispanic students into college.
Review of Higher Education, 20(2), 163-179.
Kuh, G. D. (2001). Assessing what really matters to student learning: Inside the National Survey
of Student Engagement. Change, 33(3), 10-66.
Kuh, G. D. (2006). Student Engagement: A Means to Many Desirable Ends. Speech given at The
Secretary of Education/s Commission on the Future of Higher Education. Bloomington,
IN.
Kuh, G. D. (2009). What student affairs professionals need to know about student engagement.
Journal of College Student Development, 50(6), 683-706.

284
Kuh, G. D., Cruce, T. M., Shoup, R., Kinzie, J., & Gonyea, R. M. (2008). Unmasking the effects
of student engagement on first-year college grades and persistence. The Journal of
Higher Education, 79(5), 540-563.
Kuh, G. D., Kinzie, J., Schuh, J. H., Whitt, E. J., & Associates (Eds.). (2005). Student success in
college: Creating conditions that matter. San Francisco, CA: Jossey-Bass.
Kuh, G. D., Whitt, E. J., & Strange, C. C. (1989). The contributions of institutional agents to
high quality out-of-class experiences for college students. Paper presented at the
American Educational Research Association, San Francisco, CA.
Lareau, A. (2003). Unequal childhoods: Race, class and family life: Berkeley: University of
California Press.
Levine, A. (2004, October 29). The biggest challenge for community colleges: 6 views. The
Chronicle of Higher Education, 51(10), B10–B13.
Levitz, R. S., Noel, L., & Richter, B. J. (1999). Strategic moves for retention success. New
Directions for Higher Education, 1999(108), 31-49.
Lewis, R., & Taylor, J. (2009). The social significance of religious resources in the prediction of
mattering to others: African American and White contrasts. Sociological Spectrum, 29(2),
273-294. doi: 10.1080/02732170802584484
Little, R. J. A., & Rubin, D. B. (2002). Statistical analysis with missing data (2nd ed.). Hoboken,
NJ: John W. Wiley and Sons.
Locks, A. M., Hurtado, S., Bowman, N. A., & Oseguera, L. (2008). Extending notions of campus
climate and diversity to students' transition to college. The Review of Higher Education,
31(3), 257-285.

285
Lumina Foundation for Education. (2010). A stronger nation through higher education: How
and why Americans must achieve a “big goal” for college attainment. Retrieved from
http://www.luminafoundation.org/publications/A_stronger_nation.pdf
Lundberg, C. A., & Schreiner, L. A. (2004). Quality and frequency of faculty-student interaction
as predictors of learning: An analysis by student race/ethnicity. Journal of College
Student Development, 45(5), 549-565.
Lynch Ervin, S. E. (2010). Examining student engagement of African American community
college students: Focusing on the CCSSE benchmarks. ProQuest LLC, 255.
MacCullum, R. C. (1995). Model specification: Procedure, strategies, and related issues. In R. H.
Hoyle (Ed.), Structural Equation Modeling (pp. 16-36). Thousand Oaks, CA: Sage.
MacKinnon-Slaney, F. (1994). The adult persistence in learning model: A road map to
counseling services for adult learners. Journal of Counseling & Development, 72(3), 268-
275.
Maestas, R., Vaquera, G. S., & Zehr, L. M. (2007). Factors impacting sense of belonging at a
Hispanic-serving institution. Journal of Hispanic Higher Education, 6(3), 237-256.
Mak, L., & Marshall, S. K. (2004). Perceived mattering in young adults' romantic relationships.
Journal of Social & Personal Relationships, 21(4), 469-486. doi:
10.1177/0265407504044842
Marcus, F. M. (1991). Mattering, self-esteem, gender, and the Protestant ethic. Paper presented
at the Annual Meeting of the American Sociological Association.
Marshall, S. K. (2001). Do I matter? Construct validation of adolescents' perceived mattering to
parents and friends. Journal of Adolescence, 24(4), 473-490. doi:
10.1006/jado.2001.0384

286
Marshall, S. K. (2004). Relative contributions of perceived mattering to parents and friends in
predicting adolescents' psychological well-being. Perceptual and Motor Skills, 99(2),
591-601. doi: 10.2466/pms.99.5.591-601
Marshall, S. K., & Lambert, J. D. (2006). Parental mattering: A qualitative inquiry into the
tendency to evaluate the self as significant to one's children. Journal of Family Issues,
27(11), 1561-1582.
Marshall, S. K., Liu, Y., Wu, A., Berzonsky, M., & Adams, G. R. (2010). Perceived mattering to
parents and friends for university students: A longitudinal study. Journal of Adolescence,
33(3), 367-375.
McClenney, K. M. (2004). Redefining quality in community colleges: Focusing on good
educational practice. Change: The Magazine of Higher Learning, 36(6), 16-21. doi:
10.1080/00091380409604239
McClenney, K. M. (2007). Research update: The community college survey of student
engagement. Community College Review, 35(2), 137-146.
McClenney, K. M., & Marti, C. N. (2006). Exploring relationships between student engagement
and student outcomes in community colleges: Report on validation research. Austin, TX:
Community College Survey of Student Engagement.
McClenney, K. M., Marti, C. N., & Adkins, C. (2006). Student engagement and student
outcomes: Key findings from CCSSE validation research.
http://www.ccsse.org/center/resources/publications.cfm
McCormick, A. C. (2003). Swirling and double‐dipping: New patterns of student attendance and
their implications for higher education. New Directions for Higher Education, 2003(121),
13-24.

287
McCormick, A. C., & McClenney, K. (2012). Will these trees ever bear fruit? A response to the
Special Issue on student engagement. The Review of Higher Education, 35(2), 307-333.
Metzner, B. S., & Bean, J. P. (1987). The estimation of a conceptual model of nontraditional
undergraduate student attrition. Research in Higher Education, 27(1), 15-38. doi:
10.1007/bf00992303
Miles, J. (2010). Experiences of community college student leaders. Community College
Enterprise, 16(2), 77-89.
Miller, M. T., Pope, M. L., & Steinmann, T. D. (2005). A profile of contemporary community
college student involvement, technology use, and reliance on selected college life skills.
College Student Journal, 39(3), 8.
Mortenson, T. G. (2012). Measurements of persistence. In A. Seidman (Ed.), College student
retention: Formula for student success (2nd ed., pp. 35-60). Lanham, MD: Rowman &
Littlefield.
Museus, S. D. (2010). Delineating the ways that targeted support programs facilitate minority
students’ access to social networks and development of social capital in college.
Enrollment Management Journal, 4(3), 10-41.
Myers, J. E., & Bechtel, A. (2004). Stress, wellness, and mattering among cadets at West Point:
Factors affecting a fit and healthy force. Military Medicine, 169(6), 475-482.
National Center for Higher Education Management Systems and Jobs for the Future. (2007).
Adding it up: State challenges for increasing college access and success. Boulder, CO:
NCHEMS.
Nora, A. (2004). The role of habitus and cultural capital in choosing a college, transitioning from
high school to higher education, and Persisting in college among minority and

288
nonminority students. Journal of Hispanic Higher Education, 3(2), 180-208. doi:
10.1177/1538192704263189
Nora, A., Barlow, E., & Crisp, G. (2005). Student persistence and degree attainment beyond the
first year in college. In A. Seidman (Ed.), College student retention: Formula for student
success (pp. 129-153). Westport, CT: Praeger.
Nora, A., & Cabrera, A. F. (1993). The construct validity of institutional commitment: A
confirmatory factor analysis. Research in Higher Education, 34(2), 243-262.
Nora, A., & Crisp, G. (2012). Student persistence and degree attainment beyond the first year in
college: Existing knowledge and directions for future research. In A. Seidman (Ed.),
College student retention: Formula for student success (2nd ed., pp. 229-250). Lanham,
MD: RowMan & Littlefield.
Nora, A., Crisp, G., & Matthews, C. (2011a). A Reconceptualization of CCSSE's Benchmarks of
Student Engagement. The Review of Higher Education, 35(1), 105-130.
Nora, A., Urick, A., & Quijada Cerecer, P. D. (2011b). Validating students: A conceptualization
and overview of its impact on student experiences and outcomes. Enrollment
Management Journal: Student Access, Finance, and Success in Higher Education, 5(2),
34-52.
Nuñez, A. M. (2009). A critical paradox? Predictors of Latino students' sense of belonging in
college. Journal of Diversity in Higher Education, 2(1), 46.
Organization for Economic Co-operation and Development. (2011). OECD Employment Outlook
2011. Retrieved from http://dx.doi.org/10.1787/empl_outlook-2011-en

289
Osborne, J. W., & Overbay, A. (2004). The power of outliers (and why researchers should
always check for them). Practical assessment, research & evaluation, 9(6). Retrieved
December 23, 2012 from http://PAREonline.net/getvn.asp?v=9&n=
Pace, C. R. (1980). Measuring the quality of student effort. Current Issues in Higher Education,
2(1), 10-16.
Pace, C. R. (1984). Measuring the quality of college student experiences. An account of the
development and use of the College Student Experiences Questionnaire. Los Angeles,
CA: Higher Education Research Institute.
Pascarella, E. T., & Chapman, D. W. (1983). A multiinstitutional, path analytic validation of
Tinto’s model of college withdrawal. American Educational Research Journal, 20(1), 87-
102.
Pascarella, E. T., & Terenzini, P. T. (1980). Predicting freshman persistence and voluntary
dropout decisions from a theoretical model. The Journal of Higher Education, 51(1), 60-
75.
Pascarella, E. T., & Terenzini, P. T. (1991). How college affects students: Findings and Insights
from Twenty Years of Research. San Francisco: Jossey-Bass.
Pascarella, E. T., & Terenzini, P. T. (2005). How college affects students: A third decade of
research (2nd ed.). San Francisco: Jossey-Bass.
Pedersen, P. B. (1991). Counseling international students. The Counseling Psychologist, 19(1),
10-58.
Phillips, C. D. (2005). A comparison between African-American and white students enrolled in
an equal opportunity program on predominantly white college campuses: Perceptions of
the campus environment. College Student Journal, 39(2), 298-306.

290
Pike, G. R. (2012). NSSE benchmarks and institutional outcomes: A note on the importance of
considering the intended uses of a measure in validity studies. Paper presented at the
annual meeting of the Association for Institutional Research, New Orleans, LA.
Porter, S. R. (2003). Understanding retention outcomes: Using multiple data sources to
distinguish between dropouts, stopouts, and transfer-outs. Journal of College Student
Retention: Research, Theory and Practice, 5(1), 53-70.
Powers, A. S., Myers, J. E., Tingle, L. R., & Powers, J. C. (2004). Wellness, perceived stress,
mattering, and marital satisfaction among medical residents and their spouses:
Implications for education and counseling. Family Journal, 12(1), 26-36. doi:
10.1177/1066480703258802
Poyrazil, S., Kavanaugh, P. R., Baker, A., & Al-Timimi, N. (2004). Social support and
demographic correlates of acculturative stress in international students. Journal of
College Counseling, 7(1), 73-82.
Price, D., & Tovar, E. (In Press). Student engagement and institutional graduation rates:
Identifying high-impact educational practices for community colleges. Community
College Journal of Research and Practice.
Puma, M. J., Olsen, R. B., Bell, S. H., & Price, C. (2009). What to do when data are missing in
group randomized controlled trials. NCEE 2009-0049: National Center for Education
Evaluation and Regional Assistance.
Raque-Bogdan, T. L., Ericson, S. K., Jackson, J., Martin, H. M., & Bryan, N. A. (2011).
Attachment and mental and physical health: Self-compassion and mattering as mediators.
Journal of Counseling Psychology, 58(2), 272-278.

291
Rendón, L. I. (1992). From the barrio to the academy: Revelations of a Mexican American
“scholarship girl”. New Directions for Community Colleges, 1992(80), 55-64. doi:
10.1002/cc.36819928007
Rendón, L. I. (1994). Validating culturally diverse students: Toward a new model of learning and
student development. Innovative higher education, 19(1), 33-51.
Rendón, L. I. (2002). Community college Puente: A validating model of education. Educational
Policy, 16(4), 642-667.
Rendón, L. I. (2006). Reconceptualizing success for underserved students in higher education.
Washington, D.C.: National Postsecondary Education Cooperative.
Rendón, L. I., Jalomo, R. E., & Nora, A. (2000). Theoretical considerations in the study of
minority student retention in higher education. In J. M. Braxton (Ed.), Reworking the
student departure puzzle (pp. 127-156). Nashville, TN: Vanderbilt University Press.
Rendón Linares, L. I., & Muñoz, S. M. (2011). Revisiting validation theory: Theoretical
foundations, applications, and extensions. Enrollment Management Journal: Student
Access, Finance, and Success in Higher Education, 5(2), 12-33.
Reynolds, C. (2007). Santa Fe Community College and the CCSSE: Using data to make
meaningful change. Assessment Update, 19(5), 4-6.
Rhee, B. S. (2008). Institutional climate and student departure: A multinomial multilevel
modeling approach. The Review of Higher Education, 31(2), 161-183.
Roman, M. A., Taylor, R. T., & Hahs-Vaughn, D. (2010). The retention index of the Community
College Survey of Student Engagement (CCSSE): How meaningful is it? Community
College Journal of Research and Practice, 34(5), 386-401. doi:
10.1080/10668920701382484

292
Rosenberg, M. (1985). Self-concept and psychological well-being in adolescence. The
development of the self, 205-246.
Rosenberg, M., & McCullough, B. C. (1981). Mattering: Inferred significance and mental health
among adolescents. Research in Community & Mental Health, 2, 163-182.
Saenz, V. B., Ngai, H. N., & Hurtado, S. (2007). Factors influencing positive interactions across
race for African American, Asian American, Latino, and White college students.
Research in Higher Education, 48(1), 1-38.
Santiago, D. A., & Reindl, T. (2000). Taking stock: Higher education and Latinos. Washington,
DC: Excelencia in Education.
Santos Laanan, F. (2003). Degree aspirations of two-year college students. Community College
Journal of Research and Practice, 27(6), 495-518. doi: 10.1080/713838186
Schieferecke, R. W. (2009). Male college students' perceptions of mattering and marginalization
at a selected Great Plains university. (Ed.D. 3401894), University of South Dakota,
United States -- South Dakota. ProQuest Dissertations & Theses (PQDT) database.
Schieman, S., & Taylor, J. (2001). Statuses, roles, and the sense of mattering. Sociological
Perspectives, 44(4), 469-484.
Schlossberg, N. K. (1989). Marginality and mattering: Key issues in building community. New
Directions for Student Services, 48, 5-15. doi: 10.1002/ss.37119894803
Schlossberg, N. K., LaSalle, A., & Golec, R. (1990). Mattering Scales for Adult Students in
Postsecondary Education. Washington, DC: American Council on Education, Center for
Adult Learning and Educational Credentials. (ERIC Document Reproduction Service No.
ED341772).

293
Schlossberg, N. K., Lynch, A. Q., & Chickering, A. W. (1989). Improving higher education for
adults: Responsive programs and services from entry to departure. San Francisco, CA:
Jossey-Bass.
Schmid, C., & Abell, P. (2003). Demographic risk factors, study patterns, and campus
involvement as related to student success among Guilford Technical Community College
students. Community College Review, 31(1), 1-16. doi: 10.1177/009155210303100101
Schoenecker, C., & Reeves, R. (2008). The National Student Clearinghouse: The largest current
student tracking database. New Directions for Community Colleges, 2008(143), 47-57.
Schuetz, P. (2008). Developing a theory-driven model of community college student
engagement. New Directions for Community Colleges, 144, 17-28.
Seidman, A. (2005). Minority student retention: Resources for practitioners. New directions for
institutional research, 2005(125), 7-24.
Seidman, A. (2012). Taking action: A retention formula and model for student success. In A.
Seidman (Ed.), College student retention: Formula for student success (2nd ed., pp. 267-
284). Lanham, MD: Rowman & Littlefield.
Skomsvold, P., Radford, A. W., & Berkner, L. (2011). Six-year attainment, persistence, transfer,
retention, and withdrawal rates of students who began postsecondary education in 2003-
04. Web Tables. NCES 2011-152. Washington, DC: National Center for Education
Statistics.
Smith, D. G., Gerbick, G. L., Figueroa, M. A., Watkins, G. H., Levitan, T., Moore, L. C., . . .
Figueroa, B. (1997). Diversity works: The emerging picture of how students benefit.
Washington, D.C.: Association of American Colleges and Universities.

294
Smith, D. G., & Schonfeld, N. B. (2000). The benefits of diversity: What the research tells us.
About Campus, 5(5), 16-23.
Smith, S. T. (2011). Impact of changes in unemployment rate and population on enrollment in
North Carolina's rural, urban, and suburban community colleges. (Ph.D. 3487539),
Capella University. Available from ProQuest Dissertations & Theses (PQDT).
Snyder, T. D., & Dillow, S. A. (2011). Digest of Education Statistics 2010 (NCES 2011-015)
(ion, Trans.). National Center for Education Statistics, Institute of Education Sciences,
U.S. Department of Education, Washington, DC.
Sontam, V., & Gabriel, G. (2012). Student engagement at a large suburban community college:
Gender and race differences. Community College Journal of Research and Practice,
36(10), 808-820. doi: 10.1080/10668926.2010.491998
Spady, W. G. (1970). Dropouts from higher education: An interdisciplinary review and
synthesis. Interchange, 1(1), 64-85.
Spady, W. G. (1971). Dropouts from higher education: Toward an empirical model. Interchange,
2(3), 38-62.
Sparks, D., & Malkus, N. (2013). First-year undergraduate remedial coursetaking: 1999–2000,
2003–04, 2007–08 (ion, Trans.). National Center for Education Statistics, National
Postsecondary Student Aid Study , U.S. Department of Education, Washington, DC.
Stanton-Salazar, R. D. (1997). A social capital framework for understanding the socialization of
racial minority children and youths. Harvard educational review, 67(1), 1-41.
Strauss, L. C., & Volkwein, J. F. (2004). Predictors of student commitment at two-year and four-
year institutions. Journal of Higher Education, 203-227.

295
Strayhorn, T. L. (2008). "Sentido de pertenencia": A hierarchical analysis predicting sense of
belonging among Latino college students. Journal of Hispanic Higher Education, 7(4),
301-320.
Strayhorn, T. L. (2012). College students' sense of belonging: A key to educational success for
all students. New York: Routledge.
Sumner, K. J. (2012). A phenomenological study of students' perceptions of mattering at a
selected Midwestern private faith-based institution. (Ed.D. 3507948), University of South
Dakota, United States -- South Dakota. ProQuest Dissertations & Theses (PQDT)
database.
Swail, W. S., Redd, K. E., & Perna, L. W. (2003). Retaining minority students in higher
education: a framework for success. (ASHE-ERIC Higher Education Report). Jossey-
Bass, San Francisco.
Tabachnick, B. G., & Fidell, L. S. (2006). Using multivariate statistics (5th ed.). Boston: Allyn
and Bacon.
Taylor, J., & Turner, R. J. (2001). A longitudinal study of the role and significance of mattering
to others for depressive symptoms. Journal of Health & Social Behavior, 42(3), 310-325.
Terenzini, P. T., Rendon, L. I., Lee Upcraft, M., Millar, S. B., Allison, K. W., Gregg, P. L., &
Jalomo, R. (1994). The transition to college: Diverse students, diverse stories. Research
in Higher Education, 35(1), 57-73.
Tierney, W. G. (1992). An anthropological analysis of student participation in college. The
Journal of Higher Education, 63(6), 603-618.
Tinto, V. (1975). Dropout from higher education: A theoretical synthesis of recent research.
Review of educational research, 45(1), 89-125.

296
Tinto, V. (1987). Leaving college: Rethinking the causes and cures of student attrition. Chicago:
University of Chicago Press.
Tinto, V. (1993). Leaving college: Rethinking the causes and cures of student attrition (2nd ed.).
Chicago: University of Chicago Press.
Tinto, V. (2000). Linking learning and leaving: Exploring the role of the college classroom in
student departure. In J. M. Braxton (Ed.), Reworking the student departure puzzle (pp.
81-94). Nashville, TN: Vanderbilt University Press.
Tinto, V. (2001). Rethinking the first year of college. Higher Education Monograph Series,
Syracuse University. Retrieved from
http://faculty.soe.syr.edu/vtinto/Files/old/RethinkFirstYearCollege.pdf.
Tinto, V. (2003). Student success and the construction of inclusive educational communities.
Tinto, V. (2006). Research and practice of student retention: what next? Journal of College
Student Retention: Research, Theory and Practice, 8(1), 1-19.
Tinto, V. (2012a). Completing college: Rethinking institutional action. Chicago: University of
Chicago Press.
Tinto, V. (2012b). Moving from theory to action: A model of institutional action for student
success. In A. Seidman (Ed.), College student retention: Formula for student success
(2nd ed., pp. 251-266). Lanham, MD: Rowman & Littlefield.
Torres, V. (2006). A mixed method study testing data-model fit of a retention model for Latino/a
students at urban universities. Journal of College Student Development, 47(3), 299-318.
doi: 10.1353/csd.2006.0037

297
Tovar, E., & Simon, M. A. (2006). Academic probation as a dangerous opportunity: Factors
influencing diverse college students' success. Community College Journal of Research
and Practice, 30(7), 547-564.
Tovar, E., & Simon, M. A. (2010). Factorial structure and invariance analysis of the Sense of
Belonging Scales. Measurement and Evaluation in Counseling and Development, 43(3),
199-217.
Tovar, E., Simon, M. A., & Fujimaki, S. (2008). Impact of student characteristics, transition
experiences, and academic/social integration on American and international students’
perceptions of mattering to college. Paper presented at the 2008 Annual Forum of the
Association for Institutional Research, Seattle, WA.
Tovar, E., Simon, M. A., & Lee, H. B. (2009). Development and validation of the College
Mattering Inventory with diverse urban college students. Measurement & Evaluation in
Counseling & Development, 42(3), 154-178. doi: 10.1177/0748175609344093
Ullman, J. B. (2006). Structural equation modeling: Reviewing the basics and moving forward.
Journal of Personality Assessment, 87(1), 35-50. doi: 10.1207/s15327752jpa8701_03
Van Gennep, A. (1960). The rites of passage, translated by M.B. Vizedom and G.L. Caffee.
Chicago: University of Chicago Press. Originally published as Les rites fe passage. Paris:
Nourry, 1909.
Voorhees, R. A. (1987). Toward building models of community college persistence: A logit
analysis. Research in Higher Education, 26(2), 115-129. doi: 10.1007/BF00992024
Webb, M. (1989). A Theoretical Model of Community College Student Degree Persistence.
Community College Review, 16(4), 42-49. doi: 10.1177/009155218901600406

298
Wentzel, K. R. (1997). Student motivation in middle school: The role of perceived pedagogical
caring. Journal of Educational Psychology, 89(3), 411-419. doi: 10.1037/0022-
0663.89.3.411
West, S., Taylor, A., & Wu, W. (2012). Model fit and model selection in structural equation
modeling. In R. H. Hoyle (Ed.), Handbook of structural equation modeling (pp. 209-
231). New York: Guilford.
Wicker, A. H. (2004). The relationship of demographic, aspirational, situational, employment,
and commuting factors to commuter students' perceptions of mattering at a large public
university. (Ph.D. 3125448), University of Maryland, College Park, United States --
Maryland. ProQuest Dissertations & Theses (PQDT) database.
Wolf-Wendel, L., Ward, K., & Kinzie, J. (2009). A tangled web of terms: The overlap and
unique contribution of involvement, engagement, and integration to understanding
college student success. Journal of College Student Development, 50(4), 407-428.
Wood, J. L. (2012). Leaving the 2-year college: Predictors of Black male collegian departure.
Journal of Black Studies, 43(3), 303-326. doi: 10.1177/0021934711424490
Yi, P. (2007). Institutional climate and student departure: A multinomial multilevel modeling
approach. The Review of Higher Education, 31(2), 161-183.

299
Appendix A
Supplemental Tables & Figures for Chapter 4

300
Table A-1
Unstandardized and Standardized Coefficients for Respecified Measurement Model 2—the
Model of Best Fit Research Question 1)
Unstandardized Estimates Standardized
Item Estimate S.E. C.R. Sig. Estimate
Institutional Commitment to Students (IC2S)
M39 0.917 0.029 31.983 *** 0.737
M17 0.75 0.025 29.514 *** 0.671
M59a 1
0.868
Interactions with Diverse Peers (IWDP)
Q82 1.086 0.028 38.811 *** 0.814
Q78 1.117 0.027 41.23 *** 0.878
Q74 a 1
0.79
Perceptions of a Hostile Campus Climate (HCC)
M63neg 1.172 0.068 17.26 *** 0.495
M55neg 1.422 0.068 20.934 *** 0.679
M36neg 0.627 0.036 17.585 *** 0.507
M18neg a 1
0.647
Socio-Academic Integrative Experiences (SAIE)
InsSup 0.993 0.027 37.06 *** 0.899
InsAvail 1
0.845
Engagement/Involvement (ENGAGEMENT)
Q173_1 0.248 0.025 10.004 *** 0.353

301
Unstandardized Estimates Standardized
Item Estimate S.E. C.R. Sig. Estimate
Q128 1.097 0.119 9.187 *** 0.309
Q134 0.707 0.065 10.921 *** 0.419
Q129 a 1
0.661
Q173_9 0.174 0.021 8.237 *** 0.266
Perceptions of Mattering (MATTERING)
M54 1.093 0.036 30.682 *** 0.792
M53 1.078 0.035 31.194 *** 0.814
M48 a 1
0.692
Sense of Belonging (SOB)
M34 0.541 0.022 24.157 *** 0.537
M32 0.67 0.027 24.661 *** 0.586
M30 0.889 0.025 35.587 *** 0.812
M31 a 1
0.843
a First congeneric item; not freely estimated.
*** p < .001
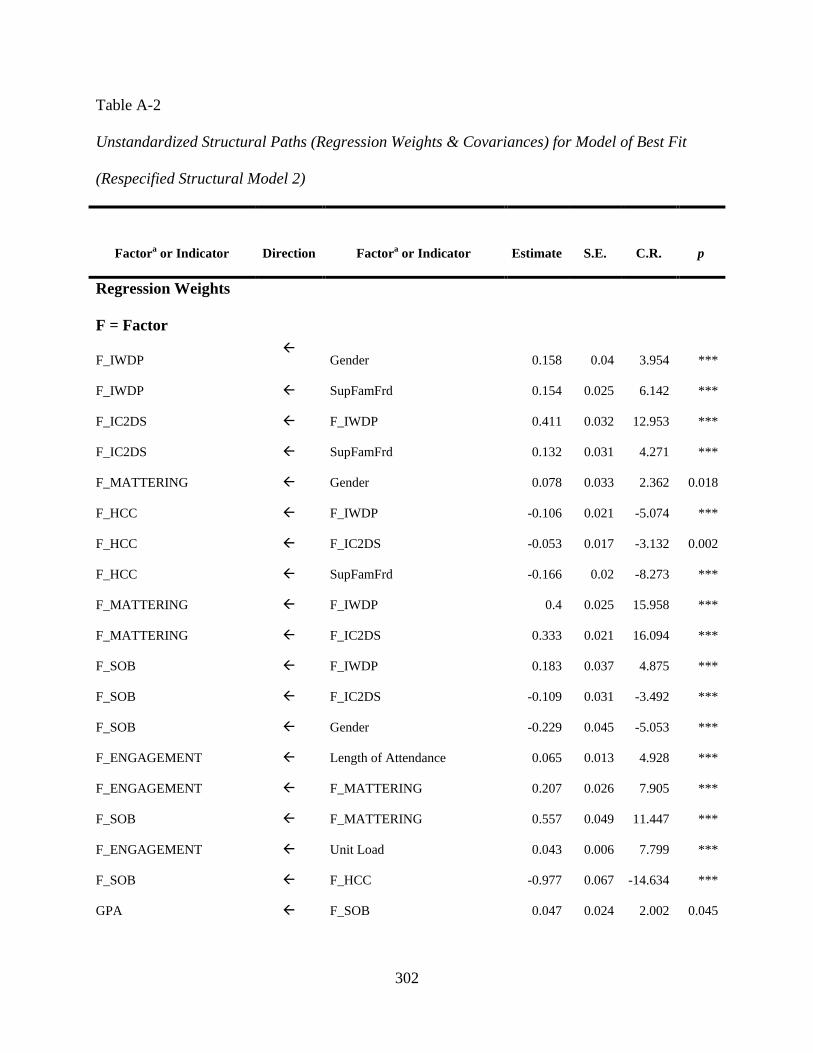
302
Table A-2
Unstandardized Structural Paths (Regression Weights & Covariances) for Model of Best Fit
(Respecified Structural Model 2)
Factora or Indicator Direction Factora or Indicator Estimate S.E. C.R. p
Regression Weights
F = Factor
F_IWDP
Gender 0.158 0.04 3.954 ***
F_IWDP SupFamFrd 0.154 0.025 6.142 ***
F_IC2DS F_IWDP 0.411 0.032 12.953 ***
F_IC2DS SupFamFrd 0.132 0.031 4.271 ***
F_MATTERING Gender 0.078 0.033 2.362 0.018
F_HCC F_IWDP -0.106 0.021 -5.074 ***
F_HCC F_IC2DS -0.053 0.017 -3.132 0.002
F_HCC SupFamFrd -0.166 0.02 -8.273 ***
F_MATTERING F_IWDP 0.4 0.025 15.958 ***
F_MATTERING F_IC2DS 0.333 0.021 16.094 ***
F_SOB F_IWDP 0.183 0.037 4.875 ***
F_SOB F_IC2DS -0.109 0.031 -3.492 ***
F_SOB Gender -0.229 0.045 -5.053 ***
F_ENGAGEMENT Length of Attendance 0.065 0.013 4.928 ***
F_ENGAGEMENT F_MATTERING 0.207 0.026 7.905 ***
F_SOB F_MATTERING 0.557 0.049 11.447 ***
F_ENGAGEMENT Unit Load 0.043 0.006 7.799 ***
F_SOB F_HCC -0.977 0.067 -14.634 ***
GPA F_SOB 0.047 0.024 2.002 0.045

303
Factora or Indicator Direction Factora or Indicator Estimate S.E. C.R. p
GPA Financial Concerns -0.069 0.017 -4.131 ***
GPA F_ENGAGEMENT 0.699 0.09 7.727 ***
F_INTEGRATION SupFamFrd 0.08 0.019 4.251 ***
F_INTEGRATION F_MATTERING 0.182 0.03 6.016 ***
Goal Commitment GPA 0.062 0.023 2.636 0.008
F_INTEGRATION F_IC2DS 0.144 0.02 7.137 ***
F_INTEGRATION F_IWDP 0.374 0.025 14.744 ***
Goal Commitment F_HCC -0.138 0.048 -2.874 0.004
Goal Commitment F_ENGAGEMENT 0.604 0.093 6.479 ***
M63neg F_HCC 1
M55neg F_HCC 1.181 0.067 17.539 ***
M36neg F_HCC 0.598 0.04 15.051 ***
M18neg F_HCC 0.88 0.051 17.364 ***
Q74 F_IWDP 1
Q78 F_IWDP 1.119 0.027 41.236 ***
Q82 F_IWDP 1.086 0.028 38.761 ***
M32 F_SOB 0.665 0.029 23.093 ***
M17 F_IC2DS 0.751 0.025 29.575 ***
M59 F_IC2DS 1
M39 F_IC2DS 0.919 0.029 32.073 ***
M54 F_MATTERING 1.092 0.036 30.738 ***
M48 F_MATTERING 1
Q129 F_ENGAGEMENT 0.705 0.074 9.515 ***
Q128 F_ENGAGEMENT 1
InsAvail F_INTEGRATION 1

304
Factora or Indicator Direction Factora or Indicator Estimate S.E. C.R. p
M53 F_MATTERING 1.076 0.034 31.248 ***
Intent to PERSIST F_SOB 0.045 0.024 1.894 0.058
Intent to PERSIST GPA 0.066 0.022 2.992 0.003
Q173_9 F_ENGAGEMENT 0.192 0.023 8.306 ***
Q173_1 F_ENGAGEMENT 0.199 0.024 8.173 ***
Q134 F_ENGAGEMENT 0.529 0.062 8.539 ***
InsSup F_INTEGRATION 0.99 0.027 37.301 ***
Intent to PERSIST Length of Attendance -0.062 0.019 -3.266 0.001
Intent to PERSIST F_INTEGRATION 0.105 0.035 3.04 0.002
Intent to PERSIST SupFamFrd 0.491 0.029 16.702 ***
Intent to PERSIST Goal Commitment 0.09 0.022 4.041 ***
M30 F_SOB 0.892 0.028 32.24 ***
M31 F_SOB 1
Intent to PERSIST F_ENGAGEMENT 0.301 0.077 3.88 ***
Covariances
Gender Length of Attendance 0.011 0.013 0.867 0.386
Length of Attendance SupFamFrd 0.014 0.021 0.656 0.512
Gender Financial Concerns 0.002 0.015 0.134 0.894
SupFamFrd Financial Concerns -0.098 0.024 -4.01 ***
Financial Concerns Unit Load -0.312 0.123 -2.541 0.011
Gender SupFamFrd 0.032 0.008 3.778 ***
Gender Unit Load -0.137 0.043 -3.211 0.001
SupFamFrd Unit Load 0.274 0.068 4.022 ***

305
Factora or Indicator Direction Factora or Indicator Estimate S.E. C.R. p
Length of Attendance Unit Load -0.718 0.105 -6.833 ***
Length of Attendance Financial Concerns 0.046 0.037 1.229 0.219
eGoal Unit Load 0.479 0.103 4.641 ***
eS30 eS32 -0.059 0.026 -2.252 0.024
eEI128 Unit Load 0.827 0.143 5.79 ***
*** p < .001
a Denotes this variable represents a latent factor in the model.

306
Table A-3
Standardized Structural Paths (Regression Weights & Correlations) for Model of Best Fit
(Respecified Structural Model 2)
Factor a or Indicator Direction Factor a or Indicator Regression Weight
Regression Weights F = Factor
F_IWDP Gender 0.09***
F_IWDP SupFamFrd 0.14***
F_IC2DS F_IWDP 0.33***
F_IC2DS SupFamFrd 0.10***
F_MATTERING Gender 0.05*
F_HCC F_IWDP -0.16***
F_HCC F_IC2DS -0.10***
F_HCC SupFamFrd -0.22***
F_MATTERING F_IWDP 0.41***
F_MATTERING F_IC2DS 0.43***
F_SOB F_IWDP 0.14***
F_SOB F_IC2DS -0.10***
F_SOB Gender -0.10***
F_ENGAGEMENT Length of Attendance 0.15***
F_ENGAGEMENT F_MATTERING 0.34***
F_SOB F_MATTERING 0.40***
F_ENGAGEMENT Unit Load 0.34***
F_SOB F_HCC -0.50***
GPA F_SOB 0.05*
GPA Financial Concerns -0.09***
GPA F_ENGAGEMENT 0.32***
F_INTEGRATION SupFamFrd 0.08***
F_INTEGRATION F_MATTERING 0.19***

307
Factor a or Indicator Direction Factor a or Indicator Regression Weight
Goal Commitment GPA 0.06*
F_INTEGRATION F_IC2DS 0.20***
F_INTEGRATION F_IWDP 0.41***
Goal Commitment F_HCC -0.07**
Goal Commitment F_ENGAGEMENT 0.27***
M63neg F_HCC 0.50***
M55neg F_HCC 0.67***
M36neg F_HCC 0.49***
M18neg F_HCC 0.65***
Q74 F_IWDP 0.79***
Q78 F_IWDP 0.88***
Q82 F_IWDP 0.81***
M32 F_SOB 0.58***
M17 F_IC2DS 0.67***
M59 F_IC2DS 0.87***
M39 F_IC2DS 0.74***
M54 F_MATTERING 0.79***
M48 F_MATTERING 0.69***
Q129Trunc F_ENGAGEMENT 0.55***
Q128 F_ENGAGEMENT 0.33***
InsAvail F_INTEGRATION 0.85***
M53 F_MATTERING 0.81***
Intent to PERSIST F_SOB 0.05ǂ
Intent to PERSIST GPA 0.07**
Q173_9 F_ENGAGEMENT 0.35***
Q173_1 F_ENGAGEMENT 0.34***
Q134Truc F_ENGAGEMENT 0.37***
InsSupTrunc F_INTEGRATION 0.90***
Intent to PERSIST Length of Attendance -0.07***

308
Factor a or Indicator Direction Factor a or Indicator Regression Weight
Intent to PERSIST F_INTEGRATION 0.07***
Intent to PERSIST SupFamFrd 0.34***
Intent to PERSIST Goal Commitment 0.09***
M30 F_SOB 0.82***
M31 F_SOB 0.84***
Intent to PERSIST F_ENGAGEMENT 0.13***
Correlations
Length of Attendance SupFamFrd 0.014
Gender Financial Concerns 0.003
SupFamFrd Financial Concerns -0.088
Financial Concerns Unit Load -0.055
Gender SupFamFrd 0.083
Gender Unit Load -0.069
SupFamFrd Unit Load 0.087
Length of Attendance Unit Load -0.149
Length of Attendance Financial Concerns 0.027
eGoal Unit Load 0.114
eS30 eS32 -0.078
eEI128 Unit Load 0.146
*** p < .001; ** p < .01; * p < .05; ǂ p = .06. a Denotes this variable represents a latent factor in the model.

309
Table A-4
Squared Multiple Correlations for Model of Best Fit (Respecified Structural Model 2)
Factor a or Indicator Estimate
F_IWDP 0.031
F_IC2DS 0.129
F_MATTERING 0.478
F_HCC 0.111
F_ENGAGEMENT 0.239
F_SOB 0.523
GPA 0.116
Goal Commitment 0.12
F_INTEGRATION 0.457
InsSup 0.806
Q173_1 0.113
Q173_9 0.121
InsAvail 0.717
Q128 0.142
Q129 0.305
Q134 0.138
M48 0.48
M53 0.662
M54 0.627

310
Factor a or Indicator Estimate
Intent to PERSIST 0.205
M39 0.544
M59 0.752
M17 0.451
M32 0.339
M31 0.713
M30 0.668
Q82 0.662
Q78 0.772
Q74 0.622
M18neg 0.422
M36neg 0.238
M55neg 0.45
M63neg 0.251
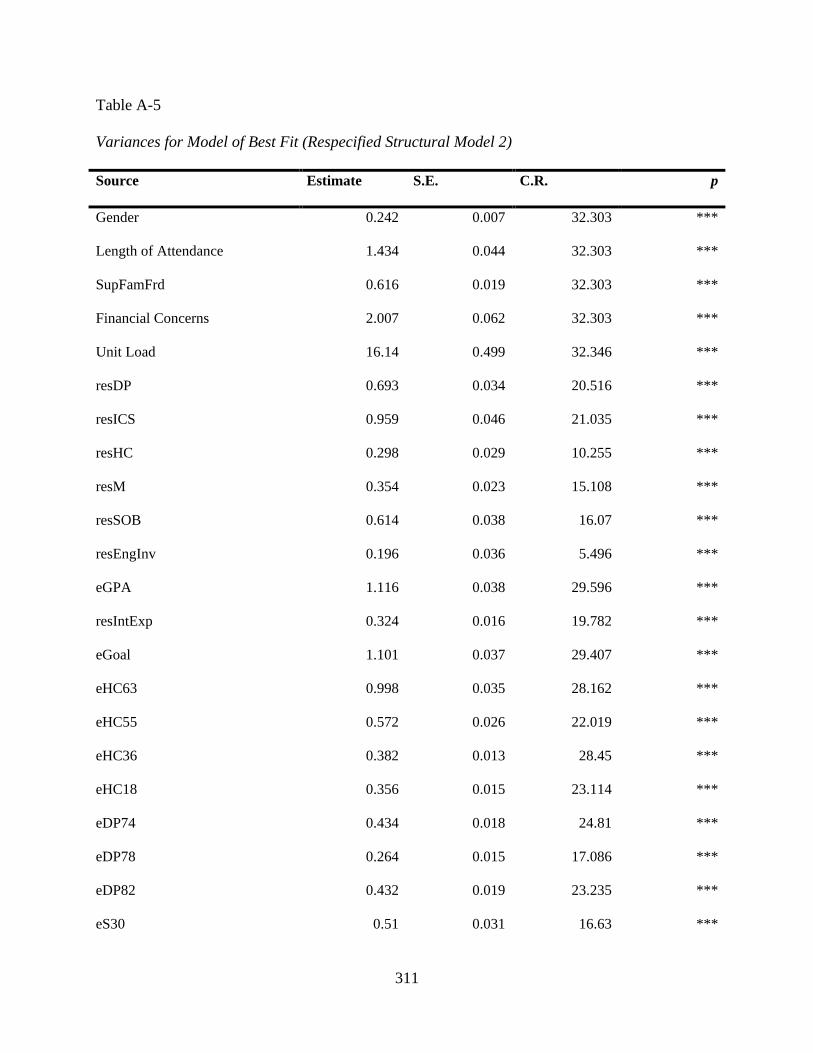
311
Table A-5
Variances for Model of Best Fit (Respecified Structural Model 2)
Source Estimate S.E. C.R. p
Gender 0.242 0.007 32.303 ***
Length of Attendance 1.434 0.044 32.303 ***
SupFamFrd 0.616 0.019 32.303 ***
Financial Concerns 2.007 0.062 32.303 ***
Unit Load 16.14 0.499 32.346 ***
resDP 0.693 0.034 20.516 ***
resICS 0.959 0.046 21.035 ***
resHC 0.298 0.029 10.255 ***
resM 0.354 0.023 15.108 ***
resSOB 0.614 0.038 16.07 ***
resEngInv 0.196 0.036 5.496 ***
eGPA 1.116 0.038 29.596 ***
resIntExp 0.324 0.016 19.782 ***
eGoal 1.101 0.037 29.407 ***
eHC63 0.998 0.035 28.162 ***
eHC55 0.572 0.026 22.019 ***
eHC36 0.382 0.013 28.45 ***
eHC18 0.356 0.015 23.114 ***
eDP74 0.434 0.018 24.81 ***
eDP78 0.264 0.015 17.086 ***
eDP82 0.432 0.019 23.235 ***
eS30 0.51 0.031 16.63 ***
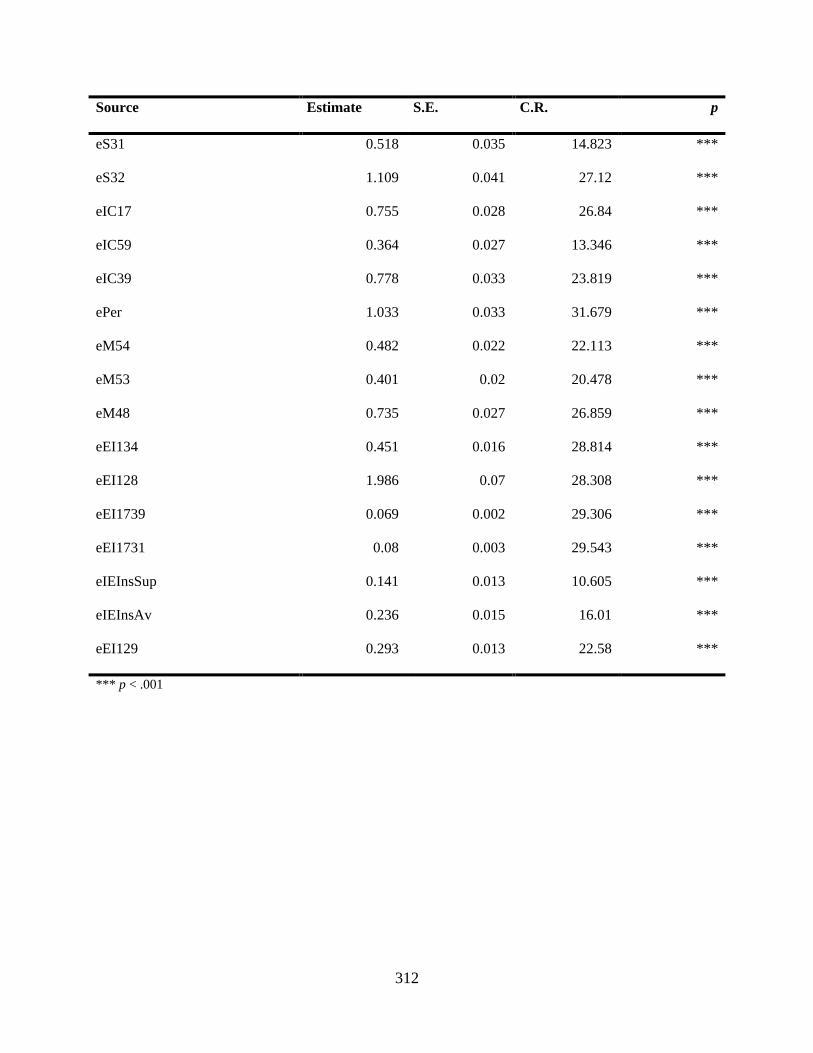
312
Source Estimate S.E. C.R. p
eS31 0.518 0.035 14.823 ***
eS32 1.109 0.041 27.12 ***
eIC17 0.755 0.028 26.84 ***
eIC59 0.364 0.027 13.346 ***
eIC39 0.778 0.033 23.819 ***
ePer 1.033 0.033 31.679 ***
eM54 0.482 0.022 22.113 ***
eM53 0.401 0.02 20.478 ***
eM48 0.735 0.027 26.859 ***
eEI134 0.451 0.016 28.814 ***
eEI128 1.986 0.07 28.308 ***
eEI1739 0.069 0.002 29.306 ***
eEI1731 0.08 0.003 29.543 ***
eIEInsSup 0.141 0.013 10.605 ***
eIEInsAv 0.236 0.015 16.01 ***
eEI129 0.293 0.013 22.58 ***
*** p < .001

313
Appendix B

314
Appendix B-1: Correlation Matrix for Variables in Conceptual Model (N = 2,088)
Variable 1 2 3 4 5 6 7 8 9 10 11 12 13 1. Q177 1
2. Q125 .149** 1
3. Q119 0.002 -.072** 1
4. Q180 -0.03 -.054* 0.003 1
5. SupFamFrd .379** .090** .083** -.088** 1
6. Q126 -0.043 -.152** 0.019 0.027 0.014 1
7. GPA .167** .193** .046* -.091** .089** -0.003 1
8. M59 .126** 0.004 0.008 -0.002 .124** -0.025 0.03 1
9. M17 .137** .092** -0.002 0.022 .106** 0.027 .051* .584** 1
10. M39 .117** 0.009 0.031 0.016 .104** -.063** 0.02 .639** .497** 1
11. M07 .173** 0.025 .051* 0.031 .106** 0.029 .102** .291** .263** .259** 1
12. M38 .122** -.058** .049* -.062** .176** -.056* 0.018 .234** .153** .238** .186** 1
13. Q176 .281** .085** 0.01 -.072** .256** -0.003 .120** .379** .268** .313** .248** .206** 1
14. Q70 .159** -0.029 .105** 0.031 .161** 0.002 .045* .228** .174** .195** .209** .221** .214**
15. Q74 .140** .045* .062** .051* .124** -0.005 0.024 .215** .139** .180** .189** .104** .208**
16. Q78 .122** -0.011 .103** 0.042 .128** -0.015 .064** .274** .203** .239** .255** .178** .242**
17. Q82 .095** .044* .072** 0.02 .120** -0.028 .057** .249** .205** .220** .217** .135** .237**
18. M18neg -.099** .062** -.076** .045* -.178** -.065** -.063** -.080** -.068** -.118** -.085** -.228** -.122**
19. M36neg -.107** 0.009 -.111** 0.034 -.138** -0.039 0.016 -.068** -.068** -.104** -.091** -.237** -.084**
20. M55neg -.049* .093** -.072** .051* -.162** -0.035 -0.03 -.094** -0.02 -.114** -.052* -.242** -.135**
21. M63neg -.115** -.082** -0.023 .064** -.173** .046* 0.005 -.096** -.076** -.110** -0.037 -.162** -.150**
22. M48 .123** .087** .063** 0.015 .091** .048* .127** .327** .266** .288** .287** .120** .237**
23. M52 .082** .105** -0.017 .044* 0.023 -0.004 0.025 .271** .207** .235** .230** 0.025 .180**
24. M53 .125** .044* .053* -0.021 .131** 0.012 .120** .437** .345** .379** .356** .188** .336**
25. M40 .141** 0.041 .089** 0.003 .094** 0.039 .140** .438** .337** .412** .393** .179** .309**
26. M62 .059** .050* -0.017 .063** 0.025 -0.017 0.009 .325** .221** .244** .242** .072** .199**
27. M61 .171** 0.022 .058** 0.012 .141** 0.016 .071** .518** .372** .414** .408** .215** .359**
28. M54 .152** .064** .107** 0.036 .135** 0.042 .126** .350** .272** .295** .353** .198** .267**

315
Appendix B-1: Correlation Matrix for Variables in Conceptual Model (continued)
Variable 1 2 3 4 5 6 7 8 9 10 11 12 13 29. M26 .082** 0.034 .071** 0.021 .109** 0.019 .066** .274** .246** .232** .254** .121** .176**
30. M31 .110** -0.031 -0.005 -.051* .127** .043* .067** .195** .137** .168** .152** .223** .250**
31. M30 .135** -0.01 0.016 -0.032 .135** 0.036 .099** .188** .134** .178** .191** .233** .236**
32. M56 .149** -.105** .050* -0.016 .156** 0.023 .069** .106** .054* .101** .121** .206** .199**
33. M08 .100** -0.023 0.022 -.053* .110** 0.013 .097** .197** .139** .204** .207** .229** .226**
34. M32 .140** -0.012 -0.038 -.091** .135** -.051* .090** .122** .083** .110** .055* .206** .169**
35. M34 .118** -.052* 0.024 -0.035 .142** 0.008 0.023 .151** .103** .154** .140** .289** .140**
36. M49 .162** -.070** .057** -0.016 .172** 0.032 .079** .252** .183** .207** .209** .287** .315**
37. Q129 .096** .197** -0.015 -0.001 -0.012 0.027 .096** .113** .109** .079** .101** -.048* .072**
38. Q134 .059** 0.029 0.03 -0.015 0.001 .076** .063** 0.033 0.002 0.011 .074** -.094** 0.003
39. Q173_1 0.038 .071** 0.013 0.026 -0.002 .092** .088** 0.008 .046* 0.002 .085** -0.017 0.017
40. AcadValidInst .185** 0.013 .047* -0.024 .162** 0.011 .183** .420** .272** .372** .476** .378** .343**
41. InsAvail .173** 0.021 .090** -0.024 .179** -0.029 .085** .372** .263** .310** .314** .317** .301**
42. InsSup .168** -0.007 .101** -0.035 .174** -0.017 .114** .350** .238** .281** .362** .312** .304**
43. Q116 .107** .142** -0.01 .045* .069** .307** .132** .079** .099** .068** .186** -0.002 .104**
44. Q115 .080** .184** 0.007 .072** 0.014 .323** 0.032 .194** .310** .140** .087** -.053* .075**
45. Q128 .124** .251** 0.027 0.002 0.027 0.017 .227** .070** .114** .067** .127** -0.026 .065**
46. Q182 -.180** -.073** -0.039 .257** -.162** 0.042 -.420** -.043* -0.016 -0.035 -.102** -.132** -.184**
47. Q173_9 .079** .143** 0.009 -0.012 .043* .066** .189** .069** .112** 0.024 .045* 0.007 .079**
48. Q123 .171** .216** -.043* -0.007 .064** 0.035 .174** 0.033 .096** 0.029 .062** -.046* 0.033
** p < 0.01; *p < .05 Note: means and standard deviations are reported in Tables 7, 8, and 9

316
Appendix B-1: Correlation Matrix for Variables in Conceptual Model (continued)
Variable 14 15 16 17 18 19 20 21 22 23 24 25 26 14. Q70 1
15. Q74 .576** 1
16. Q78 .616** .699** 1
17. Q82 .512** .643** .710** 1
18. M18neg -.165** -.061** -.085** -.094** 1
19. M36neg -.140** -0.031 -.076** -.059** .380** 1
20. M55neg -.245** -.120** -.156** -.135** .443** .342** 1
21. M63neg -.156** -.158** -.125** -.167** .282** .247** .319** 1
22. M48 .219** .318** .361** .316** -.070** -0.006 -.073** -.063** 1
23. M52 .146** .256** .261** .234** 0.014 .074** 0.019 -0.015 .558** 1
24. M53 .270** .327** .393** .352** -.092** -0.025 -.117** -.098** .566** .511** 1
25. M40 .303** .326** .410** .364** -.084** -0.023 -.095** -.085** .600** .472** .647** 1
26. M62 .149** .228** .243** .195** 0.041 .088** 0.021 0.038 .469** .524** .432** .442** 1
27. M61 .290** .309** .366** .323** -.111** -.050* -.135** -.103** .528** .441** .607** .621** .498**
28. M54 .339** .368** .398** .382** -.152** -.064** -.178** -.153** .548** .447** .643** .612** .392**
29. M26 .245** .262** .364** .306** -.109** -0.029 -.085** -.050* .486** .359** .441** .564** .309**
30. M31 .277** .314** .303** .290** -.312** -.172** -.347** -.353** .261** .147** .325** .324** .104**
31. M30 .284** .299** .294** .271** -.300** -.166** -.333** -.281** .297** .196** .343** .366** .131**
32. M56 .289** .258** .257** .250** -.297** -.216** -.433** -.341** .123** 0.03 .191** .181** 0.02
33. M08 .242** .246** .271** .253** -.255** -.148** -.262** -.201** .232** .156** .306** .313** .125**
34. M32 .205** .209** .213** .216** -.192** -.113** -.202** -.235** .111** 0.035 .178** .171** -0.018
35. M34 .235** .194** .204** .202** -.255** -.217** -.318** -.261** .116** 0.02 .174** .164** 0.007
36. M49 .311** .263** .273** .264** -.231** -.169** -.313** -.318** .222** .116** .263** .301** .158**
37. Q129 .071** .126** .096** .123** 0.016 0.037 .054* -.055* .194** .201** .161** .178** .178**
38. Q134 0.033 .067** .064** .083** -0.011 .070** 0.04 0.021 .083** .086** .079** .103** .109**
39. Q173_1 0.006 0.026 0.019 .054* 0.011 0.031 0.025 0.005 .083** .091** .043* .073** .045*
40. AcadValidInst .301** .283** .349** .316** -.122** -.090** -.163** -.095** .447** .357** .557** .566** .337**
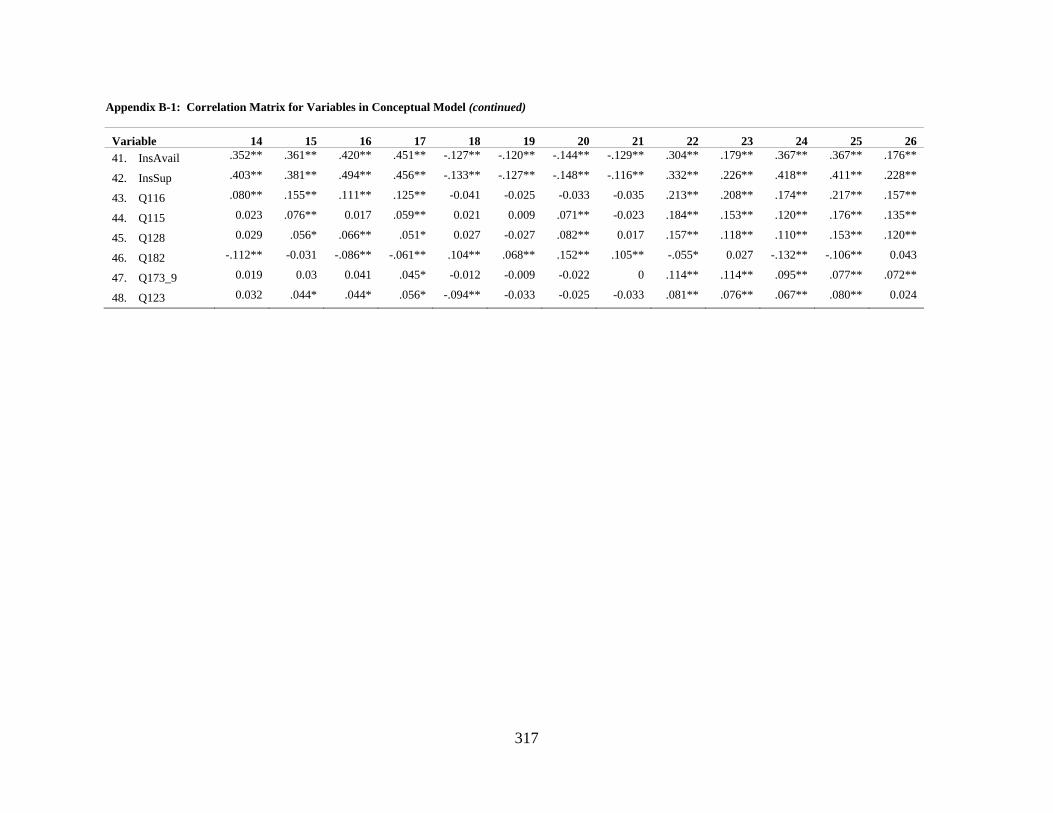
317
Appendix B-1: Correlation Matrix for Variables in Conceptual Model (continued)
Variable 14 15 16 17 18 19 20 21 22 23 24 25 26 41. InsAvail .352** .361** .420** .451** -.127** -.120** -.144** -.129** .304** .179** .367** .367** .176**
42. InsSup .403** .381** .494** .456** -.133** -.127** -.148** -.116** .332** .226** .418** .411** .228**
43. Q116 .080** .155** .111** .125** -0.041 -0.025 -0.033 -0.035 .213** .208** .174** .217** .157**
44. Q115 0.023 .076** 0.017 .059** 0.021 0.009 .071** -0.023 .184** .153** .120** .176** .135**
45. Q128 0.029 .056* .066** .051* 0.027 -0.027 .082** 0.017 .157** .118** .110** .153** .120**
46. Q182 -.112** -0.031 -.086** -.061** .104** .068** .152** .105** -.055* 0.027 -.132** -.106** 0.043
47. Q173_9 0.019 0.03 0.041 .045* -0.012 -0.009 -0.022 0 .114** .114** .095** .077** .072**
48. Q123 0.032 .044* .044* .056* -.094** -0.033 -0.025 -0.033 .081** .076** .067** .080** 0.024

318
Appendix B-1: Correlation Matrix for Variables in Conceptual Model (continued)
Variable 27 28 29 30 31 32 33 34 35 36 37 38 39 27. M61 1
28. M54 .568** 1
29. M26 .410** .438** 1
30. M31 .277** .374** .216** 1
31. M30 .306** .424** .225** .685** 1
32. M56 .177** .275** .127** .545** .496** 1
33. M08 .304** .375** .218** .516** .581** .439** 1
34. M32 .152** .203** .149** .507** .440** .393** .352** 1
35. M34 .175** .232** .127** .439** .415** .420** .372** .347** 1
36. M49 .306** .290** .193** .441** .430** .408** .362** .294** .301** 1
37. Q129 .164** .164** .063** .108** .111** 0.014 .088** .051* 0.026 .054* 1
38. Q134 .119** .111** -0.006 .061** .068** 0.03 0.043 0.036 0.009 -0.018 .281** 1
39. Q173_1 .063** .094** 0.015 0.021 0.023 0.001 .052* -0.006 -0.003 0.015 .255** .134** 1
40. AcadValidInst .562** .529** .391** .303** .353** .218** .350** .192** .213** .328** .091** .053* .056*
41. InsAvail .393** .354** .249** .229** .259** .168** .248** .156** .232** .251** .087** .060** .051*
42. InsSup .424** .396** .278** .265** .294** .208** .282** .139** .245** .283** .079** .062** .043*
43. Q116 .224** .223** .130** .147** .155** .067** .108** 0.025 .048* .102** .232** .146** .149**
44. Q115 .160** .119** .081** .043* .074** -0.007 .043* -0.002 -0.001 .047* .225** .111** .117**
45. Q128 .117** .104** .115** 0.024 .054* -0.032 0.017 .074** -0.034 .060** .178** .165** .086**
46. Q182 -.094** -.133** -.072** -.163** -.180** -.175** -.203** -.236** -.130** -.180** -0.026 -0.005 -0.038
47. Q173_9 .094** .107** 0.021 0.011 .053* 0.03 .057** 0.035 0.038 -0.01 .173** .091** .101**
48. Q123 .108** .102** 0.011 0.036 .046* .045* .059** -0.01 0.019 0.009 .154** .127** .096**

319
Appendix B-1: Correlation Matrix for Variables in Conceptual Model (continued)
Variable 40 41 42 43 44 45 46 47 40. AcadValidInst 1
41. InsAvail .488** 1
42. InsSup .537** .760** 1
43. Q116 .249** .141** .143** 1
44. Q115 .068** .062** 0.037 .385** 1
45. Q128 .147** .076** .089** .207** .193** 1
46. Q182 -.238** -.118** -.148** 0.012 .127** -.046* 1
47. Q173_9 .062** .061** 0.042 .190** .211** .092** -.054* 1
48. Q123 .051* .054* .044* .178** .154** .146** -.066** .180**