A Conceptual Model of Operational Risk - System Dynamics Society
25
A Conceptual Model of Operational Risk David L. Cooke Haskayne School of Business, University of Calgary 2500 University Drive N.W., Calgary Alberta Canada T2N 1N4 Tel. (403) 255-3878 E-mail: [email protected] Thomas R. Rohleder Haskayne School of Business, University of Calgary 2500 University Drive N.W., Calgary Alberta Canada T2N 1N4 Tel. (403) 220-7159 E-mail: [email protected] Abstract This paper addresses the question of whether there is a conceptual model that can explain operational risk in a wide range of organizations. It utilizes case studies and other research literature to build on the foundation laid by previous modeling research into system failures. The validity of the model is tested by how well it fits the parameters of operational risk failures and successes in case studies representing a diverse range of situations in manufacturing, mining, financial services and government. 1. Introduction On October 1, 2003 a truck carrying $10-20 million worth of Biovail’s Wellbutrin XL antidepressant drug was involved in a multiple vehicle accident just outside of Chicago. Two days later, the company revealed that Q3 earnings would be $45 – 65 million lower than expected for three unrelated reasons. First was the traffic accident, even though inspection of the product was expected to show it to be still saleable, second was the fiercer than expected competition for a generic ulcer drug, and third were the late shipments due to order backlogs for a heart drug. Investors responded by knocking 17.7% or just over $1 billion off the company’s market capitalization. The loss in market capitalization was far in excess of the expected operational and market losses from the three incidents alone, because they were interpreted by investors not just at face value but as signals that operational and market risks facing the company were being poorly handled, and that operational problems might run deeper than the company was willing to admit. One analyst who downgraded the stock said that "near-term operational uncertainty has eroded our confidence in the stock's ability to outperform" its peers. 1 Clearly, operational risk management matters a great deal in adding value to shareholders. Unfortunately, risk management in operations has traditionally played only a supporting role, if it played any role at all, in research agendas that have been primarily directed towards operational improvement, cost reduction and performance optimization. A great deal of public and academic attention has been given to major failures in operational systems such as the Challenger and Columbia space shuttle disasters, the toxic gas release at Bhopal, the major oil 1 http://www.thestreet.com/stocks/robertsteyer/10117398.html - 1 -
Transcript of A Conceptual Model of Operational Risk - System Dynamics Society

A Conceptual Model of Operational Risk
David L. Cooke Haskayne School of Business, University of Calgary
2500 University Drive N.W., Calgary Alberta Canada T2N 1N4 Tel. (403) 255-3878 E-mail: [email protected]
Thomas R. Rohleder
Haskayne School of Business, University of Calgary 2500 University Drive N.W., Calgary Alberta Canada T2N 1N4
Tel. (403) 220-7159 E-mail: [email protected]
Abstract This paper addresses the question of whether there is a conceptual model that can explain operational risk in a wide range of organizations. It utilizes case studies and other research literature to build on the foundation laid by previous modeling research into system failures. The validity of the model is tested by how well it fits the parameters of operational risk failures and successes in case studies representing a diverse range of situations in manufacturing, mining, financial services and government.
1. Introduction On October 1, 2003 a truck carrying $10-20 million worth of Biovail’s Wellbutrin XL antidepressant drug was involved in a multiple vehicle accident just outside of Chicago. Two days later, the company revealed that Q3 earnings would be $45 – 65 million lower than expected for three unrelated reasons. First was the traffic accident, even though inspection of the product was expected to show it to be still saleable, second was the fiercer than expected competition for a generic ulcer drug, and third were the late shipments due to order backlogs for a heart drug. Investors responded by knocking 17.7% or just over $1 billion off the company’s market capitalization. The loss in market capitalization was far in excess of the expected operational and market losses from the three incidents alone, because they were interpreted by investors not just at face value but as signals that operational and market risks facing the company were being poorly handled, and that operational problems might run deeper than the company was willing to admit. One analyst who downgraded the stock said that "near-term operational uncertainty has eroded our confidence in the stock's ability to outperform" its peers.1 Clearly, operational risk management matters a great deal in adding value to shareholders.
Unfortunately, risk management in operations has traditionally played only a supporting role, if it played any role at all, in research agendas that have been primarily directed towards operational improvement, cost reduction and performance optimization. A great deal of public and academic attention has been given to major failures in operational systems such as the Challenger and Columbia space shuttle disasters, the toxic gas release at Bhopal, the major oil
1 http://www.thestreet.com/stocks/robertsteyer/10117398.html
- 1 -

spill from the Exxon Valdez, and the core melt-down at the Three Mile Island nuclear power plant. Despite this, the operations management field has not paid much attention to operational risk, as it continues to focus on the traditional operational goals of low cost, high quality, and effective delivery of goods and services.
Lewis (2003) concludes from his review of the operations management and risk management literature that the subject of operational risk is “relatively under-researched” and that “operational risk should be a core concern of OM theory and practice.” Indeed, since the September 11, 2001 terrorist attacks on the USA, there has been a heightened awareness of safety and security matters, and several calls for a shift in the operations management research agenda towards these issues. For example, referring to the events of September 11, Starr (2001) says that the discipline of operations management must alter its priorities to meet the challenges ahead. According to Starr, one of the new priorities for operations management research must be safety and security management.
Yet safety and security are only two aspects of operational risk management. The failures of Barings Bank, Enron and other financial services companies show that inadequate monitoring and control of operations can lead to enormous financial losses even though no one was hurt in a safety or security sense. Similarly, operational failures such as Exxon Valdez can cause enormous impacts to the environment and, as Biovail found out, there are significant risks to be managed as part of a company’s supply chain activities. There has been a considerable amount of research in the operations management field that has focused on reducing the risks of producing defective products or inadequate services, in other words, on quality. However, for the most part, other operational risks have been ignored or assumed to be an implicit component of “quality.” We interpret the meaning of “operational risks” quite broadly to include all risks associated with the operational activities of the firm including, but not limited to, financial, production, safety, quality, environment, security and health risks. We hope to convince the reader that quality is a subset of operational risk, albeit an important one.
Previous research by Cooke (2003b) has shown that the relationships and organizational structures found in the specific case of the Westray mine disaster can be represented in a system dynamics model. Simulation results from this model have shown that the same production system can operate safely or in a manner that leads to disaster depending on the choice of parameters that influence management’s commitment to safety. The feedback loop that governs system behavior in the Westray case can operate as either a Production Priority over Safety loop or a Safety Priority over Production loop depending on the values of system parameters. But are there any examples of success where this loop does indeed operate in a virtuous fashion? A case study of NOVA Chemical’s Decatur plant, briefly described in section 3.7 of this paper, provides a contrast to the Westray case by showing that the safety/production feedback loop can indeed operate in a mode of positive reinforcement, with increasing safety leading to increased production. Do similar risk dynamics operate in other organizations?
This paper addresses this and other holistic questions with respect to operational risk. Specifically, is there an integrated theoretical framework into which operational risk in a wide range of organizations, ranging from manufacturing to financial services, can fit? To answer this question, this research integrates the prior literature from other disciplines with information drawn from case studies in order to develop a conceptual dynamic model for operational risk. In striving to answer this question, we hope that our research will contribute towards a richer understanding of operational risk dynamics and will ultimately lead to improved strategies for risk management and control.
- 2 -

2. Research Approach Our research approach combines two methods that have been previously used to good effect in operations management research. These are 1) the derivation of operations management theory by integrating findings from other fields (Amundson, 1998) and 2) the conceptual induction of a theoretical framework by analyzing similar occurrences of a phenomenon being studied (Meredith, 1993).
Importing and using theories from other fields of research outside of operations management has been advocated by Amundson (1998), who emphasizes the importance of not “reinventing the wheel.” This approach was practiced to good effect by Stewart and Grout (2001) who drew from the fields of psychology and cognitive science to develop a theoretical framework for the quality control technique known as poka-yoke (mistake proofing). Since the primary purpose of this paper is theory development, a similar approach was taken here by starting with a broad review of the prior literature to identify previous findings for possible incorporation into an operational risk conceptual model. This literature exists not only in the field of operations management, but also in the fields of insurance and risk management, finance, safety and reliability engineering, organizational theory, sociology, and psychology.
The second research approach used in this paper is that of conceptual induction. As discussed by Meredith (1993): “In this approach, a number of occurrences of a phenomenon are analyzed to infer the nature of the system or treatment which produced them.” In the research presented here, the phenomenon being studied is operational risk, and the research method is to draw inferences about the nature of the system by studying cases of operational risk failures and successes. Although failures tend to be better documented than successes, primary data drawn from a case study of operational improvement at a chemical plant site, conducted by one of the authors, was used to complement the many secondary data sources of failure drawn from the literature.
The case-based conceptual induction approach taken here is similar to that used by Lewis (2003). Lewis developed a preliminary model of operational risk based upon literature research and then tested it against an analysis of four original case studies. The case studies were selected to provide different examples of causation, consequence and control. Another example of research using a conceptual induction approach is found in Wiers and van der Schaaf (1997). Wiers and van der Schaaf propose a theoretical framework for allocating scheduling tasks between human schedulers and machine-based scheduling systems. They test their proposed framework against observations drawn from four case studies of production unit control.
3. Selected Cases in Operational Risk This section summarizes the seven case studies that were used to validate the conceptual model. The cases discussed below were selected to encompass operational risk situations in a wide range of industries. Some systems, by their nature, are more prone to disaster than others. However, like the generic error-modeling system (GEMS) proposed by Reason (1990) for human problem-solving failures, we propose that there is a generic operational risk system that underlies success and failure in complex operations. This idea can be developed further by examining the organizational systems underlying these cases in order to find common features and structural similarities.
- 3 -

3.1. The NASA Space Shuttle Program, Houston, Texas The NASA Space Shuttle Program has suffered two disasters, the loss of Challenger on January 8, 1986 and the loss of Columbia on February 1, 2003. The facts of these disasters are well known, and will not be repeated here. The systemic causes of both accidents, which lie in the sociological and cultural fabric of the NASA organization, were not emphasized in the Report of the Presidential Commission on the Space Shuttle Challenger Accident (1986), but were closely scrutinized by the Columbia Accident Investigation Board (2003). The two shuttle disasters lend further support to the notion, discussed in Chapter 5, that the same system will continue to produce the same incidents if no changes are made to the system, and that disasters will not usually occur spontaneously but rather will result from organizational failure to recognize the warning signals from “pre-cursor” incidents. Furthermore, the conclusions drawn by the Columbia Accident Investigation Board (2003) about the NASA system support the suggestion by Vaughan (1996), based on her insightful and thorough analysis of the Challenger disaster, that “mistake, mishap and disaster are socially organized and systematically produced by social structures.” The NASA disasters did not result from individual wrongdoings or managerial misdeeds, but rather from an organization-wide culture that institutionalized production pressures and accepted risk as a daily fact of life. Sad to say, the two shuttle disasters appear to have been good examples of what Perrow (1984) calls “normal” accidents.
3.2. Barings Bank, London, England On February 23, 1995 Barings plc, one of the oldest investment banks in England, discovered that Nick Leeson, its chief trader and general manager of its Singapore office, had disappeared. A few days later they discovered that Leeson had left them with open trading positions in Japanese stock and bond derivatives representing mark-to-market losses of over US$900 million. The venerable bank’s assets were only $550 million and so bankruptcy was inevitable. To preserve faith in the banking system, a rescue deal was quickly put into place and by March 9, 1995 the Dutch financial service conglomerate ING had acquired Barings. As Zhang (1995) points out, “it had taken over two centuries to build the Barings family business, yet it took only a few days for it to disappear.”
Nick Leeson had started as a clerk in the back office of the Singapore branch. When he was promoted to the trading floor he did not give up his back office responsibilities. This broke the “cardinal rule” of separating front office trading activities from the back office documentation and reporting activities. Since he played both roles, Leeson was able to set up fictitious accounts to hide his losing trades. Management in London were not aware of Leeson’s unauthorized trading activities, even though his abnormally high profits in prior years should have alerted them to the fact that unusually large risks were being taken in the Singapore office. This ignorance on the part of senior management was compounded by a weak internal audit function that did not take a strong enough stand against Leeson carrying out both front and back office functions, even though they were aware of it and could not have been blind to the risks that this practice created.
One might conjecture that Leeson’s previous trading successes were also a contributing factor to his downfall, as this success convinced him of his superior market knowledge. Although the Japanese markets had been trending downwards for several years, Leeson was quite certain that a turnaround was imminent. In fact, all of his trading positions represented a one-sided bet on his bullish outlook for the Japanese economy. However, the Kobe earthquake on January 17, 1995 triggered a further erosion of confidence in the economic recovery and a 1000 point drop in the Nikkei Index, exacerbated Leeson’s losses. Yet, instead of cutting his
- 4 -

losses at that point, Leeson continued to bet on a recovery by increasing his position. When he could no longer hide the losses from management in London, he fled.
3.3. Confederation Life Insurance Company, Toronto, Ontario McQueen (1996) recounts the tragic tale of Confederation Life Insurance Company (“Confed”), which was the fourth largest insurance company in Canada with 4,400 employees and C$19 billion in assets, at least on paper, when it was seized by regulators on August 11, 1994. McQueen found that “Confed didn’t need to fail, but fail it did” because of a complex combination of ignorance, greed and human error. CEO Pat Burns shouldered the greatest proportion of blame, and there is no doubt that his flawed belief that “growth is inherently profitable” was an important factor in the company’s demise. However, another important factor was the inability of senior management to fully understand the complexity of the company’s operations and the consequences of operating leverage. No other insurance company relied on leveraged real estate investments as much as Confed did, and none had a greater percentage of its assets invested in real estate as did Confed (73.8% of assets at its peak). Nevertheless, Burns was aided and abetted by a Board of Directors that was weak-willed and ill-informed as to the nature of Confed’s operations, and by other company officers who took Confed into businesses and investments, such as leasing and real estate, in which they had limited knowledge and expertise. For example, John Heard was a life-insurance expert who served as chairman of Confederation Trust despite admitting to Burns that he had no knowledge or understanding of its businesses. In another example, Confed’s system for tracking the flow of funds was so inadequate that internal attempts to carry out a forensic audit of Confed Treasury Services were abandoned because the system was so complex. None of the company officers were willing to stand up to CEO Burns on the important issues and say “this doesn’t make any sense” and so there was little internal opposition to increasingly risky investments, which were duly rubber-stamped by the Board.
The slow demise of Confed was not entirely invisible to the Government inspectors who were responsible for regulating financial institutions, but they operated in a culture in which “stuff that came up from the field would be muted by the time it got to Ottawa” (McQueen, p. 68) and so regulatory interventions were too little, too late. Confed’s plight was also quite evident to other insurance companies in Canada, but they stood to gain more from eliminating a competitor and picking up assets in Confed’s bankruptcy liquidation than they did in coming to Confed’s rescue.
3.4. Curragh Resources’ Westray Mine, Stellarton, Nova Scotia2 On May 9 1992, 26 miners were killed in an explosion at the Westray mine in Pictou County, Nova Scotia. This was not the first fatal accident in this coalfield, which had claimed over 650 lives before the Westray mine was even proposed.
The story started in 1987 when Curragh Resources Inc. created a subsidiary, Westray Coal, to operate a proposed coal mine that would create badly needed jobs in Plymouth Nova Scotia, a depressed area of the country. Curragh’s CEO had strong connections to government
2 A system dynamics model of this case can be found in Cooke (2003). A summary of the case is
provided here for ease of reference. The system dynamics analysis of this case had an important
influence on the overall development of the conceptual dynamic model presented here.
- 5 -

officials, which helped them to win a favorable contract from a publicly owned power company and favorable government loan guarantees to finance the mine, despite having had no prior experience operating coal mines. The mine had problems from the start, partly because of the technical difficulties inherent in the Pictou coal seam and partly because of Curragh taking shortcuts to get the mine into production as soon as possible. Problems included roof falls, accumulation of methane and coal dust, and unanticipated geological conditions.
Although workers complained about the safety conditions in the mine, management did not listen, and neither did government regulators. Some experienced workers quit because of the conditions in the mine, but most workers stayed because of desperation for employment. Some government inspectors had concerns about the mine, but their concerns went unheeded by their superiors. The government incentives and subsidies extended to Westray encouraged production at the expense of safety.
Prior to the explosion, the Westray mine had many incidents that could have claimed lives but instead ended up as production stoppages. Inevitably, a source of ignition combined with an accumulation of methane and coal dust caused the fatal explosion. In the words of public inquiry chairperson Richard (1996), this was a "predictable disaster".
3.5. Shell Chemical Company, Deer Park, Texas A power surge during a lightning storm on June 22, 1997 caused a transformer to fail at a Shell Chemical Company ethylene plant in Deer Park, near Houston, Texas. As on all such ethylene plants, there is a large gas compressor between the “hot side” and the “cold side” of the plant. During plant start-up after the power failure, this compressor tripped out several times before it eventually stabilized and ran smoothly. Whenever the compressor tripped out, a 36 inch swing check slammed shut. This large check valve was designed to prevent undesirable back flow through the compressor. Soon after start up, several people in the compressor area heard a loud “pop” and then the constant noise of a high pressure gas release, which ignited about four minutes after the initial release. Several people were injured in the explosion, but fortunately no one was killed as people evacuated the area as soon as they realized the size of the leak.
An investigation by EPA and OSHA (1998) showed that a “dowel pin” connecting the valve’s drive shaft to the valve disk had fractured and sheared off, allowing the high pressure gas in the process to blow the drive shaft out of the casing. The gas continued to escape at high velocity through the resulting hole. Surging of the compressor during start-up conditions caused the valve disk to repeatedly slam shut, creating high stresses on the dowel pin. Inadequate design of the valve caused the dowel pin to receive higher stresses than it was intended to have, and embrittlement by hydrogen in the process gas caused acceleration of stress-related fractures in the pin. The valve had not been subjected to regular maintenance inspections, so any deterioration in the condition of the valve had not been detected, and operating procedures did not require the operators to check the position of the valve before restarting the compressor, which may have indicated that something was wrong during the trips. Lessons learned from prior incidents at the same plant and at other locations, involving the same type of check valve, were not adequately identified, shared, or implemented. Coincidently, one of the prior incidents had occurred while a process hazard analysis (PHA) was being done. The PHA was resumed after the valves were repaired, but remarkably the PHA did not identify the risks associated with a shaft blow-out in these types of check valves.
- 6 -

3.6. September 11, 2001 Terrorist Attacks, USA This case is different from the previous ones in two important respects. First, the “operational system” is not part of a corporate entity, but rather it is part of the US economy as a whole. However, one could consider the relevant “operations” to be those of the US government agencies and the civil aviation industry. Second, the risk to the system is an external security threat from outside the system.
Chomsky (2001) presents what many people would consider to be a controversial unpatriotic view of the “9-11” attack as being not a terrorist act but rather an understandable response in kind to centuries of Western aggression towards non-Christians. However, one doesn’t have to agree with Chomsky’s views to recognize that the roots of the 9-11 attacks lie in the strong feelings among Islamic countries against the US and its policies in the Middle East. Attacks on the USS Cole, US embassies in Africa, and the prior terrorist attack on the World Trade Center in 1993 were just some of the pre-cursor incidents signaling a high risk of disaster. According to Rowley (2002), the activities of terrorist cells in the US were known to the CIA and FBI, but these agencies were unable to coordinate an effective response because the information systems and communication processes in and between local agency offices were poor. Rowley was a veteran agent who complained of the “climate of fear” and “pecking order” in the layers of bureaucracy that inhibited effective investigations and suppressed the concerns of low-level agents. However, because of the secrecy surrounding the activities of these agencies, we may never know the truth behind what really happened.
3.7. NOVA Chemicals Corporation, Decatur, Alabama Data for this case, which differs from the others because it tells a risk management story that ends in success rather than failure, was collected from on-site interviews with 10-12 people in plant operations, maintenance, quality control, safety and management. NOVA acquired the Decatur site as part of a major acquisition in 1990. As it turned out, the previous owners had neglected plant maintenance and capital spending over the previous fifteen years, which is quite common for such “discontinued operations.” Employees were poorly trained and had worked for many years under a hierarchical management style that had stifled their involvement. Although NOVA wanted to implement a more participative style of management, the site had made little progress during the first three years of NOVA ownership, with continuing poor safety performance, poor quality, frequent equipment break-downs and many customer complaints.
Senior management brought in a new site manager in 1994 after the site had hit “rock-bottom” with a very poor result from a NOVA corporate audit of process safety management. The new site manager knew that the first thing that had to change was management itself. Members of the site leadership team that couldn’t change were replaced. Changing leadership at the site sent a strong signal to all employees that the company was serious about performance improvement. The new leadership team set up an improvement process that started with employee involvement in developing the site mission statement. Leadership provided training and set clear expectations for each employee and then coached them based on the behaviors they observed. Celebration of employee “wins,” no matter how small, reinforced productive behaviors and moved the site closer to achieving its objectives. A virtuous circle emerged, in which the more employees were involved in problem-solving and trusted to do the right thing, the more improvement opportunities were identified and implemented.
In the four years after the performance improvement initiatives had been undertaken, the Decatur site did not have a lost time injury, had reduced minor injuries from 6-7 per year to 0-2
- 7 -

per year, increased production by 70%, improved on-stream time from 84% to 93% and improved climate survey results from 20% below norm to more than 10% above norm.
4. A Conceptual Model of Operational Risk The following sections describe several concepts, which when taken together will provide an integrated model of operational risk that applies to a wide range of types of operations. The goal is to find a theoretical model of operational risk that will apply reasonably well to all types of operations, whether in manufacturing or services. In other words, the theoretical framework should fit the failures at Barings Bank or Enron (financial collapse) just as well as it fits the failures at Union Carbide Bhopal (gas release) or Westray mine (coal dust/methane explosion).
4.1. Introducing the Model: A Stochastic, Dynamic View of Risk A socio-technical system is a system comprising both a social system and a technical system. The social system includes people, their attitudes and behaviors, and their interactions in a formal or informal organization. The technical system includes machines, computers or other forms of technology, and rules or procedures. An “operational system” is a type of socio-technical system constructed for the purpose of adding value in the process of transforming inputs into outputs. In the most general case, we could say that “operational risk” arises from the operation of a socio-technical system.
To understand the origins of operational risk, we can build on an analogy with the thermodynamic property of entropy made by Bar-Yam (1997) and Wolf (2001). In a thermodynamic system, the total number of possible states of the system φ is a function of the internal energy, the volume and the number of types of particles of the system. We may interpret the “internal energy” of a socio-technical system to be the overall activity level of the system A, as measured by number of transactions or tasks carried out per unit time. The “volume” of a socio-technical system might be simply interpreted as being its size S, which could be measured by a number of possible parameters such as enterprise value or replacement cost. The “number of types of particles” is a little more difficult to interpret, but could be construed as being a function of number of job types, the number of types of operations, the number of different technologies, and the number of locations at which operations are conducted. We will call this dimension the “diversity” of the system, D. Based on these analogies, we might expect that the “complexity” of a socio-technical system will be a function of its overall activity level, its size, and the diversity of its people and operations, i.e. system complexity ( )φgC = and
( )DSAf ,,=φ . This model can be extended further by recognizing that socio-technical systems have
dynamic complexity, meaning that their complexity changes over time. This can be modeled by interpreting the parameters A, S and D as being stochastic parameters whose values will follow a Brownian-type of motion with respect to time. Woo and Vicente (2003) have also used an analogy with Brownian motion to describe the migration of work practices towards the boundary of safety. Brownian motion is named after Robert Brown who found that particles of pollen in water are buffeted by water molecules, causing the pollen to move randomly in three-dimensional space. Many models in continuous time finance assume that freely-traded market prices are buffeted by “molecules” of information and actions of individual agents, causing market prices to move in a stochastic manner that resembles Brownian motion.
- 8 -

In the model presented here, we postulate that the operational system is an entity for which risk can be measured and represented on a scale of risk. However, the quantity of operational risk at any moment in time will be a random variable whose value depends on the values of the parameters of the human, technical, organizational and process characteristics of the operation and on the nature of the function by which these parameters are converted into risk. Since there are an enormous number of parameters that can affect operational risk, and since the values of these parameters can also change randomly in time, we suggest that the risk value for the operation as a whole will behave in a manner that is analogous to Brownian motion. Unlike standard Brownian motion, the variance of operational risk will not increase linearly with time because it is “tethered” or constrained by some of the system parameters and by the controls imposed on the system. The analogy with Brown’s observations would be that while the pollen moves around randomly within the confines of the water, no grains jump out of the test tube in which the water is confined. Thus, we might expect that operational risk will fluctuate in a Brownian motion-like manner until it goes outside a safety envelope or “zone of safety.” This safety envelope is a multi-dimensional construct, consisting of both system parameters and controls, which is somewhat analogous to the concept of control limits in statistical quality control. However, while the quality of a product might be adequately captured by a relatively small number of characteristics, the risks in an operational system might be described by perhaps thousands, if not millions, of characteristics. These risk characteristics may take many forms including tangible unsafe conditions that can be revealed by inspection, latent conditions that are not yet evident, or intangible risks embodied in the attitudes, behaviors or training of managers and employees.
Breaching of the safety envelope leads to the immediate generation of an incident or to an unsafe or latent condition that may lead to an incident later in time. We suggest that one can view an incident as “releasing potential energy” from the system, which can cause a range of losses depending on the size of release. The “potential energy” can be interpreted as an accident waiting to happen, or as a latent condition that is waiting for a triggering event to unleash its potential for loss. Once the energy is released, the system can “fail safe,” in which case it returns to a condition within acceptable limits of safety after corrective actions have been taken, or it can “fail unsafe,” in which case the condition of the system can further deteriorate. It is also possible that a latent condition for loss can be discovered by the operations team and corrective action taken before an incident occurs. These ideas are illustrated in the diagram shown in Figure 1.
Brownian-type Motion Safety
Envelope
FIGURE 1: A DYNAMIC, STOCHASTIC VIEW OF SYSTEM RISK
Incident or Corrective Action
Latent Condition
System Risk
Path through Time
Fail-safe and/or System Improvement
Fail-unsafe
- 9 -

This safety envelope concept was investigated by Marcus and Nichols (1999) in a case
, ng
Pic ptual model of risk that focuses on
her
.
t.
by ted
lest
FIGURE 2: A CONCEPTUAL MODEL OF OPERATIONAL RISK
study of two nuclear power plants. They found that organizational drift towards the edge of thesafety envelope was influenced by resource allocation decisions, whereby one of the plants which previously had outstanding operational performance moved closer to the edge of the safety envelope as resources were withdrawn over time. Other organizational characteristicssuch as resilience (see Wildavsky (1988)), are important for detecting and responding to warnisignals generated as the boundary of the safety envelope is approached.
4.2. Incorporating Feedback into the Model h, Loch, and De Meyer (2002) have proposed a conce
uncertainty, ambiguity and complexity in project management. Managing operational risk isultimately the same as managing project risk except that it deals with an ongoing operation ratthan a project of finite duration, and the outcome of value is not the successful completion of the project but rather the ongoing viability and safety of the operation. Putting together the ideas from the previous section, we will now present an overall conceptual model of operational riskOur model draws inspiration from early control theory/systems theory (see Bekey (1972) for example) and from the Pich, Loch, and De Meyer (2002) model of risk in project managemenOur model, which is summarized in Figure 2, incorporates the idea that the state of the operational system can be influenced by both factors of chance (states of the world) andactivities initiated by people acting within the system (operations decisions). It should be nothat all of the parameters in this model are either stochastic multi-dimensional variables or complex functions of these variables, which will be difficult to quantify for all but the simpof systems. Also, because we are dealing with an ongoing operation rather than a project with defined start and finish dates, operational risk can accumulate over long periods of time as a result of feedback, delays and misperceptions, and not just from chance events.
States of the World ω
3
3 This and all other figures are laid out for the benefit of readers who are not familiar with system
dynamics notation. A version of Figure 2 using the stock and flow notation of system dynamics is shown
in the Appendix. We leave it for the reader to verify that the two models are identical.
Operational System φ
States of the
Causal
MLinks (ω,φ)
Information Function η
ωt
φt
Operations Decisions α(yt)
yt
Activities At
True
True
Perceived StatesStates
Operational Performance O* = f(φ,ω)
Dynamic States Feedback
(Coupling)
- 10 -
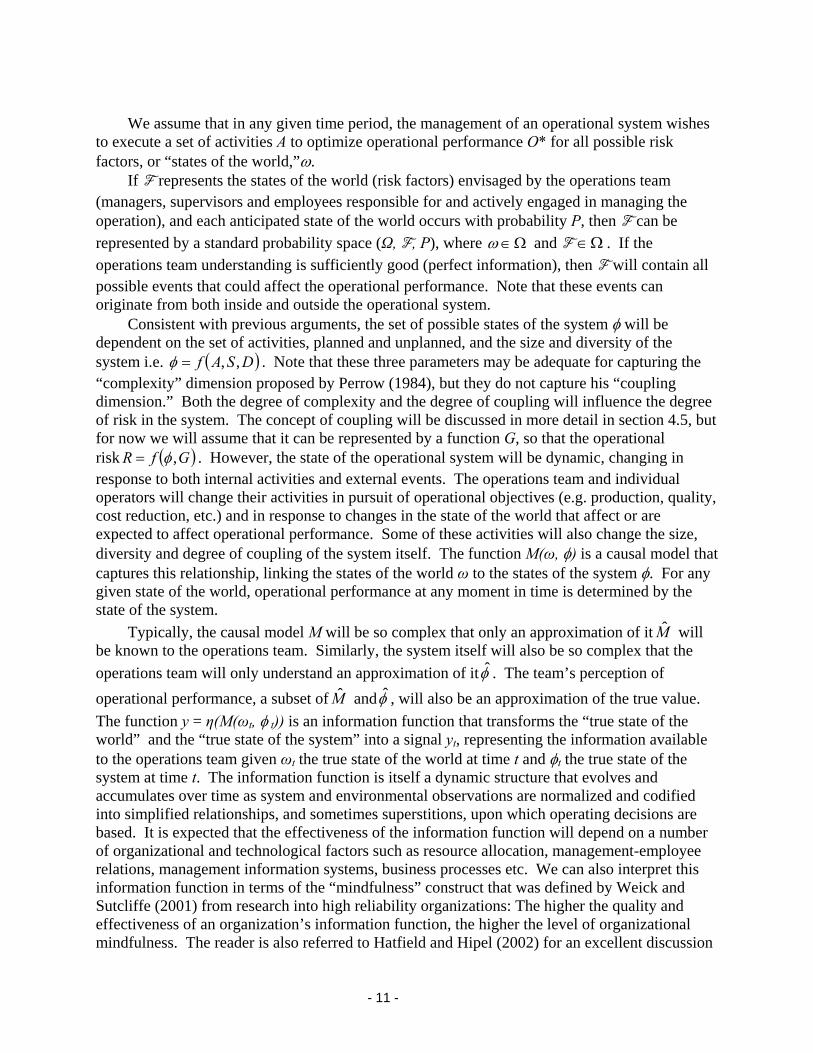
We assume that in any given time period, the management of an operational system wishes
to ex
world (risk factors) envisaged by the operations team (man e
ecute a set of activities A to optimize operational performance O* for all possible risk factors, or “states of the world,”ω.
If F represents the states of theagers, supervisors and employees responsible for and actively engaged in managing th
operation), and each anticipated state of the world occurs with probability P, then F can be represented by a standard probability space (Ω, F, P), where Ω∈ω and F Ω∈ . If the operations team understanding is sufficiently good (perfect in will conpossible events that could affect the operational performance. Note that these events can originate from both inside and outside the operational system.
Consistent with previous arguments, the set of possible stat
formation), then F tain all
es of the system φ will be dependent on the set of activities, planned and unplanned, and the size and diversity of the system i.e. ( )DSAf ,,=φ . Note that these three parameters may be adequate for capturing “complexity roposed by Perrow (1984), but they do not capture his “coupling dimension.” Both the degree of complexity and the degree of coupling will influence the deof risk in the system. The concept of coupling will be discussed in more detail in section 4.5, but for now we will assume that it can be represented by a function G, so that the operational risk ( )GfR ,
the
gree ” dimension p
φ= . However, the state of the operational system will be dynamic, changing response to both internal activities and external events. The operations team and individual operators will change their activities in pursuit of operational objectives (e.g. production, quacost reduction, etc.) and in response to changes in the state of the world that affect or are expected to affect operational performance. Some of these activities will also change the diversity and degree of coupling of the system itself. The function M(ω, φ) is a causal model thcaptures this relationship, linking the states of the world ω to the states of the system φ. For any given state of the world, operational performance at any moment in time is determined by the state of the system.
Typically, the c
in
lity,
size, at
ausal model M will be so complex that only an approximation of it M will be known to the operations team. Similarly, the system itself will also be so complex that the operations team will only understand an approximation of itφ . The team’s perception of operational performance, a subset of M andφ , will also be an approximation of the true vaThe function y = η(M(ωt, φ t)) is an information function that transforms the “true state of the world” and the “true state of the system” into a signal yt, representing the information availabto the operations team given ωt the true state of the world at time t and φt the true state of the system at time t. The information function is itself a dynamic structure that evolves and accumulates over time as system and environmental observations are normalized and codinto simplified relationships, and sometimes superstitions, upon which operating decisions are based. It is expected that the effectiveness of the information function will depend on a numbe
lue.
le
ified
r of organizational and technological factors such as resource allocation, management-employee relations, management information systems, business processes etc. We can also interpret this
nd nd
ellent discussion
information function in terms of the “mindfulness” construct that was defined by Weick aSutcliffe (2001) from research into high reliability organizations: The higher the quality aeffectiveness of an organization’s information function, the higher the level of organizational mindfulness. The reader is also referred to Hatfield and Hipel (2002) for an exc
- 11 -

of how groups with different mental models of the risk system can make quite different decisions.
The operations team has policies or “contingency plans” that update the set of operational activities based on current information about the state of the world, thus )( tt yA α= where α ithe policy function and At is the set of activities at time t. Like activities, the operations team chooses policies to maximize the performance function O*. Typically, the management team only plans for the major contingencies but monitors information signals for specific signs that new or upgraded contingency plans are needed. The value of the information function ismaximum p
s
the
nd the pol
it,
er e
t change the basic conceptual model. Thus, if there
erformance achievable under a set of activities guided by policy compared to the performance that could be achieved under a set of fixed activities or “standard operating procedures.” Note that it is the quality of both the information function a icy function that determines whether or not the organization will behave as a “high reliability organization”and be perceived as having a “safety culture.”
So far in this discussion we have assumed that the “operations team” acts as a cohesive unwhereas in practice this will rarely be the case. Not only will there be the usual conflicts and communication problems between “management” and “labor,” but also there will be many othdifferent organizational groups (departments, shift teams, etc.), each with their own uniquinformation functions and policy functions. However, the fact that the information and policy functions for the organization as a whole are actually a composite of the functions employed by the different organizational sub-groups does no
are N organizational sub-groups, the information received and activities performed by the
organization as a whole will be given by ( )( )∑=
=N
nttnt wMy
1
,φη and ∑=
ld but also from the dynamic complexity operational system, the complexity of the causal relationships between the states of the world
curity” ithin the “safety
env
he d if
=N
ntnt yA
1
)(α respectively.
These equations assume that the group activities and information functions are independent andtherefore additive for the organization as a whole. However, depending on the quality of inter-group relationships, there are likely to be synergies or interferences arising from group interactions. The nature of these relationships is left for further research.
Summarizing the proposed conceptual model, operational risk arises not only from the chance factors under each state of the wor within the
and the operational system, the quality of the information functions, the effectiveness of the policies that translate information into action, and the quality and effectiveness of the activities themselves. In the context of this model, commonly used terms such as “safety” and “secan be interpreted as being the states of the operational system which fall w
elope” discussed in the previous section. As the state of the operational system moves towards the boundary of the safety envelope, then safety will be preserved if the information functions and policy decisions are of sufficient quality to direct activities in a way that causes tsystem to move away from the boundary. With reference to Figure 1, safety will be preservelatent conditions are detected and corrected and the failures that do occur are either caught by “poka yokes” (fail-safe measures) or are of low enough severity to become instances for learningand system improvement.
4.3. Applying the Conceptual Model to Specific Cases The validity of the model shown in Figure 2 can be assessed qualitatively by how well it fits the facts reported in various case studies involving operational risk. For example, in the case of the space shuttle Challenger, the “state of the world” or risk factor outside the control of decision
- 12 -
makers or operators that led to the disaster was the low ambient temperature on the day of the launch. The causal links between the state of the world and the operational system included the effect of seal the joints in the
,
e
e of
s
this low temperature on the brittleness of the O-rings designed to id Rocket Boosters, budget constraints, and production pressures tSol o adhere to the launch
schedule. The state of the system resulting from the O-ring embrittlement was one in which there was a very high risk of a catastrophic fuel leak soon after launch. As was thoroughly documented by Vaughan (1996), the “information function” in place at NASA was a complex organizational structure and culture that normalized the risk assessments of previous O-ring failures and discounted or stifled the last-minute pleas by engineers to abort the launch. The output of this information function was a distorted view of the world, leading to a flawed set of policies in what Vaughan calls an “incremental descent into poor judgment.” In this case, theoperations team activities resulting from the flawed policies were the normal launch activitieswhich ultimately led to disaster.
The case of the space shuttle Challenger and other selected cases involving operational risk were analyzed in the framework of the proposed conceptual model and the results are summarized in Table 1. The case of the Sept 11, 2001 terrorist attacks on the United States illustrates the general applicability of the conceptual model. In this case, the “operational system” is that of the US government and its agencies. A reference source is given for each cascited, except for the last case, NOVA Chemicals’ Decatur plant, which is based upon primary data collection.
For all of the cases shown in Table 1, one can envision other circumstances or “states of the world” under which a catastrophic failure would not have occurred. For example, in the casthe space shuttle Challenger, if the fateful launch had taken place on a warmer day then a successful launch would have been just another event to reinforce the normalization process for the O-ring seal problem that the engineers had been studying for the previous ten years. Similarly, one can also recognize that different information or policy functions may lead to different sets of activities, and hence different outcomes, under the same states of the world. In terms of strategies for risk control, the model provides the important insight that since the operations team cannot change the states of the world, it should instead focus its attention on improving the quality of the information and the policy functions.
To further validate the general model, we will now show how the model can be applied to the cases discussed by Lewis (2003) which involved a mismatch between operational capabilitieand market requirements. Lewis’s capability/requirements “fit” model postulates that the line ofbest fit falls on a 45° line from the origin of a graph with the level of operational capability on one axis and the level of market requirements on the other (see Figure 3). Operational losses occur when there is a mismatch between requirements and capability. “External” losses occurwhen operational capabilities are less than market requirements, and “internal” losses occur when operational capabilities are more than market requirements.
- 13 -

TABLE 1: APPLYING THE MODEL TO SELECTED CASES OF OPERATIONAL RISK
Case & Reference
State of World
Causal Links State of System
Information Function
Decision
Space Shuttle Challenger Vaughan (1996)
Low ambient temperature
Effect of low temp. on O-rings, budget constraints, production pressures, poor communications
High risk of fuel leak soon after launch
Complex organizational structure and culture that downplayed risk and suppressed dissent
Ignored engineers’ concerns and proceeded with normal launch activities
Space Shuttle Columbia Columbia Accident Investigation Board (2003)
Large chunk of foam breaks off external fuel tank
Foam hits shuttle wing, no external inspection & repair of damage prior to re-entry, poor communications, production pressure
High risk of excessive heating of aluminum skin during re-entry
No significant change from the time of the Challenger disaster
Ignored engineers’ concerns and proceeded with normal re-entry activities
Barings Bank Zhang (1995)
Earthquake in Kobe, Japan
Earthquake causes sharp drop in the Japanese stock market
Trader Leeson has an unauthorized multi-$billion long position in the Nikkei index
No separation between trading and back-office functions, so Leeson was able to feed false information to head office
Lacking accurate information about the state of the system, management took no corrective action until it was too late
Confederation Life Insurance Co. McQueen (1996)
Inflated real estate prices
Pressure for growth, high returns in real estate in previous years encouraged more investment in this sector, weak regulatory oversight
Company’s investment in real estate peaked at 73.8% of assets
With no checks and balances, power was concentrated in a CEO who had a narrow view of the business and markets
Company made increasingly risky investments in the pursuit of growth
Curragh Resources’ Westray Mine Richard (1996)
Poor geological conditions in coal seam
Production pressures, weak regulatory oversight, incentives to create jobs
High concentrations of methane and coal dust in mine, poorly trained miners
Parent company had only “hard rock” mining experience, and saw all of Westray’s problems as production delays
Pressed for production right up to the time the mine exploded
Shell Chemical Co., Deer Park, TX EPA and OSHA (1998)
Operation start up after a power outage
Compressor surging under start-up conditions, check valve flapper repeatedly slams shut during surging
Inadequate valve design, compressor trip due to high vibration
Failure to learn from prior incidents, status of equipment not verified after unexpected trip
Proceeded with normal start up
9/11/2001 USA terrorist attacks Chomsky (2001)
Strong anti-US feelings in Islamic countries
Weak US reaction to prior attacks, sense of security within US borders
Complacency, fragmented intelligence, and poor systems integration between govt. agencies
See Challenger It was “business as usual” as concerns, if any, expressed by low-level officials were ignored
NOVA Chemicals Corporation, Decatur, AL
Acquisition of plant with poor record of performance
Leadership, culture, employee involvement,
Improvement over time in production, safety, quality and morale
Learning & training, performance management system, multi-source feedback
Held leadership accountable first, involved employees in dealing with performance issues
- 14 -

Level of market requirements
FIGURE 3: LEWIS (2003) MODEL OF CAPABILITY/REQUIREMENTS “FIT”
In terms of the proposed operational risk model, presented in Figure 4, “market
requirements” are a subset of the “state of the world” and operational capability is a subset of “state of the operational system.” Operational performance derives from the degree of “fit” between the state of the world (market requirements) and the state of the system (operational capability), and its calculation is a subset of the “information function.” This is an enhancement to Lewis’s model because it recognizes that operational performance is a subjective measure that depends on the quality of the information function. Figure 4 also recognizes that market requirements are never truly “known” as Lewis’ more deterministic model would suggest. The “causal links” component of the general model is still appropriate to this specific case because, for example, operational capability is often affected by product mix, and product mix is determined by market requirements. Note that in the completed model for this specific case, shown in Figure 4, states of the world (risk factors) other than market requirements are still in play and will randomly affect operational capability.
FIGURE 4: APPLYING THE GENERAL MODEL TO THE CASE OF LEWIS (2003)
Level of operational capability
Line of fitExternal loss
No loss
Internal loss
States of the System φ′′
States of the World ω′′
Market Requirements
ω′
Operational Capability φ′
Causal Links M(ω,φ)
True States
ωt
Information Function η
φt
Operations Decisions α(yt)
yt
Perceived States
Operational Performance O* = f(φ,ω)
True States
Dynamic Feedback
(Coupling)
Activities At
- 15 -

The operational situation resulting from an unexpected event or from a mismatch between
mar re
is
e Context of the Conceptual Model Coo t on the
d as
out
FIGURE 5: MODEL OF OPERATIONAL LOSS PROPAGATION
To help interpret incidents in the context of the conceptual model for operational risk, we
will n
s whose magnitude is governed by separate transformation functions.
ket requirements and operational capability can be interpreted as an “incident.” Since we adealing with a dynamic stochastic system, we would expect that “mismatch” situations will inevitably happen, despite the best efforts of the operational team to take corrective actions. Thus, the occurrence of “incidents” would be expected as a normal consequence of system operation, with severe incidents becoming “normal accidents.” The next section explores thconcept in more detail.
4.4. Interpreting Incidents in thke (2003a) argued that the long-term success of an organization depends in par
effectiveness of the organization’s system for learning from incidents. An incident is definean unexpected and unwanted event that represents a deviation from normal system behavior and which may or may not result in a loss. In terms of the conceptual model of operational risk, it can also be argued that an organization’s system for learning from incidents is an important component of the information function that the operations team uses to gather information abthe state of the operational system: the better the system for learning from incidents, the better the understanding of system performance.
Precursor
first introduce a model of operational loss propagation. Our model is an adaptation and extension of an operational risk model proposed by Lewis (2003). The extended model, showin Figure 5, contains the idea that “transformation functions” serve to moderate the translation ofincidents into actual operational losses and to govern the conversion of operational losses into other losses experienced by the various stakeholders. These other stakeholder losses are not linear, sequential events as suggested by Lewis (2003), but are complex interdependent event
Incident
Precursor Incident
Precursor Incident
Operational Loss
Operational
Customers
Direct Stakeholders Incident
Other Society Loss Environmental Factors or “States of the World”
Other
Other Boundary of Operational System
Loss
Loss
Time
= a transformation function= a causal relationship
Other precursor incidents
- 16 -

The proposed model in Figure 5 incorporates the observation that environmental factors beyond the boundary of the operational system can not only influence the occurrence and seve
rsor ture that
reference to
the i
ODEL OF OPERATIONAL R
In the context of perational system.”
Each incident contains information about the overall condition of the system, and this infor
effective
rity of incidents, but also influence the transformation functions and hence the size and nature of losses. For example, in the space shuttle Challenger disaster, the low ambient temperature on the day of the launch was an environmental factor that contributed to a pre-cuincident in the form of O-ring seals that were more brittle than expected. The NASA culnormalized risk and diminished the importance of expertise from low-ranking engineers was an information function that failed to convert the information from this and other pre-cursor incidents into informed decisions that could have prevented or mitigated the loss. Note that NASA’s culture is part of the operational system and not an environmental factor.
The conceptual model of operational risk shown in Figure 2 is fully compatible with theoperational loss propagation model shown in Figure 5 as we will now explain, with
ntegrated model shown in Figure 6.
Precursor
Incident
FIGURE 6: INTEGRATED M ISK
Figure 2, incidents can be interpreted as “states of the o
mation is integrated with information coming from the external environment and interpreted by the operations team according to their “information function” and then translated into activities according to their “policy function.” These activities can affect the strength of the causal relationships linking the network of precursor incidents and can also affect the transformation functions that determine the magnitude of operational and other losses arisingfrom an incident. This is why it is so important for an organization to have in place anmanagement system for learning from incidents as discussed in Cooke (2003a).
Precursor
Precursor
IncidentOperational
Incident
Incident
Other precursor
incidents
Incidents
Operational Loss
Other
Losses
System φ
States of the
States of the World ω
Incidents φ′
CausLinks
al M(ω,φ) Information
Function η
ωt
φt
Operations Decisions
α(y ) t
yt
Activities At
True States
True States
PerceivStates
Environmental F
ed actors ω′
Transformation Functions
Mitigation
Loss propag
Risk management
Prevention Recovery
ation
Operational Performance O* = f(φ,ω)
Dynamic Feedback (Coupling)
- 17 -

Using the terminology of risk control, the activities associated with weakening or eliminatingthe causal relationships between states of the world and incidents, and among pre
-cursor
inci
ed as
s to
tor
the framework of the con re
eral, set of
process. As the activities acting on the system acc
ement in ion of the
rporates two conceptual properties of socio-tech re capable
upled e,
nd
dents, can be interpreted as “prevention.” Those activities associated with minimizing the transformation of an operational incident into operational losses can be interpreted as “mitigation.” Finally, activities associated with minimizing the transformation of operational losses into other losses beyond the boundary of the operational system can be interpret“recovery.” Note that transformation functions can be interpreted as business processes, for example “emergency response” or “preventive maintenance,” so that the magnitude of the loswill depend on the quality and effectiveness of the business processes involved in respondingthe incident or loss. Note also that the effectiveness of the operations team in influencing the recovery process downstream from the operation itself depends on the effectiveness of other corporate functions such as sales management, crisis management, communications, and invesrelations, and the quality of the communication processes between them.
The observation by Haunschild and Sullivan (2002) that specialist airlines are better than generalist airlines at learning from complex incidents can be interpreted in
ceptual model as meaning that specialist airlines have a better information function or a mofocused “lens” through which to see the world. Standardized equipment and procedures allow the specialist airlines to focus more clearly on the improvement opportunities created by thorough analyses of complex incidents. Haunschild and Sullivan also observed that experiencing incidents with heterogeneous causes led to better learning for airlines in genwhich can be interpreted to mean that for a given set of information functions, a richersignals from the operational system leads to a better set of decisions and activities that are morelikely to cause system improvement over time.
The final insight to be drawn from the integrated model shown in Figure 6 is how system resilience grows from a continuous improvement
umulate over time they change the nature of the system and its response. This response is processed by the information function and the operations team makes a judgment as to whether or not the response represents improvement or deterioration in performance. Policies determining the choice of activities in subsequent time periods may serve to reinforce improvement or correct deterioration, thereby repeating the cycle of continuous improvsystem performance. This process, whereby system improvement comes from explorat“system response space,” creates resilience to future shocks that would not arise if operating policies and procedures remained static.
4.5. Extending the Model to include Perrow’s concept of “Coupling” The “normal accident” model of Perrow (1984) inco
nical systems: complexity and coupling. According to Perrow, complex systems aof exhibiting behaviors and interactions that are unplanned, unexpected and which may not be immediately visible or comprehensible. Coupling in a system refers to the degree of connectivity between components of the system. A tightly coupled system has more time-dependent processes, more invariant process sequences, and little slack. A loosely cosystem is resilient to delays or unexpected problems, provides many ways to get the job donand has catch-up capability. The preceding sections have dealt mostly with the concept of complexity, and this section will extend the model to include the concept of “coupling.”
With reference to Figure 5, the degree of coupling determines the rate at which events propagate through the network of pre-cursor incidents leading to an operational incident a
- 18 -

ulti reted
nts governing the cause and effect relationships in a dynamic model of a soc
t
,
a
tem would have multiple and/or stro ld
t of the
al
2000)
pling could be defined by l
of the operational system to the ction
her
mately to operational and other losses. This “degree of coupling” concept can be interpin a number of ways.
One way to operationalize this coupling concept is to interpret the degree of coupling as the size of the time consta
io-technical system. In other words, the rate of propagation of an effect from point A to pointB will be governed by the size of the time constants embedded in the structure of the system thaconnects point A to point B. For example, a “tightly” coupled system will have small time constants governing the rate of accumulation of stocks in the system. Conversely, a “loosely” coupled system will have large time constants. Note that “stocks” can include both tangiblestocks that characterize the technical system, such as inventory, assets or number of employeesand intangible stocks that characterize the social system, such as management commitment, organizational culture, or employee motivation. Cooke (2003b) and Melara, Sarriegi, Gonzalez, Sawicka, and Cooke (2003) show how dynamic models can be used to simulate the effect of number of competing causal relationships on the performance under risk in an operational system. Further research would be required to help quantify the intuition behind what is meantby “small” versus “large” time constants in a dynamic system.
A second way to represent the concept of coupling is by the number and strength of causal pathways connecting event A to event B. A tightly coupled sys
ng causal connections between the system components while a loosely coupled system woucontain few and/or weak causal relationships. Clearly, this representation provides for a continuum in which one extreme would be a system that behaves like a single component and the other extreme would be a system in which the behavior of each component is independenbehavior of other components. This model may be seen as being somewhat analogous to the “dynamic fault tree” approach used by Ren and Dugan (1998), Bouisseau and Bon (2003) and other probabilistic risk researchers for analyzing the reliability of computer systems. The norm“static” fault tree approach assumes that component failures are independent, whereas a “dynamic” fault tree allows for sequential dependencies between events. In a related application of this approach in a chemical processing operation, Aneziris, Papazoglou, and Lygerou (use Markov chain models to simulate the dynamic intermediate events occurring between the initial event and the ultimate catastrophic failure. Although the Markov model yields failure probabilities that are reported to be more accurate than those from static models, the systems analyzed by Aneziris et al. contain only the technical elements of the process and are thereforemuch simpler than the sociotechnical systems under consideration here.
Another interpretation of coupling might be to view it as a relative rather than an absolute property of the socio-technical system. In other words, the degree of cou
how fast the social system needs to respond in order to keep up with changes in the technicasystem so as to maintain control of the overall system. In other words, perhaps there are two dimensions of coupling: 1) the rate at which change propagates through the operational system and 2) the rate of information flow with respect to these changes.
This definition of coupling, shown in the conceptual model of Figure 2 as “Dynamic Feedback (Coupling)”, would compare the rate of change in states
rate at which the information about the operation is interpreted by the information funand acted upon by the operations team. In a tightly coupled system, the states of the operationalsystem would change at a rate that is orders of magnitude faster than the response time of the information-policy-decision feedback loop. In a loosely coupled system, the converse would be true. Note that a tightly coupled system could be converted to a loosely coupled system by eit
- 19 -

slowing down the rate of change of states in the operational system or by speeding up the rate at which information is processed and decisions are made.
Figure 7 below shows a simple model of coupling between two operations. The time delays represented by the double hatches on the links determine how closely coupled are the operations. If w
cidents, as discussed in Cooke (2003a), would benefit from a faster rate of information flow with respect to system
roblems and their resolution, thereby reducing the degree of coupling and hence the level of ope
y
ormal accident theory would suggest. Although events such as roof-falls, the bui
he
dination systems allow inventory reduction, and other improvements in ope er
n
stem performance. For example, Alles, Amershi,
Dat coupling)
Risk atOperation 1
Risk atOperation 2
Changes in Actions andDecisions at Operation 1
e assume a one way flow of risk propagation from Operation 1 to Operation 2, a slower communication feedback time can lead to a substantially higher risk level at Operation 2.
Diagram of Risk Coupling
+
+
Communication ofDownstream Effects
+
-
B
This demonstrates that an organization that effectively learns from in
Risk at Operation 260
45
30
15
00 2 4 6 8 10 12 14 16 18 20 22 24 26 28 30
Time (Month)
Risk at Operation 2 : Communication Time 5x Change TimeRisk at Operation 2 : Communication Time = Change Time
FIGURE 7: A SIMPLE MODEL OF COUPLING
prational risk. This insight about coupling being a relative property of a system may help to explain wh
complex failures occur even in “loosely coupled” systems like the Westray mine, which is contrary to what n
ld-up of methane gas, the deterioration in “stone-dusting,” and disregard for other safety procedures occurred slowly over time, the proposed theory of coupling would suggest that tinformation and policy-decision systems used by the operations team were too slow to respond tothe growing evidence of unsafe conditions in the mine. In other words, by their lack of responsiveness, management turned what would otherwise be a loosely coupled system into a tightly coupled system.
Another example of how better information flow allows for tighter coupling of the operational system can be found in supply chain management. Namely, the use of “point of sale” data and flow coor
rational performance, as a result of faster and more accurate transmission of customdemand data to upstream members of the supply chain. Sahin and Robinson (2002) provide aextensive review of the literature in this area.
One would expect the theoretical dimensions of coupling to be consistent with the implications of Just in Time (JIT) production theory, which suggests that tight coupling providesan incentive for improvements in production sy
ar, and Sarkar (2000) provide empirical evidence that lower inventories (i.e. tighter“improve workers’ ability to identify and isolate the underlying causes of defective production
- 20 -

by providing instantaneous, context-specific feedback about manufacturing problems.” Besides this information role, Alles et al. found that lower inventories (i.e. tighter coupling) gave workers an incentive to think more creatively about ways to improve process reliability and yield. At first glance, this result seems to be inconsistent with what we have discussed so far about the concept of coupling. However, the JIT result can be explained by considering the two dimensions of coupling as follows:
1. The manufacturing operations considered by Alles et al. were characterized as “worker-paced line flow.” In Perrow’s terminology, the processes would be considered lcoupled. Using the two-dime
oosely nsional definition under discussion here, changes would be
2.
ry caused an improvement in the information function.
r
Ind
improv h station (which may be limited in continuous flow settings such as harmaceuticals and chemicals).” However, the two-dimensional theory of coupling would
sug n system, think
se ideas about coupling might be incorporated into dynamic models of r
avior
nical
This paper has presented a conceptual model of operational risk which suggests that risks arise arket requirements as proposed by reated by the information
tem” re
expected to propagate through the operational system only slowly and to remain under the control of the worker.
Alles et al. found that reducing inventory caused a faster rate of information flow and a greater incentive for worker innovation. In the terminology of the conceptual model in Figure 2, reducing inventoFurthermore, the incentive effect on the workers is consistent with the fact that the workers are part of the feedback loop depicted in Figure 2. The workers make many of the quality improvement decisions and carry out the activities that improve system performance. Lower inventories cause this feedback loop to operate at a much fastecycle time.
eed, Alles et al. acknowledge that their result holds because “there is scope for ement at eac
pgest that improvements could be made in continuous flow settings if the informatio
policy decisions and activities could respond at fast enough rates. While it is intuitive tothat a tightly coupled system could have a fast information system, it is the visibility of this information and the speed at which decisions are made and actions taken that will determine the level of operational risk.
This discussion has shown that Perrow’s concept of “coupling” has value in helping to explain the risk behavior of operational systems. However, further research is needed to determine how some of the
isk in operational systems. The challenge with developing such models, apart from the problem of gathering reliable data, is in how to incorporate human and organizational behfactors into the models. Ensuring system integrity will remain an extremely difficult problem tosolve by technical methods alone, and so operations managers must always supplement techcontrols with managerial methods and strategies for risk control, both formal and informal.
5. Conclusions and Direction of Future Research
not just from a mismatch between operational capability and mLewis (2003). Risks also arise from the filtering or distortion cfunction or “lens” through which the operations team (management and employees) view the state of the operation and its environment, and from the effectiveness of the policies that translate this information into activities performed on the operational system. The “operational sysincludes the equipment, people, business processes and systems, tangible and intangible, that a
- 21 -

put in place for conducting the operation. The activities performed on the operational system change it for the better or for the worse and the effects of these changes are interpreted through the lens of the information function in a continuous feedback loop. The operational risks generated by this process are dynamic and so are the controls that the operations team puts in place. The operational system can be visualized as moving stochastically in time through an “envelope of safety,” breaches of which will result in latent or unsafe conditions and incidvarying severity.
The usefulness of the proposed conceptual model is that it captures the modern view of risas being a subjective phenomenon in the eye of the beholder and that it shows how actions taken as a result of decis
ents of
k
ions based on this subjective view operate through feedback loops to change bot
l
Alles M., Amershi A., Datar S., Sarkar R. 2000. Information and incentive effects of inventory in
JIT production. Management Scien 28-1544.
Management 16(4) 341-359.
s
the Process Industries 13 153-165.
Bar-Ya
Bekey G. A. 1972. The human operator in control systems, in Beishon J, Peters G (eds): Systems
rkov processes. Reliability Engineering and System Safety 82 149-163.
Choms
h the risk in the system and the perception of that risk. The model presents a “system view” of risk that is validated by the characteristics of several well known cases of operational risk failure. An example of a success story that also fits the same conceptual model was found in thecase of safety and production improvements at NOVA Chemicals’ Decatur site. Thus, the modefits both successes and failures, which is consistent with a feature of feedback loops in complex systems whereby they can often operate in two ways, one being a “vicious” circle resulting in failure, the other being a “virtuous” circle resulting in success. Also, there are often structures in these systems called “tipping points,” as discussed by Repenning and Sterman (2001), that can shift the virtuous/vicious cycle from one mode to another.
The concepts presented in this paper have suggested several approaches to us for operational risk control. In future research, we intend to develop these ideas into an integrated risk control framework.
References
ce 46(12) 15
Amundson S. D. 1998. Relationships between theory-driven empirical research in operations management and other disciplines. Journal of Operations
Aneziris O. N., Papazoglou I. A., Lygerou V. 2000. Dynamic safety analysis of process systemwith an application to a cryogenic ammonia storage tank. Journal of Loss Prevention in
m Y. 1997. Dynamics of complex systems. Perseus Books, Reading, Massachusetts.
Behaviour. Harper & Row, London, UK.
Bouisseau M., Bon J.-L. 2003. A new formalism that combines advantages of fault-trees and Markov models: Boolean logic driven Ma
ky, N. 2001. 9-11. Seven Stories Press, New York.
- 22 -

Columbia Accident Investigation Board 2003. Report on the Columbia Space Shuttle Accident. U.S. Government Printing Office, Washington D.C.
Cooke (ed): From modeling to managing security - a system dynamics approach. Norwegian Academic Press, Kristiansand,
Cooke D. L. 2003b. A system dynamics analysis of the Westray mine disaster. System Dynamics Review 19(2) 139-166.
EPA and OSHA 1998. EPA/OSHA Joint Chemical Accident Investigation Report - Shell Chemical Company, Deer Park, Texas. EPA/OSHA Joint Chemical Accident
Hatfiel 2(6) 1043-1057.
nd incidents on airlines' learning. Administrative Science Quarterly 47 609-643.
Lewis M l model of operational risk. Journal of Operations Management 21 205-224.
Marcus nusual events. Organization Science 10(4) 482-499.
McQue life?: The inside story. McClelland & Stewart Inc., Toronto.
Melara, C., Sarriegi, J. M., Gonzalez, J. J., Sawicka, A., and Cooke, D. L. 2003. Modeling insider attacks to information systems. 21st International Conference of the System
Meredith J. 1993. Theory building through conceptual methods. International Journal of Operations & Production Management 13(5) 3-11.
Perrow .
biguity and complexity in project management. Management Science 48(8) 1008-1023.
Reason ew York.
ic fault trees. IEEE Transactions on Reliability 47(3) 234-244.
Repenning N. P., Sterman J. D. 2001. Nobody ever gets credit for fixing problems that never happened: creating and sustaining process improvement. California Management Review 43(4) 64-88.
D. L. 2003a. Learning from incidents, in Gonzalez JJ
Norway. 75-108.
Investigation Report - Shell Chemical Company, Deer Park, Texas,
d A. J., Hipel K. W. 2002. Risk and Systems Theory. Risk Analysis 2
Haunschild P. R., Sullivan B. N. 2002. Learning from complexity: Effects of prior accidents a
. A. 2003. Cause, consequence and control: towards a theoretical and practica
A. A., Nichols M. L. 1999. On the edge: Heeding the warnings of u
en, R. 1996. Who killed confederation
Dynamics Society, New York.
C. 1984. Normal Accidents. Basic Books, New York
Pich M. T., Loch C. H., De Meyer A. 2002. On uncertainty, am
, J. 1990. Human Error. Cambridge University Press, N
Ren Y., Dugan J. B. 1998. Design of reliable systems using static & dynam
- 23 -

Report of the Presidential Commission on the Space Shuttle Challenger Accident 1986. Washington, D.C.
Richard, K. P. 1996. Report of the Westray Mine Public Inquiry. Province of Nova Scotia.
Rowley, C. letter to FBI Director Robert Mueller, Time Magazine, May 21, 2002.
: Review, implications, and directions for future research. Decision Sciences 33(4) 505-
and
Stewart D. M., Grout J. R. 2001. The human side of mistake-proofing. Production and
Vaughan, D. 1996. The Challenger Launch Decision: Risky Technology, Culture and Deviance
Weick, K. E. and Sutcliffe, K. M. 2001. Managing the Unexpected: Assuring High Performance
Wiers V. C. S., van der Schaaf T. W. 1997. A framework for decision support in production
Wildavsky, A. 1988. Searching for safety. Transaction Publishers, New Brunswick, NJ.
Wolf F etrochemical plants and refineries. Production and Operations Management 10(3) 292-305.
Woo D. M., Vicente K. J. 2003. Sociotechnical systems, risk management, and public health:
g
Sahin F., Robinson E. P. 2002. Flow coordination and information sharing in supply chains
536.
Starr M. K. 2001. Safety and security: critical qualities call for refocusing POM. Production Operations Management 10(4) 361-362.
Operations Management 10(4) 440-459.
at NASA. University of Chicago Press, Chicago.
in an Age of Complexity. Jossey-Bass, San Francisco.
scheduling tasks. Production Planning & Control 8(6) 533-544.
. G. 2001. Operationalizing and testing normal accident theory in p
comparing the North Battleford and Walkerton outbreaks. Reliability Engineering and System Safety 80 253-269.
Zhang, P. G. 1995. Barings Bankruptcy and Financial Derivatives. World Scientific PublishinCompany, Singapore.
- 24 -

Appendix: A Conceptual Model of Operational Risk (Figure 2) Using System Dynamics Notation The model shown in Figure 2 can be easily transformed into the system dynamics model shown in the diagram below (constructed using Vensim):
States of theWorld
RandomEvents
States of theOperational
System
CausalLinks
OperationalPerformance Information
Function
OperationsActivities
OperationsDecisions
DynamicCoupling
States of the world and states of the operational system are both level variables. The states of the world change randomly, causing the states of the operational system to also change randomly depending on the number and nature of the causal links between them. If there are i states of the world, j states of the operation and k causal links between them, where i, j and k are very large numbers, then system complexity will be enormous. The states of the operational system are also changed by operations activities directed by operations decisions. Operations decisions are guided by the “information function,” which is the operations team’s perception of the states of the world and of the operational system. The speed at which this feedback loop operates determines the degree of dynamic coupling that the system exhibits.
- 25 -