
A Conceptual Introduction to Hamiltonian Monte Carlo · A Conceptual Introduction to Hamiltonian...
60
A Conceptual Introduction to Hamiltonian Monte Carlo Michael Betancourt Abstract. Hamiltonian Monte Carlo has proven a remarkable empirical success, but only recently have we begun to develop a rigorous under- standing of why it performs so well on difficult problems and how it is best applied in practice. Unfortunately, that understanding is con- fined within the mathematics of differential geometry which has limited its dissemination, especially to the applied communities for which it is particularly important. In this review I provide a comprehensive conceptual account of these theoretical foundations, focusing on developing a principled intuition behind the method and its optimal implementations rather of any ex- haustive rigor. Whether a practitioner or a statistician, the dedicated reader will acquire a solid grasp of how Hamiltonian Monte Carlo works, when it succeeds, and, perhaps most importantly, when it fails. Michael Betancourt is a research scientist in the Applied Statistics Center at Columbia University. Much of this review was completed as a Research Fellow at the Centre for Research in Statistical Methodology, University of Warwick, Coventry CV4 7AL, UK (e-mail: [email protected]). 1 arXiv:1701.02434v1 [stat.ME] 10 Jan 2017
Transcript of A Conceptual Introduction to Hamiltonian Monte Carlo · A Conceptual Introduction to Hamiltonian...

A Conceptual Introduction toHamiltonian Monte CarloMichael Betancourt
Abstract. Hamiltonian Monte Carlo has proven a remarkable empiricalsuccess, but only recently have we begun to develop a rigorous under-standing of why it performs so well on difficult problems and how itis best applied in practice. Unfortunately, that understanding is con-fined within the mathematics of differential geometry which has limitedits dissemination, especially to the applied communities for which it isparticularly important.
In this review I provide a comprehensive conceptual account of thesetheoretical foundations, focusing on developing a principled intuitionbehind the method and its optimal implementations rather of any ex-haustive rigor. Whether a practitioner or a statistician, the dedicatedreader will acquire a solid grasp of how Hamiltonian Monte Carlo works,when it succeeds, and, perhaps most importantly, when it fails.
Michael Betancourt is a research scientist in the Applied Statistics Center at ColumbiaUniversity. Much of this review was completed as a Research Fellow at the Centre forResearch in Statistical Methodology, University of Warwick, Coventry CV4 7AL, UK(e-mail: [email protected]).
1
arX
iv:1
701.
0243
4v1
[st
at.M
E]
10
Jan
2017

2 BETANCOURT
CONTENTS
1 Computing Expectations By Exploring Probability Distributions . . . . . . . . . 31.1 Computing Expectations in Practice . . . . . . . . . . . . . . . . . . . . . . 41.2 Parsimonious Expectation Computation . . . . . . . . . . . . . . . . . . . . 51.3 The Geometry of High-Dimensional Spaces . . . . . . . . . . . . . . . . . . 61.4 The Geometry of High-Dimensional Probability Distributions . . . . . . . . 7
2 Markov Chain Monte Carlo . . . . . . . . . . . . . . . . . . . . . . . . . . . . . . 82.1 Estimating Expectations with Markov Chains . . . . . . . . . . . . . . . . . 92.2 Ideal Behavior . . . . . . . . . . . . . . . . . . . . . . . . . . . . . . . . . . 112.3 Pathological Behavior . . . . . . . . . . . . . . . . . . . . . . . . . . . . . . 132.4 The Metropolis-Hastings Algorithm . . . . . . . . . . . . . . . . . . . . . . . 15
3 The Foundations of Hamiltonian Monte Carlo . . . . . . . . . . . . . . . . . . . . 163.1 Informing Effective Markov Transitions . . . . . . . . . . . . . . . . . . . . 173.2 Phase Space and Hamilton’s Equations . . . . . . . . . . . . . . . . . . . . . 223.3 The Idealized Hamiltonian Markov Transition . . . . . . . . . . . . . . . . . 26
4 Efficient Hamiltonian Monte Carlo . . . . . . . . . . . . . . . . . . . . . . . . . . 264.1 The Natural Geometry of Phase Space . . . . . . . . . . . . . . . . . . . . . 274.2 Optimizing the Choice of Kinetic Energy . . . . . . . . . . . . . . . . . . . . 304.3 Optimizing the Choice of Integration Time . . . . . . . . . . . . . . . . . . 32
5 Implementing Hamiltonian Monte Carlo in Practice . . . . . . . . . . . . . . . . 355.1 Symplectic Integrators . . . . . . . . . . . . . . . . . . . . . . . . . . . . . . 375.2 Correcting for Symplectic Integrator Error . . . . . . . . . . . . . . . . . . . 385.3 Optimal Choice of Symplectic Integrator . . . . . . . . . . . . . . . . . . . . 41
6 The Robustness of Hamiltonian Monte Carlo . . . . . . . . . . . . . . . . . . . . 436.1 Diagnosing Poorly-Chosen Kinetic Energies . . . . . . . . . . . . . . . . . . 446.2 Diagnosing Regions of High Curvature . . . . . . . . . . . . . . . . . . . . . 446.3 Limitations of Diagnostics . . . . . . . . . . . . . . . . . . . . . . . . . . . . 45
7 Conclusion . . . . . . . . . . . . . . . . . . . . . . . . . . . . . . . . . . . . . . . 468 Acknowledgements . . . . . . . . . . . . . . . . . . . . . . . . . . . . . . . . . . . 47A Technical Details of Practical Implementations . . . . . . . . . . . . . . . . . . . 47
A.1 Notation . . . . . . . . . . . . . . . . . . . . . . . . . . . . . . . . . . . . . . 48A.2 Static Implementations . . . . . . . . . . . . . . . . . . . . . . . . . . . . . . 48A.3 Efficient Static Implementations . . . . . . . . . . . . . . . . . . . . . . . . 50A.4 Dynamic Implementations . . . . . . . . . . . . . . . . . . . . . . . . . . . . 55A.5 The No-U-Turn Sampler and the Current State of Stan . . . . . . . . . . . 58
References . . . . . . . . . . . . . . . . . . . . . . . . . . . . . . . . . . . . . . . . . . 59
A CONCEPTUAL INTRODUCTION TO HAMILTONIAN MONTE CARLO 3
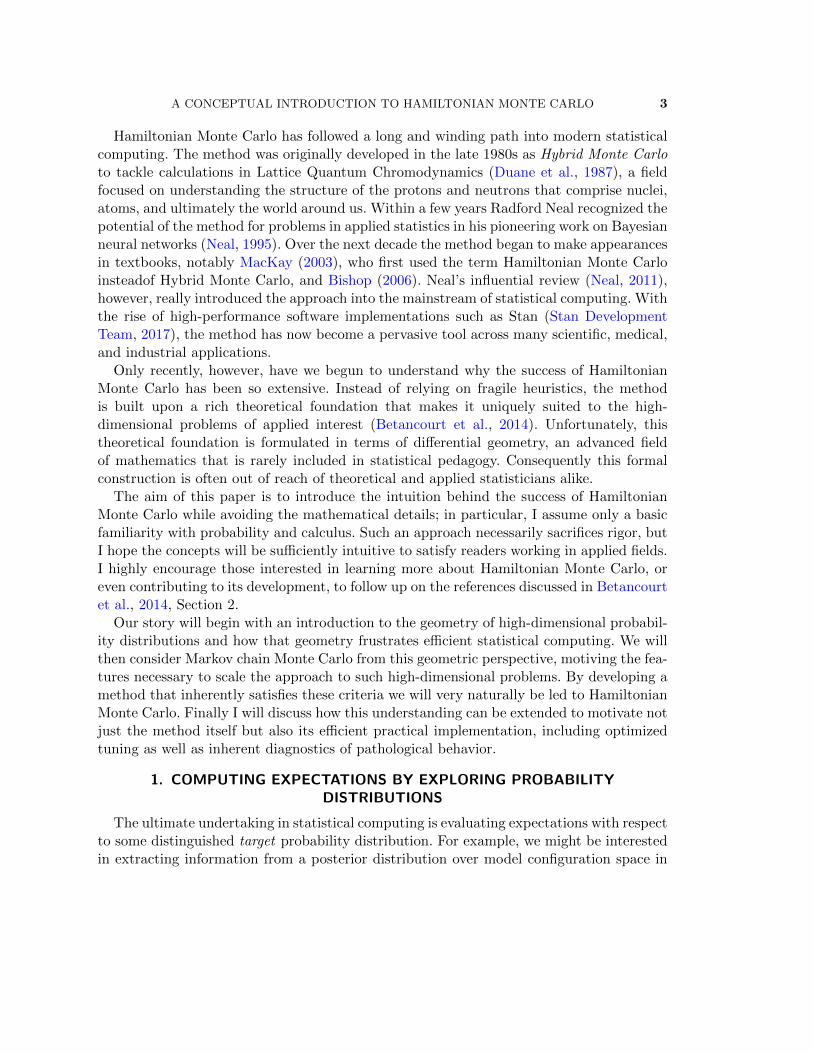
Hamiltonian Monte Carlo has followed a long and winding path into modern statisticalcomputing. The method was originally developed in the late 1980s as Hybrid Monte Carloto tackle calculations in Lattice Quantum Chromodynamics (Duane et al., 1987), a fieldfocused on understanding the structure of the protons and neutrons that comprise nuclei,atoms, and ultimately the world around us. Within a few years Radford Neal recognized thepotential of the method for problems in applied statistics in his pioneering work on Bayesianneural networks (Neal, 1995). Over the next decade the method began to make appearancesin textbooks, notably MacKay (2003), who first used the term Hamiltonian Monte Carloinsteadof Hybrid Monte Carlo, and Bishop (2006). Neal’s influential review (Neal, 2011),however, really introduced the approach into the mainstream of statistical computing. Withthe rise of high-performance software implementations such as Stan (Stan DevelopmentTeam, 2017), the method has now become a pervasive tool across many scientific, medical,and industrial applications.
Only recently, however, have we begun to understand why the success of HamiltonianMonte Carlo has been so extensive. Instead of relying on fragile heuristics, the methodis built upon a rich theoretical foundation that makes it uniquely suited to the high-dimensional problems of applied interest (Betancourt et al., 2014). Unfortunately, thistheoretical foundation is formulated in terms of differential geometry, an advanced fieldof mathematics that is rarely included in statistical pedagogy. Consequently this formalconstruction is often out of reach of theoretical and applied statisticians alike.
The aim of this paper is to introduce the intuition behind the success of HamiltonianMonte Carlo while avoiding the mathematical details; in particular, I assume only a basicfamiliarity with probability and calculus. Such an approach necessarily sacrifices rigor, butI hope the concepts will be sufficiently intuitive to satisfy readers working in applied fields.I highly encourage those interested in learning more about Hamiltonian Monte Carlo, oreven contributing to its development, to follow up on the references discussed in Betancourtet al., 2014, Section 2.
Our story will begin with an introduction to the geometry of high-dimensional probabil-ity distributions and how that geometry frustrates efficient statistical computing. We willthen consider Markov chain Monte Carlo from this geometric perspective, motiving the fea-tures necessary to scale the approach to such high-dimensional problems. By developing amethod that inherently satisfies these criteria we will very naturally be led to HamiltonianMonte Carlo. Finally I will discuss how this understanding can be extended to motivate notjust the method itself but also its efficient practical implementation, including optimizedtuning as well as inherent diagnostics of pathological behavior.
1. COMPUTING EXPECTATIONS BY EXPLORING PROBABILITYDISTRIBUTIONS
The ultimate undertaking in statistical computing is evaluating expectations with respectto some distinguished target probability distribution. For example, we might be interestedin extracting information from a posterior distribution over model configuration space in

4 BETANCOURT
Bayesian inference, or computing coverage of an estimator with respect to the likelihoodover data space in frequentist statistics. Here we will be agnostic, considering only a targetdistribution, π, on a D-dimensional sample space, Q, and the corresponding expectationsof functions, Eπ[f ].
Probability distributions, and the corresponding expectations, are rather abstract ob-jects, however, and if we want to use them in practice then we need a more explicit meansof specifying them. Here we will assume that the sample space is smooth, in which casethat we can represent the target distribution with a probability density function and expec-tations as integrals. Care must be taken, however, as this representation hides some of themore subtle behaviors of high-dimensional spaces that are critical towards understandinghow to compute these integrals, and hence the desired expectations, efficiently.
1.1 Computing Expectations in Practice
We begin by assuming that the target sample space, Q, can be parameterized by thereal numbers such that every point q ∈ Q can be specified with D real numbers. Given aparameter space, Q, we can then specify the target distribution as a smooth probabilitydensity function, π(q), while expectations reduce to integrals over parameter space,
Eπ[f ] =
∫Q
dq π(q) f(q) .
Parameterizations are not unique: we can always take another parameterization, Q′,over which we specify the target distribution with a different probability density function,π′(q′), while expectations reduce to the new integral,
Eπ[f ] =
∫Q′
dq′ π(q′)f(q′).
Critically, however, the expectations values themselves are invariant to any particular choiceof parameterization, so the integrals must be equal,
Eπ[f ] =
∫Q
dq π(q)f(q) =
∫Q′
dq′ π′(q′)f(q′).
In this review we will consider only a single parameterization for computing expectations,but we must be careful to ensure that any such computation does not depend on theirrelevant details of that parameterization, such as the particular shape of the probabilitydensity function.
Once we have chosen a parameterization, the abstract expectation becomes the concreteintegral. Unfortunately, for any nontrivial target distribution we will not be able to evaluatethese integrals analytically, and we must instead resort to numerical methods which onlyapproximate them. The accuracy of these approximations, and hence the utility of anygiven algorithm, however, is limited by our finite computational power.

A CONCEPTUAL INTRODUCTION TO HAMILTONIAN MONTE CARLO 5
For a method to scale to the complex problems at the frontiers of applied statistics,it has to make effective use of each and every evaluation of the target density, π(q), andrelevant functions, f(q). Optimizing these evaluations is a subtle problem frustrated by thenatural geometry of probability distributions, especially over high-dimensional parameterspaces.
1.2 Parsimonious Expectation Computation
One way to ensure computational inefficiency is to waste computational resources eval-uating the target density and relevant functions in regions of parameter space that havenegligible contribution to the desired expectation. In order to avoid these regions, and focusour computation only on significant regions of parameter space, we first need to identifyhow the target density and target function contribute to the overall expectation.
Because integration is a linear operation, scaling the integrand proportionately scalesthe integral. Consequently, a common intuition is to focus on regions where the integrandis largest. This intuition suggests that we consider regions where the target density andtarget function take on their largest values.
In practice we often are interested in computing expectations with respect to many targetfunctions, for example in Bayesian inference we typically summarize our uncertainty withboth means and variances, or multiple quantiles. Any method that depends on the specificdetails of any one function will then have to be repeatedly adjusted for each new functionwe encounter, expanding a single computational problem into many. Consequently, fromhere on in we will assume that any relevant function is sufficiently uniform in parameterspace that its variation does not strongly effect the integrand. Keep in mind, however,that if only a single expectation is in fact of interest then exploiting the structure of thatfunction can provide significant improvements (Mira, Solgi and Imparato, 2013; Oates,Girolami and Chopin, 2016).
This assumption implies that the variation in the integrand is dominated by the targetdensity, and hence we should consider the neighborhood around the mode where the densityis maximized. This intuition is consistent with the many statistical methods that utilizethe mode, such as maximum likelihood estimators and Laplace approximations, althoughconflicts with our desire to avoid the specific details of the target density. Indeed, thisintuition is fatally naive as it misses a critical detail.
Expectation values are given by accumulating the integrand over a volume of parameterspace and, while the density is largest around the mode, there is not much volume there.To identify the regions of parameter space that dominate expectations we need to considerthe behavior of both the density and the volume. In high-dimensional spaces the volumebehaves very differently from the density, resulting in a tension that concentrates thesignificant regions of parameter space away from either extreme.

6 BETANCOURT
(a) (b) (c)
Fig 1. To understand how the distribution of volume behaves with increasing dimension we can consider arectangular partitioning centered around a distinguished point, such as the mode. (a) In one dimension therelative weight of the center partition is 1/3, (b) in two dimensions it is 1/9, (c) and in three dimensions itis only 1/27. Very quickly the volume in the center partition becomes negligible compared to the neighboringvolume.
1.3 The Geometry of High-Dimensional Spaces
One of the characteristic properties of high-dimensional spaces is that there is muchmore volume outside any given neighborhood than inside of it. Although this may at firstappear strange, we can build intuition to demystify this behavior by considering a fewsimple cases.
For example, consider partitioning parameter space into rectangular boxes centeredaround the mode (Figure 1). In one dimension there are only two partitions neighbor-ing the center partition, leaving a significant volume around the mode. Adding one moredimension, however, introduces eight neighboring partitions, and in three dimensions thereare already 26. In general there are 3D−1 neighboring partitions in a D-dimensional space,and for even small D the volume neighboring the mode dominates the volume immediatelyaround the mode. This pattern only amplifies if we consider more partitions further awayfrom the mode that multiply even faster.
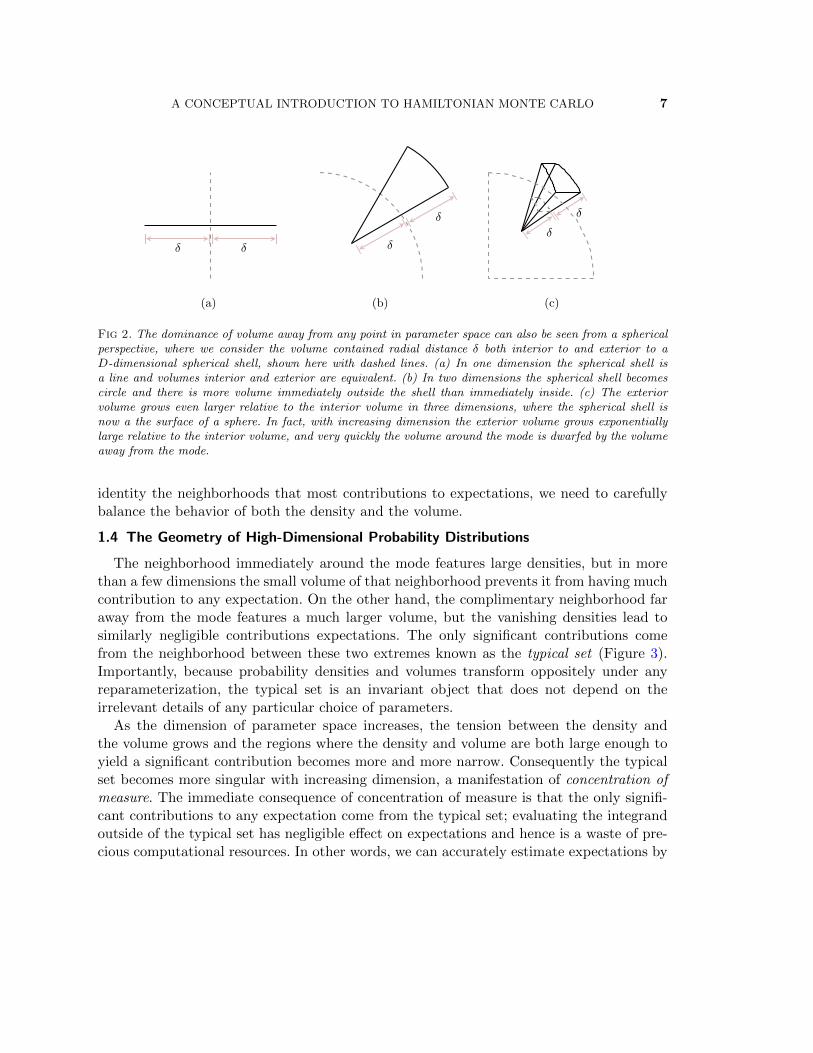
Alternatively, we can take a spherical view of parameter space and consider the relativevolume a distance δ inside and outside of a spherical shell (Figure 2). In one dimension theinterior and exterior volumes are equal, but in two and three dimensions more and morevolume concentrates on the outside of the shell. Centering the shell at the mode we cansee once again that the volume in any neighborhood containing the mode becomes moreand more negligible as the dimension of the parameter space increases.
Generically, then, volume is largest out in the tails of the target distribution awayfrom the mode, and this disparity grows exponentially with the dimension of parameterspace. Consequently, the massive volume over which we integrate can compensate to givea significant contribution to the target expectation despite the smaller density. In order to
A CONCEPTUAL INTRODUCTION TO HAMILTONIAN MONTE CARLO 7
δ δ
(a)
δ
δ
(b)
δ
δ
(c)
Fig 2. The dominance of volume away from any point in parameter space can also be seen from a sphericalperspective, where we consider the volume contained radial distance δ both interior to and exterior to aD-dimensional spherical shell, shown here with dashed lines. (a) In one dimension the spherical shell isa line and volumes interior and exterior are equivalent. (b) In two dimensions the spherical shell becomescircle and there is more volume immediately outside the shell than immediately inside. (c) The exteriorvolume grows even larger relative to the interior volume in three dimensions, where the spherical shell isnow a the surface of a sphere. In fact, with increasing dimension the exterior volume grows exponentiallylarge relative to the interior volume, and very quickly the volume around the mode is dwarfed by the volumeaway from the mode.
identity the neighborhoods that most contributions to expectations, we need to carefullybalance the behavior of both the density and the volume.
1.4 The Geometry of High-Dimensional Probability Distributions
The neighborhood immediately around the mode features large densities, but in morethan a few dimensions the small volume of that neighborhood prevents it from having muchcontribution to any expectation. On the other hand, the complimentary neighborhood faraway from the mode features a much larger volume, but the vanishing densities lead tosimilarly negligible contributions expectations. The only significant contributions comefrom the neighborhood between these two extremes known as the typical set (Figure 3).Importantly, because probability densities and volumes transform oppositely under anyreparameterization, the typical set is an invariant object that does not depend on theirrelevant details of any particular choice of parameters.
As the dimension of parameter space increases, the tension between the density andthe volume grows and the regions where the density and volume are both large enough toyield a significant contribution becomes more and more narrow. Consequently the typicalset becomes more singular with increasing dimension, a manifestation of concentration ofmeasure. The immediate consequence of concentration of measure is that the only signifi-cant contributions to any expectation come from the typical set; evaluating the integrandoutside of the typical set has negligible effect on expectations and hence is a waste of pre-cious computational resources. In other words, we can accurately estimate expectations by

8 BETANCOURT
TypicalSet
π(q)
dq
π(q) dq
|q - qMode|
Fig 3. In high dimensions a probability density, π(q), will concentrate around its mode, but the volume overwhich we integrate that density, dq, is much larger away from the mode. Contributions to any expectationare determined by the product of density and volume, π(q) dq, which then concentrates in a nearly-singularneighborhood called the typical set (grey).
averaging over the typical set instead of the entirety of parameter space. Consequently, inorder to compute expectations efficiently, we have to be able to identify, and then focusour computational resources into, the typical set (Figure 4).
This helps to explain, for example, why brute force methods like naive quadrature scaleso poorly with dimension. A grid of length N distributed uniformly in a D-dimensionalparameter space requires ND points and hence ND evaluations of the integrand. Unless Nis incredibly large, however, it is unlikely that any of these points will intersect the narrowtypical set, and the exponentially-growing cost of averaging over the grid yields worse andworse approximations to expectations. In general, framing algorithms by how they quantifythe typical set is a powerful way to quickly intuit how an algorithm will perform in practice.
Of course, understanding why we want to focus on the typical set in only the first step.How to construct an algorithm that can quantify the typical set of an arbitrary targetdistribution is another problem altogether. There are many strategies for this task, butone of the most generic, and hence most useful in applied practice, is Markov chain MonteCarlo (Robert and Casella, 1999; Brooks et al., 2011).
2. MARKOV CHAIN MONTE CARLO
Markov chain Monte Carlo uses a Markov chain to stochastically explore the typical set,generating a random grid across the region of high probability from which we can con-

A CONCEPTUAL INTRODUCTION TO HAMILTONIAN MONTE CARLO 9
Fig 4. In high-dimensional parameter spaces probability mass, π(q) dq, and hence the dominant contribu-tions to expectations, concentrates in a neighborhood called the typical set. In order to accurately estimateexpectations we have to be able to identify where the typical set lies in parameter space so that we can focusour computational resources where they are most effective.
struct accurate expectation estimates. Given sufficient computational resources a properlydesigned Markov chain will eventually explore the typical set of any distribution. The morepractical, and much more challenging question, however, is whether a given Markov chainwill explore a typical set in the finite time available in a real analysis.
In this section I’ll introduce a more substantial definition of Markov chain Monte Carloand discuss both its ideal and pathological behaviors. Finally we’ll consider how to im-plement Markov chain Monte Carlo in practice and see how fragile of an endeavor it canbe.
2.1 Estimating Expectations with Markov Chains
A Markov chain is a progression of points in parameter space generated by sequentiallyapplying a random map known as a Markov transition. Alternatively, we can think of aMarkov transition as a conditional probability density, T(q′ | q), defining to which point,q′, we are most likely to jump from the initial point, q (Figure 5).
An arbitrary Markov chain will simply wander through parameter space and will not beof any particular use in computing expectations. Something very special happens, however,if the Markov transition preserves the target distribution,
π(q) =
∫Q
dq′ π(q′)T(q | q′).
More intuitively, this condition implies that if we generated a ensemble of samples fromthe target distribution and applied the transition then we would get a new ensemble thatwas still distributed according to the target distribution.

10 BETANCOURT
(a) (b) (c)
Fig 5. (a) A Markov chain is a sequence of points in parameter space generated by a Markov transitiondensity (green) that defines the probability of a new point given the current point. (b) Sampling from thatdistribution yields a new state in the Markov chain and a new distribution from which to sample. (c)Repeating this process generates a Markov chain that meanders through parameter space.
Fig 6. When a Markov transition (green) preserves the target distribution, it concentrates towards the typicalset (red), no matter where it is applied. Consequently, the resulting Markov chain will drift into and thenacross the typical set regardless of its initial state, providing a powerful quantification of the typical set fromwhich we can derive accurate expectation estimators.
So long as this condition holds, at every initial point the Markov transition will concen-trate towards the typical set. Consequently, no matter where we begin in parameter spacethe corresponding Markov chain will eventually drift into, and then across, the typical set(Figure 6).
Given sufficient time, the history of the Markov chain, {q0, . . . , qN}, denoted samplesgenerated by the Markov chain, becomes a convenient quantification of the typical set.In particular, we can estimate expectations across the typical set, and hence expectationsacross the entire parameter space, by averaging the target function over this history,
fN =1
N
N∑n=0
f(qn) .
As we run the Markov chain for longer and longer, it will better explore the typical setand, up to some technicalities, these Markov chain Monte Carlo estimators will converge

A CONCEPTUAL INTRODUCTION TO HAMILTONIAN MONTE CARLO 11
to the true expectations,limN→∞
fN = Eπ[f ] .
Unfortunately, this asymptotic behavior is of limited use in practice because we do nothave the infinite computational resources to ensure that we can always run a Markov chainlong enough to achieve sufficient exploration. In order to develop a robust tool we need tounderstand how Markov chains behave after only a finite number of transitions.
2.2 Ideal Behavior
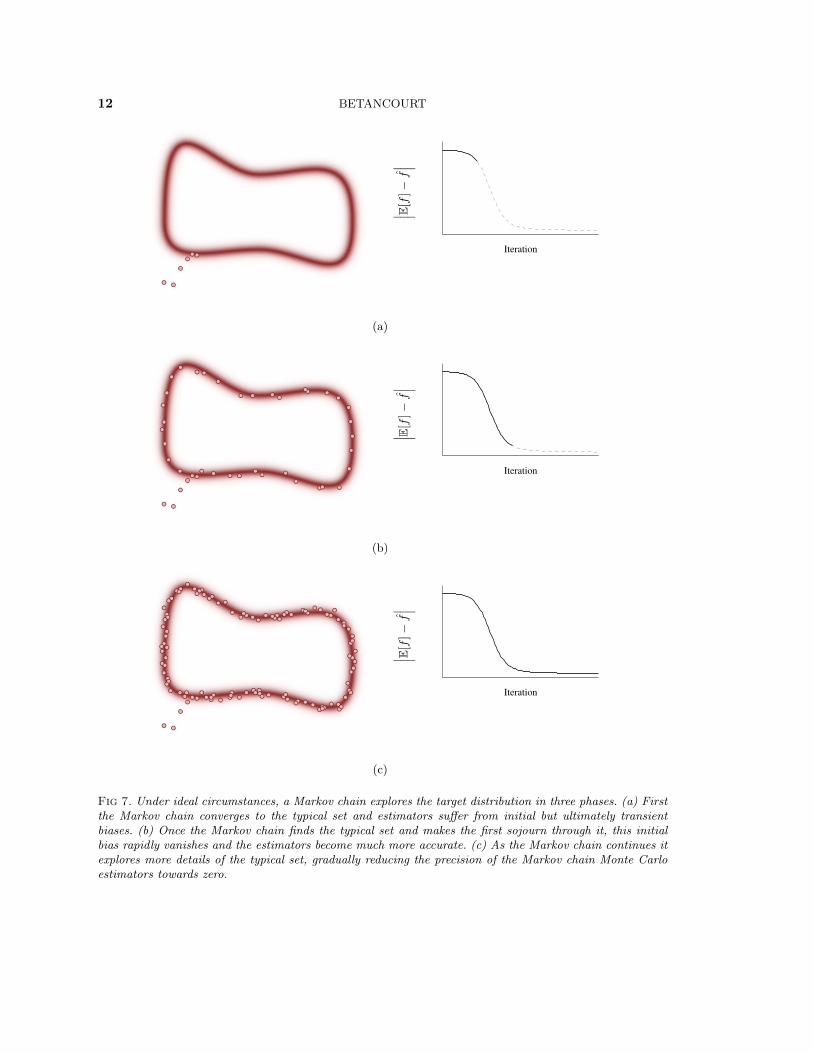
Under ideal conditions, Markov chains explore the target distribution in three distinctphases. In the first phase the Markov chain converges towards the typical set from its initialposition in parameter space while the Markov chain Monte Carlo estimators suffer fromstrong biases (Figure 7a). The second phase begins once the Markov chain finds the typicalset and persists through the first sojourn across the typical set. This initial explorationis extremely effective and the accuracy of Markov chain Monte Carlo estimators rapidlyimproves as the bias from the initial samples is eliminated (Figure 7b). The third phaseconsists of all subsequent exploration where the the Markov chain refines its explorationof the typical set and the precision of the Markov chain Monte Carlo estimators improves,albeit at a slower rate (Figure 7c).
Once the Markov chain has entered into this third phase the Markov chain Monte Carloestimators satisfy a Central Limit Theorem
fMCMCN ∼ N (Eπ[f ],MCMC-SE) ,
where the Markov Chain Monte Carlo Standard Error is given by
MCMC-SE ≡√
Varπ[f ]
ESS.
The effective sample size is defined as
ESS =N
1 + 2∑∞
l=1 ρl,
where ρl is the lag-l autocorrelation of f over the history of the Markov chain. The effectivesample size quantifies the number of exact samples from the target distribution necessaryto give an equivalent estimator precision and hence the effective number of exact samples“contained” in the Markov chain; we can also interpret the effective sample size as thetotal number of sojourns the Markov chain has made across the typical set. In practice theeffective sample size can be estimated from the Markov chain itself, although care must betaken to avoid biases (Geyer, 1992; Gelman et al., 2014).
Because the states of the Markov chain generated during the initial convergence phasemostly bias Markov chain Monte Carlo estimators, we can drastically improve the precision
12 BETANCOURT
Iteration
∣ ∣ ∣E[f]−f∣ ∣ ∣
(a)
Iteration
∣ ∣ ∣E[f]−f∣ ∣ ∣
(b)
Iteration
∣ ∣ ∣E[f]−f∣ ∣ ∣
(c)
Fig 7. Under ideal circumstances, a Markov chain explores the target distribution in three phases. (a) Firstthe Markov chain converges to the typical set and estimators suffer from initial but ultimately transientbiases. (b) Once the Markov chain finds the typical set and makes the first sojourn through it, this initialbias rapidly vanishes and the estimators become much more accurate. (c) As the Markov chain continues itexplores more details of the typical set, gradually reducing the precision of the Markov chain Monte Carloestimators towards zero.

A CONCEPTUAL INTRODUCTION TO HAMILTONIAN MONTE CARLO 13
Fig 8. Markov chains typically have trouble exploring regions of the typical set with large curvature (green).Incomplete exploration biases Markov chain Monte Carlo estimators and spoils critical results such asCentral Limit Theorems.
of these estimators by using only those samples generated once the Markov chain has begunto explore the typical set. Consequently, it is common practice to warm up the Markov chainby throwing away those initial converging samples before computing Markov chain MonteCarlo estimators. Warm-up can also be extended to allow for any degrees of freedom in theMarkov transition to be empirically optimized without biasing the subsequent estimators.
2.3 Pathological Behavior
Unfortunately, this idealized behavior requires that the Markov transition is compatiblewith the structure of the target distribution. When the target distribution exhibits patho-logical behavior, however, Markov transitions will have trouble exploring and Markov chainMonte Carlo will fail.
Consider, for example, a target probability distribution where the typical set pinchesinto a region of high curvature (Figure 8). Most Markov transitions are not able to resolvethese details and hence they cannot maneuver into these tight regions. The resulting Markovchains simply ignore them, biasing subsequent Markov chain Monte Carlo estimators dueto the incomplete exploration. It is as if there are thin but deep cracks across a surface inparameter space hiding a significant amount of probability that the Markov chains passright over and miss entirely.
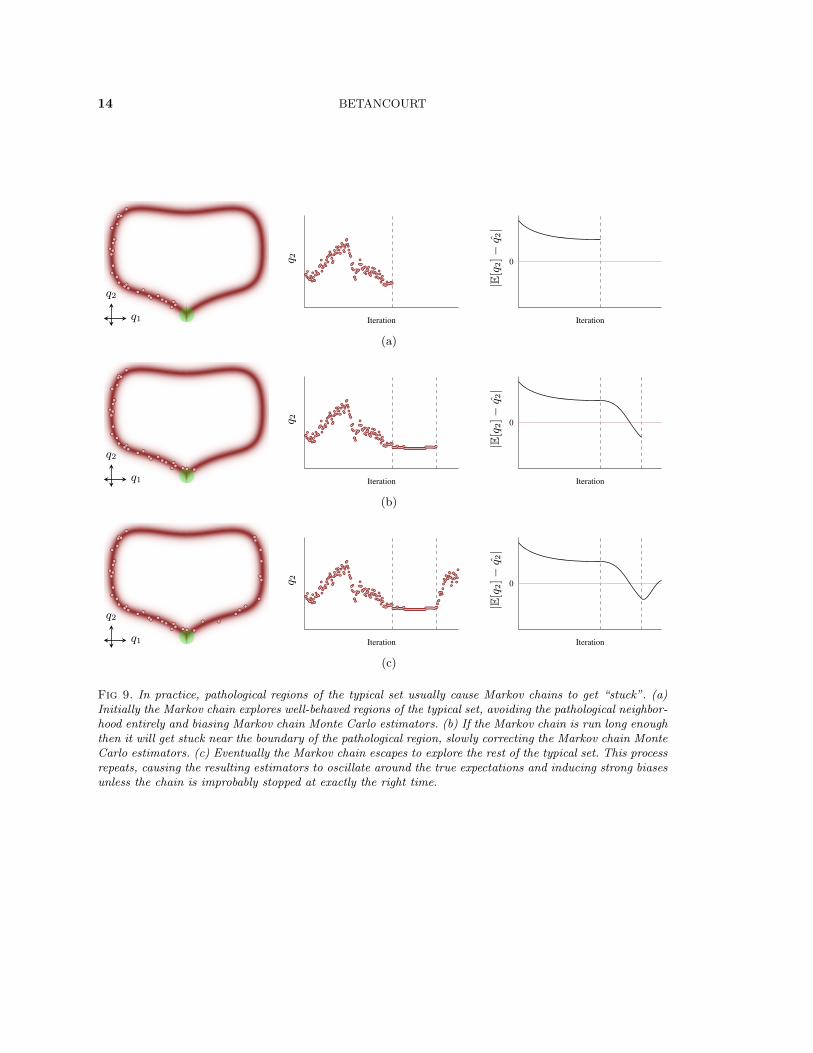
Because Markov chains have to recover the exact expectations asymptotically, they haveto somehow compensate for not being able to explore these regions. Typically the Markovchain accomplishes this by getting stuck near the boundary of the pathological region: asthe chain hovers around the pathological region the estimators are drawn down almostas if the Markov chain were exploring the pathological region. Eventually this causes theestimators to overcorrect, inducing a bias in the opposite direction, at which point theMarkov chain escapes to explore the rest of the typical set (Figure 9).
Ultimately this behavior results in estimators that strongly oscillate around the trueexpectations. Asymptotically the oscillations average out to give the true values, but that
14 BETANCOURT
q1
q2
Iteration
q 2 0
Iteration
|E[q
2]−q 2|
(a)
q1
q2
Iteration
q 2 0
Iteration
|E[q
2]−q 2|
(b)
q1
q2
Iteration
q 2 0
Iteration
|E[q
2]−q 2|
(c)
Fig 9. In practice, pathological regions of the typical set usually cause Markov chains to get “stuck”. (a)Initially the Markov chain explores well-behaved regions of the typical set, avoiding the pathological neighbor-hood entirely and biasing Markov chain Monte Carlo estimators. (b) If the Markov chain is run long enoughthen it will get stuck near the boundary of the pathological region, slowly correcting the Markov chain MonteCarlo estimators. (c) Eventually the Markov chain escapes to explore the rest of the typical set. This processrepeats, causing the resulting estimators to oscillate around the true expectations and inducing strong biasesunless the chain is improbably stopped at exactly the right time.

A CONCEPTUAL INTRODUCTION TO HAMILTONIAN MONTE CARLO 15
balance is fragile. Terminating the Markov chain after only a finite time almost alwaysdestroys this balance, and resulting estimators will suffer from substantial biases.
Whether or not features of the target distribution become pathological in a given appli-cation of Markov chain Monte Carlo depends on how exactly the given Markov transitioninteracts with those features. Some transitions are generically more robust to certain fea-tures than others, and some can achieve robust performance by carefully tuning degrees offreedom in the transition. Regardless, great care has to be taken to ensure that a Markovtransition is sufficiently robust to be used in a given application.
Formally, the sufficient condition that guarantees the idealized behavior, most impor-tantly a Central Limit Theorem for the Markov chain Monte Carlo estimators, is knownas geometric ergodicity (Roberts and Rosenthal, 2004). Unfortunately, geometric ergodic-ity is extremely difficult to verify theoretically for all but the simplest problems and wemust instead resort to empirical diagnostics. The most powerful of these is the split Rstatistic (Gelman et al., 2014), which quantifies the variation of an ensemble of Markovchains initialized from different points in parameter space. The pathologies that frustrategeometric ergodicity induce inconsistencies amongst the individual chains in the ensemble,and hence large values of split R. Consequently, when split R is not near the nominal valueof 1, we should be suspicious of geometric ergodicity being satisfied and hence the practicalutility of any resulting estimators.
2.4 The Metropolis-Hastings Algorithm
Given a Markov transition that targets the desired distribution, Markov chain MonteCarlo defines a generic strategy for quantifying the typical set. Constructing such a tran-sition, however, is itself a nontrivial problem. Fortunately there are various procedures forautomatically constructing appropriate transitions for any given target distribution, withthe foremost amongst these the Metropolis-Hastings algorithm (Metropolis et al., 1953;Hastings, 1970).
The Metropolis-Hastings algorithm is comprised of two steps: a proposal and a correc-tion. The proposal is any stochastic perturbation of the initial state while the correctionrejects any proposals that stray too far away from the typical set of the target distribu-tion. More formally, let Q(q′ | q) be the probability density defining each proposal. Theprobability of accepting a given proposal is then given by
a(q′ | q
)= min
(1,π(q′)Q(q′ | q)π(q)Q(q | q′)
).
The original Markov chain Monte Carlo algorithm, and one still commonly in use today,utilizes a Gaussian distribution as its proposal mechanism,
Q(q′ | q) = N (q′ | q,Σ),
an algorithm to which I will refer to as Random Walk Metropolis. Because the proposalmechanism is symmetric under the exchange of the initial and proposed points, the proposal

16 BETANCOURT
density cancels in the acceptance probability, leaving the simple form
a(q′ | q) = min
(1,π(q′)
π(q)
).
Random Walk Metropolis is not only simple to implement, it also has a particularlynice intuition. The proposal distribution is biased towards large volumes, and hence thetails of the target distribution, while the Metropolis correction rejects those proposals thatjump into neighborhoods where the density is too small. The combined procedure thenpreferentially selects out those proposals that fall into neighborhoods of high probabilitymass, concentrating towards the typical set as desired.
Because of its conceptual simplicity and the ease in which it can be implemented by prac-titioners, Random Walk Metropolis is still popular in many applications. Unfortunately,that seductive simplicity hides a performance that scales poorly with increasing dimensionand complexity of the target distribution.
The geometrical perspective introduced in Section 1 proves particularly powerful inilluminating these issues. As the dimension of the target distribution increases, the volumeexterior to the typical set overwhelms the volume interior to the typical set, and almostevery Random Walk Metropolis proposal will produce a point on the outside of the typicalset, towards the tails (Figure 10a). The density of these points, however, is so small, thatthe acceptance probability becomes negligible. In this case almost all of the proposals willbe rejected and the resulting Markov chain will only rarely move. We can induce a largeracceptance probability by shrinking the size of the proposal to stay within the typical set(Figure 10b), but those small jumps will move the Markov chain extremely slowly.
Regardless of how we tune the covariance of the Random Walk Metropolis proposal orthe particular details of the target distribution, the resulting Markov chain will explore thetypical set extremely slowly in all but the lowest dimensional spaces. In the worst case thisexploration will be so slow that we can’t even complete a single sojourn across the typicalset using our finite computational resources, and the resulting Markov chain Monte Carloestimators will be highly biased. Even if we can safely reach the mixing regime, however,the slow exploration will yield large autocorrelations and extremely imprecise estimators.
Consequently, if want to scale Markov chain Monte Carlo to the high-dimensional prob-ability distributions of practical interest then we need a better way of exploring the typicalset. In particular, we need to better exploit the geometry of the typical set itself.
3. THE FOUNDATIONS OF HAMILTONIAN MONTE CARLO
The guess-and-check strategy of Random Walk Metropolis is doomed to fail in high-dimensional spaces where there are an exponential number of directions in which to guessbut only a singular number of directions that stay within the typical set and pass the check.In order to make large jumps away from the initial point, and into new, unexplored regionsof the typical set, we need to exploit information about the geometry of the typical set

A CONCEPTUAL INTRODUCTION TO HAMILTONIAN MONTE CARLO 17
(a) (b)
Fig 10. In high dimensions, the Random Walk Metropolis proposal density (green) is strongly biased towardsthe outside of the typical set where the target density, and hence the Metropolis acceptance probabilityvanishes. (a) If the proposal variances are large then the proposals will stray too far away from the typicalset and are rejected. (b) Smaller proposal variances stay within the typical set and hence are accepted, butthe resulting transition density concentrates tightly around the initial point. Either way we end up with aMarkov chain that explores the typical set very, very slowly.
itself. Specifically, we need transitions that can follow those contours of high probabilitymass, coherently gliding through the typical set (Figure 11).
Hamiltonian Monte Carlo is the unique procedure for automatically generating thiscoherent exploration for sufficiently well-behaved target distributions. In this section I willfirst introduce some intuition to motivate how we can generate the desired explorationby carefully exploiting the differential structure of the target probability density. I willthen discuss the procedure more formally, ending with the complete construction of theHamiltonian Markov transition.
3.1 Informing Effective Markov Transitions
How can we distill the geometry of the typical set into information about how to movethrough it? When the sample space is continuous, a natural way of encoding this directioninformation is with a vector field aligned with the typical set (Figure 12). A vector field isthe assignment of a direction at every point in parameter space, and if those directions arealigned with the typical set then they act as a guide through this neighborhood of largesttarget probability.
In other words, instead of fumbling around parameter space with random, uninformedjumps, we can follow the direction assigned to each at point for a small distance. Byconstruction this will move us to a new point in the typical set, where we will find a newdirection to follow. Continuing this process traces out a coherent trajectory through thetypical set that efficiently moves us far away from the initial point to new, unexploredregions of the typical set as quickly as possible.

18 BETANCOURT
Fig 11. Most Markov transitions are diffusive, concentrating around the initial point such that the corre-sponding Markov chains linger in small neighborhoods of the typical set for long periods of time. In orderto maximize the utility of our computational resources we need coherent Markov transitions that are ableto glide across the typical set towards new, unexplored neighborhoods.

A CONCEPTUAL INTRODUCTION TO HAMILTONIAN MONTE CARLO 19
Fig 12. A vector field is the assignment of a direction at every point in parameter space. When thosedirections are aligned with the typical set we can follow them like guide posts, generating coherent explorationof the target distribution.
We are still left, however, with the problem of constructing a vector field aligned withthe typical set using only information that we can extract from the target distribution. Thenatural information that we have yet to exploit is the differential structure of the targetdistribution which we can query through the gradient of the target probability densityfunction. In particular, the gradient defines a vector field in parameter space sensitive tothe structure of the target distribution (Figure 13).
Unfortunately, that sensitivity is not sufficient as the gradient will never be alignedwith the typical set. Following the guidance of the gradient pulls us away from the typicalset and towards the mode of the target density. This behavior, however, isn’t necessarilysurprising. Because the target density depends on the choice of parameterization, so toowill its gradient. Consequently the gradient can direct us towards only parameterization-sensitive neighborhoods like that around the mode, and not the parameterization-invariantneighborhoods within the typical set.
To utilize the information in the gradient we need to complement it with additionalgeometric constraints, carefully removing the dependence on any particular parameteri-zation while twisting the directions to align with the typical set. Auspiciously, there isan elegantprocedure for doing exactly this in a field of mathematics known as differentialgeometry. Because differential geometry is a challenging subject that is rarely taught inapplied statistics curricula, however, building an understanding of the details and subtletiesof that procedure is no easy task.
Fortunately, there is a convenient equivalence that we can employ to build an intuition

20 BETANCOURT
Fig 13. The gradient of the target probability density function encodes information about the geometry ofthe typical set, but not enough to guide us through the typical set by itself. Following along the gradientinstead pulls us away from the typical set and towards the mode of the target density. In order to generatemotion through the typical set we need to introduce additional structure that carefully twists the gradientinto alignment with the typical set.
for this procedure without delving into the technical details. The same differential geometrythat we need to use to correct the density gradients also happens to be the mathematicsthat describes classical physics. In other words, for every probabilistic system there is amathematically equivalent physical system about which we can more easily reason.
For example, instead of trying to reason about a mode, a gradient, and a typical set,we can equivalently reason about a planet, a gravitational field, and an orbit (Figure 14).The probabilistic endeavor of exploring the typical set then becomes a physical endeavorof placing a satellite in a stable orbit around the hypothetical planet.
Because these are just two different perspectives of the same mathematical system, theywill suffer from the same pathologies. Indeed, if we place a satellite at rest out in spaceit will fall in the gravitational field and crash into the surface of the planet, just as naivegradient-driven trajectories crash into the mode (Figure 15). From either the probabilisticor physical perspective we are left with a catastrophic outcome.
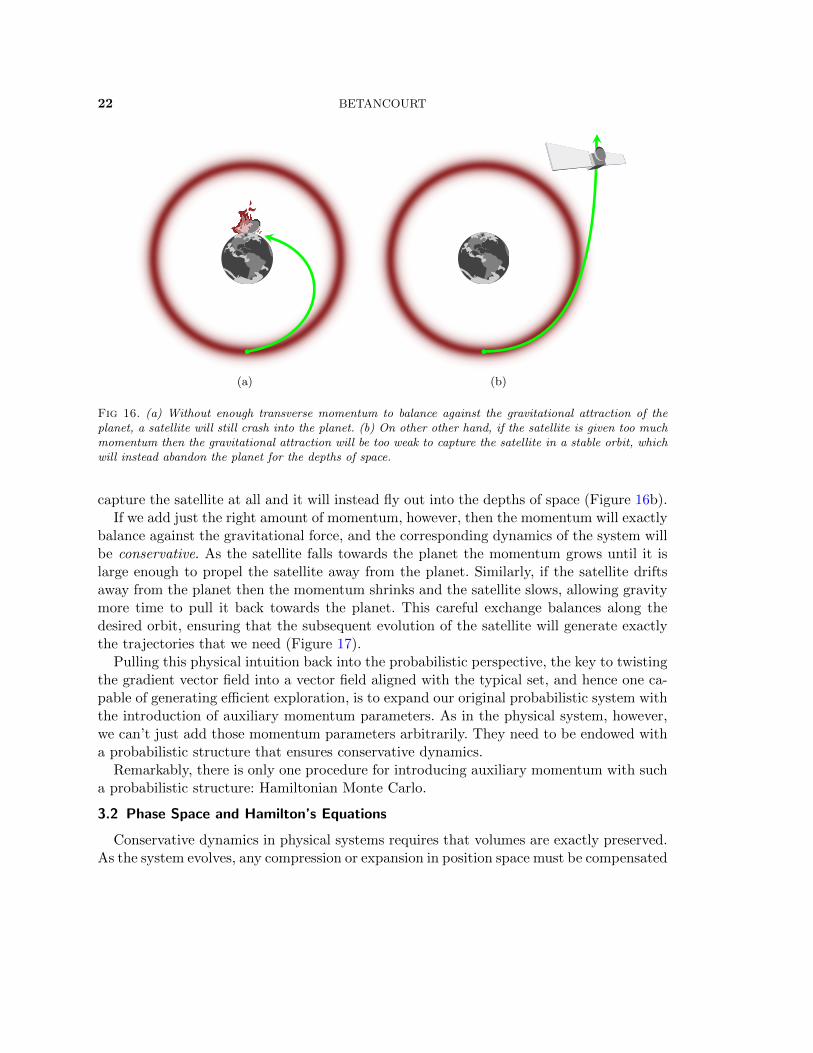
The physical picture, however, provides an immediate solution: although objects at restwill crash into the planet, we can maintain a stable orbit by endowing our satellite withenough momentum to counteract the gravitational attraction. We have to be careful, how-ever, in how exactly we add momentum to our satellite. If we add too little momentumtransverse to the gravitational field, for example, then the gravitational attraction willbe too strong and the satellite will still crash into the planet (Figure 16a). On the otherhand, if we add too much momentum then the gravitational attraction will be too weak to

A CONCEPTUAL INTRODUCTION TO HAMILTONIAN MONTE CARLO 21
Fig 14. The exploration of a probabilistic system is mathematically equivalent to the exploration of a physicalsystem. For example, we can interpret the mode of the target density as a massive planet and the gradientof the target density as that planet’s gravitational field. The typical set becomes the space around the planetthrough which we want a test object, such as a satellite, to orbit.
Fig 15. The analogous physical system suffers from the same pathologies as the motivating probabilisticsystem. In particular, a satellite at rest will fall under the planet’s gravity and crash into the surface of theplanet, just as any gradient-driven trajectory will crash into the mode.
22 BETANCOURT
(a) (b)
Fig 16. (a) Without enough transverse momentum to balance against the gravitational attraction of theplanet, a satellite will still crash into the planet. (b) On other other hand, if the satellite is given too muchmomentum then the gravitational attraction will be too weak to capture the satellite in a stable orbit, whichwill instead abandon the planet for the depths of space.
capture the satellite at all and it will instead fly out into the depths of space (Figure 16b).If we add just the right amount of momentum, however, then the momentum will exactly
balance against the gravitational force, and the corresponding dynamics of the system willbe conservative. As the satellite falls towards the planet the momentum grows until it islarge enough to propel the satellite away from the planet. Similarly, if the satellite driftsaway from the planet then the momentum shrinks and the satellite slows, allowing gravitymore time to pull it back towards the planet. This careful exchange balances along thedesired orbit, ensuring that the subsequent evolution of the satellite will generate exactlythe trajectories that we need (Figure 17).
Pulling this physical intuition back into the probabilistic perspective, the key to twistingthe gradient vector field into a vector field aligned with the typical set, and hence one ca-pable of generating efficient exploration, is to expand our original probabilistic system withthe introduction of auxiliary momentum parameters. As in the physical system, however,we can’t just add those momentum parameters arbitrarily. They need to be endowed witha probabilistic structure that ensures conservative dynamics.
Remarkably, there is only one procedure for introducing auxiliary momentum with sucha probabilistic structure: Hamiltonian Monte Carlo.
3.2 Phase Space and Hamilton’s Equations
Conservative dynamics in physical systems requires that volumes are exactly preserved.As the system evolves, any compression or expansion in position space must be compensated

A CONCEPTUAL INTRODUCTION TO HAMILTONIAN MONTE CARLO 23
Fig 17. When we introduce exactly the right amount of momentum to the physical system, the equationsdescribing the evolution of the satellite define a vector field aligned with the orbit. The subsequent evolutionof the system will then trace out orbital trajectories.
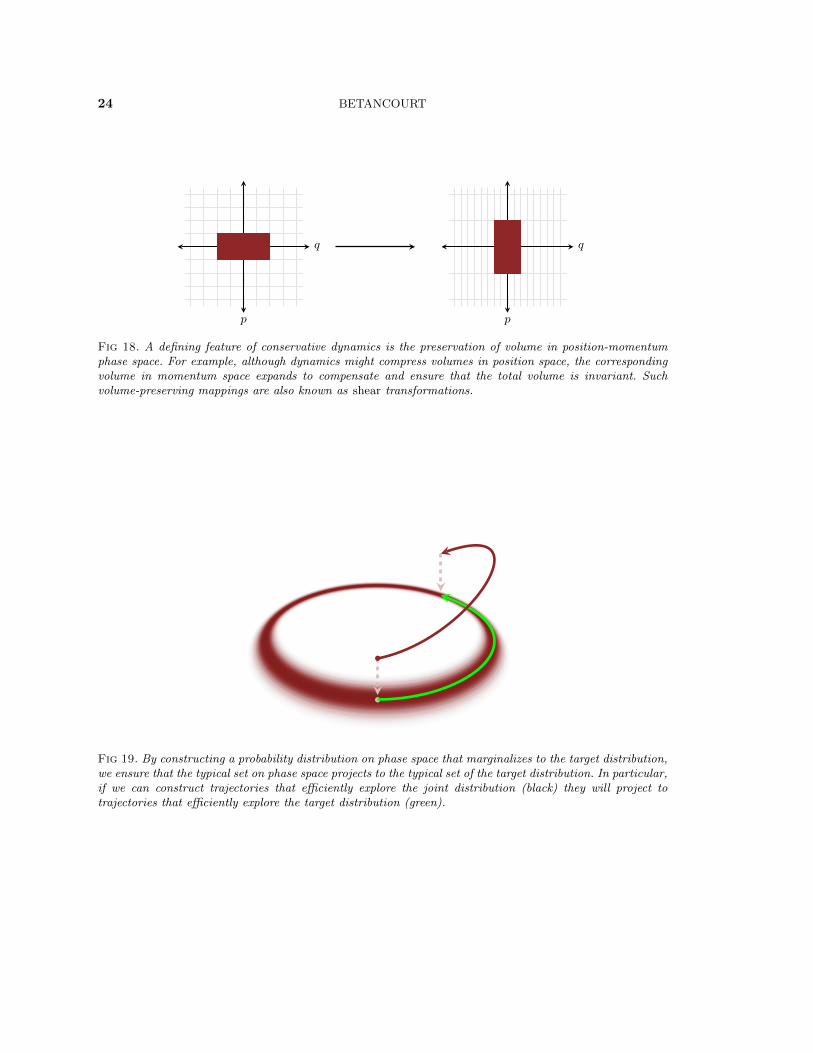
with a respective expansion or compression in momentum space to ensure that the volumeof any neighborhood in position-momentum phase space is unchanged (Figure 18).
In order to mimic this behavior in our probabilistic system we need to introduce auxiliarymomentum parameters, pn, to complement each dimension of our target parameter space,
qn → (qn, pn) ,
expanding the D-dimensional parameter space into a 2D-dimensional phase space. More-over, these auxiliary momentum have to be dual to the target parameters, transforming inthe opposite way under any reparameterization so that phase space volumes are invariant.
Having expanded the target parameter space to phase space, we can now lift the tar-get distribution onto a joint probability distribution on phase space called the canonicaldistribution. We do this with the choice of a conditional probability distribution over theauxiliary momentum,
π(q, p) = π(p | q)π(q) ,
which ensures that if we marginalize out the momentum we immediately recover our targetdistribution. More importantly, it guarantees that any trajectories exploring the typical setof the phase space distribution will project to trajectories exploring the typical set of thetarget distribution (Figure 19).
Because of the duality of the target parameters and the auxiliary momentum, the cor-responding probability densities also transform oppositely to each other. In particular, the
24 BETANCOURT
p
q
p
q
Fig 18. A defining feature of conservative dynamics is the preservation of volume in position-momentumphase space. For example, although dynamics might compress volumes in position space, the correspondingvolume in momentum space expands to compensate and ensure that the total volume is invariant. Suchvolume-preserving mappings are also known as shear transformations.
Fig 19. By constructing a probability distribution on phase space that marginalizes to the target distribution,we ensure that the typical set on phase space projects to the typical set of the target distribution. In particular,if we can construct trajectories that efficiently explore the joint distribution (black) they will project totrajectories that efficiently explore the target distribution (green).

A CONCEPTUAL INTRODUCTION TO HAMILTONIAN MONTE CARLO 25
canonical density π(q, p) does not depend on a particular choice of parameterization, andwe can write it in terms of an invariant Hamiltonian function, H(q, p),
π(q, p) = e−H(q,p).
Because H(q, p) is independent of the details of any parameterization, it captures theinvariant probabilistic structure of the phase space distribution and, most importantly, thegeometry of its typical set. Appealing to the physical analogy, the value of the Hamiltonianat any point in phase space is called the energy at that point.
Because of the decomposition of the joint density, the Hamiltonian,
H(q, p) ≡ − log π(q, p) ,
itself decomposes into two terms,
H(q, p) = − log π(p | q)− log π(q)
≡ K(p, q) + V (q) .
Once again leveraging the physical analogy, the term corresponding to the density over theauxiliary momentum, K(p, q) is called the kinetic energy, while the term corresponding tothe density of the target distribution, V (q) is known as the potential energy. The potentialenergy is completely determined by the target distribution while the kinetic energy isunconstrained and must be specified by the implementation.
Because the Hamiltonian captures the geometry of the typical set, it should we shouldbe able to use it to generate a vector field oriented with the typical set of the canonicaldistribution and hence the trajectories that we are after. Indeed, the desired vector fieldcan be generated from a given Hamiltonian with Hamilton’s equations,
dq
dt= +
∂H
∂p=∂K
∂p
dp
dt= −∂H
∂q= −∂K
∂q− ∂V
∂q.
Recognizing ∂V/∂q as the gradient of the logarithm of the target density, we see thatHamilton’s equations fulfill exactly the intuition introduced in Section 3.1. By channelingthe gradient through the momentum instead of the target parameters directly, Hamilton’sequations twist differential information to align with the typical set of canonical distri-bution. Following the Hamiltonian vector field for some time, t, generates trajectories,φt(q, p), that rapidly move through phase space while being constrained to the typical set.Projecting these trajectories back down onto the target parameter space finally yields theefficient exploration of the target typical set for which we are searching.

26 BETANCOURT
3.3 The Idealized Hamiltonian Markov Transition
In order to utilize these Hamiltonian trajectories to construct an efficient Markov tran-sition, we need a mechanism for introducing momentum to a given point in the targetparameter space. Fortunately, this is straightforward if we exploit the probabilistic struc-ture that we have already endowed to the system.
To lift an initial point in parameter space into one on phase space we simply samplefrom the conditional distribution over the momentum,
p ∼ π(p | q) .
Assuming that the initial point was in the typical set of the target distribution, samplingthe momentum directly from the conditional distribution guarantees that the lift will fallinto the typical set on phase space.
Once on phase space we can explore the joint typical set by integrating Hamilton’sequations for some time,
(q, p)→ φt(q, p) .
By construction these trajectories coherently push the Markov transition away from theinitial point, and neighborhoods that we have already explored, while staying confined tothe joint typical set.
Because of the carefully chosen structure of the joint distribution, these trajectoriesproject down to trajectories that explore the target distribution. Consequently, after in-tegrating Hamilton’s equations we can return to the target parameter space by simplyprojecting away the momentum,
(q, p)→ q.
Composing these three steps together yields a Hamiltonian Markov transition composedof random trajectories that rapidly explore the target distribution, exactly as desired (Fig-ure 20). Out in the tails of the target distribution, the momentum sampling and projectionsteps allow the resulting Markov chain to rapidly fall in toward the typical set. Once thechain has reached the typical set, the Hamiltonian trajectories ensure extremely efficientlyexploration.
4. EFFICIENT HAMILTONIAN MONTE CARLO
An immediate complication with this foundational construction is that it does not definea unique Markov transition but rather an infinity of them. Every choice of kinetic energyand integration time yields a new Hamiltonian transition that will interact differently witha given target distribution. Unfortunately, these interactions will usually lead to suboptimalperformance and we are left with a delicate tuning problem. When these degrees of freedomare well-chosen, the resulting implementation of Hamiltonian Monte Carlo will performwell on even the challenging, high-dimensional problems of applied interest. When they arepoorly-chosen, however, the performance can suffer dramatically.

A CONCEPTUAL INTRODUCTION TO HAMILTONIAN MONTE CARLO 27
q
p
Fig 20. Every Hamiltonian Markov transition is comprised of a random lift from the target parameter spaceonto phase space (light red), a deterministic Hamiltonian trajectory through phase space (dark red), and aprojection back down to the target parameter space (light red).
In order to be able to optimize the application of the Hamiltonian Monte Carlo methodand ensure robust performance, we need to understand exactly how these degrees of free-dom interact with the target distribution. Although this seems like a daunting task, wecan facilitate it by exploiting the latent geometry of Hamiltonian Monte Carlo itself. Inparticular, the analysis is make much easier by considering a different view of phase space.
4.1 The Natural Geometry of Phase Space
One of the characteristic properties of Hamilton’s equations is that they conserve thevalue of the Hamiltonian. In other words, every Hamiltonian trajectory is confined to anenergy level set,
H−1(E) = {q, p | H(q, p) = E} ,
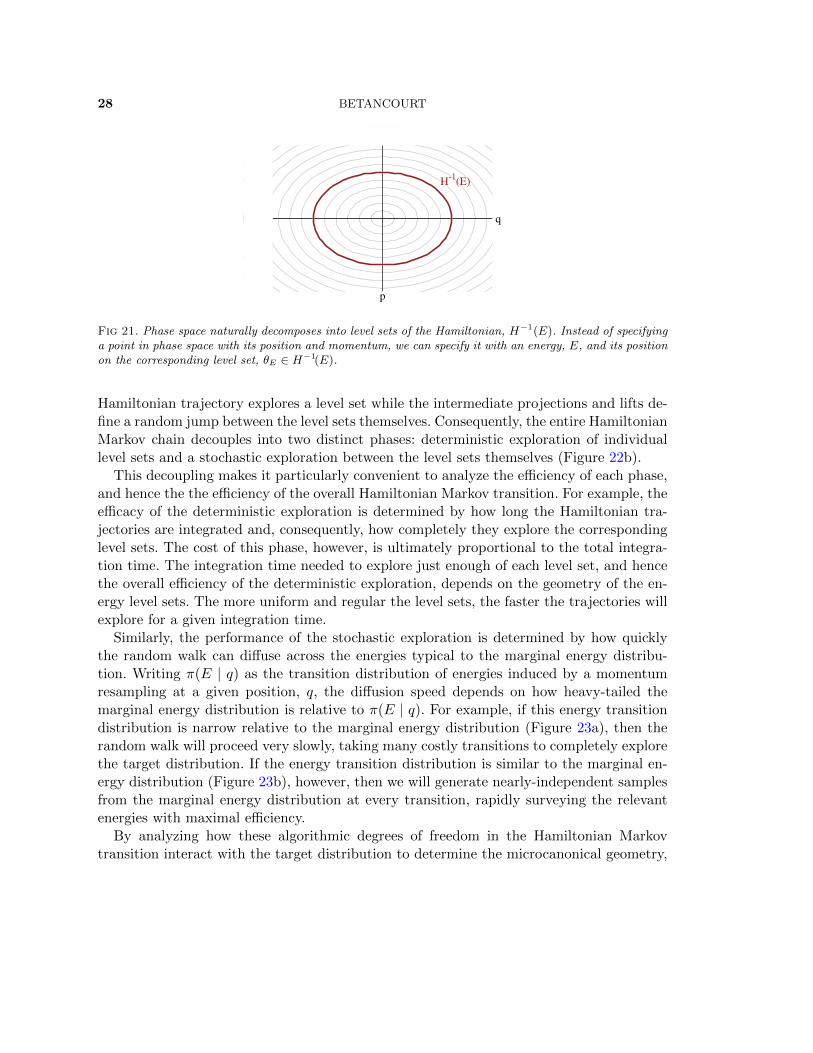
which, save for some ignorable exceptions, are all (2D − 1)-dimensional, compact surfacesin phase space. In fact, once we’ve removed any singular level sets, the entirety of phasespace neatly decomposes, or foliates into concentric level sets (Figure 21). Consequently,we can specify any point in phase space by first specifying the energy of the level set itfalls on, E, and the position within that level set, θE (Figure 21).
Correspondingly the canonical distribution on phase space admits a microcanonical de-composition,
π(q, p) = π (θE | E)π(E) ,
across this foliation. The conditional distribution over each level set, π (θE | E), is calledthe microcanonical distribution, while the distribution across the the level sets, π(E), iscalled the marginal energy distribution.
Because they are derived from the same geometry, this microcanonical decomposition isparticularly well-suited to analyzing the Hamiltonian transition. To see this more clearly,consider a Hamiltonian Markov chain consisting of multiple transitions (Figure 22a). Each
28 BETANCOURT
q
p
H-1
(E)
Fig 21. Phase space naturally decomposes into level sets of the Hamiltonian, H−1(E). Instead of specifyinga point in phase space with its position and momentum, we can specify it with an energy, E, and its positionon the corresponding level set, θE ∈ H−1(E).
Hamiltonian trajectory explores a level set while the intermediate projections and lifts de-fine a random jump between the level sets themselves. Consequently, the entire HamiltonianMarkov chain decouples into two distinct phases: deterministic exploration of individuallevel sets and a stochastic exploration between the level sets themselves (Figure 22b).
This decoupling makes it particularly convenient to analyze the efficiency of each phase,and hence the the efficiency of the overall Hamiltonian Markov transition. For example, theefficacy of the deterministic exploration is determined by how long the Hamiltonian tra-jectories are integrated and, consequently, how completely they explore the correspondinglevel sets. The cost of this phase, however, is ultimately proportional to the total integra-tion time. The integration time needed to explore just enough of each level set, and hencethe overall efficiency of the deterministic exploration, depends on the geometry of the en-ergy level sets. The more uniform and regular the level sets, the faster the trajectories willexplore for a given integration time.
Similarly, the performance of the stochastic exploration is determined by how quicklythe random walk can diffuse across the energies typical to the marginal energy distribu-tion. Writing π(E | q) as the transition distribution of energies induced by a momentumresampling at a given position, q, the diffusion speed depends on how heavy-tailed themarginal energy distribution is relative to π(E | q). For example, if this energy transitiondistribution is narrow relative to the marginal energy distribution (Figure 23a), then therandom walk will proceed very slowly, taking many costly transitions to completely explorethe target distribution. If the energy transition distribution is similar to the marginal en-ergy distribution (Figure 23b), however, then we will generate nearly-independent samplesfrom the marginal energy distribution at every transition, rapidly surveying the relevantenergies with maximal efficiency.
By analyzing how these algorithmic degrees of freedom in the Hamiltonian Markovtransition interact with the target distribution to determine the microcanonical geometry,

A CONCEPTUAL INTRODUCTION TO HAMILTONIAN MONTE CARLO 29
q
p
(a)
q
p
(b)
Fig 22. (a) Each Hamiltonian Markov transition lifts the initial state onto a random level set of theHamiltonian, which can then be explored with a Hamiltonian trajectory before projecting back down to thetarget parameter space. (b) If we consider the projection and random lift steps as a single momentumresampling step, then the Hamiltonian Markov chain alternates between deterministic trajectories alongthese level sets (dark red) and a random walk across the level sets (light red).
���������
�����
�������
(a)
���������
�����
�������
(b)
Fig 23. The momentum resampling in a Hamiltonian Markov transition randomly changes the energy, in-ducing a random walk between level sets. (a) When the energy transition distribution, π(E | q) is narrowrelative to the marginal energy distribution, π(E), this random walk will explore the marginal energy dis-tribution only very slowly, requiring many expensive transitions to survey all of the relevant energies. (b)On the other hand, when the two distributions are well-matched the random walk will explore the marginalenergy distribution extremely efficiently.

30 BETANCOURT
we can determine how they affect the performance of the resulting Hamiltonian Markovchain. In particular, we can construct criteria that identify the optimal choices of thesedegrees of freedom, which then motivate the effective tuning of the method, even for thecomplex target distributions encountered in practice.
4.2 Optimizing the Choice of Kinetic Energy
The first substantial degree of freedom in the Hamiltonian Monte Carlo method that wecan tune is the choice of the conditional probability distribution over the momentum or,equivalently, the choice of a kinetic energy function. Along with the target distribution,this choice completes the probabilistic structure on phase space which then determines thegeometry of the microcanonical decomposition. Consequently, the ideal kinetic energy willinteract with the target distribution to ensure that the energy level sets are as uniform aspossible while the energy transition distribution matches the marginal energy distributionas well as possible.
Unfortunately, there is an infinity of possible kinetic energies and it would be impossibleto search through them all to find an optimal choice for any given target distribution. It ismuch more practical to search through a restricted family of kinetic energies, especially ifthat family is built from the structure of the problem itself.
4.2.1 Euclidean-Gaussian Kinetic Energies For example, in many problems the samplespace is endowed with a Euclidean metric, g, that allows us to measure, amongst otherquantities, the distance between any two points. In a given parameterization, g is repre-sented with a D ×D matrix from which we can compute distances as
∆(q, q′) = (q − q′)T · g · (q − q′),
Moreover, we can construct an entire family of modified Euclidean metrics, M , by scalingand then rotating this natural metric,
M = R · S · g · ST ·RT ,
where S is a diagonal scaling matrix and R is an orthogonal rotation matrix.Any such Euclidean structure on the target parameter space immediately induces an
inverse structure on the momentum space, allowing us to measure distances between mo-menta,
∆(p, p′) = (p− p′)T ·M−1 · (p− p′).Finally, distances in momentum space allow us to construct many common probability
distributions over the momentum, such as a Gaussian distribution centered at 0,
π(p | q) = N (p | 0,M) .
This particular choice defines a Euclidean-Gaussian kinetic energy,
K(q, p) =1
2pT ·M−1 · p+ log |M |+ const.

A CONCEPTUAL INTRODUCTION TO HAMILTONIAN MONTE CARLO 31
In the physical perspective the Euclidean metric is known as the mass matrix, a term thathas consequently become common in the Hamiltonian Monte Carlo literature.
Because the Euclidean structure over the momentum is dual to the Euclidean structureover the parameters, its interactions with the target distribution are straightforward toderive. Applying the transformation p′ =
√M−1p simplifies the kinetic energy, but re-
member that we have to apply the opposite transformation to the parameters, q′ =√Mq,
to preserve the Hamiltonian geometry. Consequently, a choice of M−1 effectively rotatesand then rescales the target parameter space, potentially correlating or de-correlating thetarget distribution and correspondingly warping the energy level sets.
In particular, as the inverse Euclidean metric more closely resembles the covariance ofthe target distribution it de-correlates the target distribution, resulting in energy level setsthat are more and more uniform and hence easier to explore. We can then readily optimizeover the family of Euclidean-Gaussian kinetic energies by setting the inverse Euclideanmetric to the target covariances,
M−1 = Eπ[(q − µ) (q − µ)T ].
In practice we can compute an empirical estimate of the target covariance using theMarkov chain itself in an extended warm-up phase. After first converging to the typicalset we run the Markov chain using a default Euclidean metric for a short window to buildup an initial estimate of the target covariance, then update the metric to this estimatebefore running the now better-optimized chain to build up an improved estimate. A fewiterations of this adaptation will typical yield an accurate estimate of the target covarianceand hence a near-optimal metric.
4.2.2 Riemannian-Gaussian Kinetic Energies Unless the target distribution is exactlyGaussian, however, no global rotation and rescaling will yield completely uniform levelsets; locally the level sets can still manifest strong curvature that slows the explorationof the Hamiltonian trajectories. To improve further we need to introduce a Riemannianmetric which, unlike the Euclidean metric, varies as we move through parameter space. ARiemannian structure allows us to construct a Gaussian distribution over the momentumwhose covariance depends on our current position in parameter space,
π(p | q) = N (p | 0,Σ(q)) ,
which then defines a Riemannian-Gaussian kinetic energy,
K(q, p) =1
2pT · Σ−1(q) · p+
1
2log |Σ(q)|+ const.
The resulting implementation of Hamiltonian Monte Carlo is known as Riemannian Hamil-tonian Monte Carlo (Girolami and Calderhead, 2011).
The variation of the inverse Riemannian metric allows it to make local corrections to thetarget distribution that vary depending on where we are in parameter space. If the metric

32 BETANCOURT
resembles the Hessian of the target distribution then these local corrections will rectify thespatially-varying correlations of the target distribution, ensuring extremely uniform levelsets and efficient exploration. Technical care, however, must be taken when trying to mimicthe Hessian to ensure that the inverse Riemannian metric, and hence the entire kineticenergy is well-behaved; the SoftAbs metric (Betancourt, 2013a) accomplishes this with aheuristic regularization that works well in practice, although formalizing this procedure isan active topic of research (Holmes, Rubinstein-Salzedo and Seiler, 2014).
An additional benefit of the Riemannian-Gaussian kinetic energy is that the variation ofthe log determinant, 1
2 log |Σ(q)|, modifies the marginal energy distribution. If the metric iswell-chosen then this modification can bring the marginal energy distribution closer to theenergy transition distribution, significantly improving the performance of the Hamiltoniantransition when targeting complex distributions (Betancourt and Girolami, 2015).
4.2.3 Non-Gaussian Kinetic Energies In theory we are not limited to Gaussian distribu-tions over the momentum – a Euclidean or Riemannian structure allows us to construct anydistribution with quadratic sufficient statistics. In particular, why should we not considermomentum distributions with particularly heavy or light tails? Although there is not muchsupporting theory, empirically non-Gaussian kinetic energies tend to perform poorly, espe-cially in high-dimensional problems. Some intuition for the superiority of Gaussian kineticenergies may come from considering the asymptotics of the marginal energy distribution.As we target higher and higher dimensional models, the marginal energy distribution be-comes a convolution of more and more parameters and, under relatively weak conditions, ittends to follow a central limit theorem. When the marginal energy distribution convergestowards a Gaussian, only a Gaussian distribution over the momentum will yield the optimalenergy transition.
4.3 Optimizing the Choice of Integration Time
The choice of a kinetic energy completely specifies the microcanonical geometry and,consequently, the shape of the energy level sets. How effectively each Hamiltonian trajectoryexplores those level sets is then determined entirely by the choice of integration times acrossphase space, T (q, p). Intuitively, if we integrate for only a short time then we don’t takefull advantage of the coherent exploration of the Hamiltonian trajectories and we willexpect performance to suffer. On the other hand, because the level sets are topologicallycompact in well-behaved problems, trajectories will eventually return to previously exploredneighborhoods and integrating too long can suffer from diminishing returns.
This intuition is formalized in the notion of dynamic ergodicity (Betancourt, 2016a).Here we consider the orbit, φ, of a trajectory, consisting of all points that the trajectorywill reach as the integration time is increased to infinity. The orbit might encompass theentire level set or it could be limited to a just subset of the level set, but in either caseany trajectory will explore the microcanonical distribution restricted to its orbit. Dynamicergodicity guarantees that a uniform sample from a trajectory will more closely resemble asample from this restricted microcanonical distribution as the integration time is increased

A CONCEPTUAL INTRODUCTION TO HAMILTONIAN MONTE CARLO 33
Superlinear Asymptotic
| ET -
Eφ |
T (q, p)
(a)
0
1
Superlinear Asymptotic
Eff
ecti
ve
Sam
ple
Siz
e
T (q, p)
(b)
Superlinear Asymptotic
Eff
ecti
ve
Sam
ple
s S
ize
/ T
(q, p)
T (q, p)
(c)
Fig 24. (a) Temporal averages along a Hamiltonian trajectory, ET , converge to the corresponding spatialexpectation over its orbit, Eφ, as the integration time, T , increases. (b) Correspondingly, a uniform samplefrom the trajectory converges to a sample from the microcanonical distribution restricted to the trajectory’sorbit, here represented by the effective sample size. Typically this convergence is initially rapid and super-linear before settling into an asymptotic regime where the convergence continues only with the square of theintegration time. (c) Because the cost of generating each trajectory scales with the integration time, thoseintegration times that identify the transition between these two regimes will yield optimal performance.
and the trajectory grows. In other words, as the integration time grows the temporalexpectation over the trajectory converges to the spatial expectation over its orbit.
The performance of the Hamiltonian transition, however, depends on the rate at whichthese expectations converge. Given typical regularity conditions, the temporal expecta-tion will initially converges toward the spatial expectation quite rapidly (Figure 24a, b),consistent with our intuition that coherent exploration is extremely effective. Eventually,however, that convergence slows, and we enter an asymptotic regime where any benefit ofexploration comes at an ever increasing cost. The optimal integration time straddles thesetwo regimes, exploiting the coherent exploration early on but not wasting computation onthe diminishing returns of long integration times (Figure 24c).
This optimization criterion also has a helpful geometric interpretation. The superlinearregime corresponds to the first sojourn around the orbit of the trajectory, where every new

34 BETANCOURT
(a) (b)
Fig 25. (a) Because a Hamiltonian trajectory’s first sojourn through its orbit continuously encountersnew, un-surveyed neighborhoods, the corresponding exploration is extremely efficient. (b) Longer trajecto-ries return to these neighborhoods, refining this initial exploration and yielding better, but much slower,convergence.
step forwards is new and informative (Figure 25a). Eventually, however, the trajectoryreturns to neighborhoods it has already explored and enters into the asymptotic regime(Figure 25b). This additional exploration refines the exploration of the orbit, improvingthe accuracy of the temporal expectation only very slowly.
In general, this optimal integration time will vary strongly depending on which trajec-tory we are considering: no single integration time will perform well everywhere. We canmake this explicit in one dimension where the optimal integration times can be identifiedanalytically. For example, for the family of target densities
πβ(q) ∝ e−|q|β
,
with the Euclidean-Gaussian kinetic energy
π(p | q) = N (0, 1) ,
the optimal integration time scales with the energy of the level set containing the trajectory,
Toptimal(q, p) ∝ (H(q, p))2−β2β .
In particular, when the target distribution is heavy-tailed, β < 2, the optimal integrationtime will quickly grow as we move from trajectories exploring the bulk to trajectoriesexploring the tails (Figure 26). Consequently, the exploration generated by trajectories

A CONCEPTUAL INTRODUCTION TO HAMILTONIAN MONTE CARLO 35
0
2
4
6
8
10
β = 2
β = 1
β = 0.5
Opti
mal
Inte
gra
tion T
ime
E
Fig 26. The spatial variation of optimal integration times is evident in a one-dimensional example wherethe optimal integration times can be calculated analytically and are found to scale with the energy of theinitial point in phase space. Only for a Gaussian target distribution, β = 2, are the optimal integrationtimes constant for all energies. The optimal integration time for heavy-tailed target distributions, β < 2,grows larger as we move deeper into the tails with higher energies. A given static integration time mightsuffice for low energies, but it will yield trajectories that are much too short for any effective exploration ofthe higher energy level sets.
with any static integration time will decay and the Hamiltonian Markov chain will slow toa crawl.
Hence if we want to fully exploit these Hamiltonian trajectories then we need to identifythe optimal integration time dynamically, as we generate the trajectories themselves. Howexactly do we identify when a trajectory has reached its optimal length? One heuristicis the No-U-Turn termination criterion (Hoffman and Gelman, 2014; Betancourt, 2013b)which, like the kinetic energies discussed in Section 4.2, utilizes a Euclidean or Riemannianstructure on the target parameter space. The explicit form of the No-U-Turn terminationcriterion is introduced in Appendix A.4.2.
In some simple cases the near-optimality of the No-U-Turn criterion can be shown rigor-ously, but it has proven a empirical success on an incredibly diverse set of target distribu-tions encountered in applied problems. More recently proposed possibilities are exhaustivetermination criteria (Betancourt, 2016a) which utilize the microcanonical geometry itselfto identify the optimal stopping time. Exhaustive termination criteria can be more robustthan the No-U-Turn termination criterion, but they require careful tuning which is an opentopic of research.
5. IMPLEMENTING HAMILTONIAN MONTE CARLO IN PRACTICE
With careful tuning, the Hamiltonian Monte Carlo method defines a powerful Markovtransition capable of performing well over a large class of target distributions, at least intheory. Unfortunately, there are almost no Hamiltonian transitions that are immediatelyapplicable in practice.
36 BETANCOURT
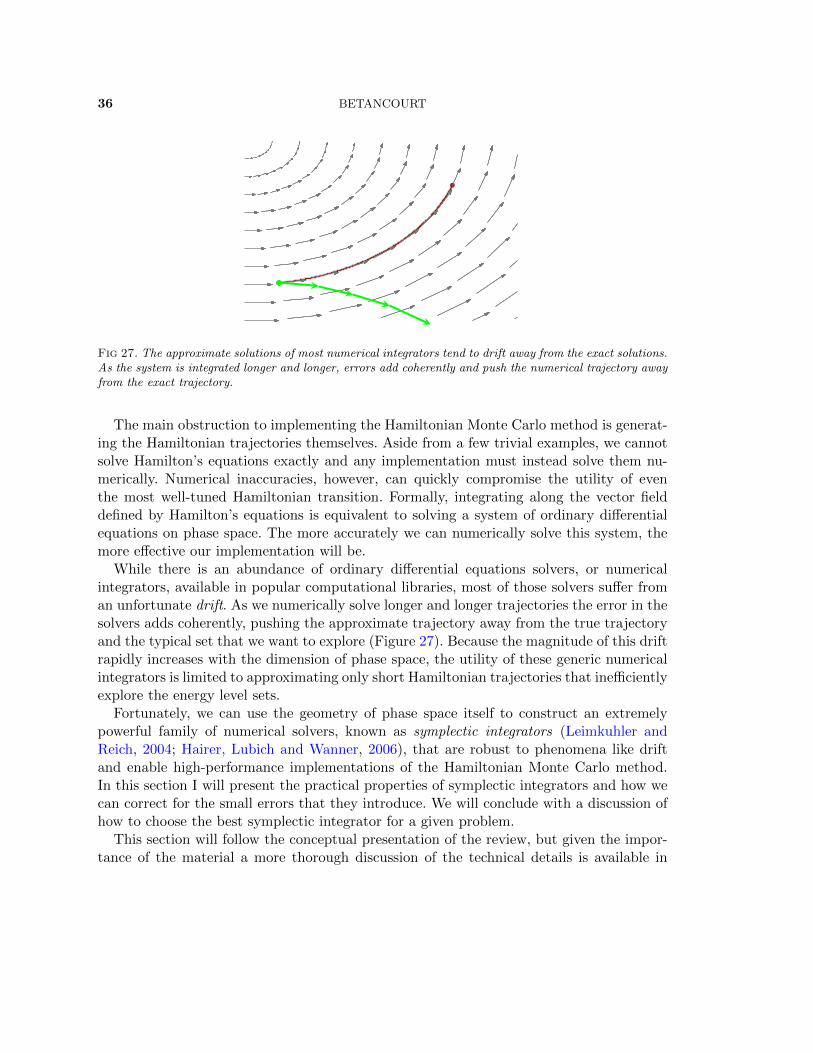
Fig 27. The approximate solutions of most numerical integrators tend to drift away from the exact solutions.As the system is integrated longer and longer, errors add coherently and push the numerical trajectory awayfrom the exact trajectory.
The main obstruction to implementing the Hamiltonian Monte Carlo method is generat-ing the Hamiltonian trajectories themselves. Aside from a few trivial examples, we cannotsolve Hamilton’s equations exactly and any implementation must instead solve them nu-merically. Numerical inaccuracies, however, can quickly compromise the utility of eventhe most well-tuned Hamiltonian transition. Formally, integrating along the vector fielddefined by Hamilton’s equations is equivalent to solving a system of ordinary differentialequations on phase space. The more accurately we can numerically solve this system, themore effective our implementation will be.
While there is an abundance of ordinary differential equations solvers, or numericalintegrators, available in popular computational libraries, most of those solvers suffer froman unfortunate drift. As we numerically solve longer and longer trajectories the error in thesolvers adds coherently, pushing the approximate trajectory away from the true trajectoryand the typical set that we want to explore (Figure 27). Because the magnitude of this driftrapidly increases with the dimension of phase space, the utility of these generic numericalintegrators is limited to approximating only short Hamiltonian trajectories that inefficientlyexplore the energy level sets.
Fortunately, we can use the geometry of phase space itself to construct an extremelypowerful family of numerical solvers, known as symplectic integrators (Leimkuhler andReich, 2004; Hairer, Lubich and Wanner, 2006), that are robust to phenomena like driftand enable high-performance implementations of the Hamiltonian Monte Carlo method.In this section I will present the practical properties of symplectic integrators and how wecan correct for the small errors that they introduce. We will conclude with a discussion ofhow to choose the best symplectic integrator for a given problem.
This section will follow the conceptual presentation of the review, but given the impor-tance of the material a more thorough discussion of the technical details is available in
A CONCEPTUAL INTRODUCTION TO HAMILTONIAN MONTE CARLO 37
Fig 28. Symplectic integrators generate numerical trajectories that are incompressible like the exact Hamil-tonian trajectory they approximate. Consequently their approximation error cannot add up coherently topull the numerical trajectories away from the exact trajectories. Instead the numerical trajectories oscillatearound the exact level set, even as we integrate for longer and longer times.
Appendix A.
5.1 Symplectic Integrators
Symplectic integrators are powerful because the numerical trajectories they generateexactly preserve phase space volume, just like the Hamiltonian trajectories they are ap-proximating. This incompressibility limits how much the error in the numerical trajectorycan deviate from the energy of the exact trajectory. Consequently, the numerical trajecto-ries cannot drift away from the exact energy level set, instead oscillating near it even forlong integration times (Figure 28).
Conveniently for implementations, symplectic integrators are also straightforward toimplement in practice. For example, if the probabilistic distribution of the momentum ischosen to be independent of position, as with the Euclidean-Gaussian kinetic energy, thenwe can employ the deceptively simple leapfrog integrator. Given a time discretization, orstep size, ε, the leapfrog integrator simulates the exact trajectory as
q0 ← q, p0 ← pfor 1 ≤ n ≤ xT/ε y do
pn+ 12← pn − ε
2∂V∂q (qn)
qn+1 ← qn + ε pn+ 12
pn+1 ← pn+ 12− ε
2∂V∂q (qn+1)
end for.
This simple but precise interleaving of discrete momentum and position updates ensuresexact volume preservation on phase space, and hence the accurate numerical trajectories

38 BETANCOURT
Fig 29. When the exact trajectories lie on energy level sets with regions of high curvature, the numericaltrajectories generated by symplectic integrators can diverge, rapidly flying off towards the boundaries of phasespace. Unlike the slower drift of generic numerical integrators, these divergences, and hence the failure ofthe symplectic integrator to provide an accurate solution, are straightforward to identify in practice.
we need to realize the potential of a Hamiltonian transition.There is, however, one important exception to performance of symplectic integrators.
Long time accuracy can be compromised when the exact energy level sets feature neigh-borhoods of high curvature that the finite time discretization is not able to resolve. Theseneighborhoods induce a divergence that almost immediately propels the numerical trajec-tory towards infinite energies (Figure 29). This distinctive behavior proves beneficial inpractice, however, because it makes the failures of a symplectic integrator straightforwardto identify and hence diagnose.
Employing symplectic integrators provides the opportunity to translate the theoreticalperformance of the Hamiltonian Monte Carlo method into a practical implementation.There remain, however, two obstructions to realizing this translation. First, even thoughsymplectic integrators are highly accurate, the small errors they do introduce will bias theresulting Hamiltonian transitions without an exact correction. Second, we have to be ableto select a symplectic integrator well-suited to a given target distribution.
5.2 Correcting for Symplectic Integrator Error
One particularly natural strategy for correcting the bias introduced by the error in asymplectic integrator is to treat the Hamiltonian transition as the proposal for a Metropolis-Hastings scheme on phase space. If we can construct the acceptance probability analyticallythen this correction will yield an exact sample from the canonical distribution on phasespace which then projects to an exact sample from our target distribution. In order to con-struct that acceptance probability, however, we have to carefully augment the Hamiltoniantransition.
For example, consider a simple scheme where we integrate the initial state, (q0, p0), for-

A CONCEPTUAL INTRODUCTION TO HAMILTONIAN MONTE CARLO 39
(q0, p0) (qL, pL)
Q(qL, pL | q0, p0) = 1
(q0, p0) (qL, pL) (q2L, p2L)
Q(q0, p0 | qL, pL) = 0
Fig 30. Because Hamiltonian trajectories, and their numerical approximations, are deterministic and non-reversible, Metropolis-Hastings proposals become ill-posed. In particular, we have positive proposal probabil-ities going forwards in time but vanishing proposal probabilities going backwards in time which renders theMetropolis-Hastings acceptance probability ill-posed.
ward for some static time, or equivalently L symplectic integrator steps, and then proposethe last state of the numerical trajectory, (qL, pL),
Q(q′, p′ | q0, p0) = δ(q′ − qL) δ(p′ − pL).
Because we can propose only states going forwards and not backwards, (Figure 30), the ratioof proposal densities, and hence the Metropolis-Hastings acceptance probability, becomesill-posed,
Q(qL, pL | q0, p0)Q(q0, p0 | qL, pL)
=1
0.
If we modify the Hamiltonian transition to be reversible, however, then the ratio of pro-posal densities becomes well-posed and we achieve a valid correction scheme. The simplestway of achieving a reversible proposal is to augment the the numerical integration with anegation step that flips the sign of momentum,
(q, p)→ (q,−p) .
This yields the reversible proposal (Figure 31)
Q(q′, p′ | q0, p0) = δ(q′ − qL) δ(p′ + pL),
with the corresponding Metropolis-Hastings acceptance probability
a(qL,−pL | q0, p0) = min
(1,π(qL,−pL)Q(qL,−pL | q0, p0)π(q0, p0)Q(q0, p0 | qL,−pL)
)= min
(1,π(qL,−pL) δ(qL − qL) δ(−pL + pL)
π(q0, p0) δ(q0 − q0) δ(p0 − p0)
)
= min
(1,π(qL,−pL)
π(q0, p0)
)= min
(1,
exp (−H(qL,−pL))
exp (−H(q0, p0))
)= min(1, exp (H(qL,−pL)−H(q0, p0))) ,

40 BETANCOURT
(q0, p0) (qL, pL)
(qL,−pL)Q(qL,−pL | q0, p0) = 1
(q0,−p0) (qL,−pL)
(q0, p0)Q(q0, p0 | qL,−pL) = 1
Fig 31. Augmenting the numerical trajectory with a momentum flip defines a reversible Metropolis-Hastingsproposal for which the forwards and backwards proposal probabilities are both well-behaved and we recover avalid correction scheme.
Because we can always evaluate the Hamiltonian, we can immediately construct the accep-tance probability and then correct for the bias induced by the symplectic integrator error.Moreover, because symplectic integrators oscillate near the exact energy level set this ac-ceptance probability will deteriorate only negligibly as we consider target distributions ofhigher and higher dimensions.
Our analysis of optimal integration times in Section 4.3, however, motivated taking notthe last state from a Hamiltonian trajectory but rather sampling points uniformly fromthe entire trajectory to best approximate a sample from the microcanonical distribution.We can modify our Metropolis-Hastings approach towards this end by proposing not justthe final point but all points in the numerical trajectory,
Q(q′, p′ | q0, p0) =1
L
L∑l=0
δ(q′ − ql) δ(p′ + pl).
This generalized proposal is still reversible and the acceptance probability similarly reducesto
a(ql,−pl | q0, p0) = min(1, exp (H(ql,−pl)−H(q0, p0))) ,
for 0 ≤ l ≤ L and vanishes otherwise.Unfortunately, this generalized proposal can suffer from sub-optimal performance be-
cause it proposes states independent of their acceptance probability. In particular, we canpropose a state with large error and be forced to reject the proposal even though thereare might be other states in the numerical trajectory with much smaller errors and cor-respondingly higher acceptance probabilities. To achieve optimal performance we have toaverage the proposals to all states in the trajectory into a single, efficient proposal.
There are numerous schemes for achieving such an average, and they all require generat-ing numerical trajectories by integrating the initial state not only forwards in time but alsobackwards. Once we start integrating in both directions it becomes easier to reason aboutthe Hamiltonian Markov transition as a two-stage process. First we uniformly sample a

A CONCEPTUAL INTRODUCTION TO HAMILTONIAN MONTE CARLO 41
trajectory, t, from all numerical trajectories of length L that contain the initial point, andthen we sample a point from that trajectory with the probabilities
π(q, p) =e−H(q,p)∑
(q′,p′)∈t e−H(q′,p′)
.
Detailed proofs demonstrating the validity of this scheme, and its extension to dynamictrajectory lengths, can be found in Appendix A.
5.3 Optimal Choice of Symplectic Integrator
Now that we know how to implement the Hamiltonian Monte Carlo method with sym-plectic integrators, we are left with the choice of the exact configuration of the symplecticintegrator itself. These configurations are characterized with a choice of step size, ε, and anorder, K, that quantifies how many gradient evaluations are used in each discrete integratorstep.
In general there is a delicate balance between configurations that are more accurate butmore expensive, and those that are less accurate but cheaper. For example, regardless ofthe exact order of the integrator, the step size will control the number of integrator steps,L = T/ε, and hence the overall cost of each Hamiltonian transition. Smaller step sizes yieldmore accurate numerical trajectories and better exploration, but at the expense of manymore integrator steps. Similarly, the higher the order of the integrator the more accurate,but also more expensive, it will be.
Fortunately, this intuition can be formalized and quantified by exploiting the geometryinherent to symplectic integrators. In particular, the volume preservation of symplecticintegrators guarantees not only that they well-approximate trajectories generated by theexact Hamiltonian, but also that they exactly solve trajectories generated by some modi-fied Hamiltonian or shadow Hamiltonian. This implies that numerical trajectories will beconfined to energy level sets of this modified Hamiltonian, and we can quantify the perfor-mance of the integrator by studying the differences between the exact and modified levelsets (Figure 32a). For example, divergences occur when the modified level sets becomenon-compact and extend out to the boundaries of phase space (Figure 32b).
When the modified level sets are well-behaved and we do not encounter any divergences,we can quantify the performance of the symplectic integrator by comparing the shapes ofthe exact and modified level sets. For the simple implementation of Hamiltonian MonteCarlo where we integrate for a static time, T , flip the momentum, and apply a Metropolis-Hastings correction to the final state, this comparison bounds the relationship between thecost of the algorithm and the average Metropolis-Hastings acceptance probability, whichitself depends on the step size (Betancourt, Byrne and Girolami, 2014) (Figure 33). Thesebounds provide the basis for an automated tuning algorithm that adapts the step sizeduring an extended warm-up to achieve an average Metropolis acceptance probability be-tween 0.6 and 0.8, similar to the adaptation of the Euclidean metric discussed in Section
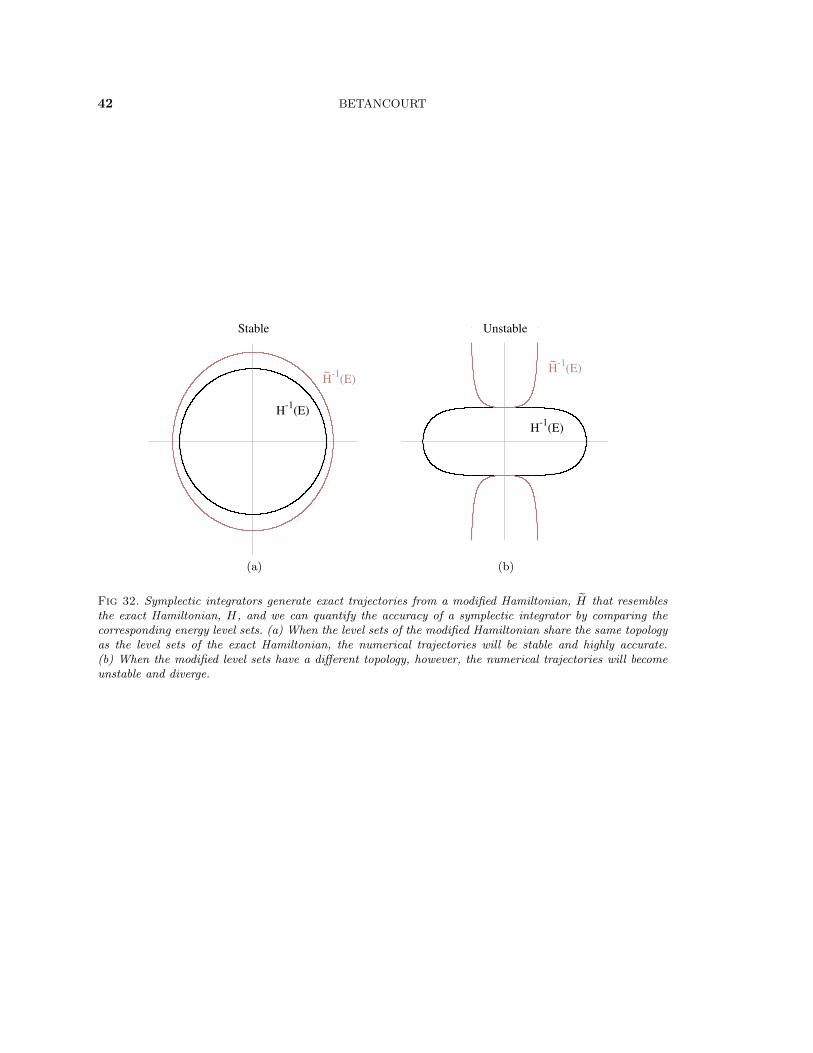
42 BETANCOURT
H-1
(E)
H~ -1
(E)
Stable
(a)
H-1
(E)
H~ -1
(E)
Unstable
(b)
Fig 32. Symplectic integrators generate exact trajectories from a modified Hamiltonian, H that resemblesthe exact Hamiltonian, H, and we can quantify the accuracy of a symplectic integrator by comparing thecorresponding energy level sets. (a) When the level sets of the modified Hamiltonian share the same topologyas the level sets of the exact Hamiltonian, the numerical trajectories will be stable and highly accurate.(b) When the modified level sets have a different topology, however, the numerical trajectories will becomeunstable and diverge.

A CONCEPTUAL INTRODUCTION TO HAMILTONIAN MONTE CARLO 43
0 0.2 0.4 0.6 0.8 1
Lower Bound
Upper Bound
Cost
Average Acceptance Probability
Fig 33. By comparing the geometry of the modified level sets induced by a symplectic integrator with theexact level sets we can compute bounds between the computational cost of a Hamiltonian transition and theaverage Metropolis acceptance probability, at least for simple implementations of the Hamiltonian MonteCarlo method. These bounds then inform adaptation procedures that tune the integrator step size to achievean average acceptance probability that yields minimal cost.
4.2.1. Although much of this analysis carries over to more sophisticated implementationsof Hamiltonian Monte Carlo, more work is needed to formalize the corresponding results.
Finally we are left to consider the order of the symplectic integrator. Most discussionsof Hamiltonian Monte Carlo consider only the first-order leapfrog integrator due to itssimplicity and empirical success. Recent work, however, has suggested that higher-orderintegrators may prove more effective, especially in higher-dimensional problems (Blanes,Casas and Sanz-Serna, 2014; Fernandez-Pendas, Akhmatskaya and Sanz-Serna, 2015). Oneserious complication introduced by higher-order integrators are additional degrees of free-dom that can significantly affect performance – poor choices of these integrator parameterscan completely neutralize any gains over the leapfrog integrator. Understanding how theseadditional integrator degrees of freedom interact with a given problem, and then developingautomated adaptation procedures, is an important next step to the inclusion of higher-ordermethods.
6. THE ROBUSTNESS OF HAMILTONIAN MONTE CARLO
Up to this point we have been focused on why Hamiltonian trajectories rapidly explorea given target distribution and then how we can configure Hamiltonian Markov transitionsto maximize the efficiency of this exploration. We have not yet, however, addressed thecritical question of how robust that exploration will be – even the fastest algorithm isworthless if it does not quantify all of the typical set. As discussed in Section 2.3, theformal question we have to consider is for what target distributions will an implementation

44 BETANCOURT
of Hamiltonian Monte Carlo be geometrically ergodic and yield well-behaved, unbiasedMarkov chain Monte Carlo estimators?
Because this question is so general, theoretical analysis is extremely difficult. Preliminaryresults, however, show that even simple implementations of the Hamiltonian Monte Carlomethod are geometrically ergodic over a large class of target distributions (Livingstoneet al., 2016). In particular, this class is significantly larger than the class for non-gradientbased algorithms like Random Walk Metropolis, consistent with the intuition that gradientsare critical to robust Markov chain Monte Carlo in high-dimensional problems.
Perhaps more importantly, this theoretical analysis identifies the pathological behaviorsof a target distribution that obstruct geometric ergodicity. Moreover, the work demon-strates that these pathologies manifest in precise empirical behaviors that immediatelymotivate practical diagnostics unique to Hamiltonian Monte Carlo.
6.1 Diagnosing Poorly-Chosen Kinetic Energies
For example, one pathological behavior that frustrates geometric ergodicity is heavy tailsin the target distribution. Heavy tails cause the typical set to push deep into the extremesof parameter space, requiring that any successful Markov chain make prolonged sojournsto the tails and back lest the chain miss significant regions of the typical set.
The progressively long trajectories enabled by dynamic integration time implementationsfacilitate these sojourns in Hamiltonian Markov chains, but sometimes even exponentiallygrowing integration times can be insufficient. In particular, if the kinetic energy is poorly-chosen then the marginal energy distribution can become heavy-tailed itself in which casethe stochastic exploration between level sets will become so slow that after any finitenumber of transitions the exploration of the Markov chain will be incomplete.
Fortunately, such ill-suited kinetic energies are easy to identify by visualizing the marginalenergy density and energy transition density using the Markov chain itself (Betancourt,2016b) (Figure 34). This visualization quickly identifies when the momentum resamplingwill inefficiently explore the energy level sets, especially when aggregating multiple chainsinitialized from diffuse starting points. We can also formalize the mismatch between thesetwo distributions using the Bayesian fraction of missing information,
E-BFMI ≡Eπ[VarπE|q [E | q]
]VarπE [E]
≈ E-BFMI ≡∑N
n=1 (En − En−1)2∑Nn=0
(En − E
)2 .
Empirically, values of this energy Bayesian fraction of missing information below 0.3 haveproven problematic, although more theoretical work is needed to formalize any exact thresh-old.
6.2 Diagnosing Regions of High Curvature
Another common obstruction to geometric ergodicity is neighborhoods in parameterspace where the target distribution exhibits large curvature. As we saw in Section 2.3,

A CONCEPTUAL INTRODUCTION TO HAMILTONIAN MONTE CARLO 45
��� ��� ��� �� ��� ��� ���
���������
�����
�������
(a)
��� ��� ��� �� ��� ��� ���
���������
�����
�������
(b)
Fig 34. The energies explored by a Hamiltonian Markov chain can be used to visualize both the energytransition density, π(E | q), and the marginal energy distribution, π(E). (a) When these distributions arewell-matched the Hamiltonian Markov chain should perform robustly, (b) but if the energy transitions densityis significantly narrower than the marginal energy distribution then the chain may not be able to completelyexplore the tails of the target distribution.
most Markov transitions are not able to resolve these narrow neighborhoods, resultingin incomplete exploration and biased Markov chain Monte Carlo estimators. HamiltonianMarkov transitions are no exception. Because such neighborhoods are characteristic ofmany important models, in particular hierarchical models (Betancourt and Girolami, 2015),these pathologies cannot be ignored in applied practice.
Conveniently, these neighborhoods of high curvature also prove pathological to sym-plectic integrators, which become unstable and diverge once they enter (Figure 35). Impor-tantly, this means that divergent numerical trajectories are extremely sensitive identifiers ofthese pathological neighborhoods and hence provide a powerful and immediate diagnostic.
In particular, any divergent transitions encountered in a Hamiltonian Markov chainshould prompt suspicion of the validity of any Markov chain Monte Carlo estimators.When the pathologies are sufficiently mild, the divergences can be eliminated, and thevalidity of the estimators restored, by decreasing the step size of the symplectic integrator.Often, however, the pathologies are too severe and the divergences will persist regardlessof the how much the step size is decreased, indicating significant bias in the resultingestimators. In these cases the target distribution itself needs to be regularized, for examplewith stronger priors or an alternative representation. A prevalent example of the latteris alternating between centered and non-centered parameterizations in latent Gaussianmodels (Betancourt and Girolami, 2015).
6.3 Limitations of Diagnostics
Although these two diagnostics are powerful means of identifying many pathologicaltarget distributions, they are only necessary and not sufficient conditions for the validity ofthe Markov chain Monte Carlo estimators. Without an explicit theoretical analysis, there
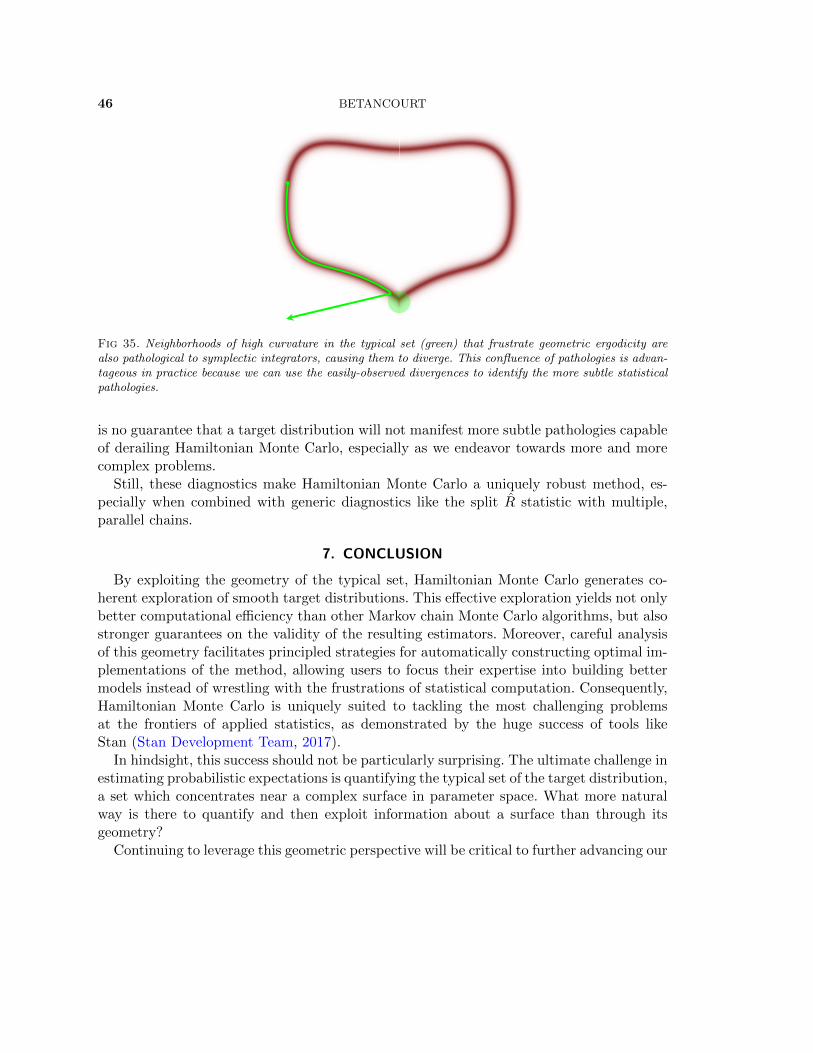
46 BETANCOURT
Fig 35. Neighborhoods of high curvature in the typical set (green) that frustrate geometric ergodicity arealso pathological to symplectic integrators, causing them to diverge. This confluence of pathologies is advan-tageous in practice because we can use the easily-observed divergences to identify the more subtle statisticalpathologies.
is no guarantee that a target distribution will not manifest more subtle pathologies capableof derailing Hamiltonian Monte Carlo, especially as we endeavor towards more and morecomplex problems.
Still, these diagnostics make Hamiltonian Monte Carlo a uniquely robust method, es-pecially when combined with generic diagnostics like the split R statistic with multiple,parallel chains.
7. CONCLUSION
By exploiting the geometry of the typical set, Hamiltonian Monte Carlo generates co-herent exploration of smooth target distributions. This effective exploration yields not onlybetter computational efficiency than other Markov chain Monte Carlo algorithms, but alsostronger guarantees on the validity of the resulting estimators. Moreover, careful analysisof this geometry facilitates principled strategies for automatically constructing optimal im-plementations of the method, allowing users to focus their expertise into building bettermodels instead of wrestling with the frustrations of statistical computation. Consequently,Hamiltonian Monte Carlo is uniquely suited to tackling the most challenging problemsat the frontiers of applied statistics, as demonstrated by the huge success of tools likeStan (Stan Development Team, 2017).
In hindsight, this success should not be particularly surprising. The ultimate challenge inestimating probabilistic expectations is quantifying the typical set of the target distribution,a set which concentrates near a complex surface in parameter space. What more naturalway is there to quantify and then exploit information about a surface than through itsgeometry?
Continuing to leverage this geometric perspective will be critical to further advancing our

A CONCEPTUAL INTRODUCTION TO HAMILTONIAN MONTE CARLO 47
understanding of the Hamiltonian Monte Carlo method and its optimal implementations.This includes everything from improving geometric ergodicity analysis, refining the existingimplementation techniques, and motivating the appropriate use of non-Gaussian and non-Euclidean kinetic energies.
Furthermore, techniques from differential geometry may allow us to generalize the prin-ciples of Hamiltonian Monte Carlo to other, more challenging computational problems.For example, geometric methods have already generalized coherent exploration to ther-modynamic algorithms in Adiabatic Monte Carlo (Betancourt, 2014). Incorporating moresophisticated geometric techniques may allow us to extend these ideas to more intricately-structured parameter spaces, such as discrete spaces, tree spaces, and Hilbert spaces.
8. ACKNOWLEDGEMENTS
This conceptual description of Hamiltonian Monte Carlo was refined over three yearsof frequent speaking engagements coincident with active theoretical research. I am hugelyindebted to Mark Girolami, Simon Byrne, and Samuel Livingstone with whom the theoret-ical work flourished, and the Stan development team with whom the implementations weredeveloped. I also warmly thank Matthew Hoffman, Gareth Roberts, Dan Simpson, ChrisWendl, and everyone who came out to see one of my talks or take the time to ask a ques-tion. The manuscript itself benefited from the valuable comments of Ellie Sherrard-Smith,Daniel Lee, Maggie Lieu, Chris Jones, Nathan Sanders, Aki Vehtari, Cole Monnahan, BobCarpenter, Jonah Sol Gabry, and Andrew Gelman.
This was work supported by EPSRC grant EP/J016934/1, a Centre for Research inStatistical Methodology Fellowship, and a 2014 EPRSC NCSML Award for PostdoctoralResearch Associate Collaboration.
APPENDIX A: TECHNICAL DETAILS OF PRACTICAL IMPLEMENTATIONS
As discussed in Section 4.1, Hamiltonian systems naturally decompose into a micro-canonical distribution over energy level sets and a marginal energy distribution betweenthe energies themselves. Hamiltonian Monte Carlo exploits this structure to generate effi-cient exploration of the canonical distribution, alternating between exploring a given energylevel set and resampling the momenta to generate a random walk over the marginal energydistribution.
In particular, the exploration over the energy level sets is readily accomplished by follow-ing the trajectories generated by the Hamiltonian. These trajectories are not only energypreserving, and hence confined to a single energy level set, they are typically ergodic andwill explore that entire level set as the trajectories are integrated for longer and longer.More formally, a uniform sample from an ergodic trajectory converges to a sample fromthe microcanonical distribution.
Unfortunately we cannot implement this idealized method in practice because outsideof a few exceptional systems we cannot generate Hamiltonian trajectories analytically. In-stead we have to work with the approximate trajectories given by numerical integrators.

48 BETANCOURT
Fortunately, Hamiltonian systems admit very powerful symplectic integrators whose nu-merical errors not only are small but also can be exactly rectified with straightforwardprobabilistic corrections.
In this appendix I will review the technical details of how the numerical trajectories fromsymplectic integrators can be utilized to generate samples from the exact microcanonicaldistribution, first for the case of static trajectories of a fixed length and then dynamictrajectories that grow until a given termination criterion is met. Finally I will comment onhow these implementations relate to the No-U-Turn sampler and Stan.
A.1 Notation
Let z = (q, p) denote a point in phase space. A symplectic integrator generates a numer-ical trajectory, t, from any such point by integrating either forwards and backwards for anincremental amount of time, ε, reducing all of phase space to the discrete set of points thatcan be reached by the symplectic integrator.
Given an initial point, z0, let zn denote the point reached by integrating forward n times,and z−n the point reached by integrating backwards n times. Example trajectories of lengthL = 3 then include t = {z0, z1, z2}, t = {z−1, z0, z1}, and t = {z−2, z−1, z0}.
I will write the set of all symplectic integrator trajectories of length L that contain thepoint z as TLz . Similarly, I will denote the set of numerical trajectories of length L thatcontain the points z and z′ as TLz,z′ , i.e.
TLz,z′ = TLz ∩ TLz′ .
A.2 Static Implementations
Symplectic integrators are not exactly energy preserving, causing their numerical trajec-tories to deviate from the target energy level set. In particular, sampling a state uniformlyfrom any numerical trajectory will not generate a sample from the canonical distribution.This error, however, can be exactly corrected by sampling from the trajectory not uniformlybut rather with weights proportional to the desired canonical density function.
The easiest way to reason about any such scheme is sequentially, first by sampling anumerical trajectory that contains the initial point, T(t | z), and then sampling a statefrom that trajectory, T(z′ | t), yielding the joint transition
T(z′ | z) =∑t
T(z′ | t)T(t | z),
where the sum runs over all numerical trajectories.
A.2.1 Sampling a Trajectory In the static case we consider only the trajectories of lengthL that contain the initial point, z, in which case T(t | z) is supported only on TLz .
In order to ensure a valid correction, this transition from states to trajectories has toexhibit a certain reversibility. Formally we require that the probability of transitions to a

A CONCEPTUAL INTRODUCTION TO HAMILTONIAN MONTE CARLO 49
trajectory is the same regardless of from which state in that trajectory we might begin,
T(t | z) = T(t | z′), t ∈ TLz,z′ .
This has the important implication that
I(z′ ∈ t)T(t | z) = I(z ∈ t)T(t | z),
where I is the indicator function.In practice this condition is most easily satisfied by uniformly sampling over all of the
trajectories that contain the initial point,
T(t | z) = U(TLz),
as T(t | z) = T(t | z′) = L−1 if TLz,z′ 6= ∅.
A.2.2 Sampling a State Once we have sampled a numerical trajectory, we can generatea sample from the exact canonical distribution with any process that yields transitionprobabilities proportional to the canonical densities,
T(z′ | t) =π(z′)∑z′′∈t π(z′′)
I(z′ ∈ t)(1)
=e−H(z′)∑z′′∈t e
−H(z′′)I(z′ ∈ t).
If the symplectic integrator were exact, and the numerical trajectories confined to theinitial energy level set, then these transition probabilities would reduce to the uniform dis-tribution over the states in the trajectory, as desired. In practice the error in the numericaltrajectory induces non-uniform transition probabilities that disfavor deviations towardshigher energies.
There are various schemes capable of yielding the desired transition probabilities. Forexample, we could implement a slice sampler by augmenting the transition with a randomvariable u ∼ U (0, π(z)), and then sampling uniformly from those states in the trajectorysatisfying π(z′) > u.
We can also achieve the desired transition probabilities directly, however, by simplydrawing from a multinomial distribution over the states in the trajectory with probabilities
P(z′) =π(z′)∑z′′∈t π(z′′)
.
Not only is this approach straightforward to implement, the Rao-Blackwell Theorem es-tablishes that the lack of auxiliary random variables will ensure better performance.

50 BETANCOURT
A.2.3 Invariance of the Canonical Distribution Symplectic integrators are able to realizesuch high practical performance because they exactly preserve volume in phase space.Conveniently, this volume preservation also ensures that we can achieve samples from theexact canonical distribution with any transition that preserves the canonical density,
π(z) ∝ e−H(z).
An explicit calculation shows that the properties laid out above are sufficient to guaranteethis invariance, ∑
z
T(z′|z)π(z) =∑z
∑t
T(z′ | t)T(t | z)π(z)
=∑z
∑t
π(z′)∑z′′∈t π(z′′)
I(z′ ∈ t)T(t | z)π(z)
=∑z
∑t
π(z′)∑z′′∈t π(z′′)
I(z ∈ t)T(t | z′)π(z)
=∑t
π(z′)∑z′′∈t π(z′′)
T(t | z′)∑z
I(z ∈ t)π(z)
= π(z′)∑
t
1∑z′′∈t π(z′′)
T(t | z′)∑z∈t
π(z)
= π(z′)∑
t
T(t | z′)
= π(z′).
A.3 Efficient Static Implementations
The problem with this initial scheme is that it requires us to keep the entire trajectoryin memory in order to generate the transition. For static trajectories of length L, thisrequires keeping L states in memory at any given time, which can become burdensome inhigh-dimensional problems. We can construct a much more efficient transition, however,by weaving the sampling from T(z′ | t) into the construction of the trajectory, t, itself.
A.3.1 Uniform Progressive Sampling Instead of sampling a trajectory containing theinitial point at once, consider generating a random trajectory sequentially. We begin witha trajectory containing the initial point, told and then append a new trajectory, tnew,by randomly integrating either forwards or backwards in time. The union of these twocomponent trajectories gives the complete trajectory, t = told ∪ tnew.
If we had samples from both the old and new trajectories according to (1),
zold ∼ T(z′ | told), znew ∼ T(z′ | tnew),

A CONCEPTUAL INTRODUCTION TO HAMILTONIAN MONTE CARLO 51
then we could generate a sample from the entire trajectory with a Bernoulli process thattakes z = zold with probability pold and z = znew otherwise (Figure 36), where
pold =wold
wold + wnew,
with wold =∑
z∈told π(z) and wnew =∑
z∈tnew π(z).Formally we have
T(z′ | t) = pold T(z′ | told) + (1− pold)T(z′ | tnew)
=wold
wold + wnewT(z′ | told) +
wnew
wold + wnewT(z′ | tnew),(2)
which immediately follows from the definition,
wold
wold + wnewT(z′ | told) +
wnew
wold + wnewT(z′ | tnew)
=
∑z′′∈told π(z′′)∑z′′∈t π(z′′)
π(z′)∑z′′∈told π(z′′)
I(z′ ∈ told)
+
∑z′′∈tnew π(z′′)∑z′′∈t π(z′′)
π(z′)∑z′′∈tnew π(z′′)
I(z′ ∈ tnew)
=π(z′)∑z′′∈t π(z′′)
I(z′ ∈ told) +π(z′)∑z′′∈t π(z′′)
I(z′ ∈ tnew)
=π(z′)∑z′′∈t π(z′′)
(I(z′ ∈ told) + I(z′ ∈ tnew)
)=
π(z′)∑z′′∈t π(z′′)
I(z′ ∈ t)
= T(z′ | t).
This progressive sampling allows us to generate a sample as we build the trajectory itself,keeping only a few states in memory at any given time. For example, starting with the initialpoint as the active sample we could repeatedly expand the trajectory by integrating onestep forward or backwards in time and then update the active sample using the transitionabove, yielding at once both t ∼ T(t | z) = U
(TL+1z
)and z′ ∼ T(z | t). This additive
expansion scheme also coincides with Neal’s windowed sampler when the window lengthequals the full trajectory length (Neal, 1994).
We can also expand faster by doubling the length of the trajectory at every iteration,yielding a sampled trajectory t ∼ T(t | z) = U
(T2Lz
)with the corresponding sampled state
z′ ∼ T(z′ | t). In this case both the old and new trajectory components at every iterationare equivalent to the leaves of perfect, ordered binary trees (Figure 37). This allows us tobuild the new trajectory components recursively, propagating a sample at each step in therecursion using (2) until we have both a new trajectory and a new sample (Figure 38).

52 BETANCOURT
zold ∼ T(z | told) znew ∼ T(z | tnew)
(a)
z ∼ T[z | told ∪ tnew] =wold
wold+wnewT(z | told) + wnew
wold+wnewT(z | tnew)
(b)
Fig 36. (a) Given samples from two adjoining numerical trajectories (b) we can generate a sample fromtheir union with a Bernoulli process, effectively mixing the two component transition distributions into thecorrect joint transition distribution. This allows us to sample from a trajectory progressively during it’sconstruction, transitioning first between the old and the new components and then a sample therein.
Fig 37. When the length of a numerical trajectory is a power of 2, L = 2D, the trajectory is equivalent tothe leaves of a perfect, ordered binary tree of depth D.

A CONCEPTUAL INTRODUCTION TO HAMILTONIAN MONTE CARLO 53
z−2 z−1 z0 z1
(a)
+
z2 z3 z4 z5
(b)
= =
z−2 z−1 z0 z1 z2 z3 z4 z5
(c)
z2
→
z2 z3
→
z2 z3 z4 z5
(d)
Fig 38. In multiplicative trajectory expansion we start with (a) an old trajectory component of lengthL = 2D that contains the initial point, z0, and append (b) a new trajectory component of the same lengthby randomly integrating either forwards or backwards in time. (c) This yields a trajectory twice as long asthe initial trajectory sampled from t ∼ T(t | z0) = U
(T2Lz0
), with a sampled state z′ ∼ T(z′ | t) generated
concurrently from (2). (d) The same process can be also be used to recursively build up the new trajectorycomponent, here initialized from z2, and a corresponding sample znew ∼ T(z′ | tnew).

54 BETANCOURT
A.3.2 Biased Progressive Sampling This progressive approach to sampling a state froma random trajectory also provides an opportunity to introduce anti-correlations into thetransition and potentially improve performance. Specifically, we can use an alternativetransition that satisfies
T(z′ | t) = min
(1,wnew
wold
)T(z′ | tnew) +
(1−min
(1,wnew
wold
))T(z′ | told),
where T(z′ | told) and T(z′ | tnew) are given by (1) as in the uniform progressive samplingapproach.
Any such transition favors samples from the new trajectory component and hence biasesthe transition away from the initial state. When we average over all possible initial states ina given trajectory, however, these repulsions cancel to ensure that we preserve the canonicaldistribution restricted to the sampled trajectory,∑z
T(z′ | z)π(z) I(z ∈ t) =∑z
T(z′ | z)π(z) I(z ∈ told) +∑z
T(z′ | z)π(z) I(z ∈ tnew)
=∑z
T(z′ | told)π(z) I(z ∈ told) +∑z
T(z′ | tnew)π(z) I(z ∈ tnew)
= T(z′ | told)∑z
π(z) I(z ∈ told) + T[z′ | tnew]∑z
π(z) I(z ∈ tnew)
= T(z′ | told)wold + T(z′ | tnew)wnew
= min
(1,wnew
wold
)π(z′)
wnewI(z′ ∈ tnew)wold
+
(1−min
(1,wnew
wold
))π(z′)
woldI(z′ ∈ told)wold
+ min
(1,wold
wnew
)π(z′)
woldI(z′ ∈ told)wnew
+
(1−min
(1,wold
wnew
))π(z′)
wnewI(z′ ∈ tnew)wnew
= min
(wold
wnew, 1
)π(z′)I(z′ ∈ tnew)
+
(1−min
(1,wnew
wold
))π(z′)I(z′ ∈ told)
+ min
(wnew
wold, 1
)π(z′)I(z′ ∈ told)
+
(1−min
(1,wold
wnew
))π(z′)I(z′ ∈ tnew)
= π(z′) I(z′ ∈ told) + π(z′) I(z′ ∈ tnew)
= π(z′) I(z′ ∈ t).

A CONCEPTUAL INTRODUCTION TO HAMILTONIAN MONTE CARLO 55
A.4 Dynamic Implementations
No matter how efficient we can make a static scheme, it will unfortunately be funda-mentally limited. Aside from a few exceptionally simple problems, each energy level setwill require a different integration time to achieve the same effective exploration. Somelevel sets can be surveyed with only short integration times, while others require very longintegration times. In order to ensure optimal performance of the Hamiltonian Monte Carlomethod we need dynamic implementations that can automatically tune the integrationtime to approximate uniform exploration across all energy level sets.
Fortunately, the efficient static schemes discussed in Section A.3 can be iterated toachieve a dynamic implementation once we have chosen a criterion for determining whena trajectory has grown long enough to satisfactory explore the corresponding energy levelset. We first building an initial trajectory of a given length and then check the terminationcriterion. If the criterion is not met, we expand the trajectory further and repeat, but ifthe criterion is met then we return the trajectory and its corresponding sample.
Care must be taken, however, to ensure that such a dynamic scheme does not obstructthe reversibility of the trajectory sampling and hence the desired invariance of the canon-ical distribution. In this section I will first demonstrate how naive dynamic schemes canfrustrate reversibility and what steps we have to take to avoid these problems. With a validdynamic implementation understood I will then review potential termination criteria.
A.4.1 Maintaining Reversibility The problem with the naive dynamic scheme discussedabove is that it can violate the reversibility condition,
T(t | z) = T(t | z′), t ∈ TLz,z′ ,
for the expanded trajectory, and hence the bias the stationary distribution of the resultingMarkov chain. In particular, if we initialize from a different point in the final trajectorythen the dynamic trajectory expansion might terminate prematurely before reaching thefinal trajectory, causing T(t | z) to vanish for some initial states but not others (Figure 39).
In order to equalize the transition probabilities we have to reject any trajectory expan-sions that contains certain sub-trajectories satisfying the termination criterion and hencestates that would have prematurely terminated if we had instead begun there. For example,if we expand the trajectories additively then we need to check the termination criterion forthe sub-trajectories beginning at every state in the old trajectory and ending at the singlestate in the new trajectory, inducing a cost linear in the size of the old trajectory (Figure40a). Doing this for each expansion results in a cost quadratic in the final trajectory length.
If we expand the trajectories multiplicatively, however, then we need check only the sub-trajectories equivalent to binary sub-trees of the new trajectory, at a cost just logarithmicin the size of the old trajectory (Figure 40b) and a total cost quadratic only in the log offinal trajectory length. Moreover, because the checks occur across sub-trees we can computethem concurrently as we build the new trajectory. If any sub-tree satisfies the termination

56 BETANCOURT
z−2 z−1 z0 z1 z2 z3 z4 z5
Fig 39. Naively expanding a trajectory until a dynamic termination criterion is satisfied is not sufficient toensure reversibility and hence the validity of the resulting Markov chain. When expanding trajectories mul-tiplicatively, for example, if the termination criterion is satisfied by any sub-tree, for example the trajectorybeginning at z2 and ending at z3, then both T(t | z2) = 0 and T(t | z3) = 0 despite T(t | z0) 6= 0. To avoidthis pathology we have to reject any trajectory expansions that contain such pathological sub-trajectories.
z−2 z−1 z0 z1 z2
(a)
z−2 z−1 z0 z1 z2 z3 z4 z5
(b)
Fig 40. (a) In an additive expansion scheme we have to check the termination criterion for all sub-trajectories between each point in the old trajectory and the single point in the new trajectory. (b) In amultiplicative expansion scheme, however, we need to check the termination criterion across only the binarysub-trees of the new trajectory.
criterion prematurely then we can immediately reject the new trajectory without havingto build it to completion.
A.4.2 Dynamic Termination Criteria Now we can finally consider explicit terminationcriteria that can, to varying degrees of success, identify when a trajectory is long enoughto yield sufficient exploration of the neighborhood around the current energy level set. Inparticular, we want to avoid both integrating too short, in which case we would not take fulladvantage of the Hamiltonian trajectories, and integrating too long, in which case we wasteprecious computational resources on exploration that yields only diminishing returns.
The first criterion of this form was a heuristic introduced in the No-U-Turn sampler (Hoff-man and Gelman, 2014) that considered only the boundaries of a trajectory. Let z−(t) andz+(t) be the boundaries of the trajectory t that can be reached by integrating backwardsand forwards in time, respectively (Figure 41). Similarly, denote q±(t) and p±(t) as theposition and momentum at each boundary. On Euclidean space we can then write the

A CONCEPTUAL INTRODUCTION TO HAMILTONIAN MONTE CARLO 57
z−2 z−1 z0 z1 z2 z3 z4 z5
z−(t) = z−2 z+(t) = z5
Fig 41. The No-U-Turn termination criterion considers only the boundaries of a trajectory. The negativeboundary, z−(t), refers to the boundary that can be reached by integrating backwards in time, while thepositive boundary, z+(t) refers to the boundary that can be reached by integrating forwards in time.
−p−(t)
q−(t)
p+(t)
q+(t)
(a)
−p−(t)
q−(t)
p+(t)
q+(t)
(b)
Fig 42. (a) When the No-U-Turn termination criterion is not satisfied, expanding the trajectory in ei-ther direction typically extends the trajectory further across the energy level set (grey) towards unexploredneighborhoods. (b) When the No-U-Turn termination criterion is satisfied, however, further expansion typi-cally contracts the boundaries of the trajectory towards each other and neighborhoods that have already beenexplored. Stopping when the No-U-Turn termination criterion is just satisfied typically ensures that eachtrajectory efficiently explores about half of the energy level set. Although this can be too aggressive, it workswell empirically and is far superior to any scheme with only a static integration time.
No-U-Turn termination criterion as
p+(t)T · (q+(t)− q−(t)) < 0
AND p−(t)T · (q−(t)− q+(t)) < 0.(3)
This termination criterion is satisfied only when the momentum at both ends of thetrajectory are anti-aligned along the line connecting the positions at each boundary. Inthis case we would expect further integration in either direction to bring the ends of thetrajectory closer together, which typically happens only when the trajectory has alreadyexpanded across the width of the energy level set (Figure 42).
Unfortunately, the original No-U-Turn termination criterion is well-defined only for Eu-clidean manifolds where we can rigorously define subtraction between points, and hence isinapplicable for non-Euclidean kinetic energies. Fortunately, however, the criterion can bereadily generalized. First note that on a Euclidean manifold
q+(t)− q−(t) =
∫ t=T (t)
t=0dtM−1 · p(t),

58 BETANCOURT
where T (t) is the integration time needed to reach the positive boundary of the trajectory,z+(t), from the negative boundary, z+(t). Substituting this into (3), for example, allows usto write the first term of the No-U-Turn termination criterion as
p+(t)T · (q+(t)− q−(t)) = p+(t)T ·M−1 ·∫ t=T (t)
t=0dt p(t) = p]+(t)T · ρ(t)
wherep](t) ≡M−1 · p(t)
and
ρ(t) ≡∫ t=T (t)
t=0(t)dt p(t).
Continuing the substituting into the second term, and being careful with the signs, thengives the equivalent termination criterion,
p]+(t)T · ρ(t) < 0 AND p]−(t)T · ρ(t) < 0.
This new form is well-defined for any Riemannian manifold and hence defines a proper gen-eralization of the No-U-Turn termination criterion to Riemannian manifolds (Betancourt,2013b).
Although we can’t compute ρ analytically in practice, we can readily approximate it asa discrete sum over the momenta in the numerical trajectory generated by the symplecticintegrator,
ρ(t) ≈∑z∈t
p(z).
Because of the high accuracy of symplectic integrators, this approximation yields almostidentical results as at the original No-U-Turn criterion.
The geometry of the Hamiltonian systems behind Hamiltonian Monte Carlo also mo-tivates another termination criterion that doesn’t require any Riemannian structure atall. Exhaustions track a quantity inherent to Hamiltonian systems called the virial todetermine when an energy level set has been sufficiently explored (Betancourt, 2016a).Unfortunately exhaustions introduce an additional tuning parameter that strongly effectsthe performance of the resulting implementation. Although careful hand-tuning can yieldbetter performance than implementations that use the No-U-Turn termination criterion,we need to understand how to automatically tune exhalations before they can become apractical competitor.
A.5 The No-U-Turn Sampler and the Current State of Stan
With the hindsight of this analysis, we see that the original No-U-Turn sampler (Hoffmanand Gelman, 2014) is a dynamic implementation of Hamiltonian Monte Carlo. In additionto the employing the No-U-Turn termination criterion discussed in Section A.4.2, the No-U-Turn sampler uses a multiplicative expansion of each trajectory and a slice sampler to

A CONCEPTUAL INTRODUCTION TO HAMILTONIAN MONTE CARLO 59
sample states from those trajectories. Each new trajectory component is sampled usinguniform progressive sampling, but the sample update when appending the new componentis generated with biased progressive sampling.
Although Stan (Stan Development Team, 2017) was first developed around this originalNo-U-Turn sampler, more recent releases have adopted some modifications. In addition tothe generalized No-U-Turn termination criterion, the Hamiltonian Monte Carlo implemen-tation in Stan uses multinomial sampling from each trajectory instead of slice sampling,which provides a significant improvement in overall performance.
REFERENCES
Betancourt, M. (2013a). A General Metric for Riemannian Hamiltonian Monte Carlo. In First Interna-tional Conference on the Geometric Science of Information (F. Nielsen and F. Barbaresco, eds.).Lecture Notes in Computer Science 8085. Springer.
Betancourt, M. (2013b). Generalizing the No-U-Turn Sampler to Riemannian Manifolds. ArXiv e-prints1304.1920.
Betancourt, M. (2014). Adiabatic Monte Carlo. ArXiv e-prints 1405.3489.Betancourt, M. (2016a). Identifying the Optimal Integration Time in Hamiltonian Monte Carlo. ArXiv
e-prints 1601.00225.Betancourt, M. (2016b). Diagnosing Suboptimal Cotangent Disintegrations in Hamiltonian Monte Carlo.
ArXiv e-prints 1604.00695.Betancourt, M., Byrne, S. and Girolami, M. (2014). Optimizing The Integrator Step Size for Hamil-
tonian Monte Carlo. ArXiv e-prints 1410.5110.Betancourt, M. and Girolami, M. (2015). Hamiltonian Monte Carlo for Hierarchical Models. In Cur-
rent Trends in Bayesian Methodology with Applications (U. S. Dipak K. Dey and A. Loganathan, eds.)Chapman & Hall/CRC Press.
Betancourt, M., Byrne, S., Livingstone, S. and Girolami, M. (2014). The Geometric Foundations ofHamiltonian Monte Carlo. ArXiv e-prints 1410.5110.
Bishop, C. M. (2006). Pattern Recognition and Machine Learning. Information Science and Statistics.Springer, New York.
Blanes, S., Casas, F. and Sanz-Serna, J. M. (2014). Numerical integrators for the Hybrid Monte Carlomethod. ArXiv e-prints 1405.3153.
Brooks, S., Gelman, A., Jones, G. L. and Meng, X.-L., eds. (2011). Handbook of Markov Chain MonteCarlo. CRC Press, New York.
Duane, S., Kennedy, A. D., Pendleton, B. J. and Roweth, D. (1987). Hybrid Monte Carlo. PhysicsLetters B 195 216 - 222.
Fernandez-Pendas, M., Akhmatskaya, E. and Sanz-Serna, J. M. (2015). Adaptive multi-stage inte-grators for optimal energy conservation in molecular simulations. ArXiv e-prints 1512.03335.
Gelman, A., Carlin, J. B., Stern, H. S., Dunson, D. B., Vehtari, A. and Rubin, D. B. (2014).Bayesian Data Analysis, third ed. Texts in Statistical Science Series. CRC Press, Boca Raton, FL.
Geyer, C. J. (1992). Practical Markov Chain Monte Carlo. Statistical Science 473–483.Girolami, M. and Calderhead, B. (2011). Riemann Manifold Langevin and Hamiltonian Monte Carlo
Methods. Journal of the Royal Statistical Society: Series B (Statistical Methodology) 73 123–214.Hairer, E., Lubich, C. and Wanner, G. (2006). Geometric Numerical Integration: Structure-Preserving
Algorithms for Ordinary Differential Equations. Springer, New York.Hastings, W. K. (1970). Monte Carlo Sampling Methods Using Markov Chains and Their Applications.
Biometrika 57 97–109.Hoffman, M. D. and Gelman, A. (2014). The No-U-Turn Sampler: Adaptively Setting Path Lengths in
Hamiltonian Monte Carlo. Journal of Machine Learning Research 15 1593–1623.

60 BETANCOURT
Holmes, S., Rubinstein-Salzedo, S. and Seiler, C. (2014). Curvature and Concentration of HamiltonianMonte Carlo in High Dimensions.
Leimkuhler, B. and Reich, S. (2004). Simulating Hamiltonian Dynamics. Cambridge University Press,New York.
Livingstone, S., Betancourt, M., Byrne, S. and Girolami, M. (2016). On the Geometric Ergodicityof Hamiltonian Monte Carlo.
MacKay, D. J. C. (2003). Information Theory, Inference and Learning Algorithms. Cambridge UniversityPress, New York.
Metropolis, N., Rosenbluth, A. W., Rosenbluth, M. N., Teller, A. H. and Teller, E. (1953).Equation of State Calculations by Fast Computing Machines. The journal of chemical physics 21 1087.
Mira, A., Solgi, R. and Imparato, D. (2013). Zero Variance Markov chain Monte Carlo for Bayesianestimators. Statistics and Computing 23 653–662.
Neal, R. M. (1994). An Improved Acceptance Procedure for the Hybrid Monte Carlo Algorithm. Journalof Computational Physics 111 194–203.
Neal, R. M. (1995). Bayesian Learning for Neural Networks PhD thesis, University of Toronto.Neal, R. M. (2011). MCMC Using Hamiltonian Dynamics. In Handbook of Markov Chain Monte Carlo
(S. Brooks, A. Gelman, G. L. Jones and X.-L. Meng, eds.) CRC Press, New York.Oates, C. J., Girolami, M. and Chopin, N. (2016). Control functionals for Monte Carlo integration.
Journal of the Royal Statistical Society: Series B (Statistical Methodology).Robert, C. P. and Casella, G. (1999). Monte Carlo Statistical Methods. Springer New York.Roberts, G. O. and Rosenthal, J. S. (2004). General State Space Markov Chains and MCMC Algo-
rithms. Probability Surveys 1 20–71.Stan Development Team (2017). Stan: A C++ Library for Probability and Sampling, Version 2.14.0.
http://mc-stan.org/.