A Computer Vision Based Tree Ring Analysis and Dating System
99
Transcript of A Computer Vision Based Tree Ring Analysis and Dating System

A Computer Vision Based Tree Ring Analysis
and Dating System
by
W� Steven Conner
A Thesis Submitted to the Faculty of the
DEPARTMENT OF ELECTRICAL � COMPUTER
ENGINEERING
In Partial Ful�llment of the RequirementsFor the Degree of
Masters of Science
In the Graduate College
The University of Arizona
� � � �

�
Statement by Author
This thesis has been submitted in partial ful�llment of requirements for an ad�vanced degree at The University of Arizona and is deposited in the University Libraryto be made available to borrowers under rules of the Library�
Brief quotations from this thesis are allowable without special permission� pro�vided that accurate acknowledgment of source is made� Requests for permission forextended quotation from or reproduction of this manuscript in whole or in part maybe granted by the head of the major department or the Dean of the Graduate Collegewhen in his or her judgment the proposed use of the material is in the interests ofscholarship� In all other instances� however� permission must be obtained from theauthor�
Signed�
Approval by Thesis Director
This thesis has been approved on the date shown below�
Robert A� SchowengerdtProfessor of ELECTRICAL �COMPUTER ENGINEERING
Date

Acknowledgments
I would like to thank Martin Munro for his technical support and assistance through�out the project� I thank Paul Sheppard for providing algorithms and assistance forcomputerized skeleton plot generation� and Matt Kopala for the initial port of theskeleton plotting algorithm to TclTk� My gratitude goes out to Jim Burns fortesting the software and providing advice and recommendations on how to make thesystem more useful and intuitive for dendrochronologists� I wish to thank Dr� RobertSchowengerdt and Dr� Malcolm Hughes for devising the concept for TREES and pro�viding invaluable advice and ideas� Finally� a special thanks to all of my friends andfamily for their support and encouragement�
This work was supported by the National Science Foundation� Grant SBR��������and the University of Arizona� O�ce of the Vice President for Research�

�
Dedication
I dedicate this thesis to my lovely wife Mary� whose love� support� and friendship
have made it all worthwhile�

Table of Contents
List of Tables � � � � � � � � � � � � � � � � � � � � � � � � � � � � � � � � � � �
List of Figures � � � � � � � � � � � � � � � � � � � � � � � � � � � � � � � � � �
Abstract � � � � � � � � � � � � � � � � � � � � � � � � � � � � � � � � � � � � � �
Chapter �� INTRODUCTION � � � � � � � � � � � � � � � � � � � � � � � ������ Problem Statement � � � � � � � � � � � � � � � � � � � � � � � � � � � � ������ Overview of Thesis � � � � � � � � � � � � � � � � � � � � � � � � � � � � ����� Overview of Dendrochronology � � � � � � � � � � � � � � � � � � � � � � ��
����� The Douglass Method of Cross�Dating � � � � � � � � � � � � � ������� TREES System Overview � � � � � � � � � � � � � � � � � � � � �
���� Review of Earlier Systems � � � � � � � � � � � � � � � � � � � � � � � � �������� DENDRO � � � � � � � � � � � � � � � � � � � � � � � � � � � � � �������� MacDRUID � � � � � � � � � � � � � � � � � � � � � � � � � � � � ������� Re�ected�Light Image Analysis System � � � � � � � � � � � � � ��
Chapter �� SOFTWARE ENGINEERING � � � � � � � � � � � � � � � � ������ Algorithm Development � � � � � � � � � � � � � � � � � � � � � � � � � ��
������ SADIE Image Processing Library � � � � � � � � � � � � � � � � �������� Limitations of SADIE � � � � � � � � � � � � � � � � � � � � � � ������� Modi�cations to SADIE for TREES � � � � � � � � � � � � � � � �
���� Graphical User Interface Design � � � � � � � � � � � � � � � � � � � � � �������� TclTk � � � � � � � � � � � � � � � � � � � � � � � � � � � � � � � � ������ Interfacing TclTk to SADIE � � � � � � � � � � � � � � � � � � ������� Example Graphical User Interfaces from TREES � � � � � � � � ��
��� Shared Database � � � � � � � � � � � � � � � � � � � � � � � � � � � � � �
Chapter �� DATA ACQUISITION � � � � � � � � � � � � � � � � � � � � � ����� Sample Preparation � � � � � � � � � � � � � � � � � � � � � � � � � � � � ��� Sequential Capture of Images � � � � � � � � � � � � � � � � � � � � � � ��� Automatic Focus Detection � � � � � � � � � � � � � � � � � � � � � � � ���� Flat Fielding � � � � � � � � � � � � � � � � � � � � � � � � � � � � � � � ��� � Image Registration � � � � � � � � � � � � � � � � � � � � � � � � � � � � ��
� ��� Spatial Registration � � � � � � � � � � � � � � � � � � � � � � � � ��� ��� Gain and Bias Registration � � � � � � � � � � � � � � � � � � � ��
��� Creation of Mosaic � � � � � � � � � � � � � � � � � � � � � � � � � � � � �

Table of Contents�Continued
�
Chapter �� RING BOUNDARY DETECTION � � � � � � � � � � � � � ������ Standard Edge Detection Algorithm Results � � � � � � � � � � � � � �
������ Gradient Computation � � � � � � � � � � � � � � � � � � � � � � ������� Canny Edge Detector � � � � � � � � � � � � � � � � � � � � � � � ��
���� Modi�ed Canny Edge Detector � � � � � � � � � � � � � � � � � � � � � �������� Tree Ring Orientation Tracking � � � � � � � � � � � � � � � � � �������� Modi�ed Non�Maxima Suppression � � � � � � � � � � � � � � � �
��� Producing Fully Connected Tree Ring Boundaries from Edge DetectionResults � � � � � � � � � � � � � � � � � � � � � � � � � � � � � � � � � � � ������� Labeling Edge Pixels � � � � � � � � � � � � � � � � � � � � � � � ������� Double Threshold Linking � � � � � � � � � � � � � � � � � � � � ������ Second Linking Stage Based on Characteristics of Tree Rings � ��
Chapter �� MEASUREMENT AND ANALYSIS � � � � � � � � � � � � �� ��� Tree Ring Widths � � � � � � � � � � � � � � � � � � � � � � � � � � � � � ��
����� Direction of Tree Ring Width Measurement � � � � � � � � � � �� ����� Measurement of Average Tree Ring Widths � � � � � � � � � � ��
��� Additional Tree Ring Attributes � � � � � � � � � � � � � � � � � � � � � �� ����� Average Grayscale Pro�les of Tree Rings � � � � � � � � � � � � ��
�� Pattern Matching and Cross�Dating � � � � � � � � � � � � � � � � � � � �� ���� Skeleton Plots � � � � � � � � � � � � � � � � � � � � � � � � � � � �
Chapter �� SUMMARY AND CONCLUSIONS � � � � � � � � � � � � � ������ Summary � � � � � � � � � � � � � � � � � � � � � � � � � � � � � � � � � ������ Conclusions � � � � � � � � � � � � � � � � � � � � � � � � � � � � � � � � ����� Recommendations for Future Contributions � � � � � � � � � � � � � � ��
����� Further Modi�cations to SADIE � � � � � � � � � � � � � � � � � ������� Development of More Robust Edge Detection Techniques � � � ������ Automated Cross�Dating � � � � � � � � � � � � � � � � � � � � � ������� Multi�Session Memory � � � � � � � � � � � � � � � � � � � � � � ����� � TREES as a Substitute for X�Ray Densitometry � � � � � � � � �
References � � � � � � � � � � � � � � � � � � � � � � � � � � � � � � � � � � � � ��

�
List of Tables
Table ���� SADIE Image Data Structure� � � � � � � � � � � � � � � � � � � � ��

�
List of Figures
Figure ���� Example skeleton plot� � � � � � � � � � � � � � � � � � � � � � � � ��Figure ���� Diagram of TREES system� � � � � � � � � � � � � � � � � � � � � ��Figure ��� TREES data processing �ow chart� � � � � � � � � � � � � � � � � ��
Figure ���� Main TREES graphical user interface� � � � � � � � � � � � � � � ��Figure ���� Graphical user interface used to capture a sequence of frames� � �
Figure ��� Example set of captured image frames� � � � � � � � � � � � � � � Figure ��� Radial averaging of a ��D power spectrum into ��D pro�le� � � � �Figure �� Power spectrum versus focus for tree ring images� � � � � � � � � ��Figure ��� Normalized power spectrum versus focus for tree ring images� � ��Figure � � Example of illumination nonuniformity� � � � � � � � � � � � � � ��Figure ��� Search and target areas for registration correlation� � � � � � � � ��Figure ��� E�ects of gain bias adjustment during registration� � � � � � � ��Figure ��� Mean and standard deviation variation during image capture� � ��Figure ��� Comparison of a normal raster mosaic to the MOSAIC IMAGE
format� � � � � � � � � � � � � � � � � � � � � � � � � � � � � � � � � � � � � �Figure ���� Measure of ine�ciency of normal raster storage of a mosaic� � � �
Figure ���� Typical characteristics of a conifer tree ring sample� � � � � � � � �Figure ���� Typical tree ring image samples� � � � � � � � � � � � � � � � � � �Figure ��� Gradient masks used in Sobel �lter� � � � � � � � � � � � � � � � � �Figure ���� Gradient results� � � � � � � � � � � � � � � � � � � � � � � � � � � �Figure �� � Gradient magnitude results� � � � � � � � � � � � � � � � � � � � � ��Figure ���� Direction sectors used in Canny edge detection� � � � � � � � � � ��Figure ���� Canny edge detector results for an example tree ring image� � � �Figure ���� Discrete directions for assumed tree ring orientations� � � � � � � � Figure ���� Example computed tree ring orientations� � � � � � � � � � � � � ��Figure ����� Results of the modi�ed Canny edge detector� � � � � � � � � � � ��Figure ����� Example histograms of gradient magnitude in edges returned by
modi�ed Canny algorithm� � � � � � � � � � � � � � � � � � � � � � � � � � ��Figure ����� Threshold selection for gradient magnitude in edges returned by
modi�ed Canny algorithm� � � � � � � � � � � � � � � � � � � � � � � � � � ��Figure ���� Double threshold linking� � � � � � � � � � � � � � � � � � � � � � �Figure ����� Final step of tree ring fragment linking� � � � � � � � � � � � � � ��
Figure ��� Example width measurements used for computing average ringwidths� � � � � � � � � � � � � � � � � � � � � � � � � � � � � � � � � � � � � ��
Figure ��� Average grayscale pro�le� � � � � � � � � � � � � � � � � � � � � � ��
Figure ���� Example di�cult juniper tree samples� � � � � � � � � � � � � � � �

�
Abstract
This thesis describes the design and implementation of a computer vision based analy�
sis system for dendrochronology� The primary issues covered are software engineering
design� automatic focus detection� illumination distortion� spatial and radiometric
registration of a sequence of images into a single mosaic� edge detection and linking�
and automated measurement� A modi�cation of the Canny edge detection algorithm
that adapts to the variable characteristics of tree ring images is also described� These
issues are not unique to the application� but are likely of interest to anyone developing
automated image analysis systems�

A Computer Vision Based Tree Ring Analysis and Dating
System
W� Steven Conner� M�S�The University of Arizona� ����
Director� Robert A� Schowengerdt
This thesis describes the design and implementation of a computer vision based
analysis system for dendrochronology� The primary issues covered are software engi�
neering design� automatic focus detection� illumination distortion� spatial and radio�
metric registration of a sequence of images into a single mosaic� edge detection and
linking� and automated measurement� A modi�cation of the Canny edge detection
algorithm that adapts to the variable characteristics of tree ring images is also de�
scribed� These issues are not unique to the application� but are likely of interest to
anyone developing automated image analysis systems�

��
Chapter �
INTRODUCTION
��� Problem Statement
This thesis describes the software engineering and image processing issues involved in
the design of a semi�automated� computerized tree ring analysis and dating system
���� It is based on cooperative work between the Electrical and Computer Engineering
Department and the Laboratory of Tree�Ring Research at the University of Arizona�
��� Overview of Thesis
The methods described in this thesis provide a means for increasing the e�ciency of
tree ring analysis� Rather than attempting to produce a fully automated solution�
the philosophy of this project is to create a computer�assisted environment that in�
tegrates analyst intervention with algorithmic decisions� This approach allows the
development of a robust system that can emulate the complex human vision analysis
of tree samples� which often tend to have unpredictable features�
The thesis begins by presenting an overview of dendrochronology and a descrip�
tion of the requirements of the system� Several examples of previous systems that
were developed for the purpose of computerized image analysis of tree rings will be
discussed and contrasted to the work described in this thesis� Software engineering
approaches used in the development of the system are explained� Finally� a descrip�
tion of the requirements for data acquisition is provided� followed by a description of
the computer vision techniques used to identify and measure tree rings�

��
��� Overview of Dendrochronology
The science of tree ring dating� known as dendrochronology� provides techniques for
the precise dating of trees� During each year in the lifetime of many trees� a single
tree ring is created� The outer�most ring before the tree�s bark corresponds to the
current year of a live tree or the last year of growth of a dead tree� and by counting
the rings inward toward the center of the tree it is possible to tell how many years
the tree lived� Moreover� the widths of tree rings vary from year to year� creating
patterns of variation that are present across di�erent trees in a geographical region�
These patterns make it possible to cross�date between tree samples� as described by
Douglass ��� and Stokes and Smiley �����
��� The Douglass Method of CrossDating
The techniques practiced at the Laboratory of Tree�Ring Research used to cross�
date tree samples� collectively known as the Douglass method� were pioneered by
Andrew Douglass at the University of Arizona early in the twentieth century ���� The
Douglass method of tree ring dating involves the use of skeleton plots� which are a
normalized representation of tree ring widths that allow straightforward comparisons
to be made between tree ring width patterns of multiple tree samples� Skeleton plots
are generally created on graph paper� where each vertical line on the graph paper
represents a single year in the lifetime of the tree sample� If a particular ring is
much smaller than neighboring rings� a line is drawn at the corresponding location
on the skeleton plot� The narrower a ring is �relative to its neighbors�� the longer the
line will be� In addition to ring widths� other unique tree ring features such as the
existence of a �frost ring�� which may be caused by a very hard freeze� can be included
symbolically on a skeleton plot� An example skeleton plot is shown in Figure ����
Skeleton plotting allows the graphical representation of the patterns of relative
tree ring width variation� Relative ring widths have a stronger correlation between

��
Figure ���� Example skeleton plot��
samples than absolute tree ring widths� Dendrochronologists who apply the Douglass
method of cross�dating manually create and compare skeleton plots from multiple tree
samples� Samples are dated by visually matching the pattern from one skeleton plot
to another� One of the requirements of the Douglass method of tree ring dating that
sets it apart from other dating techniques is the fact that the original wood sample
must remain available throughout the dating process for reference� After measuring
a tree sample and producing a skeleton plot� it is not a good idea to consider the
skeleton plot to be a ���� accurate representation of the tree�s chronology� This is
because physical anomalies may occur at di�erent times during the lifetime of a tree�
For example� micro rings which are so small that they are not identi�ed during the
initial tree ring width measurement procedure may be present in a sample� In this
case� the years corresponding to micro rings will be missing from the skeleton plot�
Likewise� unusual climate conditions in a particular year might cause the existence of
a false ring in the middle of a single annual growth ring� If this false ring is mistaken
�Courtesy the Laboratory of Tree�Ring Research� the University of Arizona�

�
for an actual tree ring during width measurement� an extra non�existent year will
be included in the skeleton plot� Because a single extra or missing ring will cause
a skeleton plot to be undateable� it is imperative to keep the original wood sample
available to reconcile any problems that are identi�ed during cross�dating�
Researchers invest many hours manually examining tree ring samples under a
microscope� By tediously measuring tree ring features such as ring boundaries and
widths and correlating data from di�erent samples� they are able to perform dating so
precise that Carbon��� dating is calibrated from their results� Despite advancements
in computational speed and image processing algorithms� manual measurement tech�
niques remain the primary approach for collecting tree ring data since no previously
developed automated technique is reliable enough for widespread use�
��� TREES System Overview
The computerized tree�ring dating system described in this thesis� known as TREES�
includes a CCD camera attached to a microscope that is used to acquire images of
a tree ring sample� The sample to be imaged is placed on an x�y positioning table
under the microscope� The camera� microscope focus� and positioning table position
are all controlled by a workstation� A diagram of the TREES system is shown in
Figure ����
TREES is designed to resolve small tree rings while limiting the amount of memory
required to image a tree sample� Tree rings can range from ��� mm in width to several
centimeters� although most are around � mm or less� Typical tree sample sizes range
from �� mm to over ��� cm in length� The hardware chosen for acquiring tree
ring image data consists of a ���x�� Kodak Megaplus ���i CCD digital camera
attached to a Nikon SMZ �U microscope for imaging a cross section or core sample
of a tree situated on a positioning table under the microscope� The microscope is
generally set to a magni�cation of ���X� In order to increase the �eld of view of

��
Figure ���� Diagram of TREES system�
captured frames� a video coupler lens with a magni�cation of ���X is used� creating
a combined magni�cation of ����X and a diagonal �eld of view of approximately
���� mm for each frame� This results in a pixel size on the sample of approximately
�� �m� which is su�cient to resolve most small tree rings� For illumination� a �ber�
optic ring illuminator with a diameter of approximately � mm is mounted on the
objective lens of the microscope� The positioning table includes two stepper motors
under computer control for motion in the X� and Y�directions of up to � cm� with
a precision of about �mm� The table is belt driven �rather than lead screw driven�
for faster positioning over many centimeters� Software correlation techniques are
applied to make up for the low precision of the positioning table when combining
multiple captured frames into a single mosaiced image� Finally� a stepper motor
is also used to control the Z�axis for focus adjustments� The camera� microscope�
focus� and positioning table are all controlled by a Sun ULTRA � workstation with
� � MB of memory� ��� GB disk capacity� and a � MB frame bu�er� With the current
con�guration� a monochrome mosaiced image of a �� mm by mm tree core sample
created from � overlapping frames occupies approximately � MB� The time required

�
to acquire the frames and automatically create the mosaic is under ten minutes�
For the �rst step of the tree ring analysis process� a series of overlapping images are
acquired across the tree sample� from the center of the tree �the pith� to the outer edge
�the bark�� These images must be corrected for any illumination nonuniformity and
normalized for any variation in camera gain and brightness o�set during capture� The
individual frames are correlation�registered into a single mosaic� It is then possible
to apply edge detection techniques to �nd the locations of tree ring boundaries in
the sample mosaic� and then tree ring measurements can be made� Ring widths and
other characteristics may be used to match ring patterns from one tree to another�
allowing cross�dating to be performed� A �ow chart of the data processing steps used
in TREES is shown in Figure ���
Several broad philosophies guide the development of this system� First� the goal is
to create a computer�assisted� not automated� tree ring dating system� When dealing
with natural phenomena such as tree rings� it is virtually impossible to predict all
special cases� Because every tree ring must be accounted for to accurately cross�date a
tree sample� it is better to allow analyst intervention when di�culties arise rather than
attempting to develop a complex algorithm to make decisions with a low probability
of error under all conditions� Also� to improve accuracy and reliability� the system
is wood�centered� rather than image�centered� The analyst can visually explore the
wood surface through the microscope at any point in the tree ring analysis process to
resolve problems of ring identi�cation and dating� The system is primarily meant to
increase the e�ciency of tree ring analysis by detecting and measuring the majority of
the tree rings in a sample with minimum operator intervention� However� the operator
may use expertise in dendrochronology for veri�cation� to provide suggestions to the
system� or to detect subtle or �false� rings�
At the time of writing� the computer vision problems described in this paper are
only partially solved� The algorithms and techniques included here represent the best
methods developed to date to solve the challenges of tree ring analysis�

��
on Tree Sample
Select Regionof Interest
Find Best Focusfor each Frame
of ROI
Capture FramesCovering
ROI
PerformFlat Fielding
on each Frame
FramesRegister
GenerateMosaic
from Frames
DetectTree Ring
Boundaries
MeasureTree Ring
Widths
Skeleton PlotGenerate
Tree Ring SampleCross-Date
Data Acquisition Analysis
Figure ���� TREES data processing �ow chart�

��
��� Review of Earlier Systems
TREES is not the �rst system to apply image analysis to the �eld of dendrochronology�
However� to the knowledge of the TREES project design team� it is the �rst image
analysis system to apply the Douglass method of tree ring dating� For completeness�
an overview of three earlier image analysis systems for dendrochronology is provided�
��� DENDRO
The DENDRO image analysis system for dendrochronology has been implemented
on the Macintosh platform as MacDENDRO ���� �� and the Windows platform as
WinDENDRO ���� This system accepts input image data from either an input image
�le� image data acquired from scanning a tree sample on a �atbed scanner� or from
a digital camera� Tree ring detection in DENDRO is accomplished by analyzing one
or more radial �paths� from the pith to the bark of the sample� These paths must
be de�ned by the analyst before tree ring boundaries can be identi�ed� A maximum
of � paths may be de�ned�
Once paths have been de�ned� DENDRO automatically detects tree rings via one
of two available identi�cation algorithms� The �rst algorithm is a means of completely
automated tree ring detection along each path� It is performed by analyzing the
grayscale intensity di�erences along a given scan line� Any major jumps in intensity
are considered to be tree ring boundaries� The second tree ring detection algorithm
uses a �teach and show� technique� This method requires the analyst to manually
select a valid tree ring boundary in the image� This tree ring boundary is treated as
a model in a form of template matching� and any regions along a scan path that have
similar features to the model are also considered to be tree rings� Once the tree rings
along a path have been identi�ed� their widths are computed along the scan path� If
more than one scan path is created� the measured tree ring widths can be averaged�
DENDRO appears to be the primary commercial image analysis system available

��
to the dendrochronology community� According to the authors of the software� it
produces very good results for typical conifer samples� However� there are several
limitations in DENDRO� First� DENDRO requires an analyst to de�ne radial scan
paths� and therefore� limits the data analyzed from the sample� These scan paths
are one�pixel wide lines and are sensitive to any anomalies which may cause local
variations in tree ring widths� Also� because there is no easy way to return to the
wood in DENDRO� it lacks the requirements of the Douglass method of tree ring
dating that are central to the TREES system�
��� MacDRUID
MacDRUID is an image analysis system for dendrochronology that runs on the Macin�
tosh ����� It uses the commercial Prism Image Analysis System from Dapple Systems�
Inc�� plus the addition of custom Fortran code� The purpose of the system is to ap�
ply image analysis to tree ring densitometry measurements� The �rst step of data
acquisition for the MacDRUID system is to microtome a �� �m thick section of a
sample core� This is a standard procedure used when preparing samples for X�ray
analysis� whether or not it is for the purpose of acquiring image data� Next� an X�ray
negative is created from the microtome and the negative is projected and digitized
with a CCD frame grabber�
In order to perform image analysis on the resulting X�ray image� a region of
interest must be explicitly selected by an analyst� This region must be created with
great care to ensure that all tree ring boundaries within the region of interest are
exactly vertically aligned� This is necessary because each column of pixels in the
region of interest is averaged in order to produce a ��dimensional plot of the data�
Finally� the tree ring boundaries are estimated from the ��dimensional plot at the
locations where the derivative of the data is maximum� From this data� ring widths
and density parameters can be estimated� The authors of the software claim that

��
the results produced by this system are not signi�cantly di�erent from the results
obtained by traditional measurement methods�
��� Re�ectedLight Image Analysis System
The Re�ected�Light Image Analysis System� designed at the Laboratory of Tree Ring
Research at the University of Arizona� measures the brightness of conifer tree rings
and then uses brightness as a substitute for density ���� � � ���� Ring density is a very
useful measurement of tree ring patterns when tree ring widths show little variation�
However� because it must be measured through X�ray densitometry� it is very slow and
expensive� By using a very careful calibration of the imaging system� the techniques
used in the Re�ected�Light Image Analysis System are able to produce a very accurate
estimation of wood density� without the di�culty of X�ray densitometry�
The image analysis algorithms used in this system require the rings to be dated
prior to measuring� Any unwanted noise features such as sap ducts are manually
erased from the image before analysis� When an image of a tree ring sample is ac�
quired� care is taken to ensure that tree ring boundaries within the image are vertically
aligned� If it is known that N tree rings exist in a given tree ring image� the N largest
�rst di�erence locations found while horizontally traversing the image are considered
to be the positions of the rings� Once the positions of the tree rings are computed�
the information is reduced from the ��dimensional image to a ��dimensional repre�
sentation by computing the average of each of the horizontal scans between each pair
of rings� From this information� tree ring widths� earlywood and latewood widths�
and other intra�ring characteristics useful in dating are computed by measuring the
density changes within rings�
The Re�ected�Light Image Analysis System accurately estimates the data ob�
tained by the X�ray densitometry method in a fraction of the time� The primary
disadvantages of this system relative to TREES are that it is unable to determine the

��
locations of tree rings without knowing the tree ring count up front� and orientations
of tree rings are constrained to be vertical�

��
Chapter �
SOFTWARE ENGINEERING
One of the initial requirements of the TREES system was that it must be as portable
as possible across di�erent software hardware environments� The initial version of
TREES has been developed under the UNIX environment on a Sun Solaris worksta�
tion� In the future� it may become necessary to port TREES to a PC environment�
running either Windows or another variant of UNIX such as Linux� in order to reduce
the overall cost of the system and to make it as widely available to dendrochronology
labs around the world as possible�
TclTk was chosen as the graphical user interface �GUI� development language
because programs written in TclTk will run under UNIX� Windows� and Macintosh
operating systems with minimal changes to the source code� For algorithm develop�
ment� C was chosen because it is an e�cient� widely used� and standardized language
for systems development� Another advantage of using C is that a pre�existing library
of image processing routines� known as SADIE� could be adapted as the core of the
image processing and computer vision portions of the system�
��� Algorithm Development
��� SADIE Image Processing Library
SADIE is a library of C image processing routines developed and maintained at
the Digital Image Analysis Laboratory of the University of Arizona� It includes a
relatively complete set of standard image processing routines� including contrast en�
hancement algorithms� gradient �lters such as Sobel� Roberts� and Prewitt� Fourier
and convolution �lters� and classi�cation algorithms� SADIE was chosen as the image

��
parameter variable name data type
� bandsimage nbnd short integer� linesband nlin short integer� columnsband npix short integerpixel value array data�nbnd��nlin��npix� PIXEL
Table ���� SADIE Image Data Structure� These are the data structure variablesthat are relevant to the discussion of the integration of SADIE into TREES� In reality�the data structure includes additional variables�
processing core for the initial development of TREES because it contains many of the
basic image processing routines necessary in an image analysis system� In addition�
since it is actively maintained by researchers at the University of Arizona� it is possi�
ble to modify and extend the library without the licensing fees and copyright issues
that would be present if a commercial image processing package were used� An imple�
mentation of the SADIE library for Macintosh systems is described by Schowengerdt
and Mehldau in ���� ����� and �����
The basic data structure used to store images in SADIE is shown in Table ����
Each SADIE image contains size identi�ers to store the number of bands� number
of lines� and number of pixels �or columns� in the image� The actual image data is
stored in a three dimensional array of type PIXEL� In the SADIE library� PIXELs
are single precision �oating point numbers� In the actual SADIE implementation�
more variables are contained in the image data structure than are shown in Table ����
However� since these additional variables are used in features of the SADIE library
that are not relevant to this project� they are not described here�
��� Limitations of SADIE
While the SADIE library provides a large set of image processing routines� it has
several limitations in the context of an image analysis system such as TREES that
requires very large image arrays to be processed� First� as shown in Table ���� the

�
maximum number of lines andor pixels in a SADIE image is constrained by the
maximum value of a short integer� Assuming that a signed ���bit short integer is
used to store these variables� the maximum number of lines or pixels in an image is
������ If frames of ���� pixels per line are captured during the image acquisition
stage� a maximum width mosaic can hold only around twenty��ve horizontally aligned
frames� Based on the typical image capture resolution described in Section ����� this
will allow approximately �cm of a tree ring sample to be imaged in one mosaic�
The second disadvantage of using the SADIE library for processing very large
images is related to the fact that all image data is stored as ��bit per pixel �oating
point numbers� The ��bit precision is useful during many image processing routines�
especially when round�o� errors can cause problems� However� outside of SADIE
routines� many images do not require this much precision� For example� the camera
used to capture digital images for TREES returns only ��bits of data per pixel� Edge
maps require only one�bit per pixel in the unlabeled case� and an edge label map only
requires enough bits to store the integer range from zero to the number of labeled
fragments in the image �typically less than �������� For this type of image data�
the ��bit per pixel values are very costly� especially in the case of very large image
mosaics�
��� Modi cations to SADIE for TREES
During edge detection and image processing� it is often necessary to work with mul�
tiple versions of an image mosaic simultaneously� such as the original image data�
gradient information� and edge maps� In order to accommodate varying levels of
precision� depending on the type of data in a given image� the single ��bit image
format of the SADIE library has been extended to three image formats for use in
TREES� The normal SADIE image format uses ��bit per pixel �oating point values�
as described above� This type of image is most useful for storing gradient and convo�

��
lution output data� as well as intermediate pixel values during image processing� The
SADIE SHORT image type is identical to the normal SADIE image format� except
for the fact that image data is stored as ���bit unsigned short integers� This type of
image is ideal for storing edge label maps� where the background pixels have a value
of � and foreground edge fragments can have labels ranging from � to � � � Finally�
the SADIE BYTE image format stores pixels as ��bit unsigned characters� which is
useful for storing raw image data from the frame grabber�
In order to maintain compatibility with the existing SADIE library routines� the
new SADIE SHORT and SADIE BYTE image types require their own versions of
any related library routines� This is due to the fact that all of the existing SADIE
library routines expect all SADIE images to use ��bit per pixel data�
In addition to adding the ability to store SADIE images at multiple precisions�
a format has been added for the e�cient storage of a mosaic of image frames� This
MOSAIC IMAGE format is described in detail in Section ���
��� Graphical User Interface Design
In addition to the development of algorithms for performing image processing and
analysis� the design of a graphical user interface is an imperative task in the software
engineering process� The GUI is the interface to the algorithms and data that makes
the system useful to dendrochronologists� Regardless of how powerful a software
package may be� if it is not easy� reliable� and intuitive to use it will not be accepted
in the �eld�
A discussion of the software implementation of the graphical user interface for the
TREES project follows�

�
��� Tcl�Tk
The graphical user interface for TREES has been developed in TclTk� Tcl is a
high level scripting language written by John Ousterhout at UC Berkeley ����� Tcl
is typically packaged with Tk� an extension that provides a toolkit of Tcl commands
for building and manipulating user interface components such as buttons� menus�
dialogs� and image display windows� Because Tcl itself is written in C� it provides
seamless integration with existing C and C�� libraries� making it an ideal interface
to the SADIE library routines described above� Descriptions of the current features
of TclTk are available from Welch ��� and Harrison and McLennan ����
The primary advantage of choosing TclTk as the interface development language
for TREES is the fact that it allows cross�platform compatibility� TclTk was origi�
nally developed for use under the UNIX environment� but it has since been ported to
both Windows and Macintosh� The initial version of TREES is being developed on
a Sun workstation under X�windows� However� in the future TclTk will allow the
vast majority of the program to be ported to another variant of UNIX or even to a
Windows or Macintosh system with few or no changes required in the interface code�
This would not be possible under alternate development languages such as Visual
Basic or XView�
In addition to portability� TclTk has an added advantage of allowing rapid inter�
face prototype development� Tcl is a very high level scripting language with a simple
syntax that allows interface prototypes to be developed with a minimal amount of
code� Since Tcl code is interpreted by a run�time compiler� there is no need to recom�
pile the code when changes are made during the development and debugging stages�
which saves time as well�

��
��� Interfacing Tcl�Tk to SADIE
A set of C libraries are included with Tcl that accommodate the sharing of information
between a TclTk interface and the underlying C or C�� application libraries� The
means of communication is generally based on the sharing of variables between Tcl
and C or C��� Variables can either be passed by value between the two languages�
or they can be linked so that a change in the variable shows up in both Tcl and C
simultaneously�
Unlike C� Tcl is a very loosely typed language and stores variables internally in
a �exible object format� When creating a variable in Tcl� there is no need to declare
its type� Tcl will automatically store it in the appropriate object type� The default
object types built into Tcl are boolean� integer� double precision �oating point� and
string types� Tcl can be extended to add any arbitrary data structure as a valid object
type� However� the default object data types are su�cient for storing and sharing
typical information such as SADIE image addresses and image processing algorithm
parameters�
In an image analysis environment� it is imperative that a graphical user interface
be capable of displaying images on the screen� This is accommodated in TclTk
through photo images and the canvas widget� A Tk photo image is a RGB raster
image that can be displayed to the screen on a canvas� with scrollbars if the image
is very large� Routines are built into TclTk that allow GIF and PNM images to
be converted to photo images� A Tk extension has been developed which takes the
address of a SADIE image that is loaded into memory as input and generates a photo
image representation for display purposes�
In order to allow C functions� such as those available in the SADIE library� to be
called from Tcl� they must be registered with the Tcl interpreter� This is typically
accomplished by creating a special C procedure for each library function that is
capable of receiving a set of standard arguments from a Tcl call� This procedure can

��
receive Tcl objects as input� convert them to the corresponding C data types� use
them as input parameters to a speci�c library routine� and return the results to Tcl
as one or more objects� This procedure can be registered with the Tcl interpreter via
a Tcl library function that associates a new Tcl procedure name with a corresponding
C function�
As an example of how a TclTk interface can communicate with the C SADIE
library� suppose that a SADIE image is currently loaded into memory� and that its
memory address is stored in a Tcl variable� When the analyst instructs the program to
process the image by clicking on a button or choosing a menu command� the address
of the SADIE image is passed to the corresponding C function that was registered
with the interpreter� This C function then passes the image address as the input to
a SADIE image processing routine� and receives as output the address of a newly
generated output image� After returning the address of the output image to Tcl� a
Tk photo image is generated from the SADIE image as described above� Finally the
photo image is displayed to the analyst for feedback in a canvas widget on the screen�
��� Example Graphical User Interfaces from TREES
Figure ��� shows the main TclTk graphical user interface from the TREES program�
The left column of the interface provides buttons to allow the analyst to command
TREES to begin a particular step of analysis� These buttons provide a simpli�ed
means of access to the data processing steps outlined in the �ow chart from Figure ���
When the analyst clicks the mouse on the Capture Frames button� the interface
shown in Figure ��� is opened on the screen to aid in the data acquisition stage of
analysis� This interface allow an analyst to control the x�y positioning table while
viewing the current �eld of view from the CCD camera in the upper�left hand corner
of the GUI� The current position of the positioning table is tracked symbolically in a
graphical coordinate system at the bottom of the GUI� The analyst is able to choose

��
Figure ���� Main TREES graphical user interface�

��
the starting and ending points of a desired region of interest on the wood sample by
placing start and end �ags at the corresponding locations in the �eld of view in the
top left corner� TREES then computes the required number of frames to capture
the region of interest and symbolically displays them to the analyst in the coordinate
system� After the analyst accepts these results� the system positions the stage at
each frame location� �nds the best focus position� captures the frame� and adjusts
the frame for non�uniformity of illumination� This procedure is described in detail in
Chapter �
After capturing the required frames for a sample� the main graphical user interface
of Figure ��� returns to the screen� The analyst may then click on the Create Mosaic
button in order to merge the individual frames into a single mosaic� The procedure
to create a mosaic is described in Chapter � Once a mosaic is created� it is displayed
as a low resolution browse image in a TclTk canvas at the top center of the GUI�
The analyst may continue analyzing the sample by clicking on the Find Rings but�
ton� This commands TREES to perform edge detection� as described in Chapter ��
The detected ring boundaries are overlayed on the browse image for veri�cation by
the analyst� Next� the ring widths are measured using the techniques described in
Chapter by clicking on the Measure Rings button� Finally a computer�generated
skeleton plot is provided at the bottom of the GUI when the analyst clicks on the
Create Skeleton Plot button�
The lines in the skeleton plot are graphically linked to the tree ring boundaries
shown in the mosaic browse image of the main TREES GUI� By pressing the right
and left arrow keys on the keyboard� the arrows above and below the skeleton plot
are shifted in the appropriate direction� and the corresponding tree ring boundaries
are highlighted on the mosaic� This linking allows an analyst to resolve any problems
in the skeleton plot by easily returning to the wood�

�
Figure ���� Graphical user interface used to capture a sequence of frames� Theframe in the upper�left corner displays a live video image of the current microscope�eld of view� while the coordinate system at the bottom of the interface provides areference to allow the analyst to track the position of the stage� After the analystselects a starting and ending point on the sample� a graphical representation of the Nframes required to capture image data of the selected region of interest is displayedin the coordinate system�

�
��� Shared Database
After tree ring edges are detected via computer vision and image processing algo�
rithms� a number of features need to be stored for each tree ring in the sample� For
this reason� a database of tree ring information needs to be created that can be shared
and updated by various components of the TREES software� The image processing
algorithms that process and measure the rings will generate an initial version of the
database� Graphical user interface routines must access the database in order to
create skeleton plots� and have the ability to update the database when an analyst
modi�es a skeleton plot� In the future� automated cross�dating and quality control
procedures will need to have read and write access to the database in order to per�
form correlation and pattern matching algorithms on the data and �x any identi�ed
problems�
Since the functionality of Tcl is already built into TREES for graphical user
interface purposes� the initial shared database has been developed in Tcl� The primary
advantages of building such a database in Tcl are that it allows heterogeneous data
types to easily be assembled into a single data structure� it simpli�es the sharing of the
database between the various components of the system� and the �le IO procedures
built into Tcl make it fairly easy to store and retrieve the database from disk�
The Tcl constructs used to create the shared database include a combination of
lists and arrays� A global Tcl list is used to store a list of variable names� where each
variable represents a single tree ring� Each tree ring variable is itself a global Tcl
array� Each array contains an element for the measured tree ring width as well as
an element representing the normalized tree ring index value� The normalized index
value is a representation of the measured ring width after low frequency trend has
been removed from the series� Next a skeleton plot line length element is included in
the array� This value represents the length of the symbolic line� if any� that is drawn
on the skeleton plot for the given year� as described in Section ����� A list of tags is

�
included as an element of the tree ring array� representing such features as frost rings�
micro rings� and exceptionally wide rings� which can be useful for pattern matching
purposes� Finally� a free�format string of arbitrary length is included as an element
of the tree ring array to store textual notes from the analyst for future reference�
When an analyst is working with a skeleton plot� missing rings may be added and
false rings may be removed from the tree ring sequence� Since the tree ring sequence
is stored as a Tcl list� which is similar to a linked list in C� this is a simple task�
When a missing ring is added to the tree ring sequence� it can simply be added to
an arbitrary location in the list� As long as the ring is tagged as a missing ring that
has been inserted� it can be identi�ed and removed from the sequence at a later time
without di�culty� When removing false rings on the other hand� it is necessary to
take an extra step in order to maintain the ability to return the ring to the list at
a later time� Any time a tree ring is removed from the main list� it is moved to
a second removed ring list rather than deleted� Each item in the removed ring list
should contain both the removed tree ring array and the index at which it would be
inserted if it was to return to the main tree ring list� Each time a tree ring is added
or removed from the main tree ring list� the indices of each ring in the removed ring
list must be updated accordingly�
Although the shared tree ring database has initially been developed in Tcl for
simplicity� this is not a particularly e�cient database implementation� In the future�
it may be bene�cial to develop a more e�cient database implementation in C or
C���

Chapter �
DATA ACQUISITION
��� Sample Preparation
Before beginning a new analysis session� the tree sample to be analyzed must be
acquired and prepared� The two primary forms of tree ring samples that are used in
analysis are cross�sections and core samples�
Tree cross�section samples are produced by cutting down a tree and cutting a
cross�sectional disk from the trunk or a branch� In order for such a cross�sectional
disk to be usable in the TREES system� it must be relatively �at on both sides so
that it can rest on the stage with its surface approximately parallel to the imaging
plane of the microscope� Secondly� it must be no more than two to three inches thick
so that it can �t between the stage and microscope� with enough distance remaining
to allow the surface to be brought into focus in the microscope�
Tree core samples are a less destructive form of a tree ring sample that are pro�
duced by drilling a small hole from the bark of the tree to the pith and extracting the
resulting core� This type of sample tends to be rather fragile� and should be mounted
on a stable base that can be anchored to the system positioning table without causing
damage to the sample�
In order to allow analysis of the tree rings in either cross�sectional or core sam�
ples� the surface of the sample must be sanded and polished� This step is necessary
to remove scratches and grooves from the wood surface that otherwise might be in�
terpreted as tree ring boundaries� Before imaging the samples� they should be free of
any large saw�dust particles� hairs� etc� that might impede analysis of the tree rings
in the sample�
All of the sample preparation steps listed here are typically performed before

�
traditional visual analysis of tree rings� Thus the TREES system does not require
much additional time to prepare samples than is already being spent on a daily basis
in dendrochronology labs�
��� Sequential Capture of Images
In most cases it is not necessary to examine the entire cross�sectional disk of a tree in
order to measure tree ring widths� Generally one� or a few� radial sections of the tree
will su�ce� as long as enough of each ring is visible to avoid distortions from resin
ducts� branch scars� etc� An example of a series of frames which comprise a radial
section of a tree are shown in Figure ���
In TREES� the technique for specifying the portion of a sample to be captured
involves the creation of a coordinate system for simultaneously tracking the physical
location of the positioning table and the pixel position of a live video image� In order
to reduce hardware costs of the system� no digital control of the microscope zoom
function is available� Thus� in order for the system to be able to reliably relate pixel
distances to positioning table distances� it is necessary for the microscope zoom setting
to remain �xed throughout the data acquisition stage of the TREES analysis process�
An analyst must choose an appropriate optical zoom setting at the beginning of a
session based on the physical properties of the sample being studied� The microscope
zoom cannot be changed during the capture of a sequence of images to be mosaiced�
However� after the mosaic has been created� the analyst is free to optically zoom on
a region of the wood that needs to be visually analyzed in more detail as long as no
additional digital images need to be captured and registered with the mosaic�
The �rst step in implementing this coordinate system to relate pixel distances to
positioning table distances is to calibrate the number of pixels per positioning table
motor step� This is accomplished with the help of a pre�fabricated target consisting
of a uniform background with a single� small foreground object such as a circle�

Pith
Bark
ImageFrames
Figure ���� Example set of captured image frames�

�
This target is centered on the positioning table under the microscope and the system
captures a digital image of the target before and after moving the positioning table by
n�steps in the x and y directions� The center of the foreground object in each image
is computed using a center of mass calculation as described in ����� If the computed
di�erence in position of the foreground object between the �rst and second images of
the target is ��x��y�� then the corresponding x and y pixels per positioning table
step are �x�n and �y�n� This experiment can be repeated multiple times to obtain
average calibration values� A typical value from our system� using a magni�cation of
����X� is approximately ���� pixels per step in both the x and y directions�
Figure ��� shows an interface that allows an analyst to view a live video image
while moving the positioning table to �nd the starting and ending points of a linear
sequence of images to capture� Once these points have been determined� the required
number of frames� N � to fully capture the area of interest is computed� assuming a
minimumamount of overlap between adjacent images� The minimumrequired overlap
is de�ned to be overlapmin pixels and the total pixel o�sets between the starting and
ending frame positions as speci�ed by the analyst through the image capture GUI
are �xtotal and �ytotal� Specifying the width and height of each frame as w and h�
the equation used to determine the minimum number of required frames to capture�
when �xtotal � �ytotal� is
N ��xtotal
w � overlapmin
� �� ����
or if �ytotal � �xtotal�
N ��ytotal
h� overlapmin
� �� ����
Once N has been determined� the actual amount of overlap between consecutive
frames is computed as�
overlapx � w ��xtotalN � �
� ���
overlapy � h��ytotalN � �
� ����

�
Finally� the pixel o�sets which are actually used to determine how many x and y steps
the positioning table must take between captured frames are computed as�
offsetx � w � overlapx� �� �
offsety � h � overlapy� ����
Once the necessary o�sets are determined� the positioning table is commanded to
move to the locations of each of the frames to be captured� and the corresponding
images are obtained from the camera�
An advantage of keeping such a coordinate system is that the approximate pixel
o�sets of consecutive captured frames are determined while the images are being
captured� This is useful later when mosaicing the individual frames into a single data
set� At this stage� the analyst should also be prompted for which end of the sequence
of frames is closest to the pith and which end is closest to the bark of the tree� This
information will help to simplify the tree ring boundary identi�cation algorithms
described in Chapter � with minimal additional burden placed on the analyst�
During the image capture stage� it is the analyst�s responsibility to ensure that
valid tree ring data representing a radius of the tree sample is located between the
starting and ending frames�
��� Automatic Focus Detection
Tree cross�sections must be polished smooth before analysis in order to enhance the
visibility of rings� However� in many cases the surface across a sample is not perfectly
�at� In addition� the front and back sides of a cross�section are often not exactly
parallel� These factors often make it di�cult to precisely align the surface of a tree
ring sample with the microscope� Thus� as the position of a tree sample is changed by
moving the positioning table� the distance between the microscope and wood surface
may vary enough to require a focus adjustment�

�
If a large number of frames are captured during a session� manual adjustment of
the focus at each capture position may become a tedious burden� For this reason� an
automated focus detection method is used� The technique used to determine whether
or not an image is in focus uses the image power spectrum� The power spectrum
returns information about the frequency�domain characteristics of the image� As the
image goes out of focus� high frequency features will become blurred and the corre�
sponding high frequency power spectrum characteristics will decrease in magnitude�
The power spectrum of images is approximated by the periodogram technique ����
The largest power of two number of pixels and number of lines within a captured im�
age are used to compute the periodogram� For instance� if an image is ����x����
in size� the �rst ����x���� pixels will be analyzed� If the width to be analyzed is
W and the height is H� the data is partitioned into nine overlapping regions of size
�W���x�H���� spaced at horizontal o�sets of W�� and vertical o�sets of V��� The
magnitude squared of the Fourier Transform is computed for each of the nine over�
lapping regions� The two�dimensional power spectrum is then estimated by averaging
the magnitude squared output of each of the overlapping regions� For the purposes
of detecting focus� we are only interested in the magnitude of the power spectrum
at high frequencies and do not care about the orientations of various features in the
power spectrum� For this reason� the two�dimensional power spectrum is reduced to
one dimension by performing radial averaging� as shown in Figure ���
In order to test the sensitivity of the image power spectrum to focus� a series of �
image frames of a typical tree ring sample were captured at di�erent focus settings�
Periodograms were computed for each frame for comparison� In this case� the camera
was manually focused and image frames were captured at � focus intervals below
and above this point� resulting in frame number � having the best focus and frames �
and � having the worst focus� Figure � shows the radially�averaged power spectra
for a set of frames� with the maximum at higher frequencies occurring near frame
� � However� it is di�cult to compare the power spectrum response at all frequencies

�
2-D Power Spectrum 1-D Power Spectrum
v
spatial frequency (cycles/sample)
u
0
poweraverage
Figure ���� Radial averaging of a ��D power spectrum into ��D pro�le� where �u� v�are the ��dimensional spatial frequency components�
because the overall power spectrum for all frames rapidly decreases in magnitude
as the frequency increases� Thus it is necessary to normalize the power spectrum
in order to perform a valid comparison of the sensitivity to focus variation across
di�erent frequency ranges�
The �rst normalization step converts each power spectrum value to a percentage
of the maximum power spectrum value for the given image� Since the zero�frequency
power spectrum value is far greater than any higher frequency values� each frequency
value is divided by this zero�frequency value� The low frequency range will have a
value near one� while high frequencies quickly fall o� toward zero� The more out of
focus an image is� the faster its power spectrum should decrease at higher frequencies�
Once the power spectrum from each frame has been divided by the zero�frequency
value� the individual frequencies must be further normalized across the set of images
in order to determine which image has the best focus� This is accomplished by
treating the power spectrum values for all frames at a given frequency as a data
set� Each power spectrum value at the given frequency is divided by the mean value
over all frames for that frequency� resulting in a normalized mean value of one at

��
Figure ���� Power spectrum versus focus for tree ring images� Note that the lowestthree frequencies are not shown because they are much larger in magnitude than thehigher frequencies� Frame � has the best visual focus� while the rest of the framesare at stepped focus settings on either side of the best focus position�

��
all frequencies� An example normalized power spectrum for the set of images
described above is shown in Figure ��� In contrast to the non�normalized power
spectrum of Figure �� this version does not have a global decrease in magnitude
as frequency is increased� but reveals a middle�frequency peak for the frame of best
focus� This maximum is poorly de�ned at low frequencies since large�scale features
are relatively una�ected by changes in focus� At very high frequencies� on the other
hand� the power spectrum magnitude is nearly zero due to round o� error� regardless
of the focus setting� For this reason� it is appropriate to use a frequency range that is
high enough to become blurred from defocus� but low enough to avoid excessive round
o� error� In the example from Figure ��� the optimal frequency range of interest is
approximately ��� � to ��� � cycles per pixel �W � H � � ���
This analysis is applied in the data acquisition stage of the tree ring analysis
system to help automate the process of capturing a sequence of images� Once the
positioning table has been moved to a speci�ed location to capture a given image�
frames are captured at a range of focus settings� After computing a normalized
power spectrum for this set of images� the output for each frame is summed across
an optimum frequency range� The frame with the largest output sum is considered
to be the best focused image� which is then retained for inclusion in the mosaic� If
none of the acquired images are satisfactorily in�focus� the operator is alerted and
must manually focus the system�
��� Flat Fielding
When capturing images that are to be mosaiced together� it is important that each
is uniformly illuminated� As image magni�cation and �eld of view are varied from
one wood sample to another� the distribution of light will vary within the �eld of
view� At su�ciently high magni�cation� it is possible to view only the center of the
illuminated area� where the lighting is brightest and the most uniform� However� as

��
Figure ���� Normalized power spectrum versus focus for tree ring images� Notethat the frequency range of ��� � to ��� � cycles per pixel seems to be ideal forthe detection of the best focus at frame � �

�
the magni�cation is decreased and the �eld of view increases� a larger portion of the
illuminated area will become visible� The further the distance from the center of the
illuminated area� the more the illumination varies� One technique that may be used to
decrease the e�ects of nonuniform illumination is to use multiple illumination sources�
However� this will not eliminate all illumination variation under all conditions� A
software solution is more robust and allows for any illumination variation�
The software procedure used to remove illumination nonuniformity uses the ��at
�elding� technique ��� Once the magni�cation setting has been determined and
locked for a particular session� a uniform calibration target is placed in the �eld of
view� A sequence of frames of this calibration target is captured and averaged to
produce a representation of the background lighting nonuniformity� An example of
a target image showing bright illumination near the center of the �eld of view with
a fall�o� near the corners and edges is shown in Figure � � This calibration image
is then normalized by performing a linear stretch to set its mean value to one� The
illumination nonuniformity is eliminated from images captured during a session by
dividing each frame by the normalized calibration image� This typically will have
the e�ect of increasing the brightness of the regions near the edges and corners while
suppressing the brightness of the center of the �eld of view�
For best results� a new background illumination image should be captured each
time a new sample is analyzed by the system� A given background illumination image
is only valid at a particular magni�cation setting with the target placed at a particular
distance from the microscope lens� Since tree ring sample sizes and thicknesses vary
largely� even if the magni�cation of the microscope is held constant� the distance to
the surface of the wood that is being imaged will likely change from one sample to
another�

��
Figure ���� Example of illumination nonuniformity� The center�to�corner di�erencein graylevel is about � ��
��� Image Registration
After individual frames have been captured at appropriate focus settings and cor�
rected for any non�uniformity of illumination� they must be precisely registered to one
another� This is necessary in order to fuse the individual frames into a single contin�
uous mosaic image� In order to assure that no �seams� are visible at the locations of
overlap� adjacent frames must be registered both geometrically and radiometrically�
��� Spatial Registration
The positioning table is controlled by independent horizontal and vertical motion�
Thus� any pair of captured images from a given sample are related to each other by
simple vertical and horizontal o�sets� Approximate pixel o�sets between consecutive
frames are determined while the images are being captured� The images are then

�
precisely registered through correlation techniques ���� ���� The cross�correlation co�
e�cient provides a robust indication of correlation between two images� The primary
advantage of the cross�correlation coe�cient over other correlation techniques is that
it is insensitive to bias and gain variation� the importance of which will be explained
in Section � ���
Using the approximate pixel o�set between a consecutive pair of images �obtained
during pixel scale calibration described in Section ���� the estimated overlapping
areas can be found� In the overlapping area of the �rst image� an N �by�N �target�
area� T � is de�ned and a corresponding M �by�M �search� area� S� is de�ned in
the second image� with M greater than N � In order to determine the position of
best registration� the target region is shifted around the search region� computing the
correlation at each location� with the maximum de�ning the point of best registration�
If �S and �T are the mean pixel values of the search and target areas� respectively�
the cross�correlation coe�cient is de�ned as�
rij �
PN
m��
PN
n���Tmn � �T ��Si�m�j�n � �s�
�PN
m��
PN
n���Tmn � �T ����
� �PN
m��
PN
n���Si�m�j�n � �s����
�
� ����
A large target area increases the accuracy of the correlation registration method� A
large search area relative to the size of the target area allows for a less accurate initial
estimated o�set between two images� However� larger target and search areas require
more computation time� These are important trade�o�s that must be considered
when implementing an automated registration technique that will be used to register
a large sequence of images�
When constraining the size of the target area in order to minimize computation
time� the correlation method of automated registration works best when both the
search and target regions contain unique� high contrast features� However� searching
for ideal search and target locations before beginning the correlation adds complexity
and computation time to the procedure� On the other hand� if a single predeter�
mined search and target location are used for every set of images� it is possible that

��
�a� �b�
�c�
Figure ���� Search and target areas for registration correlation� �a� Search areaswith markers at point of highest correlation� �b� Target areas with markers at cen�ters� �c� Correlation results with best correlation at brightest point� Note that thecorrelation results are not to scale� In reality� the correlation matrix is approximatelythe same size as the search area�
these search and target areas may contain nearly uniform� low�contrast data that is
not conducive to correlation� A compromise used in TREES involves using multiple
preselected search and target areas distributed across the assumed overlapping areas�
as illustrated in Figure ��� With this technique� n target areas are simultaneously
shifted through the corresponding n search areas and the average correlation is used
to determine the best registration position� This method avoids the additional com�
plexity of searching for an ideal search and target area� while increasing the accuracy
of the registration by averaging the correlations of multiple neighborhoods that are
distributed throughout the overlapping areas of the images�

��
��� Gain and Bias Registration
In addition to spatial registration� overlapping images must be adjusted for any bias
andor gain variations due to voltage �uctuation and CCD camera electronic prop�
erties� As illustrated in Figure ��� it is important to perform contrast adjustments
between overlapping frames to avoid the presence of �seams� at the edges of overlap�
ping regions� which could be mistaken for tree ring boundaries during edge detection�
Figure �� shows results from an experiment in which a set of � images of a single
�eld of view were captured from a typical tree ring sample at � second intervals� and
the mean and standard deviation were computed for each image� A linear gaino�set
relationship exists between the captured images� This correspondence allows the
contrast and brightness of overlapping images to be adjusted to one another through
a linear stretch by computing the mean grayscale value� �� and standard deviation�
�� of the overlapping region from each image� As an example� assume image m�� and
image m overlap� If gm and bm are the relative gain and bias adjustments between
the overlapping images m�� and m� then�
�m��x� �m�� � gm��mx � �m� � bm� ����
Grouping the additive and multiplicative terms results in�
�m��x � �m�� � �gm�m�x � �gm�m � bm�� ����
Thus the gain and bias relationship between the two images is�
gm ��m���m
� �����
bm � �m�� � gm�m� �����
Once the relative gain and bias adjustments have been determined between each
pair of captured images� they may be converted to global gain and bias adjustments
relative to a single reference image� For example� if the �rst image in a sequence of n

��
frame m-1
mframe�a�
frame m
frame m-1
�b�
Figure ��� E�ects of gain bias adjustment during registration� �a� Mosaic of twoframes without gainbias adjustments� Note that a �seam� exists between the twoframes� The problem has been exaggerated for illustration purposes� �b� Mosaic ofthe same two frames with frame m adjusted for gainbias variation to match framem��� Note that no x or y o�set changes are made between �a� and �b�� Note that thethe images of both �a� and �b� have been linearly stretched for maximum contrast�thus the image in �b� appears brighter than frame m� � from �a��

��
Figure ��� Mean and standard deviation variation during image capture� � frameswere acquired of a stationary sample� The plot corresponds to the mean grayscaleand standard deviation values for each frame� The linear nature of the plot indicatesthat a linear grayscale stretch can be used to match the gain and bias of one frameto another�

�
images is the reference and the relative gain and bias for image m refer to the gain
and bias adjustments between frame m and frame m��� the global gain� �� and global
bias� �� adjustments are�
�� � �� �����
�� � �� ����
�m � �m��gm� m � �� � ���� n� �����
�m � �bm�m��� � �m��� m � �� � ���� n� ��� �
Note that this frame�to�frame adjustment must be performed after the �eld of each
frame has been adjusted for illumination non�uniformity �Section ����
��� Creation of Mosaic
Once the individual frames have been properly registered to one another� both spa�
tially and in gain and bias� they are combined into a single continuous mosaic image�
There are several advantages to replacing the individual frames with a single mosaic
�le� First� ambiguities may exist in the overlapping area between any pair of frames�
In a mosaic image� image data from any given overlapping area is taken from a single
frame� guaranteeing that all future processing applied to the region is performed on
a single set of data� Also� as long as the frames are properly registered� both spa�
tially and for gain and bias variation� noticeable seams between adjacent frames can
be largely removed� This provides a smooth� continuous transition between frames�
which is especially bene�cial at the edge detection stage� when we want to avoid
mistaking the transition between frames for a tree ring boundary� Finally� a single
mosaic �le simpli�es software implementation� since only one source of input data
needs to be considered�
The primary disadvantage of a single� large mosaic �le is that it can be very
ine�cient in terms of memory requirements if stored in a simple raster format� This

�
problem is illustrated in Figure �� �a�� Analysts are encouraged to orient a tree ring
sample on the positioning table such that the sequence of frames to be captured will
be as horizontal as possible� However� in some samples a horizontal linear sequence of
frames is not feasible� As the angle of orientation of the sequence of frames increases�
a larger and larger percentage of the raster format mosaic becomes wasteful �ll pixels
that do not contain any useful image data�
In order to reduce the overhead required when storing a large mosaic image�
a new MOSAIC IMAGE format has been added to the SADIE image processing
library� This format reduces the number of �ll pixels in the mosaic by reducing the
mosaic to its minimum required vertical size� while maintaining the original width�
This is accomplished by aligning each column of image data vertically at the top
of the MOSAIC IMAGE� In Figure ��� �b� is a MOSAIC IMAGE format version
of the example mosaic shown in �a�� It is necessary to maintain a small number of
�ller pixels below the non�overlapping columns of image data in order to maintain a
rectangular array structure� However� the percentage of �ller pixels is signi�cantly
reduced from the full�size raster format mosaic layout� especially for a large number
of frames that are captured in a sequence at an angle�
As a measure of the reduction of overhead pixels required in the MOSAIC IMAGE�
consider Figure ���� In �a�� assume that F �ller pixels are included in the rectangle
below the upper�right frame� In the case of two frames in the mosaic� �F �ller pixels
are present� In the case of three frames� as shown in �b�� a total of �F �ller pixels are
present in a normal raster image� Finally� in the case of four frames� shown in �c��
a total of ��F non�image data pixels are included in a normal raster representation
of the mosaic� Note that this example assumes the average o�sets between any pair
of images remains relatively constant throughout the mosaic �i�e� the scan path is
linear�� which is the case for mosaics created with the TREES system� In general� for
a mosaic of N frames� the total number of overhead pixels in a normal raster mosaic

�
k
V1
H
H
2
2
1
N
Nj
00
V
(a).
00
H 1 H 2
k M
jM
(b).
Overlapping Image Pixels
Non-Overlapping Image Pixels
Fill Pixels (No image data)
Figure ���� Comparison of a normal raster mosaic to the MOSAIC IMAGE format��a�� A mosaic image consisting of six frames stored in a normal raster layout� �b�� Thesame mosaic image stored in a more e�cient MOSAIC IMAGE format� Note thatthe width of both mosaics are identical� but the height of the MOSAIC IMAGE issigni�cantly reduced by aligning the top of each frame in the mosaic� The pixels withina given column of image data are not rearranged in any way� but complete columnsof image data may be shifted vertically in order to reduce the number of overhead��ller� pixels in the mosaic� In order to extract data from the MOSAIC IMAGEformat� a table of vertical o�sets� Vi� and heights� Hi� of each column� i� of imagedata in the mosaic must be stored� Note that kM � kN � jM � jN �

image is�
overheadraster � �N� �N�F� �����
Thus� although F can be reduced linearly by making the orientation of the mosaic as
horizontal as possible� the overhead grows at a rate of N� as the number of frames in
the mosaic becomes large� The overhead required by the MOSAIC IMAGE format�
on the other hand� is�
overheadmosaic image � NF� �����
By using the MOSAIC IMAGE format� the number of overhead �ller pixels in the
image is reduced by a factor of N � ��
The MOSAIC IMAGE format has the ability to dramatically reduce the amount
of memory required to store a mosaic image without adding the complexity of image
compression� However� it is only useful if the coordinates of its image data can be eas�
ily converted to the equivalent full�size raster coordinates� When a MOSAIC IMAGE
is created� it is necessary to simultaneously create a table to store the vertical o�sets�
Vi� and heights� Hi� of each column in the mosaic� The relationship between the
coordinates of the full�size raster image and the corresponding MOSAIC IMAGE is�
columnraster � columnmosaic image� �����
lineraster � linemosaic image � Vcolumn� �����
While the MOSAIC IMAGE format allows a convenient and e�cient means of
storage for a large mosaic image� it is not necessary to process the entire mosaic
at one time during image processing and computer vision analysis� Sub�sections of
image data corresponding to a given region of interest can be windowed sequentially
out of the mosaic for processing� The advantage of windowing these sections from
the mosaic rather than the original frames is that data can easily be acquired into a
single window from multiple frames� without seams existing at the boundary between
the image data from the di�erent frames�

�
Overlapping Image Pixels
Non-Overlapping Image Pixels
Fill Pixels (No image data)
(a).(b).
(c).
Figure ����� Measure of ine�ciency of normal raster storage of a mosaic� �a�� Inthis simple mosaic composed of two frames� assume that the number of overhead �llpixels below the upper�right frame is F � A total of �F �ll pixels are required in thiscase� �b�� For three frames in the mosaic the overhead increases to �F � �c�� For fourframes� ��F �ller pixels are required� and in general the number of overhead pixelsrequired in a N �frame mosaic is approximately �N� �N�F �

Chapter �
RING BOUNDARY DETECTION
Once a fully registered mosaic of image data is obtained� the next step is to automat�
ically detect the locations of tree rings through edge detection algorithms that are
optimized for the physical characteristics of tree ring samples�
The most common features in the image of a cross�section of a tree are summarized
in Figure ���� In this image� tree rings run from the top to bottom along primarily
vertical lines� These are the edges that must be detected in the image� while ignoring
extraneous features� Resin ducts are dark circular structures which are distinguished
from near�linear tree rings without too much di�culty simply by their shape� How�
ever� lines that run from the center of a tree outward toward the bark� referred to
as �rays�� and aligned cell boundaries are also nearly linear� and therefore less easily
distinguished from rings�
��� Standard Edge Detection Algorithm Results
A number of edge detection algorithms exist in the computer vision literature� with
various advantages and disadvantages� This section describes the evolution of the edge
detection algorithms used in the the TREES project� which were designed primarily
via trial and error of common edge detection techniques�
To begin experimentation� a set of images of typical tree ring samples was collected
using the hardware described in Section ����� Example images of typical conifer
samples are shown in Figure ���� A number of edge detection algorithms were applied
to the images in this set� Initially� very simple gradient magnitude computations were
applied to the images� Later� gradient direction information was used in addition to

�
Figure ���� Typical characteristics of a conifer tree ring sample�
the magnitude to improve results� Finally� the Canny edge detector was applied to
the images� and a variant of the Canny edge detector was developed and chosen as the
edge detection algorithm of choice for the TREES project� The following subsections
describe the experiments and their results�
��� Gradient Computation
The �rst edge detection algorithms applied to the sample of tree ring images were
based on simple gradient computations� For a two�dimensional image� the gradient
at each pixel location is equivalent to a vector including the �rst partial derivatives
in both the x and y directions� However� a more useful representation of the gradient
is given by its magnitude and direction� The gradient magnitude and direction can
be computed from the x and y partial derivatives as�
kGk �
s�
�x
�
��
�y
�
� �����
�G � tan��
���y
��x
�� �����
where ��x
and ��y
are the partial derivatives in the x and y directions� respectively� In
a discrete digital image� the partial derivatives are approximated by �rst di�erences�

�
�a� �b�
�c�
Figure ���� Typical tree ring image samples� �a� Ponderosa Pine sample��b� Siberian Larch sample� �c� Juniper sample�

�
�� � � � � ��x � �� � � �y � � � �
�� � � �� �� ��
Figure ���� Gradient masks used in Sobel �lter�
which are computed by convolving �rst di�erence masks with the image� The gra�
dient masks for the Sobel �lter are shown in Figure ��� The Sobel �lter is a good
choice for gradient computation in an image because it provides some noise averag�
ing characteristics while giving pixels near the center of the x masks the highest
weights� Figure ��� shows the gradient magnitude and gradient direction images that
result from applying the Sobel �lter to the test images of Figure ����
The gradient magnitude is often used to �nd the edges of features in an image due
to the fact that the boundaries between features normally have high contrast edges�
This is the case in tree sample images� where the boundary between two tree rings is
generally at the high contrast boundary between the dark latewood of one ring and
the light earlywood of the next�
In order to extract the high contrast edges from a gradient magnitude image� it is
necessary to apply a threshold� The threshold value must be high enough to exclude
low contrast noise pixels that have a relatively low gradient magnitude� while main�
taining the pixels with a high gradient magnitude that correspond to high contrast
edges in the image� The choice of an appropriate threshold value varies largely be�
tween images� and is normally chosen visually� Jain� et� al�� describe several methods
of automated threshold selection �����
Figure �� �b�� �e�� and �h� show the edge maps that result from applying a visually
adjusted threshold to the gradient magnitude of the sample images in Figure ����
These edge maps indeed contain the highest contrast edge features from the input
images� However� there is no discrimination between the edge pixels at tree ring
boundaries and other high contrast features� Since the tree rings in the images are
aligned approximately vertically� a second processing step can be applied to �lter

�
�a� Ponderosa Pine image� �b� Gradient magnitude� �c� Gradient direction�
�d� Siberian Larch image� �e� Gradient magnitude� �f� Gradient direction�
�g� Juniper image� �h� Gradient magnitude� �i� Gradient direction�
Figure ���� Gradient results�

��
�a� Ponderosa Pine image� �b� Thresholded gradient magnitude� �c� Median �ltered version of �b��
�d� Siberian Larch image� �e� Thresholded gradient magnitude� �f� Median �ltered version of �e��
�g� Juniper image� �h� Thresholded gradient magnitude� �i� Median �ltered version of �h��
Figure ���� Gradient magnitude results� A median �lter of size �x� was used toproduce the �ltered edge maps of �c�� �f�� and �i��
much of the noise from the thresholded edge map� By applying a vertical median
�lter �e�g�� of size �x�� to the edge map� any edge pixels lacking neighbors above and
below will be discarded� Figure �� �c�� �f�� and �i� show the results from �ltering the
edge maps with a median �lter� The larger the median �lter size� the more the noise
pixels are suppressed� However� this also severely degrades the natural curves in the
actual tree ring edges�
While the gradient magnitude combined with thresholding and median �ltering
provide a good �rst attempt at approximating tree ring boundaries� there are several
disadvantages to this approach� First� the boundaries returned by the Sobel �lter are

��
imprecise due to the fact that they are generally several pixels wide� Second� e�orts
to remove noise from the image result in severely degraded tree ring boundaries�
��� Canny Edge Detector
Edge detection results can be improved by applying information contained in the gra�
dient direction as well� The Canny edge detector ��� applies both gradient magnitude
and direction information in its implementation of edge detection� The Canny edge
detector is a robust edge detection algorithm that produces good results on a wide
range of image types�
One of the primary advantages of the Canny edge detector over other edge detec�
tion techniques is that it is guaranteed to produce one pixel wide� fully connected edge
boundaries� This is especially useful in the detection of tree rings� because complete
ring boundaries across the image are necessary to distinguish one ring from another�
Also� a precise edge location increases the accuracy of other measured features such
as tree ring widths�
A straightforward implementation of the Canny edge detector is described by
Jain� et� al� ����� The �rst step is smoothing the input image by convolving it with
a Gaussian �lter� A Gaussian with a standard deviation of three pixels seems to
work well at the magni�cation used for the tree samples investigated to�date� This
suppresses noise while maintaining the locations of high contrast edges� Next� the
gradient magnitude and direction are computed at each pixel location� as described
in Section ������ The most important step in Canny edge detection is nonmaxima
suppression� which creates thin� fully�connected boundaries� Nonmaxima suppression
is implemented by quantizing the gradient direction of each pixel into one of four
sectors� shown in Figure ���� Each pixel is compared to the two neighboring pixels
located in its sector� If the center pixel has a greater magnitude than either of its
neighbors� it is considered to be a local maximum and the output value is set to

��
�a� �b�
Figure ���� Direction sectors used in Canny edge detection� �a� Continuous direc�tions� �b� Discrete directions�
its magnitude� Otherwise the pixel is suppressed� and its output is set to zero� The
result is an edge map in which each edge pixel represents the location of the maximum
gradient magnitude at that point on the edge�
Figure ��� �b� shows the result of the Canny edge detector applied to an example
tree ring image� which appears to show very accurate ring boundaries� However� in
addition to the latewood�earlywood boundary that represents the edge between two
tree rings� it also detects the intra�ring earlywood�latewood boundary� In addition�
prominent rays and other horizontal features in the image cause connections between
tree ring edges� These shortcomings of the Canny edge detector in this application
are eliminated by applying knowledge of the physical characteristics of tree rings�
��� Modi�ed Canny Edge Detector
This section describes the design of an edge detection algorithm that is based on
the Canny edge detector� but optimized for the detection of tree rings� The primary
modi�cation to the original Canny edge detector algorithm is that tree ring orientation
within a region of interest is applied to suppress inter�ring connections�

�
�a� �b�
�c� �d�
Figure ��� Canny edge detector results for an example tree ring image� �a� SampleSiberian larch image� �b� Ring boundaries detected with the Canny edge detector�with an appropriate threshold� �c� Ring boundaries detected with modi�ed Cannyedge detector� �d� Ring boundaries from �c� after performing fragment linking�

��
��� Tree Ring Orientation Tracking
It is useful to �rst attempt to determine the overall orientation of tree rings within a
region of interest� This simpli�es the process of ignoring rays and other features that
are oriented orthogonally to tree rings during edge detection� Because ring orienta�
tions may not remain constant across an entire data sample� it is important to treat
each sample as a set of regions in which the orientation of tree rings is fairly consistent
orientations within a region of interest are determined by computing the gradient with
a directional �lter such as Roberts or Sobel� as described in Section ������
Tree ring boundaries are de�ned to be the boundary between the latewood of
one year and the earlywood of the following year� Within a given ring� the transition
between earlywood and latewood tends to be a gradual change from light colored wood
to dark colored wood� At the boundary between rings� however� there is generally a
very steep transition from the dark colored latewood of one year to the light colored
earlywood of the next year� On average� the gradient magnitude of this latewood
to earlywood transition is much higher than the gradient magnitude of earlywood to
latewood boundaries and the edges of rays�
By quantizing the continuous gradient direction into eight discrete directions
shown in Figure ���� the average gradient magnitude for each of the discrete directions
can be computed� While traversing a region of interest� at each pixel location the
discrete gradient direction is computed� A counter corresponding to this direction is
incremented and the gradient magnitude of the current pixel is added onto a gradient
magnitude sum for this direction� After performing this update at each pixel in the
region of interest� the average gradient magnitude for each of the eight discrete di�
rections can be computed by dividing the gradient magnitude sum for each direction
by the corresponding count�
Based on the above characteristics of tree ring images� the direction with the
largest average magnitude corresponds to the average direction of transition from the

�
1
234
5
6 7 8
Figure ��� Discrete directions for assumed tree ring orientations�
latewood of one ring to the earlywood of the next within the region of interest� The
maximum gradient magnitude direction corresponds to the direction from the pith
of the tree to the bark� and it is orthogonal to the average tree ring edge within the
region of interest� If the frame closest to the pith and the frame closest to the bark
of the tree were identi�ed by the analyst in the data acquisition stage �Section ����
this information can be used to verify that the computed tree ring orientations in a
region of interest are reasonable�
Figure ��� illustrates several examples of the average gradient magnitude calcula�
tion for each discrete gradient direction� In each case� this technique yields a strong
correlation with the actual visible tree ring orientation�
��� Modi ed NonMaxima Suppression
Once the general orientation of tree rings within a region of interest is known� this
information may be applied to a variant of the Canny edge detector algorithm for
e�cient tree ring boundary detection� Modi�cations at the nonmaxima suppression
stage of the Canny edge detector algorithm ���� allow it to be optimized for the de�
tection of tree ring boundaries� While the original Canny edge detector performs
directional nonmaxima suppression from local pixel data� it is more appropriate to
use a global direction for nonmaxima suppression in tree ring images if the average
orientation of tree rings within a region of interest is known� This will reduce sensi�
tivity to local pixel variations� If tree rings are known to have one of the orientations
shown in Figure ���� edge detection should be optimized to detect edges in this direc�
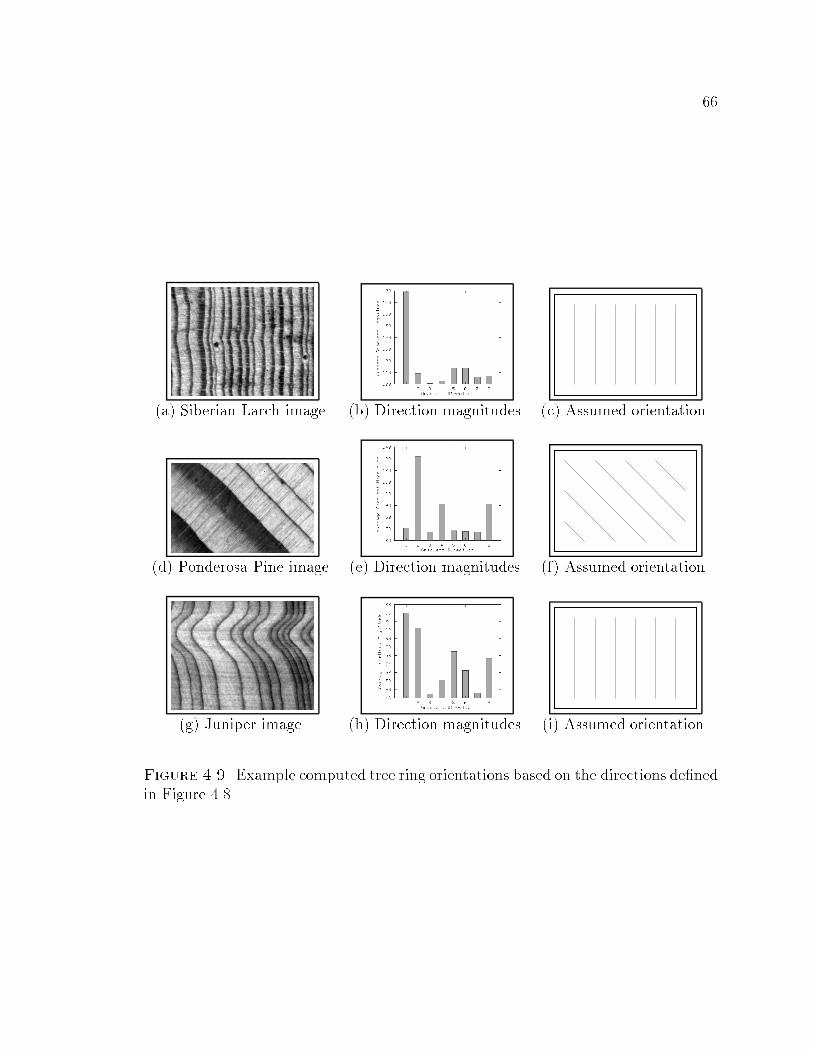
��
�a� Siberian Larch image� �b� Direction magnitudes� �c� Assumed orientation�
�d� Ponderosa Pine image� �e� Direction magnitudes� �f� Assumed orientation�
�g� Juniper image� �h� Direction magnitudes� �i� Assumed orientation�
Figure ���� Example computed tree ring orientations based on the directions de�nedin Figure ����

��
tion� This is accomplished through a two step process� First� at each pixel location�
nonmaxima gradient magnitude suppression is implemented in the direction of the
average orientation of tree rings� rather than in the local gradient direction at the
pixel� For instance� if tree rings are determined to be approximately vertical within
a region of interest as described in Section ������ the gradient magnitude of a pixel is
only compared to that of its left and right neighbors� If the pixel has a larger gradi�
ent magnitude than either of these neighboring pixels� it is not suppressed� Second�
assuming that the transition between the latewood of one ring and the earlywood of
the next ring takes place from left to right� only edge pixels where the right neighbor
has a larger grayscale value than the left neighbor are retained� This corresponds to
the transition between dark latewood pixels and light earlywood pixels� and allows
intra�ring earlywood to latewood transitions to be suppressed�
Figure ��� �c� and Figure ���� �b�� �e�� and �h� illustrate several examples of tree
ring edges that are detected by this modi�ed Canny edge detection algorithm� with an
appropriate threshold� Although several breaks exist in some of the ring boundaries�
earlywood to latewood transition edges and ring interconnections have successfully
been eliminated� Furthermore� it is possible to produce fully connected tree ring
boundaries from these results via a fragment linking postprocessing step�
��� Producing Fully Connected Tree Ring Boundaries from
Edge Detection Results
The raw data returned by the modi�ed Canny edge detector algorithm is an edge map
with each edge pixel representing the gradient magnitude value at that point� Any
edge pixels that meet the criteria of being locally maximum in the average direction of
orientation of tree rings will be included in the edge map� regardless of their absolute
magnitude� This means that� in addition to the tree ring edges �which generally have
a relatively high gradient magnitude�� the edge map will also contain low contrast

��
�a� Ponderosa Pine image� �b� Fragmented ring boundaries� �c� Fully linked ring boundaries�
�d� Siberian Larch image� �e� Fragmented ring boundaries� �f� Fully linked ring boundaries�
�g� Juniper image� �h� Fragmented ring boundaries� �i� Fully linked ring boundaries�
Figure ����� Results of the modi�ed Canny edge detector� Note that these resultswere obtained assuming that tree rings are nearly vertical in the image� This edgedetection technique is robust enough to maintain good edges� even in the areas wherethe rings are very curved� as in the case of the juniper sample�

��
edges representing noise features within the rings themselves� It is necessary to decide
which edge pixels are tree ring boundaries that should be kept� and which are simply
noise that should be removed�
An appropriate gradient magnitude threshold will remove most of the noise edges
while maintaining the majority of tree ring edge pixels� The choice of a threshold value
is aided by the fact that the histogram of the gradient magnitude values included in
the edge map from most tree ring samples studied to�date is bimodal� as illustrated in
Figure ����� An example of an appropriate threshold choice is shown in Figure �����
By choosing a threshold just short of the peak for high gradient magnitude edge
pixels� a conservative estimate of which edge pixels belong to tree ring boundaries
can be obtained� Unfortunately� the threshold will typically be high enough that some
tree ring edge pixels will be discarded and also low enough that several noise edge
pixels will remain� Currently� the threshold value is set visually� but in the future it
should be determined by using the mode method of automatic thresholding ���� or a
similar approach�
��� Labeling Edge Pixels
After applying a threshold to an edge map of gradient magnitude pixels� a binary
image remains� In this binary edge map� zero�value pixels are considered to be back�
ground pixels that are not included in relevant edge boundaries� Any non�zero pixels
are foreground edge pixels that may belong to valid tree ring boundaries or may sim�
ply be noise that must be �ltered from the edge map� In order to distinguish between
individual tree ring boundaries and noise edge pixels� it is helpful to label sets of edge
pixels that are connected to each other as belong to a single foreground object� A
connected�components labeling algorithm such as that listed as Algorithm ��� in �����
modi�ed to detect ��connected regions� is used to label foreground objects�
The �fuzziness� of the threshold decision region for rings versus noise results in tree

��
�a� �b�
�c�
Figure ����� Example histograms of gradient magnitude in edges returned by mod�i�ed Canny algorithm� �a� Siberian larch ��� �b� Siberian larch ��� �c� PonderosaPine� The sample in �c� has a large number of low contrast scratches� which accountsfor the large counts at low gradient magnitude values� Note that despite the variationin counts for high versus low gradient magnitude values� all distributions are bimodal�

��
Figure ����� Threshold selection for gradient magnitude in edges returned by mod�i�ed Canny algorithm�

��
ring edges that may be fragmented� In this case each fragment in the tree ring will be
assigned its own label during connected components labeling� Visually� it is generally
easy to determine which fragments belong to a given tree ring boundary� However� an
intelligent fragment linking algorithm must be applied in order for a computer to link
fragmented tree ring edges while discarding the remaining noise edges� In TREES�
this is accomplished through a two stage linking approach of double threshold linking
followed by linking optimized for tree rings�
��� Double Threshold Linking
The problems of degraded tree ring boundaries and the di�culty in eliminating all
noise edges during the threshold stage may be addressed by a double threshold linking
technique as described by Jain� et� al� ����� Double threshold linking is accomplished
by choosing a high threshold to remove noise edges while maintaining fragmented
high contrast tree ring edges� and a low threshold that maintains full high contrast
edge data as well as noise edge data� The entire edge map from the high threshold
is considered to contain good edges� and any edges from the low threshold that are
connected to the edges from the high threshold are also kept� This has the e�ect
of �lling in the �holes� in the fragmented high contrast edges where the gradient
magnitude is below the threshold� while eliminating extraneous noise edge pixels�
For the purposes of tree ring edge detection� the high threshold edge map should be
the map returned after using an appropriate threshold as described above� which has
been additionally reduced with a size �lter to remove any fragments that are too small
�and therefore have a high probability of being noise edges�� The low threshold image
should be the edge map from the modi�ed Canny algorithm� with a zero threshold
to maintain all edge data�
An example of double threshold linking is shown in Figure ���� including high and
low threshold edge maps and the resulting edge map after double threshold linking�

�
Threshold 1 Threshold 2
Double-Threshold Link Results
Figure ����� Double threshold linking�

��
��� Second Linking Stage Based on Characteristics of Tree Rings
The double thresholding technique is not guaranteed to return all tree ring edges fully
connected� A second postprocessing step that is capable of closing these gaps is based
on the physical characteristics of tree rings� speci�cally the fact that the width of a
tree ring relative to the widths of neighboring rings remains nearly constant along
the length of the ring� This information makes it possible to decide whether a set of
edge fragments belong to the same tree ring boundary�
In order to implement this decision� it is necessary for several fully connected tree
ring boundaries to be present after double threshold linking� In most cases� only
a few rings with low contrast regions remain fragmented after the double threshold
linking stage� Any fully connected tree ring boundaries are assumed to be accurate
representations of tree ring boundary positions� Between each pair of complete rings�
the edge map is searched for fragments�
Since most of the noise fragments were removed during double thresholding� the
median number of fragments� n� located along each orthogonal pro�le between the two
complete rings� as illustrated in Figure ����� is very likely equivalent to the number
of tree rings that exist between the two known rings� It is then possible to compute
the n most common positions of tree ring fragments� as a percentage of the distance
between the two known rings� The possible locations are quantized into M values�
equally spaced from �� to ����� M bins are used in a voting scheme to count the
number of fragments that exist at each location� The n locations with the largest
counts represent the most likely locations of tree ring boundaries� Any fragments
that are located at a given position are labeled as belonging to the appropriate ring�
while any fragments that are not near one of the positions are discarded as noise
fragments� It is then possible to synthesize links between fragmented tree ring edges
in order to fully connect them� These links are �agged so that they are not used in
future analysis� such as when average tree ring widths are computed� Their purpose

�
is to simply produce a complete set of indexed fully�connected rings� Examples of
linking applied to a tree ring edge map are shown in Figure ��� �d� and Figure ����
�c�� �f�� and �i��

��
�a�
�b�
Figure ����� Final step of tree ring fragment linking� �a� Tree ring edge fragmentsremaining after double threshold linking� �b� Fully connected tree ring boundariesafter linking� In this example� the tree rings in the �eld of view are assumed tobe aligned with the orientation of sector from Figure ���� When examining theorthogonal pro�les between the two completely connected rings� the most commonfragment locations encountered will be at approximately �� and � � of the distancebetween them� This information can be used to link the two fragmented tree ringedges while eliminating noise fragments�

��
Chapter �
MEASUREMENT AND ANALYSIS
After fully connected tree ring edges have been detected and sequentially labeled� it
is possible to proceed with analysis of the tree ring sample� Although the core of
the image processing algorithms used in TREES are designed to produce reliable�
fully�connected tree ring boundaries� the acquisition of these edges is not the primary
goal of the system� This is only the �rst step that enables further analysis of the
features of the individual tree rings in a sample� which is of far more importance to
dendrochronologists�
��� Tree Ring Widths
In dendrochronology� the most commonly measured features of tree ring samples are
relative tree ring widths� Patterns of ring width variation are the primary feature
of tree rings that make it possible to cross�date among di�erent wood samples �from
two di�erent trees� for example�� For the purposes of this system� tree ring widths
are de�ned to be the average distance between each pair of ring edges� Assuming
that the ring detection techniques described above are accurate� this de�nition of
tree ring widths is superior to the manual measurement most commonly used in
dendrochronology labs� where only a single line between two tree rings is used to
measure the width� By averaging the width over the full length of each tree ring in
an image� the measurements are less susceptible to small anomalies within tree rings
and therefore more accurate�

��
��� Direction of Tree Ring Width Measurement
The direction of width measurement at each point along a ring is important because
the rings may have curves and other variations in orientation� In general� a ring
width is de�ned as the radial distance between two ring boundaries at a given point
on a ring boundary� However� since the precise position of the tree pith may not
be known� the radial distance is estimated by determining the distance between two
ring boundaries along the normal vector at a given point on a ring boundary� The
normal vector used here should be orthogonal to the low frequency curve of the tree
ring rather than the high frequency curves in the form of small dips and bumps in
the ring�
The gradient direction computed during the edge detection stage �section ����
provides a localized measurement of the direction of maximum grayscale change� In
most cases� this corresponds to the direction of transition from the latewood of one
tree ring to the earlywood of the next� which is orthogonal to the tree ring boundary at
a given point along the boundary� Because this information is already available from
a previous processing step� it might be considered a computationally inexpensive way
of estimating the direction of the normal vectors for width measurement� However�
the local gradient direction is extremely sensitive to small dips or bumps in the ring
edge from features such as rays and sap ducts� and may misrepresent the orthogonal
direction between two ring boundaries by ninety degrees or more� Thus gradient
direction is not recommended for reliably estimating the orthogonal direction to tree
ring boundaries�
Since the detected tree ring boundaries are already determined and considered
to be a reliable representation of the tree ring boundaries� in most cases it is better
to �t a polynomial to the tree ring edge to determine the normal direction at each
point� rather than using the local gradient� Since tree rings are by de�nition circles of
varying radii that are centered at the pith of a tree� the most accurate mathematical

��
model of a tree ring edge is of the form�
�x� a�� � �y � b�� � r�� � ���
However� due to the high resolution at which tree ring samples are imaged� an un�
derlying premise of the algorithms that produce the tree ring boundaries in TREES
is that the tree rings are approximately linear within a region of interest� This allows
much simpler linear interpolation techniques to be used to model the tangent lines
that represent the orientation at each point along a tree ring boundary� Note that
the purpose of producing such models is not to replace the computed tree ring edges
with models� but simply to determine the orthogonal direction at any point along the
tree ring boundary�
When �tting a line to a particular point on a tree ring boundary� the number
of edge pixels used must be large enough to suppress the e�ects of small twists and
curves� However� the number of points must be small enough to maintain an accurate
representation of the local orientation of the ring� At the magni�cation used by this
system and for the samples tested to�date� twenty to thirty edge pixels are generally
su�cient� with the point of interest at the center of the data set�
A least�squares �t algorithm is used to approximate the orientation of tree ring
boundaries ���� ���� This method involves minimizing the sum of squared perpendic�
ular distances of each edge pixel in a segment from the line represented in polar form
as�
� x cos � y sin � � ���
The �rst step used to compute the orientation of a segment of a tree ring boundary is
to determine the center of the set of edge pixels� which can be substituted as a valid
value for in the equation of the line� If N edge pixels are included in the set and
the line� yi� and column� xi� of each edge pixel� i� are known� the center of the set is

��
at�
x �
PN
i�� xiN
� � ��
y �
PN
i�� yi
N� � ���
As described by Jain� et� al�� in ����� the angle of orientation of the segment of
edge points that minimizes the sum of squared errors for the points in the segment
can be computed as�
��
�tan��
�b
a � c
�� � � �
where the parameters a� b� and c are computed as�
a �NXi��
�xi � x�� � � ���
b � �NXi��
�xi � x� �yi � y� � � ���
c �NXi��
�yi � y�� � � ���
Depending on the location of the pith and bark of the tree relative to a tree ring
boundary� which is determined either during the data acquisition stage or during tree
ring boundary detection� the orthogonal angle to the tree ring boundary is obtained
by either adding or subtracting ninety degrees from the computed tangent angle� �
��� Measurement of Average Tree Ring Widths
Once the normal direction to a point on a ring edge has been determined� the distance
between the current ring and the next ring is computed in this direction� The method
used to compute this distance is to travel along the sector direction �Figure ���� clos�
est to the normal angle at the current ring location until the next ring is reached�
Pixel�by�pixel steps are then taken along the second ring� computing the angle be�
tween the starting point on the �rst ring and the current ending point on the second

��
�a� �b�
Figure ���� Example width measurements used for computing average ring widths��a� No error checking� �b� Width measurements that remain after requiring the angleof the width measurement lines with respect to the left and right rings to match withinten degrees� Note that for illustration purposes� only ��� of the width measurementlines are shown�
ring� When the angle matches the angle of the normal vector� the two end points
of the orthogonal line are known� and the width can be measured by computing the
Euclidean distance� For error checking� the system checks that the orthogonal line
is within ten degrees of being orthogonal to the second ring boundary at the ending
point� as shown in Figure ��� If this is not the case� there is a good possibility that
the width measurement at that point along the curve has a large error and should be
discarded�
In order to determine the average width of a ring� the width at each point along
the tree ring boundary should be measured� discarding any known erroneous mea�
surements as described above� The average of these measurements is the average ring

��
width� Absolute ring widths are not as important in dendrochronology as relative
ring widths� so this method is su�cient for de�ning the average width of a ring even
if the width of the ring varies over the region of interest�
Computer generated tree ring width measurements are computed in pixels� Image
analysis is the entire basis of the measurements obtained by the TREES system� and
since pixels are the �nest resolution units available in an image� they are the natural
choice for width measurement units� A calibration between pixel widths and physical
distances on the actual tree sample can be obtained by applying knowledge of the
magni�cation of the system and the size of the CCD elements in the camera� For a
system with a total magni�cation M and a CCD camera with square imaging elements
of width w �m� the calibration between pixels and physical units is�
unit calibration �
��
M
�w �m
� pixel� � ���
The CCD camera used in the TREES system has square ��� �m elements� When used
with a typical magni�cation of ����� the resulting calibration is ����� �mpixel� This
results in a typical �mm wide tree ring having a measured width of around � pixels�
��� Additional Tree Ring Attributes
Tree ring widths are the feature that can most easily be extracted from tree rings
via image analysis algorithms� However� other features such as the average grayscale
pro�le between two ring edges� can be measured and recorded� Also� the analyst may
attribute additional features for unusual rings� such as frost and micro rings� All of
this information is useful when cross�dating between tree ring samples�
��� Average Grayscale Pro les of Tree Rings
After computing the average widths of each of the tree rings in a sample� it is possible
to create an average grayscale pro�le of each tree ring� To generate such a grayscale

�
pro�le for each ring� a count array and a sum array whose lengths are the nearest
integer of the average width of the ring in pixels� W � are used to consolidate the
grayscale values along each of the individual width lines that were used to compute
the average width�
For each position� j� along a given individual width line i with length Wi� the
corresponding position in the average width line of width W is computed as�
indexavg�i� j� �
�j
Wi
�W� � ����
In other words� the absolute pixel position in the individual line is converted to a
percentage of the individual width and then multiplied times the average width to
�nd the position in the average width line� The grayscale value under the point j on
the individual width line is added to the sum array at index indexavg�i� j� and the
count array value at the same index is incremented� After repeating this procedure
for all points along each of the width lines used to compute the average width� each
value in the sum array is divided by the corresponding value in the count array�
The result is an array of length W containing the average grayscale pro�le of the
ring� Figure �� shows an example tree ring sample and the corresponding computed
average grayscale pro�le�
One of the advantages of producing an average grayscale pro�le of a tree ring
sample is that it allows internal characteristics of tree rings to be measured and
analyzed� For example the internal earlywood to latewood boundary can be estimated
as the location where the maximum rate of change from the high grayscale value
earlywood to the low grayscale value latewood occurs in the average pro�le� This
boundary can be used to divide each individual tree ring into its earlywood and
latewood components� The widths of these intra�ring components can be used as
cross�dating aids in addition to the full tree ring widths�

��
�a�
�b�
Figure ���� Average grayscale pro�le�
��� Pattern Matching and Cross�Dating
The primary goal of tree ring analysis in most cases is the ability to cross�date one
sample to another� Cross�dating between two wood samples is based on the fact that
one tree ring is grown for each year in the lifetime of most trees� and that the ring�s
properties are determined by environmental conditions at the time of growth� The
�rst ring around the pith of a tree represents its �rst year of growth� The partial tree
ring at the edge of the tree� just before the bark� represents either the current year in
a live tree� or the last year of growth in a dead tree� Climatic changes tend to cause
not only varying ring widths from one year to the next in a single tree� but also similar
variation across di�erent trees in a region� If the ring width patterns from one tree
can be matched to the ring width patterns in another tree� there is a high probability
that the tree rings in question were grown during the same years� This allows a tree

�
or log that has been dead for an unknown number of years to be cross�dated with
a live tree to determine its age� Pairs of trees from the same species are obviously
desirable� but in principal� cross�dating between species may be possible with the aid
of skeleton plots�
��� Skeleton Plots
In the Douglass method of dendrochronology �Section ������ cross�dating involves
the use of �skeleton plots�� which are a simple way of representing tree rings in a
compact� normalized form� Skeleton plots are typically drawn on graph paper� and
each vertical line on the graph paper corresponds to a single year� representing a single
tree ring in a sample� Skeleton plot line patterns are drawn on the vertical lines of
the graph paper based on the relative widths of each tree ring and its neighbors� If
a tree ring has a similar width to its neighboring tree rings� no skeleton plot line is
drawn since the tree ring does not stand out� However� if a signi�cant change exists
because the width of a particular tree ring is much narrower than the widths of its
neighbors� a skeleton plot line is included on the plot� The length of the line indicates
how much smaller a tree ring is than its neighbors� with the smallest rings having the
longest skeleton plot lines� In addition� wide rings� micro rings� frost rings� and other
outstanding tree ring features can be symbolically tagged on a skeleton plot�
Cropper describes a method of numerically generating skeleton plots � �� Cropper�s
method involves computing the running mean� �i� and standard deviation� �i� for a
set of tree ring widths� A critical level� �c� is chosen in order to determine the relative
narrowness of tree rings� A tree ring with width Wi will have a skeleton plot line if
Wi � �i � �c�i� � ����
or is marked as a particularly large ring if
Wi � �i � �c�i� � ����

��
The lengths of lines drawn in Cropper�s computer generated skeleton plots are deter�
mined by setting the smallest ring�s line to the maximum length for a particular plot
scale� and scaling each of the remaining skeleton plot lines by the same scale factor�
Skeleton plots used in the TREES system are adapted from a modi�ed Java version
of Cropper�s algorithm� implemented by Paul Sheppard of the Laboratory of Tree Ring
Research at the University of Arizona ���� This algorithm requires tree ring widths
to be �ltered such that low frequency trend is removed� This can be accomplished by
�tting a cubic smoothing spline to the series to model the low frequency characteristics
of the data� and dividing the series by the computed model ����� The resulting �ltered
data set� which is referred to as a set of index values� Ii� will have a mean value of
���� The minimum and maximum index values of the �ltered series are Imin and
Imax� respectively� The skeleton plotting algorithm requires an absolute cuto� value�
Cab� and a �rst di�erence cuto� value� Cdiff � to be speci�ed in order to trigger the
existence of skeleton plot lines� The lengths of skeleton plot lines are computed on
a speci�ed scale �a scale of ten is used for this discussion�� with a default length of
zero� A skeleton plot line will have a non�zero length if the following absolute value
check is triggered�
Ii � ��� ����� Imin
Cab
� � ���
where ��� � Cab � ����� The corresponding length� Li� of a skeleton plot line created
by the absolute value trigger is
Li � ���� �
�Ii
��� � ����Imin
Cab
�� ����� � ����
Likewise� the �rst di�erence trigger
Ii � Ii�� �Imin � Imax
Cdiff
� � �� �
where ��� � Cdiff � ����� results in a skeleton plot line of length
Li � ���� �
��Ii � Ii���� �Imin � Imax�Imin�Imax
Cdiff� �Imin � Imax�
�� ����� � ����

��
Figure ��� illustrates an example graphical user interface from TREES which displays
the detected tree ring boundaries for a sample� and the corresponding computed
skeleton plot�
Skeleton plots can be visually compared to one another by an analyst to determine
matching ring width patterns� The Douglass approach of tree ring dating requires
that the original tree sample remain available for reference throughout the cross�
dating process� This is due to the fact that anomalies in the growth process of trees
may cause very small micro rings to be present in a particular tree sample� Thus�
even if image analysis algorithms produce perfect tree ring boundaries based on an
input sample mosaic image� some tree ring boundaries may be missing or may not
actually belong to true annual growth rings in the tree� For this reason� the cross�
dating procedure does not simply consist of �nding the �best �t� between two tree
samples� If inconsistencies are found between two or more skeleton plots� they must
be resolved by returning to the original tree sample for further analysis�
This basic cross�dating feature has been integrated into the TREES system� Skele�
ton plot lines are linked to the corresponding tree ring boundaries� so it is possible
to return to the sample image for reference while analyzing a skeleton plot� As long
as the wood sample is not removed from the positioning table after the mosaic is
created� it is also possible to command the positioning table to center a particular
region of the sample under the microscope by pointing and clicking the mouse on
the corresponding area in the mosaic image that is displayed in the GUI� This allows
an analyst to take a closer look at a particular tree ring if discrepancies arise when
comparing skeleton plots�
In the current version of TREES� cross dating must be performed manually by
the analyst� In the future� correlation algorithms could be implemented to allow the
system to provide the analyst with a �rst best guess at a cross�dating solution� which
the analyst will be able to accept or reject�

��
Chapter �
SUMMARY AND CONCLUSIONS
��� Summary
Tree ring analysis has many applications in �elds ranging from archaeology to cli�
matology� Unfortunately� a large percentage of the research time of experienced
dendrochronologists is spent manually analyzing each tree ring sample� This thesis
describes a system that implements image processing and computer vision techniques
to increase the e�ciency of tree ring analysis�
The TREES system consists of a CCD camera connected to a microscope that
images tree ring samples placed on an x�y positioning table under the microscope�
The position of the positioning table� the focus setting of the microscope� and the
CCD camera are all controlled by a Sun Ultra � workstation�
When an analyst chooses a starting and ending point of a region of interest on a
tree ring sample� the system automatically captures a sequence of carefully focused
images that covers the speci�ed region of interest� Each frame is adjusted for nonuni�
formity of illumination� and precisely registered to its neighbors� both spatially and
radiometrically� Based on the registration results� a single continuous mosaic image
is constructed from the individual frames�
Chapter � describes the edge detection techniques used to identify tree ring bound�
aries in an image mosaic� Gradient magnitude computations� combined with thresh�
olding and median �ltering to reduce noise� are capable of identifying the high contrast
edges that exist at tree ring boundaries� However� the boundaries lack precision and
are severely degraded during noise removal attempts� A superior method is to use
the Canny edge detector� which applies knowledge of gradient direction in addition
to magnitude� This method produces precise� one�pixel wide boundaries but has the

��
unwanted characteristic of sometimes connecting adjacent tree rings�
A modi�ed version of the Canny edge detection algorithm produces precise bound�
aries� while suppressing inter�ring connections� This is made possible by using global
direction assumptions within a region of interest� rather than examining the local gra�
dient direction at each pixel location� The disadvantage of this modi�ed Canny�based
algorithm is that it does not guarantee that fully connected tree ring boundaries will
be created� Double threshold linking� followed by an intelligent linking algorithm
that is optimized to common characteristics of tree rings� are used to produce com�
plete representations of tree ring boundaries while suppressing noise features� The
second linking algorithm assumes that the width of a tree ring relative to the widths
of neighboring rings remains nearly constant along the length of the ring�
After the detection of tree ring boundaries� the average width of each tree ring in
the sample is computed� Average grayscale pro�les allow the internal characteristics
of individual tree rings to be analyzed� This information is used to produce skeleton
plots which allow an analyst to cross�date one tree ring sample to another�
��� Conclusions
This thesis presents computer vision approaches which have proven successful at
accurately analyzing typical conifer tree ring samples in a semi�automated manner�
The research described here indicates that image analysis may be capable of increasing
the e�ciency of dendrochronology research� while preserving the feature of human
intervention� By allowing an analyst to concentrate on other research work while
the TREES system captures and analyzes a sample� much of the tedium of tree
ring analysis is removed� potentially increasing the number of samples that can be
analyzed�
The accuracy of the edge detection performed by TREES has primarily been ver�
i�ed via visual analysis� By overlaying edge maps� such as those of Figure ����� on

��
the original tree ring sample images� it has been veri�ed that the modi�ed Canny
algorithm produces results that are visually within one pixel of the latewood � ear�
lywood boundaries� These results are at least as accurate as the manual techniques
that are currently used to determine tree ring boundaries� Assuming that tree ring
boundaries have been correctly identi�ed by the system� the width measurement tech�
nique used in TREES is superior to manual width measurements due to the fact that
the system�s measurements are produced by averaging tree ring widths across the
entire region of interest� This technique is less sensitive to noise than the manual
measurement approach� which uses only a single pro�le to measure the width of each
ring�
The system has to�date been tested on approximately twenty relatively typical
samples from four conifer species� including ponderosa pine� Douglas �r� Siberian
larch� and juniper� The results of these tests were similar to the examples of Fig�
ure ���� as long as no cracks or other major anomalies were present within the region
of interest captured and analyzed� All testing to�date has been performed by mem�
bers of the TREES project team� who are familiar with the algorithms and techniques
used in the software� A version of the TREES system is currently being prepared
for use by members of the dendrochronology community who are not familiar with
the details of the operation of the system� Tests performed by such analysts will test
the robustness of the system and aid in determining future enhancements that will
hopefully make the system routinely usable for dendrochronology research�
��� Recommendations for Future Contributions
While the results presented in this thesis are very promising� much work remains to
be done in order to increase the e�ciency� reliability� and diversity of the TREES
system� From the standpoint of software engineering� the e�ciency and organization
of the TREES software can be improved by modifying the structure of the SADIE

��
image processing library� In order to make TREES more robust across diverse tree
ring samples� the edge detection algorithms could be made more intelligent� Also�
to increase the e�ciency of the cross�dating portion of the system� semi�automated
correlation and pattern matching algorithms could be integrated into TREES� To
increase �exibility when analyzing multiple samples� techniques should be developed
to allow an analyst to return to a previous sample after it has been removed from
the positioning table� Finally� while TREES has been primarily designed to aid in
the measurement of tree ring widths for cross�dating purposes� enhancements could
be made to allow reliable analysis of other features of tree rings to aid in climatology
and other forms of research�
��� Further Modi cations to SADIE
In Section ������ the ����� width height limitation of SADIE images was described�
This imposes a maximum of approximately �cm of a tree ring sample to be imaged
at typical resolution settings� For most samples this will be su�cient� However� in
the future it will likely become desirable to have the ability to use TREES for the
analysis of larger tree samples� In order to make this possible� the maximum height
or width of an image can be increased by changing the short integer variables to
unsigned short integers or normal integers� Unfortunately� in order to implement this
change each routine in the SADIE library would need to be changed due to the fact
that local variables in the routines that are used to loop through image data are
currently implemented as signed short integers�
In order to accommodate varying levels of image data precision� SADIE BYTE
and SADIE SHORT data types were added to TREES in addition to the standard
��bit IMAGE format of the SADIE library� as described in Section ����� Currently�
a separate version of any routine that uses these data types must be created for
each individual data type� A future enhancement to the SADIE library would be

��
to integrate several precision types into a single SADIE image format� A tag could
be added to the image data structure shown in Table ��� to indicate which format
an image is in� This would require all SADIE routines to check the precision of the
image data before processing an image�
��� Development of More Robust Edge Detection Techniques
The system has to�date been tested primarily on relatively well�behaved conifer sam�
ples� More complex tree ring patterns such as those of hardwoods� as well as cracks
and other troublesome wood features� will test the robustness of the present design
and will likely motivate modi�cations� Two particularly di�cult examples are illus�
trated in Figure ���� Assumptions made in the second tree ring edge linking algorithm
�Section ���� cause the tree ring edge detection techniques currently used in TREES
to fail in both of these di�cult cases� In the future� more intelligent tree ring detection
algorithms should be developed to supplement the routines that are already in place
in the system� As an example� an algorithm might be added in the future to analyze
the �roughness� of a tree ring boundary� Most tree ring boundaries are relatively
smooth� while cracks tend to be very rough and bumpy� This type of information
could be useful in distinguishing true tree ring edges from crack edges�
In keeping with the design philosophy of the TREES system� it may prove more
productive to allow the dendrochronologist to manually handle these unusual situ�
ations� Rather than attempting to automatically solve all di�culties encountered�
which may require an unacceptable level of computation� analyst intervention should
be allowed at critical stages� For example� the analyst should be able to manually
connect tree ring fragments across cracks or guide the search for very low contrast
edges�

�
�a�
�b�
Figure ���� Example di�cult juniper tree samples� �a� Sample with large cracks�both parallel and orthogonal to tree ring edges� �b� Sample with rings wedged togetherdue to a branch scar�

��
��� Automated CrossDating
The current version of TREES requires all cross�dating to be performed manually
by the analyst� In the future� a major enhancement should be the integration of
correlation and other pattern matching techniques to aid the analyst by computing a
best �rst guess at a match� Techniques for computerized cross�dating are described
by Baillie and Pilcher ��� and Munro �����
In addition� quality control algorithms for verifying cross dating choices between
samples exist at the Laboratory of Tree Ring Research in the COFECHA program
���� ���� The functionality of this type of algorithm could be applied to aid in the
identi�cation of locally false andor missing rings� as well as to verify the cross�dating
results determined by algorithms or the analyst�
��� MultiSession Memory
In the Douglass approach of tree ring dating� one of the most important requirements
for reliable dating is the ability to return to the original wood sample in order to
reconcile problems� As long as a sample is not removed from the stage after capturing
a sequence of images and generating a mosaic� the TREES system is capable of
repositioning the stage so that any region of the sample contained in the mosaic can
be centered under the microscope for analysis� However� if a problem with a sample
does not become evident until after the sample has been removed from the positioning
table� there is no easy way to return to the wood via the system�
There are two possible techniques that might be applied in the future to eliminate
this shortcoming� The �rst method involves physically mounting a sample on the
positioning table by drilling a set of screws into the wood� If the sample is removed
from the stage� it could be returned at a later date in its original orientation by
remounting it with the same screws inserted into the same holes in the wood� In
addition� an identi�er must be marked at a unique position on the surface of the

�
wood to allow the system to resynchronize the position of the sample under the
microscope with the mosaic image loaded into the GUI�
If no repeatable method of mounting the sample on the stage is practical� a soft�
ware approach could be used to resynchronize the sample with the pre�generated
mosaic� For this purpose� an identi�er that is non�ambiguous in both position and
orientation must be placed on the surface of the wood before beginning a new session�
A one�headed arrow would su�ce for this purpose� During data acquisition� an image
of this identi�er must be captured and registered with the system� When the sample
is returned to the stage later� the analyst should be prompted to center the identi�er
under the camera� An image of the new orientation of the identi�er could be captured
and compared to the original orientation that was used in the creation of the mosaic�
Rather than requiring precise rotation of the sample to match its original orientation�
positioning table coordinates could be computed and converted between the current
orientation and the previous orientation�
In either of the cases described above� the magni�cation of the system must be
recorded at data acquisition time� and the identical magni�cation must be set when
the tree sample is returned to the stage�
��� TREES as a Substitute for XRay Densitometry
TREES has been initially designed for the sole purpose of measuring tree ring widths�
and is not optimized for accurately estimating X�ray densitometry data� However�
in the future it would be wise to integrate the careful calibration steps used in the
Re�ected�Light Image Analysis System described in Section ���� into TREES� This
would allow average grayscale pro�les to be used to estimate wood density data that
otherwise must be obtained by tedious X�ray densitometry techniques� and would
create a more versatile TREES system�

��
References
��� M� G� L� Baillie and J� R� Pilcher� �A simple cross�dating program for tree�ringresearch�� Tree Ring Bulletin� � ����� ����
��� J� F� Canny� �A Computational Approach to Edge Detection�� IEEE Trans�Pattern Analysis and Machine Intelligence� ����� �������� �����
�� K� R� Castleman� Digital Image Processing� Prentice�Hall� Inc�� Englewood Cli�s�NJ� �����
��� W� S� Conner� R� A� Schowengerdt� M� Munro� and M� K� Hughes� �Design of aComputer Vision Based Tree Ring Dating System�� Proceedings of the ���� IEEESouthwest Symposium on Image Analysis and Interpretation� � ������ �����
� � J� P� Cropper� �Tree�Ring Skeleton Plotting by Computer�� Tree�Ring Bulletin��� ��� �� �����
��� A� E� Douglass� �Tree Rings and Chronology�� University of Arizona Bulletin������ �� ��
��� R� Guay� R� Gagnon� and H� Morin� �MacDENDRO� a new automatic and inter�active tree�ring measurement system based on image processing�� Tree Rings andEnvironment� Proceedings of the International Symposium Ystad South Swe�den �� September ����� Lund University� Department of Quaternary Geology�Lundqua Report �� ������� �����
��� R� Guay� WinDENDRO V� ��� User�s Guide� R!egent Instruments� Inc� Quebec�Canada� ��� �
��� M� Harrison� M� McLennan� E�ective Tcl Tk Programming� Addison�Wesley�Reading� MA� �����
���� Holmes� R� L�� �Computer�Assisted Quality Control in Tree�Ring Dating andMeasurement�� Tree�Ring Bulletin� �� ������ ����
���� Holmes� R� L�� Dendrochronology Program Library User�s Manual� Laboratoryof Tree�Ring Research� University of Arizona� Tucson� AZ� �����
���� R� Jain� R� Kasturi� and B� G� Schunck� Machine Vision� McGraw�Hill� Inc��New York� NY� ��� �
��� G� Mehldau and R�A� Schowengerdt� �MacSADIE ��� User�s Manual�� Universityof Arizona� Digital Image Analysis Lab� Technical Report No� ����� December�����

��
���� M� A� R� Munro� �An Improved Algorithm for Crossdating Tree�Ring Series��Tree�Ring Bulletin� ��� ������ �����
�� � A� V� Oppenheim and R� W� Schafer� Discrete�Time Signal Processing� PrenticeHall� Englewood Cli�s� NJ� �����
���� J� Ousterhout� Tcl and the Tk Toolkit� Addison�Wesley� �����
���� A� Papoulis� Probability Random Variables and Stochastic Processes� Third Edi�tion� McGraw�Hill� Inc�� New York� NY� �����
���� W� H� Press� S� A� Teukolsky� W� T� Vetterling� B� P� Flannery� NumericalRecipes in C� Second Edition� Cambridge University Press� �����
���� J� Schou and E� Rytter� �Dendrochronological dating using scanning and im�ageprocessing�� Tree Rings and Environment� Proceedings of the InternationalSymposium Ystad South Sweden �� September ����� Lund University� De�partment of Quaternary Geology� Lundqua Report �� �������� �����
���� R� A� Schowengerdt� Remote Sensing� Models and Methods for Image Processing�Second Edition� Academic Press� San Diego� CA� �����
���� R�A� Schowengerdt and G� Mehldau� �Engineering a Scienti�c Image ProcessingToolbox for the Macintosh II�� International Journal of Remote Sensing� Vol���� No� �� pp� ������� ����
���� R�A� Schowengerdt and G� Mehldau� �An Image Processing Toolbox for theMacintosh II�� Proc� of the Conference on Image Processing and the Impact ofNew Technologies� Canberra� Australia� pp� � �� �� Dec� �����
��� P� R� Sheppard� personal communication� �����
���� P� R� Sheppard� L� J� Graumlich� �A Re�ected�Light Video Imaging Systemfor Tree�Ring Analysis of Conifers�� Tree Rings Environment and HumanityProceedings of the International Conference� Editors J� S� Dean� D� M� Mekoand T� W� Swetnam� RADIOCARBON� pp� �������� �����
�� � P� R� Sheppard� L� J� Graumlich� L� E� Conkey� �Re�ected�Light Image Analysisof Conifer Tree Rings for Reconstructing Climate�� The Holocene� �������� �����
���� P� R� Sheppard� Re�ected�Light Image Analysis of Conifer Tree Rings for Den�drochronological Research� Dissertation� University of Arizona� ��� �
���� M� A� Stokes� and T� L� Smiley� An Introduction to Tree�Ring Dating� Universityof Chicago Press� Chicago� IL� �����

��
���� R� D� Thetford� R� D� D�Arrigo� and G� C� Jacoby� �An Image Analysis Systemfor Determining Densitometric and Ring�Width Time Series�� Canadian Journalof Forest Research� ���� ���� ��� �����
���� S� E� Umbaugh� Computer Vision and Image Processing� A Practical ApproachUsing CVIPtools� Prentice Hall PTR� Upper Saddle River� NJ� �����
��� B� B� Welch� Practical Programming in Tcl and Tk� Second Edition� PrenticeHall PTR� Upper Saddle River� NJ� �����
��� P� D� Welch� �The Use of Fast Fourier Transform for the Estimation of PowerSpectra� A Method Based on Time Averaging Over Short� Modi�ed Peri�odograms�� IEEE Transactions on Audio and Electroacoustics� vol� AU�� � ����������