A comprehensive survey of income and health in Canada
38
Poverty is making us sick A comprehensive survey of income and health in Canada Ernie Lightman, Ph.D Andrew Mitchell, MIR Beth Wilson, MSW December 2008 COMMUNITY SOCIAL PLANNING COUNCIL OF TORONTO
Transcript of A comprehensive survey of income and health in Canada

Poverty is making us sickA comprehensive survey of income and health in Canada
Ernie Lightman, Ph.D
Andrew Mitchell, MIR
Beth Wilson, MSW
December 2008
COMMUNITY SOCIALPLANNING COUNCILOF TORONTO


Poverty is making us sick: A comprehensive survey of income and health in Canada | 1
Table of ContentsPoverty making us sick, raising incomes best prescription..........................................................................................................................2
Introduction...........................................................................................................................................................................................................3
Context....................................................................................................................................................................................................................3
Current significance.................................................................................................................................................................................................4
Methods......................................................................................................................................................................................................................5
Findings........................................................................................................................................................................................................................5
The population...........................................................................................................................................................................................................5
Self-rated health........................................................................................................................................................................................................5
Chronic conditions...................................................................................................................................................................................................7
Disability................................................................................................................................................................................................................7
Stress and mental health......................................................................................................................................................................................8
Chronic conditions and income..........................................................................................................................................................................8
Endocrine and metabolic conditions............................................................................................................................................................8
Circulatory conditions.......................................................................................................................................................................................9
Eye diseases..........................................................................................................................................................................................................9
Diseases of the nervous system and developmental disorders.......................................................................................................10
Respiratory diseases..........................................................................................................................................................................................10
Musculoskeletal conditions.............................................................................................................................................................................10
Mental and behavioural disorders...............................................................................................................................................................11
Miscellaneous conditions.................................................................................................................................................................................11
Health care access and utilization...................................................................................................................................................................12
Access to and use of medical professionals...............................................................................................................................................12
Unmet health care needs...............................................................................................................................................................................14
Access to health care insurance..................................................................................................................................................................15
The impacts of increasing incomes.....................................................................................................................................................................15
Chronic conditions and disease........................................................................................................................................................................16
Self-rated health, mental health and stress............................................................................................................................................16
Endocrine and metabolic conditions...........................................................................................................................................................16
Circulatory conditions.......................................................................................................................................................................................16
Eye diseases.........................................................................................................................................................................................................16
Nervous system and developmental disorders..........................................................................................................................................16
Respiratory diseases.........................................................................................................................................................................................16
Musculoskeletal diseases.................................................................................................................................................................................16
Mental and behavioural disorders...............................................................................................................................................................16
Miscellaneous..............................................................................................................................................................................................17
Other indicators.................................................................................................................................................................................................17
Explaining health care access and utilization...............................................................................................................................................17
Consultations with medical professionals.................................................................................................................................................17
Health insurance................................................................................................................................................................................................18
Concluding comments..............................................................................................................................................................................................18
Methodological notes...............................................................................................................................................................................................19
Tables..........................................................................................................................................................................................................................21
References................................................................................................................................................................................................................27
Endnotes................................................................................................................................................................................................................29
Appendix...................................................................................................................................................................................................................31

2 | Poverty is making us sick: A comprehensive survey of income and health in Canada
Poverty making us sick, raising incomes best prescriptionDecember 2, 2008
Contrary to some popular beliefs, poverty is making Canadians sick – not simply lifestyle choices – robbing hundreds of thousands of their health and leading to widespread preventable illness and creating huge costs for the health care system. This is the conclusion of powerful new tipping-point research released today by the Wellesley Institute and the Community Social Planning Council of Toronto. For the first time, the study uses Canadian Community Health Survey and income files to paint the most comprehensive picture to date of our nation’s health.
“High income does not guarantee good health, but low income almost inevitably ensures poor health and significant health inequity in Canada,” reports Dr. Ernie Lightman, lead researcher for the new study. Poverty is triggering a devastating health crisis among lower-income people, but the research shows that raising incomes leads to better health.
“This important new research establishes in the most complete way the strong link between low income and poor health,” says Rick Blickstead, CEO of the Wellesley Institute, which co-sponsored the study. “Prof. Lightman and his colleagues have demonstrated that health equity is truly an issue of national significance. The results confirm for the first time that relatively small increases in incomes of poor Canadians will lead to substantial increases in their health.”
The researchers from the Social Assistance in the New Economy (SANE) program at the University of Toronto used the most recent health data. But decision makers may erroneously believe that the global economic tsunami washing over Canada makes alleviating growing poverty and income inequality too expensive, and that threatens to make an already bad situation even worse. The latest findings demonstrate that policy-makers cannot ignore the growing costs of poverty because the costs are relatively smaller than the cost of neglect.
Using sophisticated multivariate analysis, the researchers demonstrate that every $1,000 increase in income leads to substantial increases in health. For instance, an annual increase of $1,000 in income for the poorest twenty percent of Canadians will lead to nearly 10,000 fewer chronic conditions, and 6,600 fewer disability days every two weeks.
Prof. Lightman and his research colleagues, Andrew Mitchell and Beth Wilson, found that the poorest one-fifth of Canadians, when compared to the richest twenty percent, have:
more than double the rate of diabetes and heart disease;•
a sixty percent greater rate of two or more chronic health conditions;•
more than three times the rate of bronchitis;•
nearly double the rate of arthritis or rheumatism.•
The poorest fifth of Canada’s population face a staggering 358% higher rate of disability compared to the richest fifth. The poor experience major health inequality in many other areas, including 128% more mental and behavioural disorders; 95% more ulcers; 63% more chronic conditions; and 33% more circulatory conditions.
The Wellesley Institute is a national leader in pressing for practical and effective strategies to reduce the health gaps among Canadians. “In our work at the local, provincial and national levels, we are calling on governments to take pragmatic steps to raise the incomes of the poorest people. There are a variety of policy options – income transfers, tax policies, market solutions. This research shows that the option of doing nothing is no longer viable,” says Blickstead.
The new research underlines the critical necessity for ensuring that there is a health equity lens in poverty reduction plans. The Ontario government is set to unveil its long-awaited Poverty Reduction Strategy in early December. Newfoundland and Labrador, Nova Scotia, Quebec and Manitoba have launched their own poverty reduction plans. There is growing international and national pressure on the federal government to set out its own poverty reduction plan.
We encourage those governments to include health equity into those strategies.

Poverty is making us sick: A comprehensive survey of income and health in Canada | 3
IntroductionThis report, and a companion study to be released in early 2009, explore the most recent evidence on the relationship between income, a key social determinant of health, and important health outcomes in Canada. The two papers also examine access to and utilization of health services at different income levels.
We focus on the relationship between income and health outcomes1 using the most recent evidence available from the Canadian Community Health Survey (CCHS). Con-ducted in 2005, the CCHS is the only large scale survey of the health of the Canadian population. The companion report will focus on the differences in health outcomes experienced among three distinct groups: the working poor, the non-working poor and the non-poor.
The focus in both studies is on health equity.
This research capitalizes on the availability of individual micro-data files through Statistics Canada’s Research Data Centres, which permits users to conduct research with confidential data from survey master files. This has a number of advantages: it permits analysis using key vari-ables not usually available yet significant from a social determinants of health perspective. Secondly, it allows for comprehensiveness. Rather than focus on one or a few health indicators we have explored a comprehensive set of health and health care utilization indicators. Lastly, the large sample size of the CCHS (over 130,000) allows for precise and robust estimates, including multivariate regression analysis with observations at the level of the individual.
The time period that this research examines is also signifi-cant. The survey data represent the health of the Canadian population in 2005, close to the peak of the economic cycle. In 2005 the unemployment rate in Canada was 6.8 percent, among the lowest in recent history and close to the 6.0 percent rate achieved in 2007.2
ContextThis study grew out of the work of the Social Assistance in the New Economy Project (SANE) at the University of Toronto, a project that has received four major grants from the Social Sciences and Humanities Research Coun-cil of Canada (SSHRC) to explore the impacts of welfare reform and precarious employment in the context of an increasingly globalized economy.3
One of the key projects undertaken by the SANE proj-ect involved a longitudinal panel of social assistance recipients, drawn with the assistance of the City of Toronto Social Services department in the fall of 2002. One of the few, and perhaps the only investigation of its kind in Canada, the panel study followed a sample of social assis-tance recipients over several years, exploring their experi-ences with new service delivery models, their participation in employment programs, and (where possible) their post-welfare employment experiences. We found (supporting much of the existing literature on welfare reform) lim-ited impact of the employment measures that have been a centrepiece of welfare reform in most western industri-alized countries; the low paid and contingent nature of many of the jobs that many recipients receive, and the welfare recidivism that has inevitably accompanied such unstable employment.
The first rounds of interviews led to the conclusion that the health impacts of welfare reform were in fact instru-mental to understanding the dynamics of welfare reform. A large majority of the panel participants reported signifi-cant, and worsening, physical and mental health problems that created tremendous barriers to employment, even in the relatively strong growth economy of the period.4 To be sure, poor health often precedes, and causes, entry to welfare. However it was clear that the health of the panel participants was made worse while on and off assistance, regardless of whether they remained on assistance contin-ually or experienced periods of precarious employment in ‘flexible’ labour markets.
‘Flexible’ labour markets imply various forms of precari-ous employment and growing inequality: Despite the strong economic growth in Canada following the reces-sion of the early 1990s, incomes in the lowest quintile remained stagnant while those in higher quintiles rose, leading to growing inequality (Statistics Canada, 2007; Green and Milligan, 2007). Such trends have become the hallmarks of the so-called ‘new economy’. It thus has become important to understand how these trends impact not just poverty and deprivation, but also health equity.
Around the world there is increased interest and atten-tion paid to health equity and a concomitant focus on the ‘social determinants of health’.5 That is, there is growing recognition that elements of the social environment – the social and economic conditions in which people live – have profound effects on health.

4 | Poverty is making us sick: A comprehensive survey of income and health in Canada
Public Health Canada, an agency of Health Canada, has created a list of the determinants of health, reproduced below, along with brief comments on each entry.6 Not all of these are social determinants of health, but a great many are amenable to public policy interventions.
Income and social status.1. Income determines living conditions and access to important things such as safe housing and neighbourhoods, and sufficient nutritious food. Social status is also related to health, through its relationship to feelings of control over life circumstances and ability to manage stressful conditions.
Social support networks.2. The availability of support from family and friends results in improved sense of well-being and is important in helping people to manage stress and the adverse impacts of challenging life events and circumstances.
Education and literacy.3. Education is directly related to income and social status which influence health, but moreover, education and literacy skills may enable people to exercise greater coping and other life skills. This might for example, allow people with greater education to more easily navigate systems such as health care systems.
Employment/working conditions.4. The conditions of employment and unemployment may also influence health, apart from the influence they exert on income and social status. Unsafe or stressful working conditions, and the stress and loss of income that is associated with unemployment will all play a major role in health.
Social environments.5. The character of the larger community – the degree of supports available, the existence of networks, vibrant formal and informal community organisations permit people to build connections with others and relationships of trust and reciprocity.
Physical environments.6. The influence of the physical environment includes exposure to pollutants which directly impact on health. Beyond this are other features of the physical environment such as the design of housing and neighbourhoods, and the availability of infrastructure such as transportation.
Personal health practices and coping skills.7. Individual behaviours and lifestyle choices help individuals to prevent disease. Socio-economic circumstances also shape these choices.
Healthy child development.8. The circumstances of early childhood are recognized to influence development, readiness to learn and school and health later in life. Not surprisingly, healthy child development is in turn shaped by the socio-economic circumstances experienced in childhood.
Biology and genetic endowment.9.
Health services.10. Access to health services naturally contributes to health.
Gender.11. Gender differentials in social status, roles and outcomes can lead to differential health outcomes.
Culture.12. The exclusion and stigmatization of cultural groups distinct from dominant groups can be associated with greater risks and poorer health outcomes.
Current significanceThis research is timely. While the data was collected in 2005 at a time of peak economic growth in Canada, today the global economy is entering a period of serious, and possibly prolonged, recession. A number of recent stud-ies have focused on rising inequality and its implica-tions, including the health consequences of poverty and inequality (OECD, 2008; Eikemo et al, 2008). It is hardly coincidental that many researchers have begun to explore these issues at roughly the same time. Rising inequality and stubbornly high levels of poverty, despite the period of economic growth that followed the last recession, fall-ing unemployment and social assistance caseloads, have provoked profound questions about the limits of global-ization and ‘flexible’ labour markets. No doubt the cur-rent recessionary period will sharpen debate over these issues considerably.
Moreover initiatives are currently underway in a number of provinces to seek ways of reducing poverty, particularly as it affects children. Quebec, Nova Scotia, Ontario, New-foundland and Labrador and Manitoba are all engaged in systematic efforts to reduce poverty. A key benefit of meaningful poverty reduction will be the important health equity outcomes that would flow from successful efforts to eliminate poverty.

Poverty is making us sick: A comprehensive survey of income and health in Canada | 5
MethodsOur basic approach in this study involves a grouping of the adult population in Canada, aged 18 to 64, into five income quintiles, with the bottom or first quintile representing the twenty percent of the population with the lowest incomes. The top or fifth quintile represents the twenty percent of the population with the highest incomes7. The population under consideration through-out this report was restricted to adults aged 18-64.
We then examine various health outcomes using the most recent cycle of the Canadian Community Health Survey, conducted in 2005, and test for statistically significant dif-ferences among the quintiles: each quintile is compared (and tested for statistical difference) from the quintile directly above it8. We thus are able to assess whether the incidence of various chronic health outcomes and other health indicators differ significantly across income quin-tiles. In simple language we ask whether the poor are sig-nificantly more likely than the rich to experience specific adverse health outcomes. We cannot directly assign cau-sality between low income and poor health but the data are, in general, remarkably compatible with a hypothesis to that effect.
We subsequently use multivariate regression analysis to predict the impact on these health outcomes of increasing incomes by specific amounts (usually $1,000). These data enable us to suggest that if incomes in the lowest quintile were increased by $1,000 on average (regardless of reason), then multiple specific chronic health conditions would be reduced by particular amounts. This leads directly to policy commentary suggesting the importance of income equity in improving health equity across Canada.
There are graphs contained in the figures throughout this report. An appendix at the end of the report includes the detailed tables. This full report, and additional data, is available on-line at the Wellesley Institute web site at www.wellesleyinstitute.com.
FindingsThe populationBasic descriptive statistics for the population considered in the study can be found in Appendix A. Briefly, the aver-age age of the respondents in the sample was 41 years, with the average age being slightly older in each succeed-ing higher income quintile (not shown). The sample was almost exactly divided between women and men.
Over 60 percent of the sample had completed some form of post-secondary education. Approximately one in eight (12 percent) had less than a secondary school education.
The largest group of respondents lived in couple fami-lies either with children (46 percent) or without (23 percent), while slightly over 16 percent were single persons alone and 7 percent lived in sole support parent families. The remaining 7 percent lived in other types of families. The average respondent lived in a household with three members.
Approximately 18 percent stated that they were either a visible minority or aboriginal.
Nearly 12 percent said they often experienced some form of activity limitation.
The mean ‘adjusted household income’9 of respondents rose from slightly over $14,000 in the bottom quintile to nearly $100,000 in the top quintile. Over 13 percent fell below the poverty line (Statistics Canada’s Low Income Measure, or LIM).10
Self-rated healthCanadian adults, on average, rate their health highly. While the majority of Canadian non-elderly adults rate their health as ‘good’, ‘very good’ or ‘excellent’, a signifi-cant minority–around 8 percent–rate their health as only ‘poor’ or ‘fair’.
There is a noticeable income gradient to self-rated health (See Table 1 at the end of this report and Figure 1 on the next page). The number of people who rated their own health as ‘poor’ or ‘fair’ varied with income from 178 per thou-sand population in the lowest income quintile (adjusted), to 42 in the top quintile. That is, roughly four times as many respondents in the bottom quintile reported their health as ‘poor’ or ‘fair’ as compared to the top quintile; the response rate for ‘poor’ or ‘fair’ health in the bottom quintile was roughly double that in the adjoining second quintile. All of the tests of significance with the adjacent categories were statistically significant.
Self-rated health has been shown to be a valid and reli-able indicator of health (Shields and Shooshtari, 2001; O’Brien, 1997; Lundberg and Manderbacka, 1996; Brazier, Harper and Jones, 1992). Self-rated ‘poor’ or ‘fair’ health decreases dramatically as income quintile increases.
A second measure, referring to self-rated mental health showed similar differences between adjoining quintiles

6 | Poverty is making us sick: A comprehensive survey of income and health in Canada
(Figure 2). Self-rated ‘poor’ or ‘fair’ health in the bottom quintile, at 97 responses per thousand population, was roughly double that of the adjoining, second quintile, while each quintile was significantly different (at .01 level or better) from the quintile immediately above it.
Thus, similar to the overall indicator of self-assessed health, self-rated mental health improves substantially as income quintile rises.
Chronic conditionsAs we move from self-assessed health to chronic conditions that have been diagnosed by a physician, similar relation-ships are evident.11 While it is common for Canadians at all income levels to report at least one chronic condition, there is a strongly significant difference observed between those in the first and second quintiles, from nearly 700 per thousand population reporting at least one chronic con-dition in the bottom quintile, to 672 per thousand in the second quintile.
F I G U R E 1
‘Poor’ or ‘fair’ self-reported health
Age-adjusted rates, per thousand population, by adjusted household income quintile
Canada, population age 18-64, 2005
0
50
100
150
200
Fifth (Top Quintile)
FourthThirdSecondFirst (Bottom Quintile)
RATE
PER
THO
USAN
D
ADJUSTED HOUSEHOLD INCOME QUINTILE
94.8
78.2
178.1
41.8
57.6
F I G U R E 2
‘Poor’ or ‘fair’ self-reported mental health
Age-adjusted rates, per thousand population, by adjusted household income quintile
Canada, population age 18-64, 2005
0
20
40
60
80
100
Fifth (Top Quintile)
FourthThirdSecondFirst (Bottom Quintile)
RATE
PER
THO
USAN
D
ADJUSTED HOUSEHOLD INCOME QUINTILE
48.842.7
97.5
26.632.3

Poverty is making us sick: A comprehensive survey of income and health in Canada | 7
While having at least one chronic condition is common amongst adults at all income levels, the incidence of mul-tiple chronic conditions are much more highly related to income quintile. Nearly 30 percent (289 per thousand) of those in the lowest quintile reported having more than two chronic conditions, compared to only 23 percent in the second quintile, and less than 18 percent in the top income group (Figure 3). Similarly, the total number of chronic conditions reported dropped from nearly 2,000 (per thousand population), or slightly under 2 per person, in the bottom quintile, to approximately 1,400, or 1.4 per person in the top quintile. Again there is a clear gradient between adjoining quintiles.
The average number of chronic conditions, per thou-sand population, is 42 percent higher in the lowest quin-tile (1921), as compared to the highest (1356). While the incidence of multiple chronic conditions clearly rises as income drops, the incidence of such multiple conditions is particularly acute among the poorest twenty percent of the population.
Disability Those who said they often experienced limitations in participation in the activities of everyday living (hearing, seeing, communicating, walking, climbing stairs, bend-ing, learning etc.), at home, in school, in the workplace or elsewhere, numbered approximately 87 per thousand in the bottom income quintile, a rate that declined to 36 in the second quintile and 30 in the middle quintile. In
the top two quintiles the rate was approximately 20 per
thousand, or less than one-quarter the rate in the bottom
quintile. The differences are highly significant.
Those in the bottom quintile experienced ‘disability
days’–days when they were forced to reduce their activi-
ties or stay in bed due to illness or injury–at a rate far in
excess of others in the population. In the bottom quin-
tile there were over 1,300 ‘disability days’ (over a two week
period) per thousand population, compared with slightly
over 800 in the second quintile. Thereafter the rate stayed
relatively constant as income quintile rose.12 The excess of
approximately 500 disability days (per thousand popula-
tion) faced by those in the lowest quintile, compared to
those with higher incomes, has important ramifications
for health equity, as well as for employment and educa-
tional policies and the costs of treating illness in Canada.
Stress and mental healthSelf-reported stress, defined as finding most days ‘quite
a bit or extremely’ stressful rises from 270 per thousand
population in the bottom quintile to 295 in the top quin-
tile. This is the first indicator we have seen where adverse
health outcomes are higher in the top quintile than in the
lowest. Not all quintiles – particularly those in the middle
– differ statistically from one another, though there is a
significant drop between the first and second quintiles
and a comparable increase when moving from the fourth
to the top quintile.
F I G U R E 3
More than two chronic conditions
Age-adjusted rates, per thousand population, by adjusted household income quintile
Canada, population age 18-64, 2005
0
50
100
150
200
250
300
Fifth (Top Quintile)
FourthThirdSecondFirst (Bottom Quintile)
RATE
PER
THO
USAN
D
ADJUSTED HOUSEHOLD INCOME QUINTILE
229.5213.6
289.0
177.1
200.2

8 | Poverty is making us sick: A comprehensive survey of income and health in Canada
When people reported on the number of weeks they felt depressed in the previous 12 months the reported numbers decline in a linear fashion as income quintile rises. The most important difference was between the first and second quintiles, where the number of weeks they felt depressed declined from over 1,700 (or about 1.7 weeks per person) in the bottom quintile to just over 970 in the second quintile (about 1.0 weeks per person). The differ-ences among the second, third and fourth quintiles are smaller, but there is another noticeable drop upon reach-ing the fifth quintile, where the number of weeks dropped again to approximately 580, or about 0.6 weeks per person, a difference that was significantly different from other quintiles (not shown).
A formal measure of depression, a depression scale (0-8 scale in which higher scores reflect greater depression), confirms what the self-reported indicators suggest: an income gradient exists, most pronounced between the first and second quintiles, and then again upon reaching the fifth quintile. The average score declines from 0.67 in the bottom quintile to 0.45 in the second, remains level in the middle quintiles, then drops again to 0.34 in the top quintile.
Thus, while the highest income quintile respondents may have reported that most days were ‘quite a bit or extremely’ stressful with greater frequency than the other groups, they nevertheless recorded the fewest weeks in which they were depressed, along with the lowest scores on the depression scale. Apparently ‘stress’, as recorded,
does not translate into depression among the upper
quintile respondents.
Chronic conditions and incomeWe reported above on the relationship between income and
the overall incidence of chronic conditions, and multiple
chronic conditions. In this section we explore these rela-
tionships in more detail by examining broad categories of
chronic conditions, and specific conditions within those
categories that are particularly significant for population
health.13 The categories include: endocrine and metabolic
conditions, circulatory conditions, eye diseases, diseases
of the nervous system and developmental disorders, respi-
ratory diseases, musculoskeletal conditions, mental and
behavioural disorders, and miscellaneous conditions.14
Endocrine and metabolic conditions
Endocrine and metabolic conditions encompass a vari-
ety of situations including thyroid conditions, diabetes,
allergies and chemical sensitivities. Overall there is no
clear relationship between the incidence of endocrine and
metabolic conditions and income quintile (See Table 2 at
the end of this report). The rate per thousand varies from a
high of 377 per thousand (fourth quintile) to 364 (second
quintile), with the only statistically significant difference
(at the .05 level) being that between the fourth and top
quintiles (377 versus 365 per thousand).
F I G U R E 4
Diabetes
Age-adjusted rates, per thousand population, by adjusted household income quintile
Canada, population age 18-64, 2005
0
10
20
30
40
50
60
Fifth (Top Quintile)
FourthThirdSecondFirst (Bottom Quintile)
RATE
PER
THO
USAN
D
ADJUSTED HOUSEHOLD INCOME QUINTILE
38.1 37.9
52.9
22.9
28.6

Poverty is making us sick: A comprehensive survey of income and health in Canada | 9
However, the aggregation involved in combining different chronic conditions masks significant differences among the component elements. The key condition of interest is diabetes, the entry in this group rated as having a moder-ate impact on the health utility index (Shultz and Kopec, 2003). Here a clear relationship with income does emerge with the rate in the lowest quintile (53 per thousand) being almost 40 percent higher than the rate in the next two quintiles (38 per thousand) and more than double the rate of 23 in the top quintile (Figure 4, below). The difference in incidence between the bottom and the fourth quintiles, in particular, is highly statistically significant.
There is also a highly significant difference between the incidence of multiple chemical sensitivities in the bottom quintile and all the other groups, reflecting perhaps higher levels of exposure in working or living environ-ments for the poorest Canadians. From an environmental perspective, this finding may be of great policy importance in considering health equity.
Circulatory conditions
Circulatory conditions reported here include: heart disease, high blood pressure and living with the effects of a stroke. Circulatory conditions as a group exhibit a strong and statistically significant inverse relationship with income, declining from an incidence of 152 per thousand in the lowest quintile to 142 in the second, and 114 per thousand in the top income group. The bottom income group experiences circulatory conditions at a rate 17
percent higher than the middle quintile (which approxi-mates the overall Canadian average).
Heart disease for example, is found at a rate of 39 cases per thousand in the lowest quintile, more than 40 percent higher than in the second quintile (27 cases per thousand). The incidence is more or less constant in the middle quin-tiles, but drops again to 18 per thousand in the upper-most income group, meaning that the incidence of heart disease in the lowest income group is more than double that of the highest quintile (Figure 5, below).
High blood pressure is significantly greater in the two lowest quintiles (poorest 40% of the population) as compared to the middle quintile. There is a significant drop in incidence again between the fourth and the top quintile. That is, high blood pressure is about 25 percent more common in the bottom quintile than in the top.
Overall, both heart disease and high blood pressure are found with much greater frequency in the lower quintiles as compared to the high income groups.
Eye diseases
The overall category of eye diseases exhibits a strong rela-tionship with income. The incidence per thousand popu-lation is 27 in the lowest quintile and declines to 18 in the middle income groups, and then to 12 in the top quintile. The rate is highest in the bottom two quintiles, then drops significantly to the third and fourth quintile and then declines again to the fifth quintile, creating three levels or
F I G U R E 5
Heart disease
Age-adjusted rates, per thousand population, by adjusted household income quintile
Canada, population age 18-64, 2005
0
5
10
15
20
25
30
35
40
Fifth (Top Quintile)
FourthThirdSecondFirst (Bottom Quintile)
RATE
PER
THO
USAN
D
ADJUSTED HOUSEHOLD INCOME QUINTILE
26.925.3
39.0
18.2
23.3

10 | Poverty is making us sick: A comprehensive survey of income and health in Canada
plateaus of incidence – the poorest 40% of the population followed by the next 40% and then the richest 20%.
Diseases of the eyes include both cataracts and glaucoma. Because the incidence of these specific conditions is rela-tively low, sample size limitations prevent reliable calcula-tion of incidence by quintile
Diseases of the nervous system and developmental disorders
This category includes learning disabilities, epilepsy and migraines. Incidence of these conditions as a group shows a strong inverse relationship to income, with the rates varying from 183 per thousand in the bottom quin-tile, to under 115 in the top quintile, a decline of about one-third overall.
Each of the three specific enumerated conditions shows a highly significant difference in incidence between the lowest and the adjoining quintile, suggesting that these conditions disproportionately affect the lowest income groups in Canada. Migraines are the most prevalent condition in this category, with an incidence of 148 per thousand in the bottom quintile to less than 100 in the top income quintile, a fifty percent disparity (Figure 6, below).
Respiratory diseases
This category includes both chronic bronchitis and asth-ma.15 Both the overall category and the two individual
conditions showed variation with income, the key sig-nificant differences being between the bottom and second quintiles. Above the first quintile the differences were not as large and often not statistically significant. Again this suggests that the incidence of respiratory diseases is strongly associated with the lowest incomes, with signifi-cantly higher rates found in the lowest quintile.
Chronic bronchitis had an incidence of 41 per thousand in the bottom quintile and dropped nearly in half to 22 per thousand in the second quintile (Figure 7, next page). The rates dropped again between third and fourth quin-tiles (from 22 to 16 per thousand), and again between the fourth and top quintiles (to a rate of 13 per thousand). Asthma declined from 98 cases per thousand population in the bottom quintile to 81 per thousand in the second quintile, a highly significant drop.
Musculoskeletal conditions
Musculoskeletal conditions include arthritis and rheumatism, back problems (not including arthritis or rheumatism), fibromyalgia and chronic fatigue syndrome. Incidence rates for the category as a whole and for each of the individual conditions show a significant inverse relationship with income. The overall rate in the bottom quintile is 329 per thousand population falling to 285 in the second quintile and 240 by the fifth quintile. The difference between each of the quintiles is strongly statis-tically significant.
F I G U R E 6
Migraines
Age-adjusted rates, per thousand population, by adjusted household income quintile
Canada, population age 18-64, 2005
0
30
60
90
120
150
Fifth (Top Quintile)
FourthThirdSecondFirst (Bottom Quintile)
RATE
PER
THO
USAN
D
ADJUSTED HOUSEHOLD INCOME QUINTILE
116.9 115.3
147.9
98.4
109.3

Poverty is making us sick: A comprehensive survey of income and health in Canada | 11
While the incidence of all the conditions within the category decline with income, the key condition we focus on is arthritis or rheumatism (Figure 8, next page). After general back problems it is the condition which has the highest incidence rate, and it is the condition which has a severe impact on objective health functioning, as mea-sured by its impact on the health utility index (Shultz and Kopec, 2003). In the bottom quintile there is an incidence of approximately 167 cases per thousand, compared with 138 in the second quintile, 125 in the middle quintile, 111 in the fourth and finally under 100 in the top quintile. That is, the incidence of arthritis or rheumatism is nearly 80 percent higher in the bottom as compared to the top quintile.
The incidence rate for each of the four identified condi-tions is significantly higher in the bottom or first quintile, compared to the adjoining quintile. Arthritis or rheuma-tism shows a strong, large and highly significance linear decline as we pass through each of the quintiles from poor to rich. Clearly this is a condition strongly associated with low income (and poverty) in Canada.
Mental and behavioural disorders
Mental and behavioural disorders include anxiety dis-orders, mood disorders, Alzheimer’s or dementia and schizophrenia. As group they relate closely to income, fall-ing from a high of 146 per thousand in the bottom quin-tile to 64 in the highest, with most quintiles significantly different from the adjacent quintiles. There is a highly
significant drop in incidence as we go from the bottom to
the second quintile and from the fourth to the top quin-
tile as well, reflecting greatest incidence among the poor-
est Canadians with the wealthiest quintile least affected
Anxiety and mood disorders, the two specific conditions
for which incidence rates could be reliably calculated,16
showed clear relationships with income. In each case there
is a significant drop in incidence with movement from the
bottom to the second quintile.
In the case of anxiety the rate in the bottom quintile (81
per thousand) is significantly higher than the rate in the
next quintile (44 per thousand population), and indeed,
significantly higher than in all other quintiles.
Mood disorders are found at a rate of 105 per thousand in
the lowest income quintile, a rate over 60 per cent higher
than the 64 per thousand rate found in the second quintile.
Similarly, the rate in the second quintile is significantly
higher than the rate in the third and fourth quintiles, and
the rate of 39 per thousand in the highest quintile is sig-
nificantly lower than the rates of 54-55 found in the third
and fourth quintiles.
Miscellaneous conditions
Miscellaneous conditions include cancer, ulcers, urinary
incontinence and bowel disorders.
In this category there is a significant difference between
the first quintile and all other quintiles, with a rate of 110
F I G U R E 7
Chronic bronchitis
Age-adjusted rates, per thousand population, by adjusted household income quintile
Canada, population age 18-64, 2005
0
10
20
30
40
50
Fifth (Top Quintile)
FourthThirdSecondFirst (Bottom Quintile)
RATE
PER
THO
USAN
D
ADJUSTED HOUSEHOLD INCOME QUINTILE
22.5 21.9
40.7
13.016.3

12 | Poverty is making us sick: A comprehensive survey of income and health in Canada
per thousand in the bottom quintile and rates that range between 75 to nearly 90 in the other four. However, apart from the first quintile none of these other differences are statistically significant. Because this category includes a disparate group of conditions that may have little in common, the overall incidence rates may have limited practical meaning.
However, the rate of 25 cases per thousand of urinary incontinence in the first quintile is significantly higher than the rate of 21 in the second quintile which is, in turn, higher than the 13-16 cases per thousand found in the third, fourth and fifth quintiles.
The overall incidence of cancer does not vary significantly with income quintiles though the rates are low. It is pos-sible certain specific types of cancer might vary by quintile but the limited sample sizes in the data do not permit us to explore this question.
Health care access and utilizationAs might be expected, the differential health outcomes experienced across the income quintiles also translate into differences in health care access and utilization. This is the subject we explore in this section.
Access to and use of medical professionals
Access to a general practitioner varies with income. In the middle and upper income quintiles approximately 15
percent of the adult respondents to the CCHS said they did not have a regular family doctor, while in the poor-est quintile the rate was nearly 20 percent, or about 194 people per thousand population (see Table 3, at end of report). Despite their greater health care needs as docu-mented above, those in the lowest income quintile are about 30% less likely to have a regular family doctor than the ‘average’ Canadian adult.17
Visits to or consultations with medical professionals over a 12-month period also relate to income, but in highly differentiated ways. In Table 3 we see that the total number of all medical consultations appear to form a U-shaped relationship with income, declining by about 18 percent between the first and second quintiles, then rising through the third, fourth and fifth quintiles, although these latter differences are not statistically significant.18 Once again, the process of aggregating distinct specific situations masks important differences.
The source of these differences becomes more apparent when visits to specific types of health professionals are examined. The number of consultations with family doc-tors declines directly with income, with the largest drop occurring between the first and second quintiles, from nearly four per person to just less than three, and drop-ping further to approximately 2.5 per person at the fifth quintile.
On the other hand, consultations with specialists fall from 1,480 per thousand population in the bottom quin-tile to slightly below 1,300 in the second quintile and then
F I G U R E 8
Arthritis or rheumatism
Age-adjusted rates, per thousand population, by adjusted household income quintile
Canada, population age 18-64, 2005
0
50
100
150
200
Fifth (Top Quintile)
FourthThirdSecondFirst (Bottom Quintile)
RATE
PER
THO
USAN
D
ADJUSTED HOUSEHOLD INCOME QUINTILE
137.8124.7
167.2
93.1
111.1

Poverty is making us sick: A comprehensive survey of income and health in Canada | 13
rise again, reaching nearly 1,500 in the highest quintile.
Similarly, consultations with medical professionals other
than general practitioners and specialists display the same
pattern, declining between the first and second quintiles,
and then rising again to reach a peak in the top quintile.
The significantly high use of all medical consultations in
the lowest quintile undoubtedly reflects the poor health
of this group, as reported throughout this report.
Another potentially valuable indicator of health care
utilization is the amount of time people spend in hospi-
tals over the course of a year. Those in the bottom quin-
tile spend a disproportionately larger number of nights
in institutions than the rest of the population: approxi-
mately 800 nights per thousand people, gradually falling
to 282 in the uppermost quintile. The difference between
the bottom quintile and all the other categories is large
and highly significant, again reflecting the overall poor
health of the poorest Canadians. The cost implications
of 500+ more nights per year in hospital for the bottom
F I G U R E 9
Mood disorders
Age-adjusted rates, per thousand population, by adjusted household income quintile
Canada, population age 18-64, 2005
0
20
40
60
80
100
120
Fifth (Top Quintile)
FourthThirdSecondFirst (Bottom Quintile)
RATE
PER
THO
USAN
D
ADJUSTED HOUSEHOLD INCOME QUINTILE
64.1
55.3
104.8
38.9
54.1
F I G U R E 1 0
Has no regular medical doctor
Age-adjusted rates, per thousand population, by adjusted household income quintile
Canada, population age 18-64, 2005
0
50
100
150
200
Fifth (Top Quintile)
FourthThirdSecondFirst (Bottom Quintile)
RATE
PER
THO
USAN
D
ADJUSTED HOUSEHOLD INCOME QUINTILE
163.8
194.1
149.8 154.5161.5

14 | Poverty is making us sick: A comprehensive survey of income and health in Canada
quintile (per thousand population), compared to the top quintile, are major.
Unmet health care needs
Those with lower incomes are more likely to report health concerns, often at considerably greater rates than the rest of the population, but they are also significantly more likely to report that they have unmet health care needs – that is they did not receive care that they believed they required. Unmet health care needs were reported by approximately 161 out of a thousand people in the bottom quintile,
compared approximately 120 per thousand in other quin-tiles. The difference between the poorest quintile and all other Canadians is highly significant.
As important as the incidence of unmet health needs, are the reasons that people did not receive the care they believed they required.19 While those in upper income quintiles were more likely to report that they didn’t receive care for reasons of convenience (‘not available at time required’, or ‘didn’t get around to it’) the rea-sons low income people did not seek care appear to be related to issues of cost, transportation problems, family
F I G U R E 1 1
Total number of consultations with medical professionals
Age-adjusted rates, per thousand population, by adjusted household income quintile
Canada, population age 18-64, 2005
0
1000
2000
3000
4000
5000
6000
Fifth (Top Quintile)
FourthThirdSecondFirst (Bottom Quintile)
NUM
BER
OF C
ONSU
LTAT
IONS
ADJUSTED HOUSEHOLD INCOME QUINTILE
3985
1480
2917
5115
4478
1284
1338
2847
5068
5019 54
84
1491
1327
2736
2514
Other medical professionals
Specialists
General Practitioner
F I G U R E 1 2
Self-perceived unmet health care needs
Age-adjusted rates, per thousand population, by adjusted household income quintile
Canada, population age 18-64, 2005
0
50
100
150
200
Fifth (Top Quintile)
FourthThirdSecondFirst (Bottom Quintile)
RATE
PER
THO
USAN
D
ADJUSTED HOUSEHOLD INCOME QUINTILE
122.4 122.2
160.7
115.7123.5

Poverty is making us sick: A comprehensive survey of income and health in Canada | 15
responsibilities or a belief that the care available would not be adequate. For the upper income groups, the reasons related mainly to issues of personal choice while for the poor, the barriers were structural and financial. The dif-ferences in reason across the quintiles that are statistically significant can be seen in Table 3.
Access to health care insurance
Finally in this section we explore access to health insur-ance for costs not covered under medicare. The data refer only to Ontario.
Once again there is a dramatic relationship with income (see Table 3 and Figure 13). For prescription medications only about half of those in the bottom quintile have such insurance, compared with approximately 80 percent of Ontario adults overall. Access to insurance for prescrip-tion medications peaks in the top quintile at 88 percent, but each quintile has significantly improved access over the quintile below.
A very similar relationship can be seen for dental care insurance, which rises from approximately 46 percent in the bottom quintile to 87 percent in the top; and eye-glasses, increasing from 41 percent in the bottom quintile to 80 percent in the top group. Lastly, insurance for addi-tional hospital charges is accessible to one-third of those in the bottom quintile, but to 84 percent of those in the top quintile.
Once again, this is not a simple difference between the ‘poor’ and the ‘non-poor’. At each level of income – each quintile - a difference in access compared to the adjoining
group can be observed. These differences are numerically
large, and statistically significant in all cases. Clearly,
access to private insurance for uninsured health costs is
highly associated with income in Ontario.
The impacts of increasing incomesThe analysis presented so far provides compelling evi-
dence of the powerful relationship between income and
health outcomes, although it controls for only two factors
closely related to health - income and age20. As the earlier
overview of the social determinants of health makes clear,
there is a range of other relevant factors, some also the
result of or closely related to income, and others not.
This section of the study attempts to extend the analysis
by asking a slightly different question: what is the impact
of small increments of income (smaller than movements
from one quintile to another) on changes in health status,
access and utilization, once other factors known or
suspected of being associated with health outcomes, are
controlled for? Secondly, can such increments translate
into measureable differences in health outcomes, particu-
larly among those in the bottom quintile?
Although the Canadian Community Health Survey does
not contain a complete set of ideal variables for a com-
prehensive measurement of the determinants of health,
it does contain a range of useful control variables and
acceptable proxies for many (see Table 4 at end of report).
F I G U R E 1 3
Access to health insuranceby adjusted household income quintile
Canada, population age 18-64, 2005
0
20
40
60
80
100
Fifth (Top Quintile)
Fourth
Third
Second
First (Bottom Quintile)Hospital chargesEyeglasses or
contact lensesDental CarePrescription
Medication
PERCENT 54
.8
72.2
81.0 86
.6 88.3
46.2
67.8
79.2 84
.8 86.9
40.9
60.1
72.3 77
.8 80.2
32.5
61.1
71.7
79.7 83
.8

16 | Poverty is making us sick: A comprehensive survey of income and health in Canada
In this section we use logistic regression and general linear modeling techniques to assess the impact on spe-cific outcomes of a $1,000 increase in incomes on those in the bottom quintile. The control variables which we hold constant are listed in Table 4 and the detailed regres-sion results can be seen in appendices C and D. Overall, the regression results strongly indicate that income has a profound effect on health, even once these other specific factors are taken into account. In the section that follows we explore the approximate magnitude of this impact. For a variety of reasons we believe these estimates to be conservative.21
Chronic conditions and disease
Self-rated health, mental health and stress
Once other factors are controlled for income exerts a powerful effect on most aspects of self-rated health. Our results suggest that within the bottom quintile a $1,000 increment in income can be associated with over 3,000 more people rating their overall health as ‘good’, ‘very good’ or ‘excellent’ (see Table 5, at end of report). Similar, albeit smaller, effects are seen for self-rated mental health where the increment is associated with approximately 1,500 additional people rating their mental health as good or better.
Similarly, the number of weeks that people reported that they were depressed in the past year falls by nearly 56,000 among those in the bottom quintile in response to a $1,000 increase in income. If weeks of depression mean weeks when people aren’t able to work or be otherwise productive then this represents more than 1,000 person years lost.
Conversely, the number of people reporting stress in the form of most days being ‘quite a bit’ or ‘extremely’ stressful rises somewhat with income, although this may be an artefact.
Endocrine and metabolic conditions
Within this category both the key condition of diabetes, and that of multiple chemical sensitivities are strongly associated with income. Every $1,000 increment of income is associated with nearly 900 fewer cases of each of diabe-tes and chemical sensitivities (nearly 1,800 cases in total), holding all else constant.
Circulatory conditions
Heart disease and the overall category of circulatory con-
ditions miss the conventional threshold for statistical sig-
nificance (p < .05), although they were very close to that
mark.
Eye diseases
The overall category is positively related to income, with
each income increment of $1,000 being associated with
approximately 330 fewer cases of eye disease. Within
the category, nearly 200 fewer cases of cataracts can be
associated with the increase in income, holding all else
constant.
Nervous system and developmental disorders
Nearly 900 fewer cases of migraine are significantly associ-
ated with the $1,000 income increment.
Respiratory diseases
Chronic bronchitis was strongly associated with income,
with over 600 fewer cases in the bottom quintile poten-
tially associated with the $1,000 increment of income, all
else constant.
Musculoskeletal diseases
Each individual condition and the category as a whole are
strongly and negatively related to income. Overall, approx-
imately 1,500 fewer musculoskeletal conditions are asso-
ciated with an increment of $1,000 in income. Similarly,
significantly fewer numbers of each individual condition
- back problems (-785), arthritis or rheumatism (-1,281),
fibromyalgia (-230) and chronic fatigue syndrome (-381)
are associated with the $1,000 income increase.
Mental and behavioural disorders
Overall this category of chronic conditions was nega-
tively associated with income. Within the category anxiety
disorders were negatively associated with income, but
missed the threshold only marginally. However the cat-
egory of mood disorders was strongly and negatively
associated with income, with approximately 1,000 fewer
mood disorders in the bottom quintile associated with an
income increment of $1,000.

Poverty is making us sick: A comprehensive survey of income and health in Canada | 17
Miscellaneous
Under the ‘miscellaneous’ category only stomach or intes-tinal ulcers were associated with income, with up to 500 fewer occurring in the bottom quintile associated with a $1,000 income increment.
Other indicators
As observed earlier, the presence of at least one chronic condition is common at all income levels. In the multivar-iate analysis we found no significant relationship between income and the simple presence or absence of a chronic condition. However, having more than two chronic condi-tions was strongly related to income. The preceding results indicate powerful income effects for many individual con-ditions. Indeed the effect of income in the bottom quintile suggests that nearly 10,000 fewer chronic conditions, and 6,600 fewer disability days (over a two week period) might be associated with a $1,000 change in income.
Explaining health care access and utilizationWe saw earlier that those in the bottom quintile were approximately 30 percent more likely to have a need for health care that had gone unmet. Our multivariate analy-sis suggests that among those in the bottom quintile each $1,000 in income may be associated with 600 fewer indi-viduals having such unmet needs, once other factors are controlled for (see Table 6, at end of report).22
Similarly, the likelihood of having a regular family doctor is significantly associated with income, such that nearly 1,000 additional people report having a regular doctor with each increment of $1,000. In this case the relation-ship may be more subtle and less straightforward than simply income being equated with better health. Income here may represent such things as better jobs, a more stable residence, social status and ‘voice’; all things that may be associated with the likelihood of having a regular family doctor.
Consultations with medical professionals
There is a marked distinction among the different cat-egories of medical consultations explored in the CCHS. The number of consultations with family physicians or general practitioners continues to be negatively related
to income in the multivariate analysis, as it was in the analysis by income quintile. This logically follows from the observable differences in concrete health outcomes just explored. Just as there are measurable differences in health with each increment in income, the number of consultations with physicians also declines, in this case by nearly 25,000 among those in the bottom quintile.
On the other hand, consultations with specialists are pos-itively related to income. The parameter estimates suggest that nearly 16,000 additional consultations with special-ists are associated with an increase in income. Similarly, consultations with medical professionals other than gen-eral practitioners and specialists are positively associated with income.
We saw earlier that, apart from general practitioners, higher rates of consultations at low income levels were fol-lowed by rising rates as income rose from middle income levels, almost forming a U-shaped pattern.
These findings can perhaps be understood as the result of two different forces at work in different parts of the income distribution. First, and most obviously, the poorer health experienced by those with lower incomes translates into increased health care needs.
But secondly, the other force at play might involve greater voice - an ability on the part of those with greater resources (both financial and personal) to navigate and access the health care system. That is, as income and status rise, the ability to gain access to health services may rise in a way that is unrelated to objective health status.
Indeed the other multivariate results support this hypoth-esis, as education was also found to be positively related to the number of consultations with specialists and medi-cal professionals other than general practitioners and specialists.23
Health insurance
The availability of health insurance for costs not covered by public health care is of tremendous importance to fam-ilies. Indeed, researchers and policy makers hypothesize that the availability of supplemental health insurance to those on social assistance, as compared to an almost cer-tain absence in the low wage labour market, is a factor in hindering people’s efforts to leave social assistance.
Our multivariate results (for Ontario respondents only) again suggest a powerful relationship with income, with each of the four types of private insurance (prescription

18 | Poverty is making us sick: A comprehensive survey of income and health in Canada
medications, dental insurance, eyeglasses and hospital insurance) being positively and strongly related to income. This is likely the result of higher income being associated with better quality jobs, and/or improved financial capac-ity to purchase such coverage privately.
Concluding commentsThis research has sought to uncover the most comprehen-sive evidence on the relationship between income, health outcomes and key measures of health care access and utilization. Our focus has been on the concept of health equity and the role that income plays in pursuing or impeding attainment of this goal.
To do this we have used the most recent national data available from the Canadian Community Health Survey, the largest and most comprehensive data of its kind in Canada, to examine a range of health care outcomes according to the level of income of the individual household.
In general we found strong and highly significant rela-tionships between low income status and the incidence of various chronic health conditions. The findings in
this regard are more detailed than previously reported in other studies. We likewise found that overall utilization of the health care system (along with unmet needs in this system) were disproportionately weighted in favour of the poorest twenty percent of the population, undoubtedly reflecting their significantly poorer health overall.
Though it is not the intent of this paper to prescribe policy directions for the pursuit of health equity in Canada, this research clearly suggests – as others have also shown - that low income leads to poor health; and that poverty is incompatible with health equity. And to the extent that health equity is a desired social goal, this report provides quantitative estimates of the probable impacts of modest increases in income among the poorest Canadians.
High income, as this report shows, does not guarantee good health; but low income almost inevitably ensures poor health and significant health inequity in Canada.

Poverty is making us sick: A comprehensive survey of income and health in Canada | 19
Data. This analysis is based on data from the 2005 Cana-dian Community Health Survey (CCHS) Cycle 3.1. The 2005 CCHS was conducted by Statistics Canada, in part-nership with Health Canada, the Canadian Institute for Health Information and provincial and territorial min-istries of health. The survey includes information on the health status, health care use and health determinants of over 130,000 individuals aged 12 and over, residing in private dwellings covering all provinces and territories in Canada. Individuals living on Native reserves and on Crown lands, residents living in institutions, full-time members of the Canadian Forces and residents of certain remote regions are not included in the survey. The survey covers approximately 98% of the Canadian population aged 12 and over. Surveys were administered in person and by telephone utilizing a computer-assisted interview-ing system.
The CCHS includes common content modules adminis-tered in all health regions, optional modules utilized by specific health regions, and sub-sample content asked of a subset of respondents to reduce respondent burden. Analyses presented in this report are based on data from common content and optional modules (analyses for Ontario only).
Sample. Adults between the ages of 18 and 64 with com-plete income data that would allow for their categori-zation into adjusted household income quintiles were included in the analysis. Household income was adjusted by dividing income by the square root of the number of household members. This is a standard adjustment rec-ommended by the OECD and used by many researchers. Approximately 92,000 respondents were included in the national sample, with 28,000 respondents in the Ontario sample.
The following health outcomes and health care use mea-sures are reported for Canada and Ontario based on common content modules of the CCHS:
Health outcomes include self-reported health, self-reported mental health, stress, number of disability days taken in a two-week period, and a range of chronic conditions.
Respondents were asked, “In general, would you say your health is: (excellent, very good, good, fair or poor)?” and “In general, would you say your mental health is: (excel-lent, very good, good, fair or poor)?” Responses were
grouped into two categories: fair or poor vs. excellent, very good or good. Self-reported health is a valid and reliable measure of health, strongly associated with other mea-sures of health including physicians’ ratings (Shields and Shooshtari, 2001; O’Brien, 1997; Lundberg and Mander-backa, 1996; Brazier, Harper and Jones, 1992)
Regarding stress, respondents were asked, “Thinking about the amount of stress in your life, would you say that most days are: (not at all stressful, not very stressful, a bit stressful, quite a bit stressful, or extremely stressful)?” Responses were grouped into two categories: quite a bit stressful or extremely stressful vs. not at all stressful, not very stressful, a bit stressful.
Regarding disability days, respondents were asked the number of days that they spent in bed for all or most of the day due to illness or injury in the 14 days preceding the interview.
Respondents were asked whether they were diagnosed by a health professional with a variety of chronic conditions that lasted or were expected to last six months or more. Chronic conditions were grouped into disease classifica-tions using the World Health Organization’s Interna-tional Classification of Diseases (ICD-10).24 Disease clas-sifications and chronic conditions include: Endocrine or metabolic condition (food allergies, allergies other than food, diabetes, thyroid condition, multiple chemical sen-sitivities), circulatory system condition (high blood pres-sure, heart disease, suffers from the effects of a stroke), eye disease (cataracts, glaucoma), diseases of nervous system or developmental disorder (migraine headaches, epilepsy, learning disability), diseases of the respiratory tract (asthma, chronic bronchitis), musculoskeletal dis-eases (fibromyalgia, arthritis or rheumatism, back prob-lems excluding fibromyalgia, arthritis and rheumatism, chronic fatigue syndrome), mental and behavioural dis-orders (schizophrenia, Alzheimer’s Disease and other dementia, mood disorder, anxiety disorder), non-cate-gorized conditions (cancer, stomach or intestinal ulcers, urinary incontinence, bowel disorder) and other chronic condition not listed. Due to small group sizes, individual rates for cataracts, glaucoma, schizophrenia and Alzheim-er’s Disease and other dementia are not reported.
Health care use measures include items regarding self-perceived unmet health care needs, having and consult-ing with a family doctor, consultations with medical
Methodological notes

20 | Poverty is making us sick: A comprehensive survey of income and health in Canada
professionals, specialists and others, and staying over-night in a hospital, nursing home or convalescent home.
Multivariate Analysis.
Statistical analysis was undertaken with SAS statistical software version 9.1.
Simple tabular comparisons were undertaken with chi-square statistics, utilizing bootstrap variance estimation techniques using the BOOTVAR program developed by Statistics Canada. Bootstrap variance estimation is one of a class of techniques developed to adjust for the fact that most surveys are not true random samples, as required by statistical theory, but typically have complex design fea-tures such as stratification. A failure to take these sample design issues into account leads to underestimates of standard errors of parameters and hence potential find-ings of significance where not warranted.
Complex comparisons of multiple categories were undertaken with general linear modeling techniques in SAS. As BOOTVAR does not support such models vari-ance estimates are those resulting from the standard computations.
Regression estimates with dichotomous outcome variables (presence or absence of a chronic condition for example) were undertaken in SAS using logistic regression meth-ods. Bootstrap variance estimates were obtained and used
for significance testing.
Regression estimates for count data such as number of physician visits were conducted with general linear models in SAS PROC GENMOD using either Poisson or negative binomial distributions for the dependent variable, stan-dard techniques for analysing data that takes the form of counts.
These results are deliberately cautious. There is, in the first place, the problem of endogeneity, or reverse causal-ity. That is, low income may cause poor health, but poor health can also cause lower income. Simple associations, it is often argued, may therefore overstate the impact of income on health. However, other research has concluded that this is not a significant problem (Phipps, 2003).
Secondly, even though the gradients between health and income are frequently steepest at the lowest levels of income, the parameter estimates used are those that apply to the entire income distribution. If anything, this results in an understatement of the impacts. Equations tested with only those in the bottom quintile frequently resulted in much larger parameter estimates and hence suggest larger impacts. Unfortunately the estimates were not con-sistent or robust enough to allow estimates to be made on this basis due to sample size limitations.

Poverty is making us sick: A comprehensive survey of income and health in Canada | 21
TablesTable 1 Overview of health indicators (age-adjusted, per thousand population) Adults 18-64, Canada 2005By adjusted household income quintile
First (bottom) quintile Second Third Fourth
Fifth (top quintile)
Self-rated health:
Self-rated health (poor or fair, versus good, very good
or excellent )178**** 95**** 78**** 58**** 42
Self-rated mental health (poor or fair, versus good, very
good or excellent )97**** 49** 43**** 32*** 27
Chronic conditions:
Has a chronic condition 696**** 672 680 678** 665
> 2 chronic conditions 289**** 229*** 214** 200**** 177
Total number of chronic conditions 1,921**** 1,582** 1,513* 1,470**** 1,356
Disability:
Disability (Often has a participation or activity
limitation)87**** 36**** 30** 21 19
Disability days (over previous two weeks) 1,327**** 824 819 768 718
Stress and mental health:
Stress: Most days quite a bit or extremely stressful
versus not at all, not very or a bit stressful270**** 238** 252 262**** 295
Depression scale 0.67**** 0.45 0.42 0.41** 0.34
Weeks depressed 1,739**** 973 830 653 579
Notes:
Asterisks indicate statistical significance
from the next category above.
* - Significant at the .05 level
** - Significant at the .01 level
*** - Significant at the .001 level
**** - Significant at the < .0001 level

22 | Poverty is making us sick: A comprehensive survey of income and health in Canada
Table 2 Chronic Conditions (age-adjusted, per thousand population) Adults 18-64, Canada 2005
ConditionFirst (bottom)
quintileSecond Third Fourth Fifth
(top quintile)
Endocrine and metabolic conditions: 372 364 369 377* 365
Thyroid conditions 54 58**** 49 45* 39
Diabetes 53**** 38 38**** 29** 23
Food allergies 78* 70 75 75 78
Multiple chemical sensitivities 32**** 24 22 20**** 12
Other allergies 266 268 277**** 296 293
Circulatory conditions: 152* 142** 130**** 126*** 114
Effects of a stroke n/a n/a n/a n/a n/a
Heart disease 39**** 27 25 23** 18
High blood pressure 126 126*** 114 109** 101
Eye diseases: 27 24*** 18 20**** 12
Cataracts n/a n/a n/a n/a n/a
Glaucoma n/a n/a n/a n/a n/a
Nervous system and developmental disorders: 183**** 138 136** 124* 115
Learning disabilities 40**** 24 21*** 16 18
Epilepsy 12**** 5 5 4 3
Migraines 148**** 117 115 109** 98
Respiratory diseases 119**** 94 93 89 88
Chronic bronchitis 41**** 22 22*** 16* 13
Asthma 98**** 81 78 79 79
Musculoskeletal: 329**** 285**** 277* 265**** 240
Back problems (excluding arthritis or rheumatism) 229**** 198 192 189**** 173
Arthritis or rheumatism 167**** 138*** 125*** 111**** 93
Fibromyalgia 23**** 16 14** 10* 8
Chronic fatigue syndrome 24**** 13* 11*** 7 6
Mental and behavioural disorders: 146**** 90** 81 77**** 64
Anxiety 81**** 44 42 39 35
Mood disorders 105**** 64** 55 54**** 39
Alzheimer's or dementia n/a n/a n/a n/a n/a
Schizophrenia n/a n/a n/a n/a n/a
Miscellaneous: 110**** 87 84 80 75
Cancer 9 9 9 7 8
Ulcers 47**** 30 30** 25 24
Urinary incontinence 25** 21*** 16 16 13
Bowel disorder 45* 38* 43 42* 37
Other chronic condition 148**** 130* 120 126 128
Notes:
Asterisks indicate statistical significance
from the next category above.
* - Significant at the .05 level
** - Significant at the .01 level
*** - Significant at the .001 level
**** - Significant at the < .0001 level

Poverty is making us sick: A comprehensive survey of income and health in Canada | 23
Table 3 Access to, and utilization of health care services Rates per thousand, by adjusted household income quintile Adults 18-64, Canada 2005
First (Bottom quintile)
Second Third Fourth Fifth (top quintile)
Consultations with medical professionals:
Has no regular medical doctor 194**** 164** 150** 161 154
All medical consultations 10,543**** 8,664** 9,238 9,086 9,482
Number of consultations with general practitioner 3,985**** 2,917 2,847 2,736*** 2,514
Consultations with specialists 1,480**** 1,284 1,338 1,327*** 1,491
Consultations with other medical practitioners 5,115*** 4,478*** 5,068 5,019** 5,484
Nights as a patient 801**** 459 389 312 282
Has self-perceived unmet health care needs 161**** 122 122 124* 116
Reasons care not received:
Care not available at time required (*) 10.2% 14.4% 13.3% 15.4% 15.6%
Felt care would be inadequate (*) 4.0% 5.4% 3.7% 3.2% 2.3%
Cost (****) 17.0% 9.3% 6.0% 4.2% 4.0%
Didn't get around to it (*) 5.8% 8.3% 8.5% 9.5% 7.8%
Personal or family responsibilties (**) 1.5% 1.2% 2.0% 0.5% 0.2%
Transportation problems (Quintiles 4 and 5 collapsed under 4) (****)
3.2% 0.8% 0.9% 0.5%
Access to health insurance (Ontario only):
Prescription medications 548**** 722**** 810**** 866*** 883
Dental care 462**** 678**** 792**** 848*** 869
Eyeglasses or contact lenses 409**** 601**** 723**** 778*** 802
Hospital charges 325**** 611**** 717**** 797**** 838
Notes:
Asterisks indicate statistical significance
from the next category above.
* - Significant at the .05 level
** - Significant at the .01 level
*** - Significant at the .001 level
**** - Significant at the < .0001 level

24 | Poverty is making us sick: A comprehensive survey of income and health in Canada
Table 4 Variables used in multivariate analysis
Variable Concept
Income in $000 (adjusted for household size) Economic well-being, access to goods and services
Age (measured in 10 year increments)
Sex Gender
Visible minority Social status, culture
Aboriginal Social status, culture
Education Social status, literacy and access
Activity level Health behaviour
Smoking (daily smoker versus no) Health behaviour
Social assistance recipient (main source of income) Social status
Activity limitations (Often or sometimes has activity limitations)
Disability, injury, biology/genetic endowment
Province (Control variable for access and utilization equations only)

Poverty is making us sick: A comprehensive survey of income and health in Canada | 25
Table 5 Multivariate results for individual chronic conditions Adults 18-64, Canada 20051
Condition Impact associated with $1,000 change in income
Statistical significance2
Self-rated health and stress:
Self-rated health (Good, very good or excellent) 3,185 ****
Self-rated mental health (Good, very good or excellent) 1,545 ****
Stress (Most days 'Quite a bit' or 'Extremely' stressful) 2,257 ****
Depression (weeks depressed in past 12 months) -55,838 ****
Endocrine and metabolic conditions: 192 n.s.
Thyroid conditions -194 n.s.
Diabetes -889 ****
Food allergies 427 n.s.
Multiple chemical sensitivities -877 ****
Other allergies 833 *
Circulatory conditions: -522 n.s.
Heart disease -272 n.s.
High blood pressure -380 n.s.
Eye diseases: -329 **
Glaucoma -171 n.s.
Cataracts -186 *
Nervous system and developmental disorders: -109 **
Learning disabilities -206 n.s.
Migraines -861 **
Respiratory diseases: -251 n.s.
Chronic bronchitis -629 ***
Asthma -31 n.s.
Musculoskeletal: -1,585 ***
Back problems (excluding arthritis or rheumatism) -785 *
Arthritis or rheumatism -1,281 ***
Fibromyalgia -230 *
Chronic fatigue syndrome -381 **
Mental and behavioural disorders: -1,254 ****
Anxiety disorder -411 n.s
Mood disorders -995 ***
Miscellaneous: -425 n.s.
Cancer -7 n.s.
Ulcers -496 ***
Urinary incontinence -93 n.s.
Bowel disorder 33 n.s.
Other chronic conditions 418 n.s.
Other:
Has a chronic condition -271 n.s
Number of chronic conditions -9,521 ****
Disability days in past two weeks -6,577 ***
1 Controlling for the other variables in table 4. Complete results appear in Appendix C.
2 Statistical significance is indicated as follows: * p < .05 ** p < .01 *** p < .001 **** p < .0001

26 | Poverty is making us sick: A comprehensive survey of income and health in Canada
Table 6 Multivariate results for health care access and utilizationCanada, adults 18-64, 20051
Impact of $1,000 income Significance2
Has self-perceived unmet health care need (600.9) *
Has a regular medical doctor 965.0 **
Consultations with medical professionals:
All medical consultations 52,316.0 ****
Consultations with family doctor (24,684.4) ****
Consultations with medical specialists 15,923.1 ****
Consultations with other medical professionals3 46,555.9 ***
Nights as a patient in a hospital, nursing home or convalescent home (5,622.6) n.s.
Access to health insurance (Ontario only):
Prescription medications 13,819.0 ****
Dental insurance 15,818.6 ****
Eye glasses/contact lenses 13,436.6 ****
Hospital charges 19,474.5 ****
1 Controlling for the other variables in table 4. Complete results appear in Appendix D.
2 Statistical significance is indicated as follows: * p < .05 ** p < .01 *** p < .001 **** p < .0001
3 Includes nurses, dentists and/or orthodontists, chiropractor, physiotherapists, social worker or counsellor, psychologists, or speech, audiologists or occupational therapists.

Poverty is making us sick: A comprehensive survey of income and health in Canada | 27
ReferencesAdler, N. E., Boyce, W., Thomas, W. and Chesney, M. (1993). Socioeconomic inequalities in health: No easy solution. Journal of the American Medical Association, Vol. 269, No. 24, June, 3140-3145.
Allison, P. D. (1991). Logistic Regression Using the SAS System: Theory and Application. Cary, North Carolina: The SAS Institute.
Benzeval, M., Judge, K. and Whitehead, M. (1995). Tackling Inequalities in Health: An Agenda for Action. London, England: Kings Fund.
Braverman, P. A., et al. (2005). Socioeconomic status in Health Research : One size does not fit all. Journal of the American Medical Association, Vol. 294, No. 22.
Brazier, J.E., Harper, R., Jones N.M.B., et al. (1992). Validating the SF- 36 Health Survey Questionnaire: New outcome measure for primary care. British Medical Journal, 305: 160-4.
Creatore, M. I., Gozdyra, P., Booth, G., Ross, K., and Glazier, R. (2008). Socioeconomic status and diabetes. Institute for Clinical Evaluative Sciences, Diabetes in Toronto, Chapter 3.
Ecob, R. and Smith, G. D. (1999). Income and health: what is the nature of the nature of the relationship? Social Science and Medicine, vol. 48, 693-705.
Eikemo, T.A., Bambra, C., Joyce, K., and Dahl, E. (2008). Welfare state regimes and income-related health inequalities: a comparison of 23 European countries. The European Journal of Public Health, 18(6):593-599.
Ettner, S. L. (1996). New evidence on the relationship between income and health. Journal of Health Economics, 15, 67-85.
Feinstein, J.S. (1993). The relationship between socio-economic status and health: A review of the literature. Milbank Quarterly, 71: 279-322.
Green, D. A. and Milligan, K. (2007). Canada’s rich and poor: Moving in opposite directions. Ottawa: Canadian Centre for Policy Alternatives.
Lewchuk, W., de Wolff, A., King, A., and Polanyi, M. (2005). Beyond Job Strain: Employment Strain and the Health Effects of Precarious Employment. Work in a Global Society Working Paper Series, 2005-1, Hamilton: McMaster University, Labour Studies Program.
Lundberg, O. and Manderbacka, K. (1996). Assessing reliability of a measure of self-rated health. Scandinavian Journal of Social Medicine, 24(3): 218-24.
Marmot, M. G. (2006). Status syndrome: A challenge to medicine. Journal of the American Medical Association, Vol. 295, No. 11, March 15, 2006.
Mechanic, D. (2000). Rediscovering the Social Determinanats of Health. Health Affairs, May/June 2000, 269-276.
Mitchell, A. and Shillington, R. (2008). Are Statistics Canada’s Low-Income Cutoffs an absolute or relative poverty measure? How to reduce the poverty rate down from 64% to 5% without spending a penny. Canadian Social Research Links: www.canadiansocialresearch.net/licos.htm, June.
O’Brien C. S. (1997). Validity and reliability of self-reported health of persons aged 70 and older. Health Care for Women International, 18(2): 165-174.
OECD (2008). Income Distribution and Poverty in OECD Countries. Paris: Organisation of Economic Cooperation and Development.

28 | Poverty is making us sick: A comprehensive survey of income and health in Canada
Patten, S.B., Wang, J.L., Williams, J.V.A., Currie, S., Beck, C.A., Maxwell, C.J. & el-Guebaly, N. (2006). Descriptive epidemiology of major depression in Canada. Canadian Journal of Psychiatry, 51(2): 84-90.
Phipps, S. (2003). The Impact of Poverty on Health, a scan of the research literature. Ottawa: Canadian Institute for Health Information.
Pickett, K.E. and Pearl, M. (2001). Multilevel analysis of neighbourhood socioeconomic context and health outcomes: a critical review. Journal of Epidemiology and Community Health, vol. 55, 111-122.
Pritchett, L. and Summers, L. H. (1996). Wealthier is healthier. The Journal of Human Resources, Fall 1996, 31, 4, 841: 868.
Raphael, D. (2001). Inequality is Bad for our Hearts: Why Low Income and Social Exclusion are Major Causes of Heart Disease in Canada. Toronto: North York Heart Health Network. Online at http://www.yorku.ca/wellness/heart.pdf
Reutter, L. (2000). Socioeconomic determinants of health, in Community Nursing: Promoting Canadians’ Health, ed. M.J. Stewart. 2d ed. Toronto: W.B. Saunders.
Shields, M. and Shooshtari, S. (2001). Determinants of self-perceived health. Health Reports, 13(1): 35-52, Ottawa: Statistics Canada.
Shultz, S.E. and Kopec, J.A. (2003). Impact of chronic conditions. Health Reports, August 14 (4), 41-53.
Statistics Canada (2007). Incomes in Canada 2005. Statistics Canada catalogue no. 75-202, Ottawa: Ministry of Industry.

Poverty is making us sick: A comprehensive survey of income and health in Canada | 29
Endnotes1 The existence of a ‘health gradient’ – a clear relationship between income and health that exists at all income levels and
cannot simply be reduced to the difference between the ‘poor’ and ‘non-poor’ - is recognized and accepted
2 Statistics Canada, Labour Force Characteristics, www40.statcan.ca/l01/cst01/econ10.htm, accessed November 4, 2008.
3 www.socialwork.utoronto.ca/research/projects/sane.htm
4 The panel participants were not a random sample, and likely experienced worse health than other Ontario Works recipi-ents who exit welfare for employment after only a short spell on assistance. However, other research has confirmed wide-spread and serious health problems among social assistance recipients generally.
5 For example, see: World Health Organisation (2008), Closing the gap in a generation: Health equity through action on the social determinants of health, Final report of the commission on Social determinants of health, Geneva: World Health Organization.
6 Public Health Agency of Canada, What determines health? Accessed on-line at www.phac-aspc.gc.ca/ph-sp/determi-nants/index-eng.php#key_determinants, Ottawa: Health Canada.
7 All figures reported by quintile have been age-adjusted to account for the fact that younger people are more likely to be found in lower income groups.
8 Statistical significance refers to the chance that the outcome observed could have arisen by chance and does not reflect the true underlying relationship. For example, a significance of .001 means that there is a one-in-one thousand chance that the observed relationship is not the true relationship. A 95 percent significance level is a typical minimum standard. The statistical tests presented are in relation to the next adjacent category. In the case, the first quintile is statistically different from the second quintile, the second from the third and so on. Although not shown, this typically implies that all of the other paired combinations will also be statistically significant when the outcome changes monotonically – the first with the fifth, second with fourth etc. It will not necessarily be the case when the outcome does not change mono-tonically with income.
9 ‘Adjusted household income’ refers to household income adjusted for family size, in this case adjusted by dividing by the square root of household size. This is a standard method for comparing household incomes among households with differing numbers of members. Logically, economies of scale suggest that households with the same level of income but different numbers of members will not enjoy the same standard of living. See: Organisation for Economic Cooperation and Development (undated), What are Equivalence Scales? OECD Social Policy Division, www.oecd.org/dataoecd/61/52/35411111.pdf, Paris: OECD.
10 The Low Income Measure was used in preference to the Low-Income Cut-Off (LICO), the other frequently-used poverty measure in Canada. The CCHS does not contain the geographic information necessary to assign respondents to the appropriate income cut-off for the LICO. More importantly, the last rebasing of the LICOs, the process by which the lines are adjusted for changes in overall standards of living and consumption patterns took place in 1992, rendering the indicator less useful over time (see Mitchell and Shillington, 2008). The LIM is more easily updated and is a measure consistent with those used in international comparative research.
11 See Appendix B for a listing of chronic conditions available in the Canadian Community Health Survey, classified according to categories created by the World Health Organization under the International Classification of Diseases.
12 Even though the other adjacent quintiles were not different there were significant differences among other quintiles. For example the fifth quintile was not statistically different from the fourth, but was different from the first, second and third quintiles. Similarly the fourth is not different from the third, but was different from the first and second quintiles.

30 | Poverty is making us sick: A comprehensive survey of income and health in Canada
13 The categorization is drawn from the World Health Organization’s International Classification of Diseases. See Appendix B for details.
14 The CCHS requires that these be conditions diagnosed by a physician. Not all chronic conditions in the World Health Organization’s International Classification of Diseases are included in the CCHS.
15 The CCHS also asks respondents about emphysema and chronic obstructive pulmonary disease. However, it only asked these of respondents age 30 and over making it difficult to include these in the category.
16 Numbers for dementia and schizophrenia were too small to permit independent analysis.
17 It should be noted that while the apparent increase between the third and fourth quintiles is statistically significant, the difference between the fourth and fifth quintiles is not.
18 ‘Medical consultations’ includes both telephone consultations and in-person visits with general practitioners, eye specialists such as ophthalmologists and optometrists, other medical doctors, nurses, dentists and orthodontists, chi-ropractors and physiologists, social workers and counsellors, psychologists, and speech, audiology or occupational therapists.
19 The CCHS explored a range of reasons why care might not have been received including: care not available in area, care not available at time required, waiting time too long, respondent felt care would be inadequate, cost, too busy, respon-dent didn’t get around to it, respondent didn’t know where to go, personal or family responsibilities, transportation problems, respondent dislikes or is afraid of doctors, respondent decided not to seek care, and doctor didn’t think care was necessary. Although many of the reasons appear to be related to income, for the sake of brevity only those results that were statistically significant are presented. Additional information is available from the authors.
20 The data are all age-adjusted, as noted earlier.
21 See the methodological appendix for a discussion of these results.
22 The control variables in this section are identical with the exception of the addition of control variables for provinces.
23 The use of medical professionals other than general practitioners and specialists should also be related to the availabil-ity of health insurance. Unfortunately the data do not permit using these variables in our models as the survey only asked questions about health insurance of respondents in Ontario.
24 For information on the ICD-10: www.who.int/classifications/icd/en/

Poverty is making us sick: A comprehensive survey of income and health in Canada | 31
Appendix A: Summary of descriptive statisticsCanada, adults 18-64 | Source: Canadian Community Health Survey, cycle 3.1
Age groups:
18-24 15%
25-34 20%
35-44 25%
45-54 23%
55-64 17%
Average age (Years) 41
Percent female 50.1%
Province:
Newfoundland and Labrador 1.7%
Prince Edward Island 0.4%
Nova Scotia 2.9%
New Brunswick 2.3%
Quebec 24.0%
Ontario 39.0%
Manitoba 3.4%
Saskatchewan 2.8%
Alberta 10.1%
British Columbia 13.2%
Yukon, Northwest Territories and Nunavut 0.3%
Education:
Less than secondary school 11.9%
Completed secondary school 17.1%
Some post-secondary education 9.9%
Completed post-secondary education 61.1%
Family composition:
Single person 16.2%
Couple without children 23.1%
Couple with children 46.1%
Sole support parent 7.2%
Other family type 7.4%
Average household size 3.0
Disabillity/Activity limitations ('Often experiences an activity limitation) 11.8%
Visible minority or aboriginal 17.8%
Currently employed 77.3%
Average income (adjusted for family size)
First (bottom quintile) $14,154
Second $28,016
Third $39,419
Fourth $53,421
Fifth (top quintile) $92,779
Poverty (Using Low Income Measure - LIM): 13.2%

32 | Poverty is making us sick: A comprehensive survey of income and health in Canada
Appendix B: Categorization of chronic conditionsSource: World Health Organisation, International Classification of Diseases, www.who.int/classifications/icd/en/, Geneva: World Health Organisation.
CATEGORY CHRONIC CONDITIONS
Endocrine and metabolic Thyroid conditions
Diabetes
Food allergies
Multiple chemical sensitivities
Other allergies
Circulatory system Effects of a stroke
Heart disease
High blood pressure
Eye diseases Glaucoma
Cataracts
Nervous system and developmental disorders Dyslexia
Other learning disabilities
Attention deficit hyperactivity disorder
Attention deficit disorder (no hyperactivity)
Epilepsy
Migraines
Respiratory diseases Chronic bronchitis
Asthma
Musculoskeletal Back problems (excluding arthritis or rheumatism)
Arthritis or rheumatism
Fibromyalgia
Chronic fatigue syndrome
Mental and behavioural disorders Anxiety
Mood disorders
Alzheimer's or dementia
Schizophrenia
Miscellaneous Cancer
Ulcers
Urinary incontinence
Bowel disorder
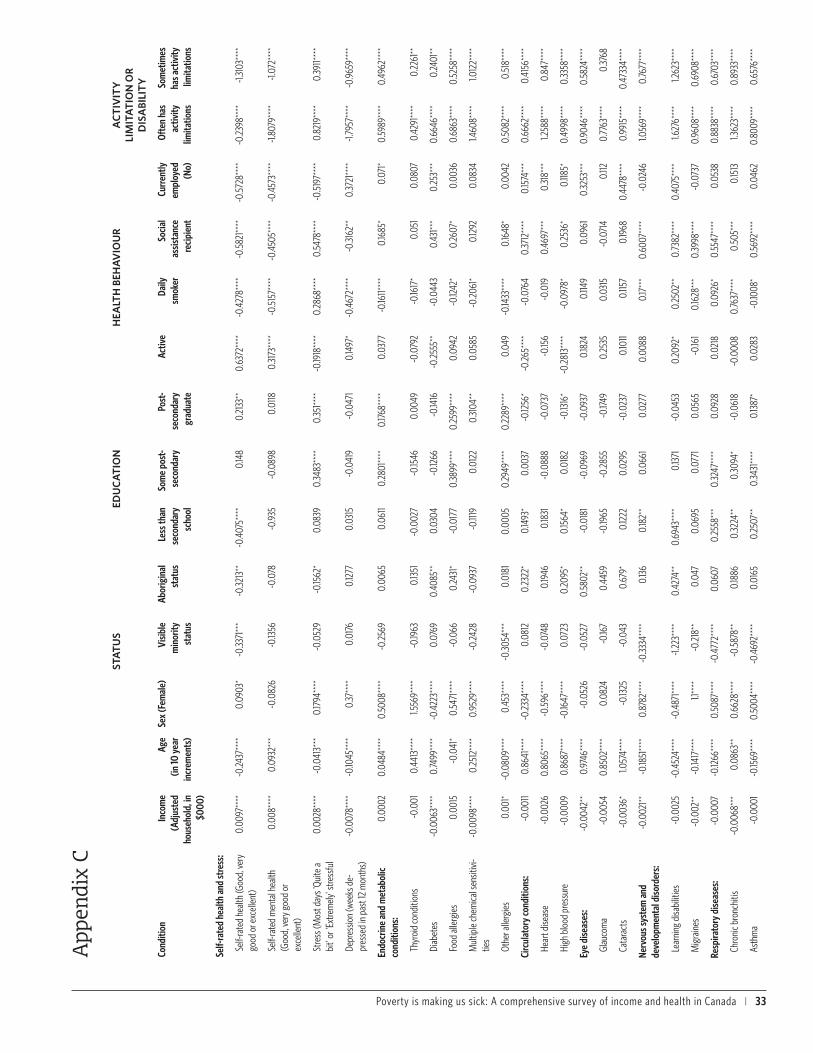
Poverty is making us sick: A comprehensive survey of income and health in Canada | 33
STA
TU
SED
UC
AT
ION
HEA
LTH
BEH
AV
IOU
RA
CT
IVIT
Y
LIM
ITA
TIO
N O
R
DIS
ABI
LIT
Y
Cond
ition
Inco
me
(Adj
uste
d ho
useh
old,
in
$000
)
Age
(in 10
yea
r in
crem
ents
)
Sex
(Fem
ale)
Visib
le
min
ority
st
atus
Abor
igin
al
stat
usLe
ss th
an
seco
ndar
y sc
hool
Som
e po
st-
seco
ndar
yPo
st-
seco
ndar
y gr
adua
te
Activ
eDa
ily
smok
erSo
cial
as
sista
nce
reci
pien
t
Curr
ently
em
ploy
ed
(No)
Ofte
n ha
s ac
tivity
lim
itatio
ns
Som
etim
es
has a
ctiv
ity
limita
tions
Self-
rate
d he
alth
and
stre
ss:
Self-
rate
d he
alth
(Goo
d, ve
ry
good
or e
xcel
lent
)0.
0097
****
-0.24
37**
**0.
0903
*-0
.3371
***
-0.32
13**
-0.4
075*
***
0.14
80.
2133
**0.
6372
****
-0.4
278*
***
-0.5
821**
**-0
.572
8***
*-0
.2398
****
-1.31
03**
**
Self-
rate
d m
enta
l hea
lth
(Goo
d, ve
ry g
ood
or
exce
llent
)
0.00
8***
*0.
0932
***
-0.0
826
-0.13
56-0
.078
-0.9
35-0
.089
80.
0118
0.31
73**
**-0
.515
7***
*-0
.450
5***
*-0
.457
3***
*-1.
8079
****
-1.07
2***
*
Stre
ss (M
ost d
ays '
Quite
a bi
t' or
'Ext
rem
ely'
stre
ssfu
l0.
0028
****
-0.0
413*
**0.
1794
****
-0.0
529
-0.15
62*
0.08
390.
3483
****
0.35
1****
-0.19
18**
**0.
2868
****
0.54
78**
**-0
.519
7***
*0.
8219
****
0.39
11***
*
Depr
essio
n (w
eeks
de-
pres
sed
in p
ast 1
2 m
onth
s)-0
.007
8***
*-0
.1045
****
0.37
****
0.01
760.
1277
0.03
15-0
.041
9-0
.047
10.
1497
*-0
.467
2***
*-0
.3162
**0.
3721
****
-1.79
57**
**-0
.965
9***
*
Endo
crin
e an
d m
etab
olic
co
nditi
ons:
0.00
020.
0484
****
0.50
08**
**-0
.2569
0.00
650.
0611
0.28
01**
**0.
1768
****
0.03
77-0
.1611*
***
0.16
85*
0.07
1*0.
5989
****
0.49
62**
**
Thyr
oid
cond
ition
s-0
.001
0.44
13**
**1.5
569*
***
-0.19
630.
1351
-0.0
027
-0.15
460.
0049
-0.0
792
-0.16
17*
0.05
10.
0807
0.42
91**
**0.
2261
**
Diab
etes
-0.0
063*
***
0.74
99**
**-0
.422
3***
*0.
0769
0.40
85**
0.03
04-0
.1266
-0.14
16-0
.2555
**-0
.044
30.
431**
*0.
253*
**0.
6646
****
0.24
01**
Food
alle
rgie
s0.
0015
-0.0
41*
0.54
71**
**-0
.066
0.24
31*
-0.0
177
0.38
99**
**0.
2599
****
0.09
42-0
.1242
*0.
2607
*0.
0036
0.68
63**
**0.
5258
****
Mul
tiple
chem
ical s
ensit
ivi-
ties
-0.0
098*
***
0.25
12**
**0.
9529
****
-0.24
28-0
.093
7-0
.1119
0.01
220.
3104
**0.
0585
-0.20
61*
0.12
920.
0834
1.460
8***
*1.0
122*
***
Othe
r alle
rgie
s0.
001*
-0.0
809*
***
0.45
3***
*-0
.3054
***
0.01
810.
0005
0.29
49**
**0.
2289
****
0.04
9-0
.1433
****
0.16
48*
0.00
420.
5082
****
0.51
8***
*
Circ
ulat
ory
cond
ition
s:-0
.001
10.
8641
****
-0.23
34**
**0.
0812
0.23
22*
0.14
93*
0.00
37-0
.1256
*-0
.265*
***
-0.0
764
0.37
12**
**0.
1574
***
0.66
62**
**0.
4156
****
Hear
t dise
ase
-0.0
026
0.80
65**
**-0
.596
****
-0.0
748
0.19
460.
1831
-0.0
888
-0.0
737
-0.15
6-0
.019
0.46
97**
*0.
318*
**1.2
588*
***
0.84
7***
*
High
blo
od p
ress
ure
-0.0
009
0.86
87**
**-0
.1647
****
0.07
230.
2095
*0.
1564
*0.
0182
-0.13
16*
-0.28
13**
**-0
.097
8*0.
2536
*0.
1185*
0.49
98**
**0.
3358
****
Eye
dise
ases
:-0
.004
2**
0.97
46**
**-0
.052
6-0
.052
70.
5802
**-0
.018
1-0
.096
9-0
.093
70.
1824
0.114
90.
0961
0.32
53**
*0.
9046
****
0.58
24**
**
Glau
com
a-0
.005
40.
8502
****
0.08
24-0
.167
0.44
59-0
.1965
-0.28
55-0
.1749
0.25
350.
0315
-0.0
714
0.112
0.77
63**
**0.
3768
Cata
ract
s-0
.003
6*1.0
574*
***
-0.13
25-0
.043
0.67
9*0.
1222
0.02
95-0
.023
70.
1011
0.115
70.
1968
0.44
78**
**0.
9915
****
0.47
334*
***
Nerv
ous s
yste
m a
nd
deve
lopm
enta
l diso
rder
s:-0
.002
1**-0
.1851
****
0.87
82**
**-0
.3334
****
0.13
60.
182*
*0.
0661
0.02
770.
0088
0.17
***
0.60
07**
**-0
.024
61.0
569*
***
0.76
77**
**
Lear
ning
disa
bilit
ies
-0.0
025
-0.4
524*
***
-0.4
871**
**-1.
223*
***
0.42
74**
0.69
43**
**0.
1371
-0.0
453
0.20
92*
0.25
02**
0.73
82**
**0.
4075
****
1.627
6***
*1.2
623*
***
Mig
rain
es-0
.002
**-0
.1417
****
1.1**
**-0
.218*
*0.
047
0.06
950.
0771
0.05
65-0
.161
0.16
28**
*0.
3998
****
-0.0
737
0.96
08**
**0.
6908
****
Resp
irato
ry d
iseas
es:
-0.0
007
-0.12
66**
**0.
5087
****
-0.4
772*
***
0.06
070.
2558
***
0.32
47**
**0.
0928
0.02
180.
0926
*0.
5547
****
0.05
380.
8838
****
0.67
03**
**
Chro
nic b
ronc
hitis
-0.0
068*
**0.
0863
**0.
6628
****
-0.5
878*
*0.
1886
0.32
24**
0.30
94*
-0.0
618
-0.0
008
0.76
37**
**0.
505*
**0.
1513
1.362
3***
*0.
8933
****
Asth
ma
-0.0
001
-0.15
69**
**0.
5004
****
-0.4
692*
***
0.01
650.
2507
**0.
3431
****
0.13
87*
0.02
83-0
.1008
*0.
5692
****
0.04
620.
8009
****
0.65
76**
**
App
endi
x C

34 | Poverty is making us sick: A comprehensive survey of income and health in Canada
Mus
culo
skel
etal
:-0
.001
9***
0.35
43**
**0.
2279
****
-0.30
08**
**0.
2095
**0.
1749*
**-0
.020
6-0
.091
3*-0
.018
0.22
32**
**0.
1671
*0.
1018
**1.7
934*
***
1.509
4***
*
Back
pro
blem
s (ex
cludi
ng
arth
ritis
or rh
eum
atism
)-0
.001
2*0.
1167*
***
-0.0
048
-0.21
7***
0.19
56*
0.16
28**
-0.0
217
-0.0
207
-0.0
496
0.23
01**
**0.
125
0.02
831.5
367*
***
1.319
6***
*
Arth
ritis
or rh
eum
atism
-0.0
028*
**0.
7364
****
0.53
57**
**-0
.426
6***
*0.
2263
*0.
1409
*-0
.0116
-0.19
27**
**0.
0349
0.20
82**
**0.
2545
**0.
1727
***
1.707
7***
*1.3
223*
***
Fibro
mya
lgia
-0.0
039*
0.36
67**
**1.4
438*
***
-0.21
98-0
.3086
-0.23
81-0
.453
2*0.
0709
-0.29
09*
0.17
230.
2547
0.41
21**
**2.2
977*
***
1.6114
****
Chro
nic f
atig
ue sy
ndro
me
-0.0
078*
*0.
1605
****
0.67
2***
*-0
.1296
-0.0
308
00.
2498
0.21
84-0
.2457
0.35
63**
0.41
91*
0.60
37**
**2.2
601**
**1.0
776*
***
Men
tal a
nd b
ehav
iour
al
diso
rder
s:-0
.003
7***
*-0
.062
8***
0.60
74**
**-0
.656
8***
*-0
.044
50.
0143
0.18
99*
0.110
3-0
.070
30.
4887
****
0.72
52**
**0.
4352
****
1.537
7***
*1.0
798*
***
Anxie
ty d
isord
ers
-0.0
022
-0.11
41**
**0.
5349
****
-0.72
63**
**-0
.058
20.
0814
0.13
880.
0601
0.00
040.
621**
**0.
6351
****
0.49
92**
**0.
6351
****
0.49
92**
**
Moo
d di
sord
ers
-0.0
041**
*-0
.061
4**
0.64
64**
**-0
.485
2***
*-0
.1264
-0.0
899
0.19
79*
0.12
84-0
.1862
**0.
4172
****
0.72
54**
**0.
4367
****
1.692
8***
*1.1
766*
***
Misc
ella
neou
s:-0
.001
30.
204*
***
0.57
81**
**-0
.423
****
0.27
88**
0.03
03-0
.0174
0.09
35-0
.1002
*0.
2164
****
0.32
63**
*0.
1777
***
1.282
9***
*0.
8005
****
Canc
er-0
.000
20.
6262
****
0.04
71-0
.689
5*0.
5377
-0.4
168*
-0.5
636*
-0.33
23-0
.1845
-0.0
068
0.00
50.
3512
**1.2
3***
*0.
7462
****
Ulce
rs-0
.004
***
0.10
71**
*-0
.044
40.
0549
0.43
55**
0.43
38**
*0.
0556
0.22
69*
-0.0
305
0.46
03**
**0.
425*
**0.
163*
1.182
9***
*0.
6251
****
Urin
ary i
ncon
tinen
ce-0
.001
30.
6077
****
1.176
3***
*-0
.014
90.
2942
0.12
640.
2363
0.09
48-0
.1074
0.25
62*
0.24
570.
1849
1.515
7***
*0.
8823
****
Bow
el d
isord
er0.
0002
0.05
79**
0.88
41**
**-1.
0702
****
-0.0
287
-0.31
68**
0.00
890.
1242
-0.19
52**
0.06
940.
2334
0.16
29**
1.243
7***
*0.
8438
****
Othe
r chr
onic
cond
ition
s0.
0009
0.19
26**
**0.
0336
-0.34
76**
**0.
0442
-0.0
281
0.24
98**
*0.
2364
****
-0.10
39*
-0.0
469
0.19
03*
0.19
89**
**1.5
331**
**1.0
054*
***
Othe
r:
Has a
chro
nic c
ondi
tion
-0.0
003
0.26
5***
*0.
4265
****
-0.4
263*
***
0.03
50.
1647
**0.
1846
**0.
0687
-0.0
282
-0.0
170.
3268
**0.
1154*
*1.7
067*
***
1.533
1****
Num
ber o
f chr
onic
cond
i-tio
ns-0
.001
2***
*0.
1431
****
0.34
15**
**0.
2403
****
-0.0
446*
-0.0
68**
**-0
.1083
****
-0.0
562*
***
0.03
71**
**-0
.057
5***
*-0
.2853
****
0.13
75**
**-0
.9294
****
-0.6
72**
**
Disa
bilit
y day
s in
past
two
wee
ks-0
.001
2**
-0.0
447*
***
0.25
98**
**0.
2226
****
-0.0
746
0.04
45-0
.091
3*-0
.063
6*0.
0422
-0.19
74**
**-0
.2216
****
0.33
16**
**-0
.1825
6***
*-0
.867
7***
*
1 St
atist
ical s
igni
fican
ce is
in
dica
ted
as fo
llow
s:
*
p <
.05
**
p <
.01
***
p <
.001
***
* p <
.000
1

Poverty is making us sick: A comprehensive survey of income and health in Canada | 35
App
endi
x D
: Mul
tiva
riat
e re
sult
s fo
r he
alth
car
e ac
cess
and
uti
lizat
ion
Can
ada,
adu
lts 1
8-6
4 |
Para
met
er e
stim
ates
2
STAT
USED
UCAT
ION
HEAL
TH B
EHAV
IOUR
ACTI
VITY
LIM
ITAT
ION
OR
DISA
BILI
TY
Inco
me
(Adj
uste
d ho
useh
old,
in
$000
)
Age
(in 10
year
in
crem
ents
)
Sex
(Fem
ale)
Visib
le
min
ority
st
atus
(No)
Abor
igin
al st
atus
(No)
Less
than
se
cond
ary
scho
ol (N
o)
Som
e po
st-se
cond
ary
(No)
Post-
se
cond
ary
grad
uate
(No)
Activ
e (N
o)Da
ily sm
oker
(N
o)So
cial
assis
tanc
e re
cipie
nt (N
o)
Curre
ntly
empl
oyed
(N
o)
Ofte
n ha
s ac
tivity
lim
itatio
ns
Som
etim
es
has a
ctivi
ty
limita
tions
Has s
elf-p
erce
ived
unm
et h
ealth
ca
re n
eed
-0.0
013*
-0.17
34**
**0.
3478
****
0.03
520.
1214
-0.16
81*
0.30
85**
*0.
3301
****
-0.0
032
0.31
13**
**0.
3611*
**-0
.042
41.4
941**
**0.
9433
****
Has a
regu
lar m
edic
al d
octo
r0.
0017
**0.
3887
****
0.77
46**
**-0
.088
4-0
.2952
***
-0.0
091
-0.0
501
-0.16
32**
*0.
0436
-0.4
187*
***
-0.23
37*
-0.0
373
0.38
02**
**0.
2371
****
Cons
ulta
tions
with
med
ical
pr
ofes
siona
ls:
All m
edica
l con
sulta
tions
0.00
12**
**-0
.023
7***
*0.
3539
****
0.17
97**
**-0
.024
70.
0655
11**
-0.0
416
-0.10
23**
**-0
.018
90.
0605
****
-0.31
05**
**0.
0982
****
-1.05
73**
**-0
.574
1****
Cons
ulta
tions
with
fam
ily d
octo
r-0
.001
5***
*-0
.015
7**
0.39
97**
**-0
.014
5-0
.1003
**-0
.040
50.
0046
-0.0
096
0.05
52**
*-0
.002
5-0
.3313
****
0.19
84**
**-0
.891
2***
*-0
.463
2***
*
Cons
ulta
tions
with
med
ical
spec
ialist
s0.
0026
****
-0.0
028
0.50
4***
*0.
0911*
*0.
1081
0.10
74**
-0.17
04**
**-0
.2359
****
0.04
530.
1486
****
-0.25
15**
**0.
2638
****
-1.03
83**
**-0
.512
****
Cons
ulta
tions
with
oth
er m
edi-
cal p
rofe
ssio
nals1
0.00
22**
**-0
.036
9***
*0.
2839
****
0.36
18**
**0.
0018
0.14
12**
*-0
.061
1-0
.1382
****
-0.0
818*
**0.
0666
**-0
.3212
****
-0.0
084
-1.16
08**
**-0
.664
8***
*
Nigh
ts a
s a p
atie
nt in
a h
ospi
tal,
nurs
ing
hom
e or
conv
ales
cent
ho
me
-0.0
017
0.00
660.
448*
***
0.23
35*
-0.29
93-0
.1317
0.13
81-0
.086
50.
0433
-0.10
92-0
.694
2**
0.69
54**
**-1.
8084
****
-0.8
235*
***
Acce
ss to
hea
lth in
sura
nce
(Ont
ario
onl
y):
Pres
crip
tion
med
icatio
ns0.
0195
****
0.12
71**
**0.
0957
-0.31
73**
**0.
1007
-0.26
97**
0.30
18**
0.10
68-0
.686
-0.25
9***
*1.2
858*
***
-0.25
***
0.24
78**
0.19
41**
Dent
al in
sura
nce
0.02
04**
**0.
0351
0.05
9-0
.2495
***
0.18
82-0
.3055
***
0.19
430.
0778
-0.0
85-0
.2455
****
0.76
31**
**-0
.461
1****
0.14
97*
0.10
69
Eye
glas
ses/
cont
act l
ense
s0.
015*
***
0.08
56**
**0.
0442
-0.32
36**
**0.
2493
-0.19
22*
0.10
110.
0773
-0.0
469
-0.25
93**
**1.0
149*
***
-0.28
05**
**0.
1438
*0.
1283
*
Hosp
ital c
harg
es0.
0218
****
0.15
99**
**0.
1195*
*-0
.3836
****
0.20
56-0
.2938
***
0.13
410.
1276
-0.0
047
-0.24
11***
*-0
.7235
***
-0.4
191**
**0.
0613
0.10
07
1 In
clude
s nur
ses,
dent
ists a
nd/o
r orth
odon
tists
, chi
ropr
acto
r, phy
sioth
erap
ists,
socia
l wor
kers
or c
ouns
ello
rs, p
sych
olog
ists,
or sp
eech
, aud
iolo
gist
s or
occu
patio
nal t
hera
pist
s.2
Sta
tistic
al sig
nific
ance
is in
dica
ted
as fo
llow
s: *
p
< .0
5 *
* p
< .0
1 *
** p
< .0
01 *
*** p
< .0
001

36 | Poverty is making us sick: A comprehensive survey of income and health in Canada
App
endi
x D
: Mul
tiva
riat
e re
sult
s fo
r he
alth
car
e ac
cess
and
uti
lizat
ion
cont
’dC
anad
a, a
dults
18
-64
| Pa
ram
eter
est
imat
es 2
New
foun
dlan
d an
d La
brad
orP.E
.I.No
va S
cotia
New
Bru
nsw
ickQu
ebec
Onta
rioM
anito
baSa
skat
chew
an
(refe
renc
e ca
tego
ry)
Albe
rtaBr
itish
Col
umbi
aYu
kon,
Nor
thw
est
Terri
torie
s and
Nu
navu
t
Impa
ct o
f $1,0
00
inco
me
Has s
elf-p
erce
ived
unm
et h
ealth
ca
re n
eed
0.09
220.
485*
*0.
0067
0.16
460.
4235
****
0.27
52**
0.39
64**
*n/
a0.
0535
0.25
06**
0.58
54**
**-6
00.9
3413
62
Has a
regu
lar m
edic
al d
octo
r0.
285*
*0.
5257
***
1.069
****
0.96
86**
**-0
.685
9***
*0.
6055
****
-0.0
303
n/a
-0.17
7*0.
2862
***
-1.41
35**
**96
5.04
3596
7
Cons
ulta
tions
with
med
ical
pr
ofes
siona
ls:
All m
edica
l con
sulta
tions
-0.14
09*
-0.0
767
-0.0
595
-0.19
25**
*-0
.1185
**0.
1266
***
0.17
37**
*n/
a0.
0495
0.06
24-0
.1256
5231
5.967
44
Cons
ulta
tions
with
fam
ily d
octo
r-0
.013
2-0
.052
2-0
.048
4-0
.2178
****
-0.5
119**
**-0
.1001
**-0
.126*
*n/
a-0
.059
40.
0657
-0.21
15*
-246
84.37
356
Cons
ulta
tions
with
med
ical
spec
ialist
s-0
.2024
*0.
084
0.00
55-0
.090
40.
0745
0.14
3**
0.09
07n/
a-0
.1153
-0.0
803
-0.29
43*
1592
3.112
88
Cons
ulta
tions
with
oth
er m
edi-
cal p
rofe
ssio
nals1
-0.30
39**
*-0
.1878
-0.11
8-0
.2337
**0.
0442
0.25
68**
**0.
3515
****
n/a
0.16
27**
0.06
910.
0117
4655
5.85
81
Nigh
ts a
s a p
atie
nt in
a h
ospi
tal,
nurs
ing
hom
e or
conv
ales
cent
ho
me
-0.55
990.
0922
-0.4
25-0
.086
1-0
.1874
-0.24
63-0
.2717
n/a
-0.28
98-0
.566
2-0
.145*
-562
2.643
457
Acce
ss to
hea
lth in
sura
nce
(Ont
ario
onl
y):
Pres
crip
tion
med
icatio
ns-
--
--
--
--
--
1381
9.03
177
Dent
al in
sura
nce
--
--
--
--
--
-15
818.
5698
2
Eye
glas
ses/
cont
act l
ense
s-
--
--
--
--
--
1343
6.58
257
Hosp
ital c
harg
es-
--
--
--
--
--
1947
4.45
067
1 In
clude
s nur
ses,
dent
ists a
nd/o
r orth
odon
tists
, chi
ropr
acto
r, phy
sioth
erap
ists,
socia
l wor
kers
or c
ouns
ello
rs, p
sych
olog
ists,
or sp
eech
, aud
iolo
gist
s or o
ccup
atio
nal t
hera
pist
s.2
Sta
tistic
al sig
nific
ance
is in
dica
ted
as fo
llow
s: *
p
< .0
5 *
* p
< .0
1 *
** p
< .0
01 *
*** p
< .0
001