
A COMPREHENSIVE REVIEW OF ACOUSTO...
21
A COMPREHENSIVE REVIEW OF ACOUSTO ULTRASONIC-ECHO (AU-E) TECHNIQUE FOR FURNACE REFRACTORY LINING ASSESSMENT *A. Sadri 1 , W. L. Ying 1 , P. Gebski 1 , P. Szyplinski 1 , T. Goff 2 and B. van Beek 2 1 Hatch Ltd. 2800 Speakman Drive Mississauga, Canada L5K 2R7 (Corresponding author: [email protected]) 2 Lonmin Platinum Private Bag X508 Marikana 0284 South Africa ABSTRACT Monitoring the refractory lining integrity is essential to assure the safety of the operators and to determine the remaining campaign life of a furnace. Early detection of refractory lining degradation is essential to avoid sudden furnace failures and prevent unscheduled shutdowns. In mid-1990s a stress wave propagation technique was developed and since then is has been utilized by Hatch Non-Destructive Testing (NDT) Group to evaluate furnace linings. For the last 17 years the AU-E technique evolved in terms of hardware, software and signal acquisition and interpretation. Most importantly, based on more than a decade of commercial applications, an extensive database of various failure modes, refractory deterioration trends and material properties has been created. This knowledge base is an integral part of AU-E which progressed from a NDT technique towards a comprehensive approach for furnace condition monitoring. All of the improvements introduced over the last several years have greatly improved the accuracy of the measurements. The data analysis process has also become more time efficient making the critical results available to the furnace operators in a more timely manner. Today the AU-E technology is used on a variety of process vessels in non-ferrous, glass, chemical and iron and steel industries. In this paper we are reviewing the available techniques for furnace refractory lining measurement and discussing the pros and cons of each method. The need for continuous improvement and development of new techniques for refractory monitoring is also emphasized. Finally, we are presenting a number of case studies and comparisons between the physical verifications and the AU-E measurements. KEYWORDS Non-Destructive Testing (NDT), process vessels, integrity monitoring, maintenance, refractory, acoustic, ultrasonic, Acousto Ultrasonic-Echo (AU-E), impact-echo, furnace, smelters
Transcript of A COMPREHENSIVE REVIEW OF ACOUSTO...
A COMPREHENSIVE REVIEW OF ACOUSTO ULTRASONIC-ECHO (AU-E) TECHNIQUE FOR
FURNACE REFRACTORY LINING ASSESSMENT
*A. Sadri1, W. L. Ying1, P. Gebski1, P. Szyplinski1, T. Goff2 and B. van Beek2
1Hatch Ltd.
2800 Speakman Drive
Mississauga, Canada L5K 2R7
(Corresponding author: [email protected])
2Lonmin Platinum
Private Bag X508
Marikana 0284
South Africa
ABSTRACT
Monitoring the refractory lining integrity is essential to assure the safety of the operators and to determine
the remaining campaign life of a furnace. Early detection of refractory lining degradation is essential to avoid sudden
furnace failures and prevent unscheduled shutdowns. In mid-1990s a stress wave propagation technique was
developed and since then is has been utilized by Hatch Non-Destructive Testing (NDT) Group to evaluate furnace
linings. For the last 17 years the AU-E technique evolved in terms of hardware, software and signal acquisition and
interpretation. Most importantly, based on more than a decade of commercial applications, an extensive database of
various failure modes, refractory deterioration trends and material properties has been created. This knowledge base
is an integral part of AU-E which progressed from a NDT technique towards a comprehensive approach for furnace
condition monitoring. All of the improvements introduced over the last several years have greatly improved the
accuracy of the measurements. The data analysis process has also become more time efficient making the critical
results available to the furnace operators in a more timely manner. Today the AU-E technology is used on a variety
of process vessels in non-ferrous, glass, chemical and iron and steel industries.
In this paper we are reviewing the available techniques for furnace refractory lining measurement and
discussing the pros and cons of each method. The need for continuous improvement and development of new
techniques for refractory monitoring is also emphasized. Finally, we are presenting a number of case studies and
comparisons between the physical verifications and the AU-E measurements.
KEYWORDS
Non-Destructive Testing (NDT), process vessels, integrity monitoring, maintenance, refractory, acoustic,
ultrasonic, Acousto Ultrasonic-Echo (AU-E), impact-echo, furnace, smelters
INTRODUCTION
Refractory linings in metallurgical furnaces undergo deterioration and wear over time. The deterioration is
caused mainly by mechanical and thermal stress cracks and chemical attack resulting in loss of heat transfer capability,
shrinkage and change of thermal conductivity for the refractories. Deterioration starts immediately after the start up
and progress continuously, however, we have examples of spalling refractory that appears to break abruptly in chunks.
The degree and mechanism of deterioration depends on many different factors over the huge range of metallurgical
furnaces but certainly varies by zones within the same vessel. Failure of the lining is dangerous and could affect the
structural integrity of the furnace. Rebuilding after a sudden failure is expensive in terms of lost production, man
hours, and materials.
Non-destructive Testing (NDT) and monitoring of the refractory lining leads to better safety, longer campaign
life, production optimization, scheduled maintenance and reduced costs of production. Accurate thickness
measurement and monitoring of the refractory lining in operating furnaces is possible using acousto ultrasonic-echo
(AU-E) technique. This technique uses stress waves of both acoustic and ultrasonic ranges in order to penetrate into
various layers of refractory lining. The lining thickness and integrity can be determined by the patterns of reflected
waves.
The AU-E technology was invented in 1998 to help a client to monitor the formation of excessive build-up
in their flash furnace hearth. For the last 17 years we have inspected and monitored a large t number of furnaces and
process vessels around the world. The AU-E technology has gone through an impressive evolution and transformation
since it was innovated mainly because of the need for more accurate, repeatable, rapid and reliable results to assist in
better interpretation and faster delivery of the results.
REFRACTORY
Refractory materials are designed to be physically and chemically stable at high temperatures (above 500oC)
[1] and are used in linings for furnaces, kilns, ladles, reactors, converters and other types of high temperature vessels.
Depending on the operating environment, refractories need to be resistant to thermal shock, be chemically inert, and/or
have specific ranges of thermal conductivity and/or coefficient of thermal expansion. The particular process dictates
the specific design of the refractories. For example, blast furnaces hearths are lined with carbon and graphite
refractories because of their high heat conductivity but the stack is lined with silica carbide based refractories to resist
the abrasion due to movement of coke and pellets in that area. Refractory can corrode or wear thin, it can be
impregnated by slag/metal, or it can change chemically in other ways.
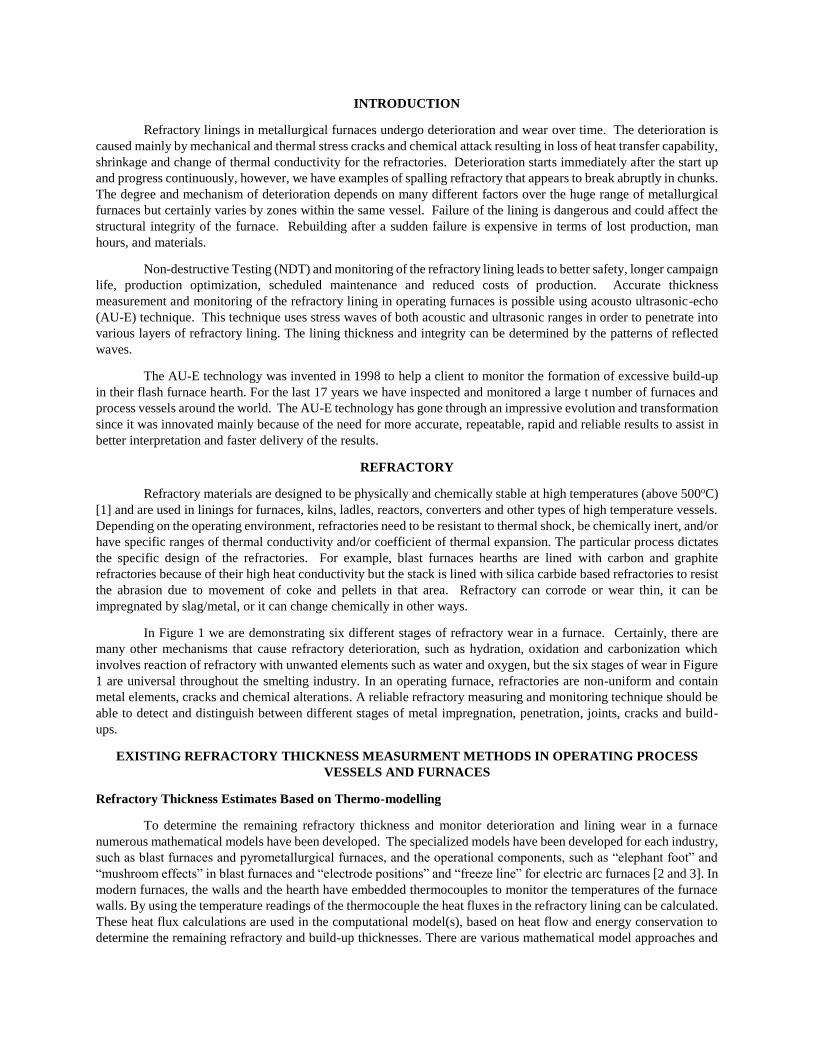
In Figure 1 we are demonstrating six different stages of refractory wear in a furnace. Certainly, there are
many other mechanisms that cause refractory deterioration, such as hydration, oxidation and carbonization which
involves reaction of refractory with unwanted elements such as water and oxygen, but the six stages of wear in Figure
1 are universal throughout the smelting industry. In an operating furnace, refractories are non-uniform and contain
metal elements, cracks and chemical alterations. A reliable refractory measuring and monitoring technique should be
able to detect and distinguish between different stages of metal impregnation, penetration, joints, cracks and build-
ups.
EXISTING REFRACTORY THICKNESS MEASURMENT METHODS IN OPERATING PROCESS
VESSELS AND FURNACES
Refractory Thickness Estimates Based on Thermo-modelling
To determine the remaining refractory thickness and monitor deterioration and lining wear in a furnace
numerous mathematical models have been developed. The specialized models have been developed for each industry,
such as blast furnaces and pyrometallurgical furnaces, and the operational components, such as “elephant foot” and
“mushroom effects” in blast furnaces and “electrode positions” and “freeze line” for electric arc furnaces [2 and 3]. In
modern furnaces, the walls and the hearth have embedded thermocouples to monitor the temperatures of the furnace
walls. By using the temperature readings of the thermocouple the heat fluxes in the refractory lining can be calculated.
These heat flux calculations are used in the computational model(s), based on heat flow and energy conservation to
determine the remaining refractory and build-up thicknesses. There are various mathematical model approaches and
numerous types of thermocouple that are used to make refractory wear calculations. The models are as good as the
accuracy of the assumptions and coefficients. Also the models heavily relay on the quantity of the installed
thermocouples and their distribution in the furnace structure.
Figure 1 - Different stages of refractory deterioration in an operating furnace
Refractory thickness monitoring by use of thermocouples and mathematical and thermal models is essential
and part of the operator’s routine task. However, due to limitations in the effective range of the thermocouples and
multivariable assumptions for the mathematical models, it is important to use other means of “non-intrusive”
techniques to determine the refractory wear profile in operating furnaces. In addition, refractory wear monitoring by
mathematical modeling techniques are not able to distinguish between various defects that are demonstrated in Figure
1. The following sections briefly describe the more direct, nondestructive and non-intrusive refractory measuring and
monitoring techniques.
Radioactive Tracers
Radioactive tracers have been used for determining refractory thickness in converters, glass furnaces and
blast furnaces since the 1960s. All of the published literature is about the use of tracers in blast furnaces [4, 5, 6, 7,
and 8] and there is no record of using radioactive tracers in other types of process vessels. In this method radioactive
isotope tracers with short half-life are introduced to the blast furnace at the top of the furnace. As the tracer moves
downward with the burden, the receiver or isotope’s tracer counter counts the radiation that passes through the build-
up, refractory and the shell. In an ideal theoretical situation, where quality of the refractory is the same throughout
the furnace and shell thickness is uniform, the increase in radiation count indicates a thinner and more worn refractory
lining. However, blast furnace linings are far from uniform and several types of refractories with different densities
and material properties are utilized in the lining. In addition the presence of staves and plates for cooling purposes
adds to the complexity of the lining. Therefore the fluctuation in radiation counts do not necessarily indicate changes
in refractory thickness. The presence and thickness of accretion, impregnation of molten metal/slag in the refractory
and quality variation of refractory have an effect on the radiation counts.
A literature review on the use of radioactive tracers shows the use of 40La, 192Ir and 60Co isotope for lining
thickness measurements 4, 5, 6, 7, and 8]. In addition to radiation exposure another issue with radioactive tracers is
their highly toxic nature that may cause health hazards to the operators.
Infrared (IR) Thermography
The infrared (IR) thermography is the most common NDT technique used for determining hotspots and
troubled areas. In the recent years a large variety of systems have been available commercially with a broad range of
image resolutions and prices. The IR camera provides a thermal image showing the temperature of the object on a
color scale where the darker colors are cooler and the lighter areas are hot spots. Temperature differences on the
surface, may be related to the subsurface defects, which can be located from the thermal images.
Furnaces and converters have a steel shell which oxidizes over time. The steel shell rusting will affect the
surface emissivity of the vessel which results in inaccuracies in the IR thermography measurements [8]. In addition,
gaps, cracks and looseness of the refractory bonding will affect the results. Nearby heat sources and reflections from
nearby objects also affect the IR thermography data [10].
For the above mentioned reasons IR thermography is mainly used for rough estimates and the thermal images
must be carefully collected under the same conditions for comparison purposes. In 2008, Hatch has developed a
methodology to use IR thermography to measure the refractory thickness in single layered hollow cylindrical vessels
such as converters and reactors [11]. This method uses a thermal model of the converter and the thermographic image
of the converter’s outer surface to calculate the refractory thicknesses at the inspected spots.
Electromagnetic (EM) / Microwave Techniques
Microwave and radar systems have successfully been used for determining refractory thickness prior to their
installation. The change in dielectric constant or the change in ability of the medium to transfer electricity causes the
EM waves to reflect back from an interface [12]. This property enables the EM waves to be used for measuring
refractory lining thicknesses. However, most of the process vessels have external steel shells and EM waves cannot
pass through the steel shell and into the lining. In isolated cases where part of the furnace lining is exposed and
antennas can be placed directly against the refractory wall or hearth the data can be collected. Never the less, presence
of support and grillage beams or any metallic object in close vicinity of the radar antenna will cause signal phase
distraction and which may result in false signal interpretations. If metal penetration between brick layers is present
then radar will not be able to measure beyond this interface.
The commercial short-pulse radars use the 500 MHz- 1GHz range of the FM spectrum. The useful frequency
range for measuring refractory lining is between 500 MHz to 1 GHz hence the commercially available radar systems
are within the desired frequencies. The frequency is critical when dealing with different type of materials and
structures. Ground Probing Radar (GPR) is commonly used in non-destructive testing of concrete and masonry
structures. For these standard applications it produces multiple results, including thickness of the structure, location
of voids or inclusions, and location of rebar in reinforced structures.
Hatch NDT Group has utilized the GPR to measure refractory thickness in electric furnaces. We used high
frequency radars to be able to measure the brick wall and roof thickness in several furnaces. The measurements were
done from outside where there was no shell and the refractory lining was exposed. Although this approach was
successful, it requires special care as it cannot be applied at any furnace.
In addition to impulse radar systems such as GPR, Frequency Modulated Continuous-Wave Radar (FM-CW),
which uses a triangular waveform to modulate the frequency of an oscillator, was also used in laboratory condition
for detection of refractory wear in glass furnaces with limited success [13].
The EM signals are not very sensitive to refractory/air interfaces therefore voids and gaps cannot be detected
in the lining. The air gaps between the refractories cause signal attenuation and reduce the signal-to-noise ratio. The
refractory/metal interface will cause EM waveform reflections, hence metal impregnation into the brick, metal
penetration in between the lining courses and presence of accretion or build-up will affect the accuracies. In addition,
the dielectric constant of the refractories changes at high temperature which requires a correction factor if EM
techniques are going to be used for refractory thickness measurements.
In metal processing vessels, the GPR and microwave systems cannot be used for postmortem study of the
furnace lining condition because of heavy presence of metals inside the furnace and within the matrix of the refractory
lining, which causes signal attenuation and distortion.
Ultrasonic
Low frequency “Ultrasonic Pulse Velocity” (UPV) systems such as PUNDIT and V-Meter have been used
to determine refractory quality since Mid-80s. Using the UPV systems, a refractory with known thickness is placed
between a transmitting and receiving transducer which are at opposite ends of the refractory sample. A low frequency
“Ultrasonic Through Transmission” (UTT) system with frequencies between 20 to 200 kHz is used to determine time
of flight between the transmitter and receiver. Generally, high ultrasonic wave speed indicate low porosity, high
density and high modulus of elasticity. “Ultrasonic Pulse-Echo” (UPE) systems are required to measure refractory
thickness on an operating furnace. In UPE systems the transmitting and receiving transducers are placed on the same
surface. The distance between the transmitting and receiving transducers should be minimal. Parker et al. [14]
demonstrated that the refractory/molten metal interface creates a distinguished reflection surface because the acoustic
impedance in liquid is typically 13-15% less than for a solid refractory or accretion which means that at least 10% of
the waves are reflecting from the wall. In their paper they demonstrated that a large amount of ultrasonic energy
attenuates within the solid refractory because of temperature and porosity. A decrease in the amplitude of reflected
ultrasonic signals was noted as the sample was heated to higher temperatures. Temperature also affects the travel path
of an ultrasonic waveform in solid [15]. As the temperature increases the longitudinal or P-wave path widens which
results in higher attenuation and a change in the reflection angle.
For measuring refractory thickness wear in furnaces conventional ultrasound is not an option. A conventional
ultrasonic system uses single frequency transducers with fixed and narrow bandwidths. An ultrasonic system with a
“sweep frequency” pulse generator and broad band transducers was developed by Hatch NDT Group to determine
stave thicknesses in blast furnaces. This Low Frequency Pulse Ultrasonic (LFPU) is a pulse-echo system that is
capable of measuring stave thicknesses with a 2 mm precession. The multi-frequency ultrasonic pulses can travel into
different layers of blast furnace wall and measure accretion and refractory at the tip of the stave. Even though the
LFPU was proven to be accurate for blast furnace stave thickness measurements [16], the system has not been used
on thicker furnace refractories. The authors believe that the LFPU could be successfully implemented for refractory
wall thickness measurements of less than 300 mm thick. In the near future LFPU will be tried on furnace sidewalls
and the results will be published by Hatch NDT Group.
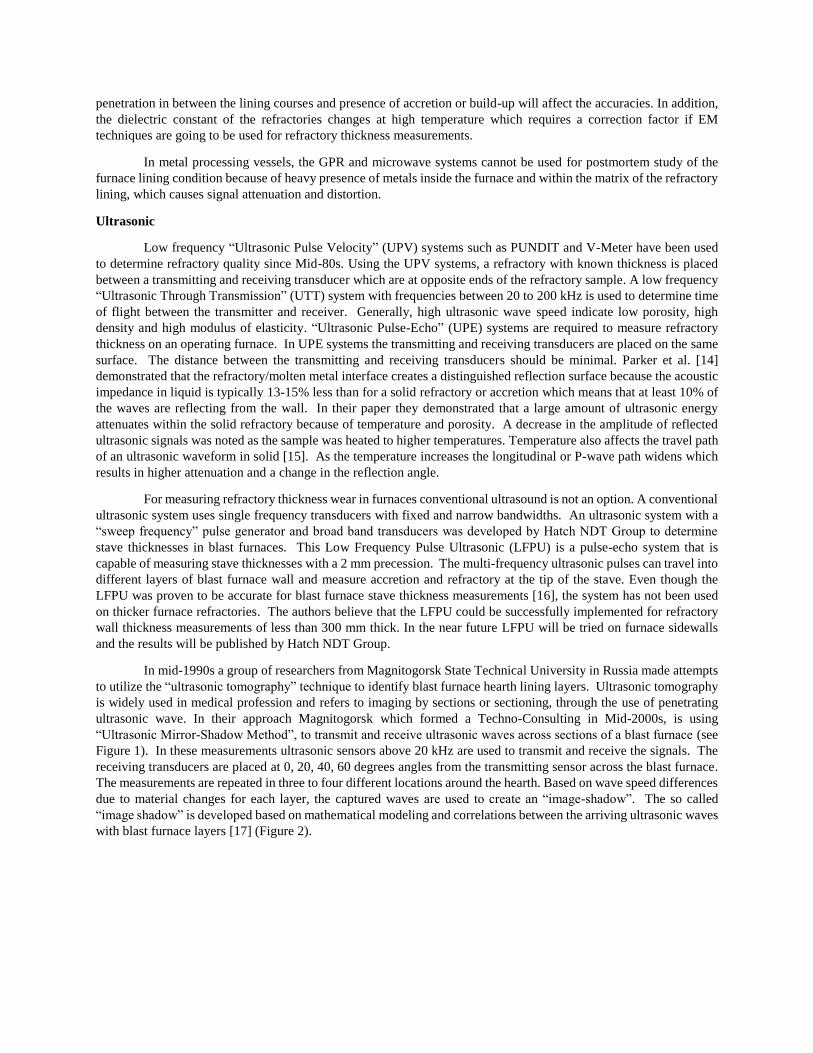
In mid-1990s a group of researchers from Magnitogorsk State Technical University in Russia made attempts
to utilize the “ultrasonic tomography” technique to identify blast furnace hearth lining layers. Ultrasonic tomography
is widely used in medical profession and refers to imaging by sections or sectioning, through the use of penetrating
ultrasonic wave. In their approach Magnitogorsk which formed a Techno-Consulting in Mid-2000s, is using
“Ultrasonic Mirror-Shadow Method”, to transmit and receive ultrasonic waves across sections of a blast furnace (see
Figure 1). In these measurements ultrasonic sensors above 20 kHz are used to transmit and receive the signals. The
receiving transducers are placed at 0, 20, 40, 60 degrees angles from the transmitting sensor across the blast furnace.
The measurements are repeated in three to four different locations around the hearth. Based on wave speed differences
due to material changes for each layer, the captured waves are used to create an “image-shadow”. The so called
“image shadow” is developed based on mathematical modeling and correlations between the arriving ultrasonic waves
with blast furnace layers [17] (Figure 2).
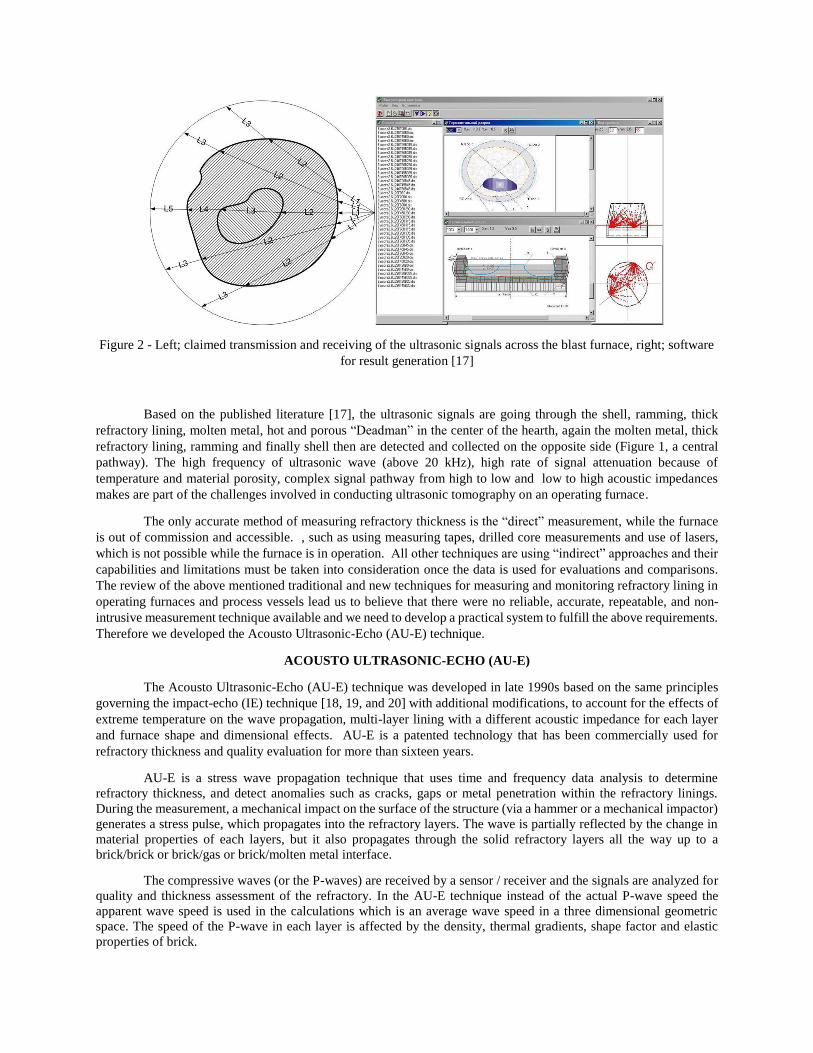
Figure 2 - Left; claimed transmission and receiving of the ultrasonic signals across the blast furnace, right; software
for result generation [17]
Based on the published literature [17], the ultrasonic signals are going through the shell, ramming, thick
refractory lining, molten metal, hot and porous “Deadman” in the center of the hearth, again the molten metal, thick
refractory lining, ramming and finally shell then are detected and collected on the opposite side (Figure 1, a central
pathway). The high frequency of ultrasonic wave (above 20 kHz), high rate of signal attenuation because of
temperature and material porosity, complex signal pathway from high to low and low to high acoustic impedances
makes are part of the challenges involved in conducting ultrasonic tomography on an operating furnace.
The only accurate method of measuring refractory thickness is the “direct” measurement, while the furnace
is out of commission and accessible. , such as using measuring tapes, drilled core measurements and use of lasers,
which is not possible while the furnace is in operation. All other techniques are using “indirect” approaches and their
capabilities and limitations must be taken into consideration once the data is used for evaluations and comparisons.
The review of the above mentioned traditional and new techniques for measuring and monitoring refractory lining in
operating furnaces and process vessels lead us to believe that there were no reliable, accurate, repeatable, and non-
intrusive measurement technique available and we need to develop a practical system to fulfill the above requirements.
Therefore we developed the Acousto Ultrasonic-Echo (AU-E) technique.
ACOUSTO ULTRASONIC-ECHO (AU-E)
The Acousto Ultrasonic-Echo (AU-E) technique was developed in late 1990s based on the same principles
governing the impact-echo (IE) technique [18, 19, and 20] with additional modifications, to account for the effects of
extreme temperature on the wave propagation, multi-layer lining with a different acoustic impedance for each layer
and furnace shape and dimensional effects. AU-E is a patented technology that has been commercially used for
refractory thickness and quality evaluation for more than sixteen years.
AU-E is a stress wave propagation technique that uses time and frequency data analysis to determine
refractory thickness, and detect anomalies such as cracks, gaps or metal penetration within the refractory linings.
During the measurement, a mechanical impact on the surface of the structure (via a hammer or a mechanical impactor)
generates a stress pulse, which propagates into the refractory layers. The wave is partially reflected by the change in
material properties of each layers, but it also propagates through the solid refractory layers all the way up to a
brick/brick or brick/gas or brick/molten metal interface.
The compressive waves (or the P-waves) are received by a sensor / receiver and the signals are analyzed for
quality and thickness assessment of the refractory. In the AU-E technique instead of the actual P-wave speed the
apparent wave speed is used in the calculations which is an average wave speed in a three dimensional geometric
space. The speed of the P-wave in each layer is affected by the density, thermal gradients, shape factor and elastic
properties of brick.
The AU-E technique uses correction factors to account for the speed in each layer. The thermal correction
factor, α is calculated based on refractory dynamic Young's modulus of elasticity under service conditions compared
to the dynamic Young’s modulus at room temperature (Equation 1 and Figure 3). If the dynamic modulus of elasticity
over a temperature gradient is given as Ed (T), the temperature correction factor, α can be calculated as:
Figure 3 – Effect of increase in temperature on dynamic Young’s modulus for refractories
o
T
T
d
E
dTTE
2
1
1
(1)
Where Eo is the dynamic modulus of elasticity at room temperature and in this calculation we are assuming
that the Young’s modulus of elasticity of the refractory changes within a uniform gradient between the hot and cold
face as a result of temperature (see Figure 3).
The shape factor β, accounts for reduction in wave velocity due to geometry of the structures the waves are
travelling in. The apparent wave speed offset is due to excitation of structure’s natural frequencies by the impact
force. The shape factor value depends on the cross section dimensions of the testing area. For example the β factor for
the cross section of a column is 0.87 [18]. For most furnaces where lateral dimensions are at least six times the the
thickness of the lining, β is 0.96.
The governing equation for the AU-E technique is indicated by Equation 2.
T = (αβVp) / (2 fp) (2)
Where fp is the P-wave frequency, Vp is the propagation speed of P-wave in the material, T is the thickness
or depth of the reflecting surface, α is the temperature correction factor and β is the shape factor.
For a multilayered section such as furnace hearth, the thickness of the final refractory layer (Tn) is calculated
based on the following equation:
1
1
21
2
n
i iiiP
innnp
nV
T
f
VT
(3)
Where ƒ is the resonance frequency for the thickness of the nth layer. Equation 3 can be used to determine
the refractory lining thickness on the hot face, considering the P-wave speed (Vp)i, the thermal correction αi, the shape
correction factor βi and the thickness Ti of the layers prior to the inner most layer are known. Equation 3 assumes that
the stress wave generated by a controlled impact source contains sufficient energy to reach the inner most layer of the
lining and resonates back and forth between the two faces to create a desirable or defined P-wave thickness frequency.
In addition to understanding the mechanisum of the stress wave measurments, an important factor for a
successful AU-E inspection is the utilization of the right tools to implement the inspection procedures. A broadband
vertical displacement transducers of desirable frequency range was designed with the ability to function at high
temperatures and in wet environments. For pulse generation, impactors with specific spherical tip diameter, capable
of generating a specific range of frequencies were selected. The data acquisition system is military grade, water and
dust resistant sturdy system which can stand high and low temperatures between -50°C to 90°C.
Calibration
Prior to the field data collection the apparent P-wave speed for each brick type is determined representative
brick samples at room temperature. The wave speed measurements must be carried out on all the materials that the
wave is passing through. The α factor can be calculated experimentally, by heating brick samples and measuring the
wave speeds at the desired temperatures or it can be calculated by the brick elastic and thermal properties. For β
factors the value can be calculated once the dimensions of the testing area are available. After the calibration is done
a mathematical model is created to help the specialist about their field data collection hardware and software settings.
Thickness Measurements and Refractory Wear
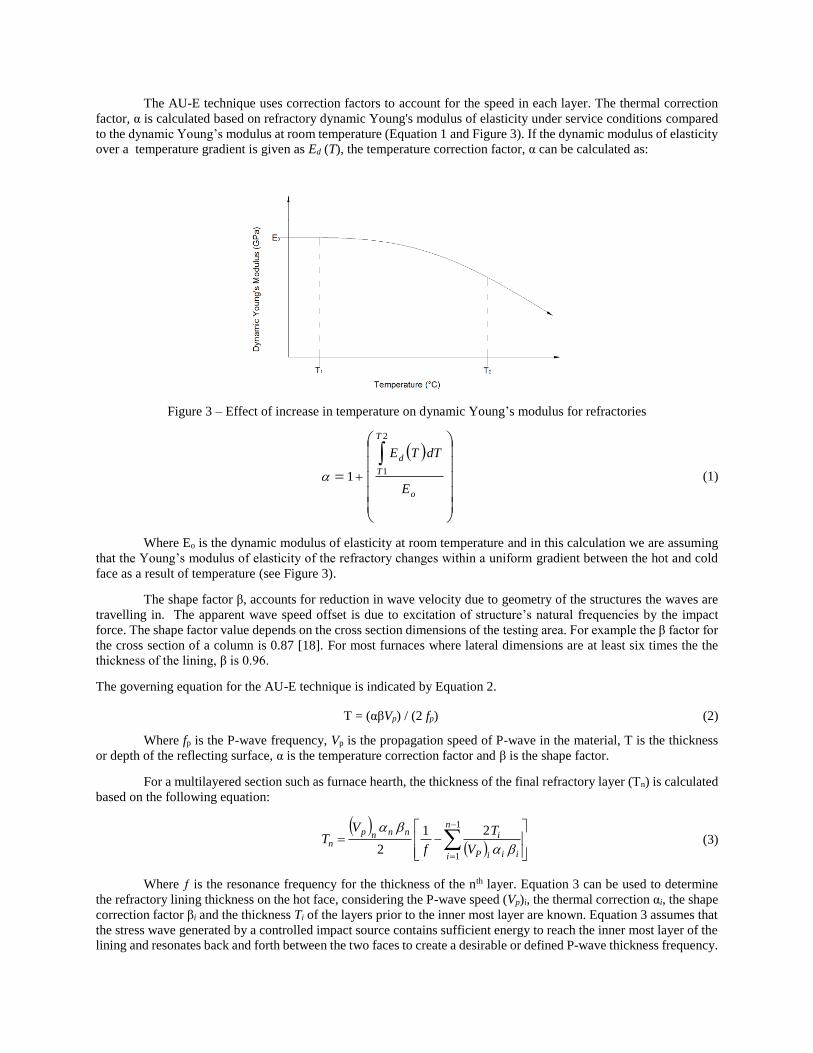
The Data collected in the time domain and it is extremely complex, containing numerous frequencies and
multiple reflections, diffractions, refractions from body and surface waves (see Figure 4).
Figure 4 - Typical time domain signal from a furnace wall
In the frequency domain the results are better defined, but still there are many different elements that can
cause misinterpretation. Figure 5 shows three typical resulting frequency spectrum including a signal collected on a
furnace wall with no cracks or impregnation; a small and filled crack across a brick, and an opened crack across a
single brick in a furnace wall, from top to bottom perpendicularly. Note that lower frequency reflections are associated
with greater distances to the interface reflecting the signal
Refractory wear is usually thought of as the reduction of refractory thickness over time caused by the thermal
and mechanical stresses in the furnace. When using the AU-E technique there are a few other refractory conditions
that will appear as detected remaining refractory thickness; namely, metal impregnated refractory and accretion or
build-up (see Figure 6).
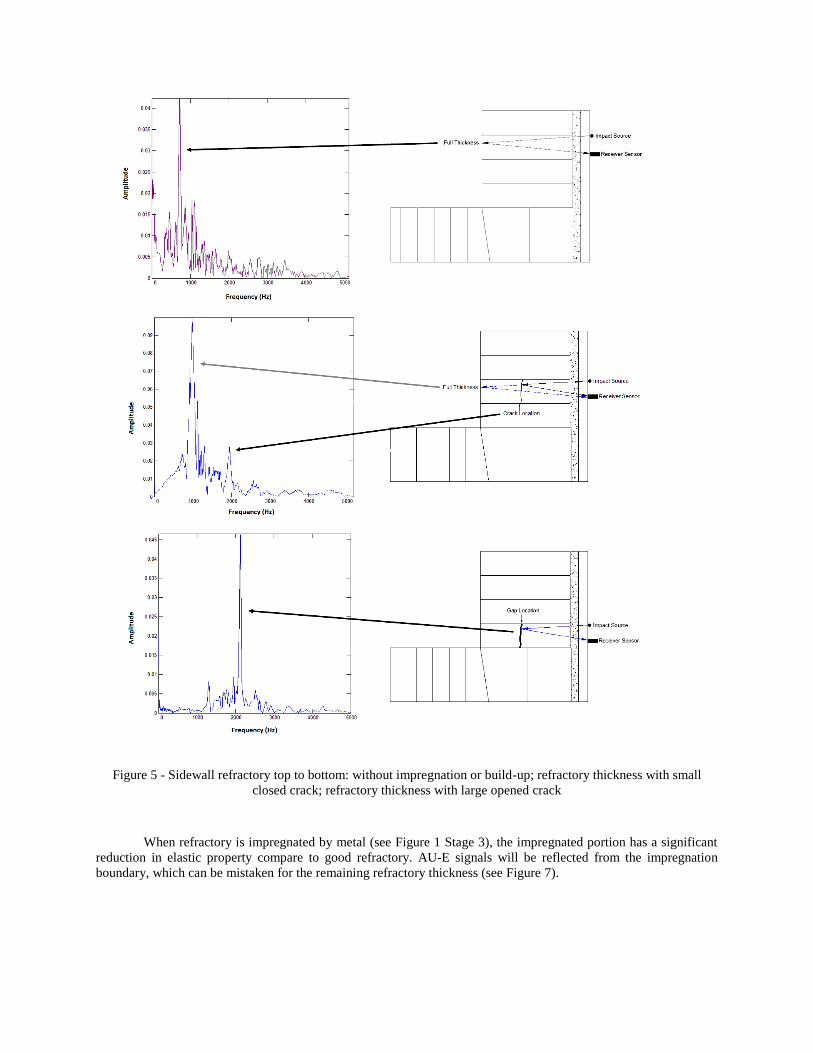
Figure 5 - Sidewall refractory top to bottom: without impregnation or build-up; refractory thickness with small
closed crack; refractory thickness with large opened crack
When refractory is impregnated by metal (see Figure 1 Stage 3), the impregnated portion has a significant
reduction in elastic property compare to good refractory. AU-E signals will be reflected from the impregnation
boundary, which can be mistaken for the remaining refractory thickness (see Figure 7).
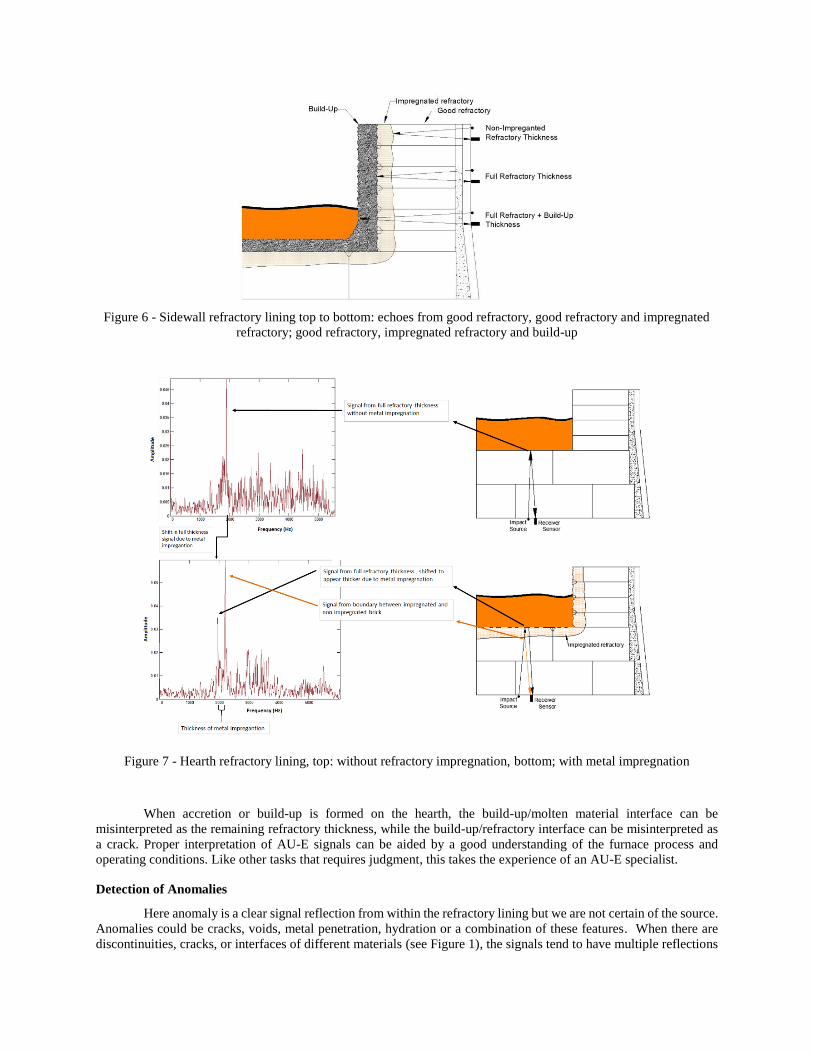
Figure 6 - Sidewall refractory lining top to bottom: echoes from good refractory, good refractory and impregnated
refractory; good refractory, impregnated refractory and build-up
Figure 7 - Hearth refractory lining, top: without refractory impregnation, bottom; with metal impregnation
When accretion or build-up is formed on the hearth, the build-up/molten material interface can be
misinterpreted as the remaining refractory thickness, while the build-up/refractory interface can be misinterpreted as
a crack. Proper interpretation of AU-E signals can be aided by a good understanding of the furnace process and
operating conditions. Like other tasks that requires judgment, this takes the experience of an AU-E specialist.
Detection of Anomalies
Here anomaly is a clear signal reflection from within the refractory lining but we are not certain of the source.
Anomalies could be cracks, voids, metal penetration, hydration or a combination of these features. When there are
discontinuities, cracks, or interfaces of different materials (see Figure 1), the signals tend to have multiple reflections
and at higher frequencies compared to the low frequency reflection for the full refractory thickness. The signal
reflection frequencies are used to determine the position of the anomaly.
When significant gaps/cracks are present in the bricks, impact signals may not transmit through the entire
thickness of the brick. They will be attenuated by the gaps and thus, signals seem to reflect from a thinner region
closer to the cold face. As such, the actual remaining refractory could be thicker than detected by the signals.
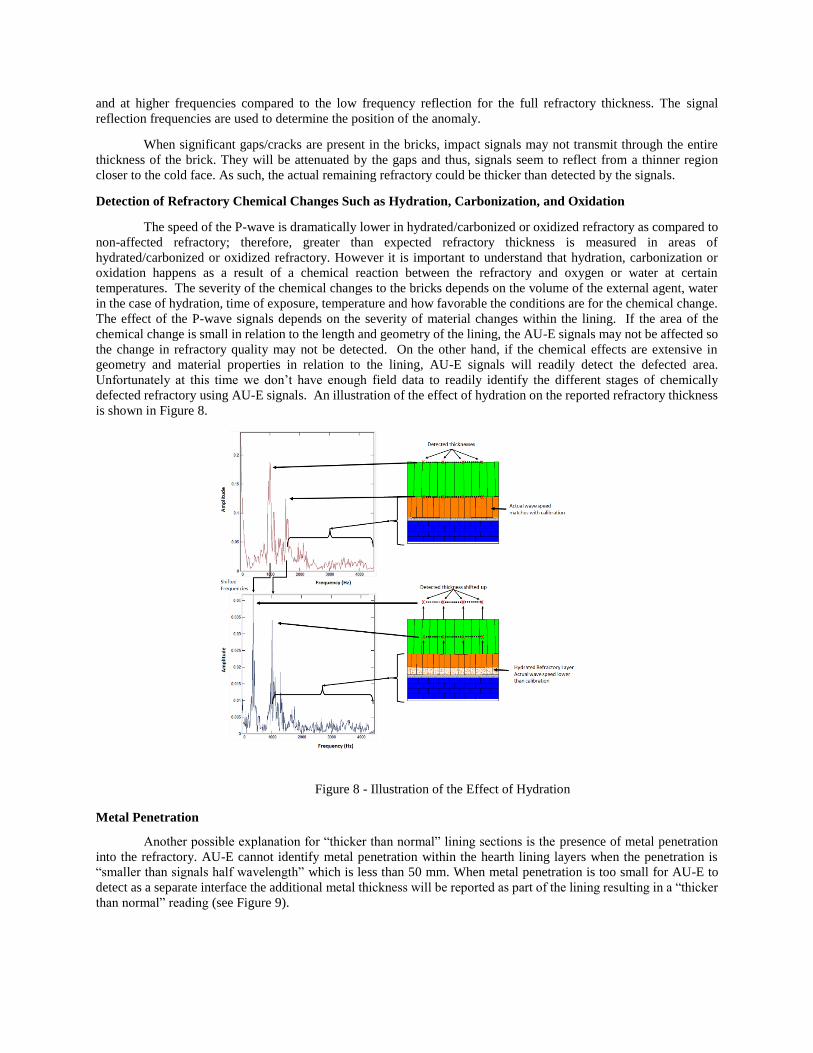
Detection of Refractory Chemical Changes Such as Hydration, Carbonization, and Oxidation
The speed of the P-wave is dramatically lower in hydrated/carbonized or oxidized refractory as compared to
non-affected refractory; therefore, greater than expected refractory thickness is measured in areas of
hydrated/carbonized or oxidized refractory. However it is important to understand that hydration, carbonization or
oxidation happens as a result of a chemical reaction between the refractory and oxygen or water at certain
temperatures. The severity of the chemical changes to the bricks depends on the volume of the external agent, water
in the case of hydration, time of exposure, temperature and how favorable the conditions are for the chemical change.
The effect of the P-wave signals depends on the severity of material changes within the lining. If the area of the
chemical change is small in relation to the length and geometry of the lining, the AU-E signals may not be affected so
the change in refractory quality may not be detected. On the other hand, if the chemical effects are extensive in
geometry and material properties in relation to the lining, AU-E signals will readily detect the defected area.
Unfortunately at this time we don’t have enough field data to readily identify the different stages of chemically
defected refractory using AU-E signals. An illustration of the effect of hydration on the reported refractory thickness
is shown in Figure 8.
Figure 8 - Illustration of the Effect of Hydration
Metal Penetration
Another possible explanation for “thicker than normal” lining sections is the presence of metal penetration
into the refractory. AU-E cannot identify metal penetration within the hearth lining layers when the penetration is
“smaller than signals half wavelength” which is less than 50 mm. When metal penetration is too small for AU-E to
detect as a separate interface the additional metal thickness will be reported as part of the lining resulting in a “thicker
than normal” reading (see Figure 9).
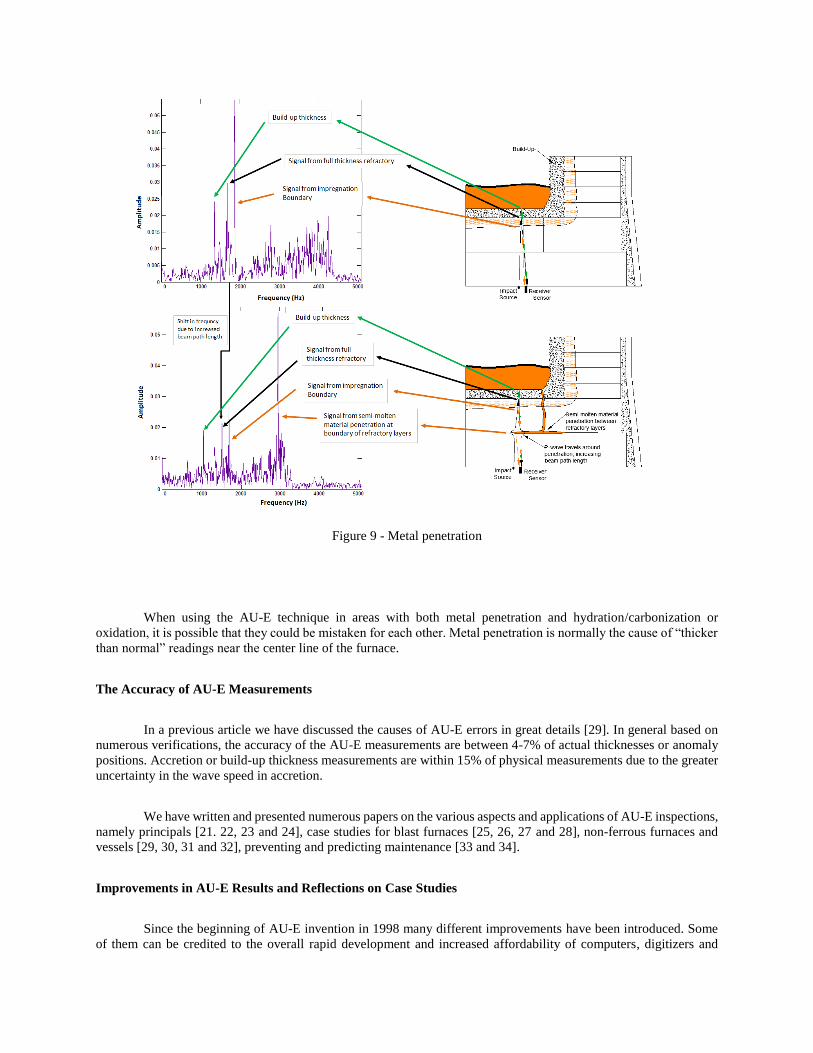
Figure 9 - Metal penetration
When using the AU-E technique in areas with both metal penetration and hydration/carbonization or
oxidation, it is possible that they could be mistaken for each other. Metal penetration is normally the cause of “thicker
than normal” readings near the center line of the furnace.
The Accuracy of AU-E Measurements
In a previous article we have discussed the causes of AU-E errors in great details [29]. In general based on
numerous verifications, the accuracy of the AU-E measurements are between 4-7% of actual thicknesses or anomaly
positions. Accretion or build-up thickness measurements are within 15% of physical measurements due to the greater
uncertainty in the wave speed in accretion.
We have written and presented numerous papers on the various aspects and applications of AU-E inspections,
namely principals [21. 22, 23 and 24], case studies for blast furnaces [25, 26, 27 and 28], non-ferrous furnaces and
vessels [29, 30, 31 and 32], preventing and predicting maintenance [33 and 34].
Improvements in AU-E Results and Reflections on Case Studies
Since the beginning of AU-E invention in 1998 many different improvements have been introduced. Some
of them can be credited to the overall rapid development and increased affordability of computers, digitizers and

software development tools. As a result, the data processing speed increased and the results can be presented in a
customized way to clearly and quickly report on the issues detected in the lining. Another source of improvements in
terms of data interpretation has been achieved by the increase in our experience and knowledge about furnaces and in
part thanks to better cooperation with furnace operators and other technical personnel at smelters with our staff as the
value of AU-E became more apparent to operating companies. Obtaining feedback from the post mortem analysis of
the linings and analyzing it in conjunction with the AU-E results proved to add great value to the understanding of the
refractory deterioration process. All these improvements have been applied to the AU-E evaluation and their
importance is reflected in the following case studies.
CASE STUDY 1: ELECTRIC ARC FURNACE
Hatch had measured the refractory thickness of Furnace 1 at Lonmin operations in Marikana, South Africa,
for a long time while the furnace was in operating during their previous furnace campaign. The first AU-E survey was
done in August 2011, followed by four more rounds of measurements. Each of the five AU-E surveys included
thickness measurements at 103 locations around the furnaces, at three levels between the plate coolers. Each time the
remaining thicknesses were plotted for all the locations at individual levels. These results are shown in millimeters in
Figure 10. The design thickness of 650 mm is also shown for reference. The wall was expected to remain stable unless
it is worn back to 60%-70% of the depth of the plate coolers (this is indicated in the drawing below by the red dashed
line). The last survey was completed in March 2013, approximately one month before the furnace shutdown for a
rebuild. These latest NDT results including the brick thicknesses of the furnace wall computed based on the AU-E
measurements were compared to the actual thickness measured during the demolition.
In summary, the final measurements done shortly before the shutdown revealed the following thicknesses:
Level 1: average thickness 453mm, minimum thickness 410mm;
Level 2: average thickness 467mm, minimum thickness 440mm;
Level 3: average thickness 468mm, minimum thickness 440mm.
The above results were later compared to the actual thickness measurements taken at 23 locations (out of 103
location previously used for AU-E surveys) during the furnace demolition. The lining wear pattern was relatively
uniform around the furnace (see Figure 11) which was in agreement with the results of the AU-E survey. As a result
it was concluded that the sample size (i.e. the number of actual measurements) is representative for the entire furnace
and can be used for the purpose of validating the AU-E results.
Whenever the actual remaining brick size was measured it was compared against the AU-E result from March
2013. Such comparison is presented in Table 1, together with the difference obtained between AU-E and the actual
measurement. Overall, the accuracy of the NDT measurements proved to be very high, with the average discrepancy
between AU-E and actual size being 4%. Given the average thickness of the remaining lining equal to 480mm (at the
tested locations) that error translates to 20mm. Such a level of accuracy is sufficient to accept AU-E technique as a
highly reliable technique for lining monitoring. Only one place where the discrepancy between the AU-E result and
the actual thickness was high is location 3a. The AU-E indicated 420mm, while the actual thickness was 510mm. The
AU-E data were verified for this location and it still resulted in the same thickness of 420mm. The visual inspection
of this particular area revealed a void at this location at 400mm from the cold side, which could have been detected
by AU-E and mistakenly interpreted as a full thickness. It is however unclear whether this void was present during
the furnace operations or it appeared during the demolition as a result of removing the coolers and breaking down the
wall. Another possible explanation is that the false reading was caused by an internal inclusion in the particular brick.
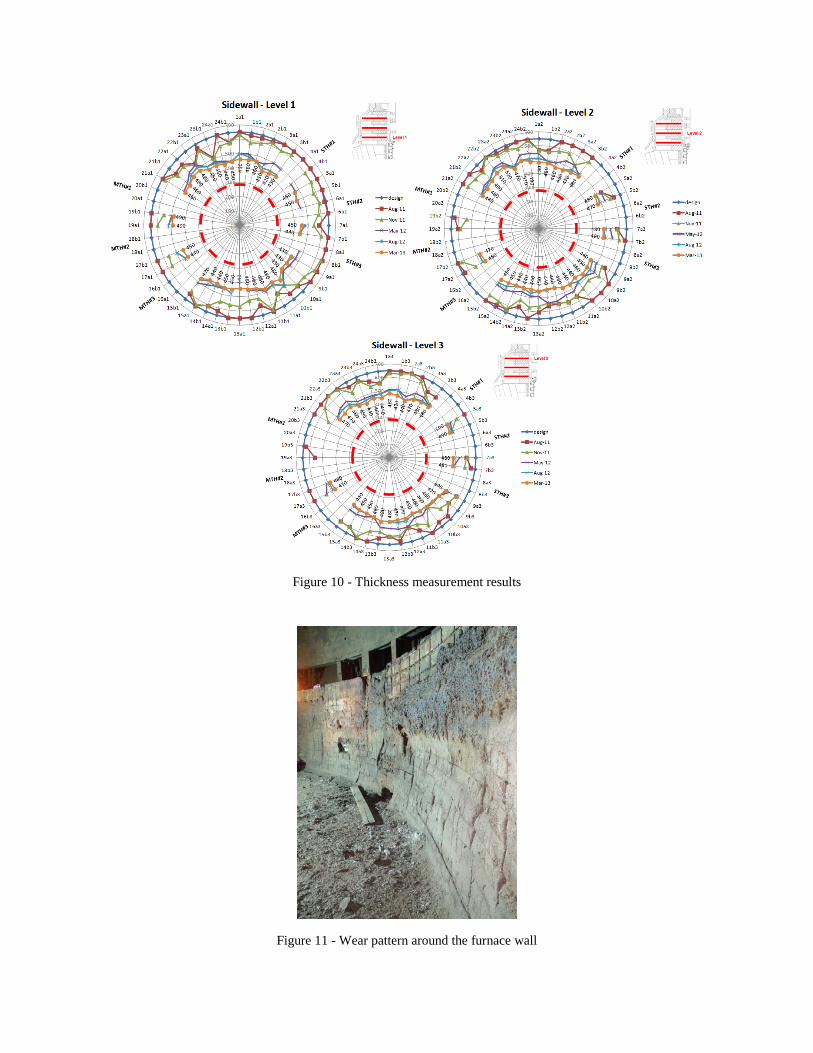
Figure 10 - Thickness measurement results
Figure 11 - Wear pattern around the furnace wall
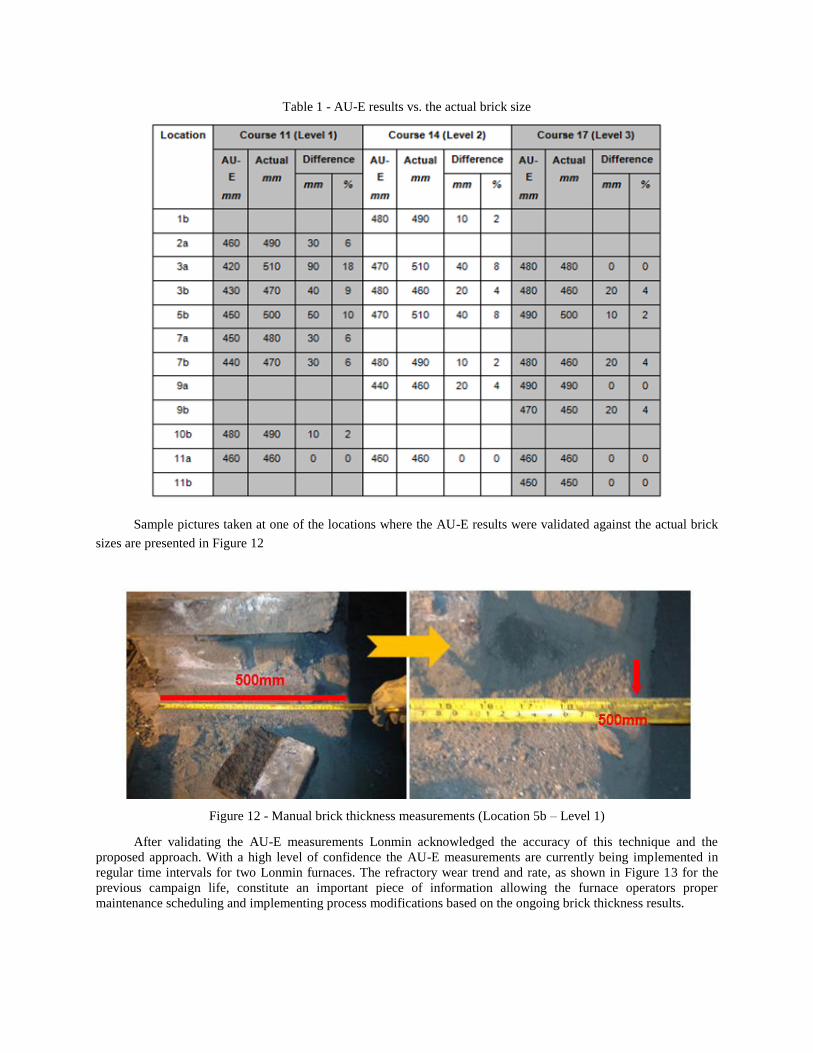
Table 1 - AU-E results vs. the actual brick size
Sample pictures taken at one of the locations where the AU-E results were validated against the actual brick
sizes are presented in Figure 12
Figure 12 - Manual brick thickness measurements (Location 5b – Level 1)
After validating the AU-E measurements Lonmin acknowledged the accuracy of this technique and the
proposed approach. With a high level of confidence the AU-E measurements are currently being implemented in
regular time intervals for two Lonmin furnaces. The refractory wear trend and rate, as shown in Figure 13 for the
previous campaign life, constitute an important piece of information allowing the furnace operators proper
maintenance scheduling and implementing process modifications based on the ongoing brick thickness results.
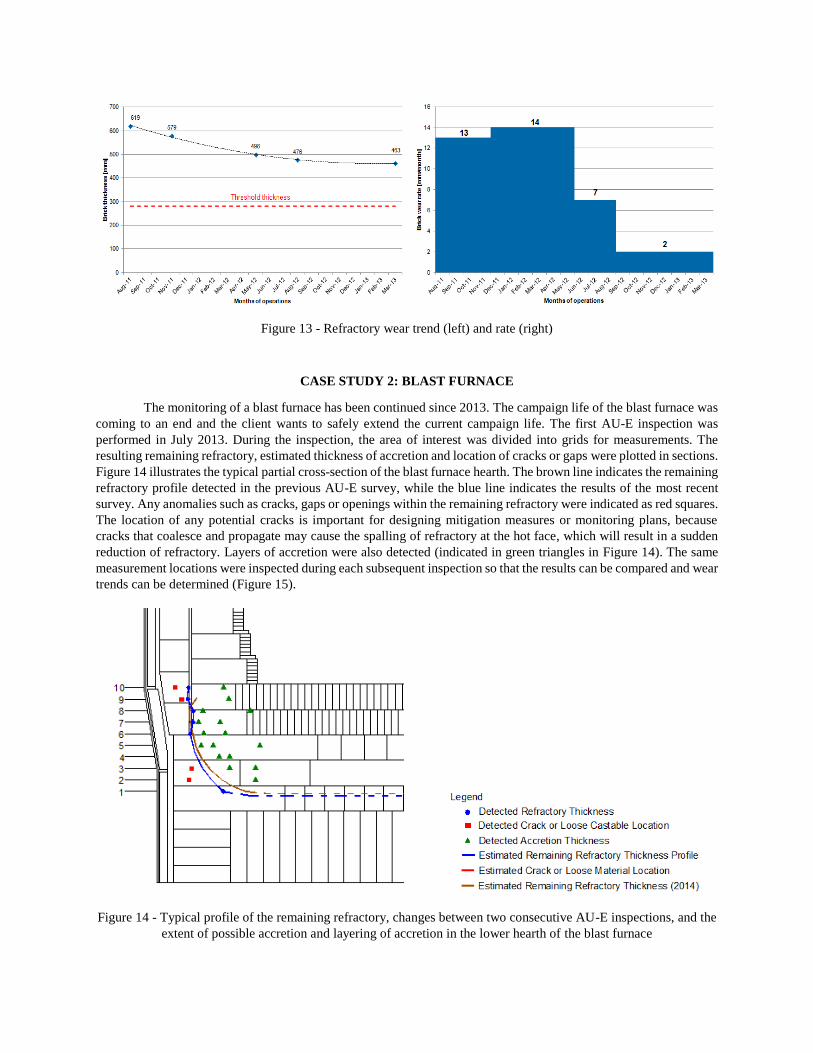
Figure 13 - Refractory wear trend (left) and rate (right)
CASE STUDY 2: BLAST FURNACE
The monitoring of a blast furnace has been continued since 2013. The campaign life of the blast furnace was
coming to an end and the client wants to safely extend the current campaign life. The first AU-E inspection was
performed in July 2013. During the inspection, the area of interest was divided into grids for measurements. The
resulting remaining refractory, estimated thickness of accretion and location of cracks or gaps were plotted in sections.
Figure 14 illustrates the typical partial cross-section of the blast furnace hearth. The brown line indicates the remaining
refractory profile detected in the previous AU-E survey, while the blue line indicates the results of the most recent
survey. Any anomalies such as cracks, gaps or openings within the remaining refractory were indicated as red squares.
The location of any potential cracks is important for designing mitigation measures or monitoring plans, because
cracks that coalesce and propagate may cause the spalling of refractory at the hot face, which will result in a sudden
reduction of refractory. Layers of accretion were also detected (indicated in green triangles in Figure 14). The same
measurement locations were inspected during each subsequent inspection so that the results can be compared and wear
trends can be determined (Figure 15).
Figure 14 - Typical profile of the remaining refractory, changes between two consecutive AU-E inspections, and the
extent of possible accretion and layering of accretion in the lower hearth of the blast furnace
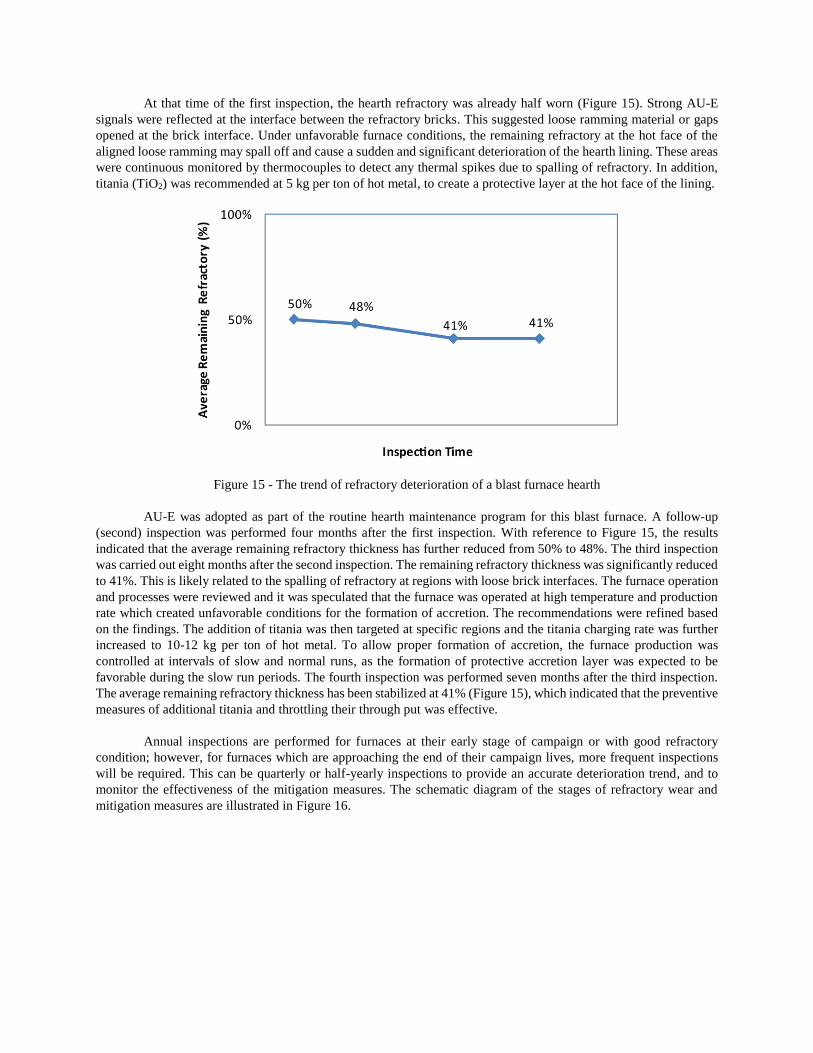
At that time of the first inspection, the hearth refractory was already half worn (Figure 15). Strong AU-E
signals were reflected at the interface between the refractory bricks. This suggested loose ramming material or gaps
opened at the brick interface. Under unfavorable furnace conditions, the remaining refractory at the hot face of the
aligned loose ramming may spall off and cause a sudden and significant deterioration of the hearth lining. These areas
were continuous monitored by thermocouples to detect any thermal spikes due to spalling of refractory. In addition,
titania (TiO2) was recommended at 5 kg per ton of hot metal, to create a protective layer at the hot face of the lining.
Figure 15 - The trend of refractory deterioration of a blast furnace hearth
AU-E was adopted as part of the routine hearth maintenance program for this blast furnace. A follow-up
(second) inspection was performed four months after the first inspection. With reference to Figure 15, the results
indicated that the average remaining refractory thickness has further reduced from 50% to 48%. The third inspection
was carried out eight months after the second inspection. The remaining refractory thickness was significantly reduced
to 41%. This is likely related to the spalling of refractory at regions with loose brick interfaces. The furnace operation
and processes were reviewed and it was speculated that the furnace was operated at high temperature and production
rate which created unfavorable conditions for the formation of accretion. The recommendations were refined based
on the findings. The addition of titania was then targeted at specific regions and the titania charging rate was further
increased to 10-12 kg per ton of hot metal. To allow proper formation of accretion, the furnace production was
controlled at intervals of slow and normal runs, as the formation of protective accretion layer was expected to be
favorable during the slow run periods. The fourth inspection was performed seven months after the third inspection.
The average remaining refractory thickness has been stabilized at 41% (Figure 15), which indicated that the preventive
measures of additional titania and throttling their through put was effective.
Annual inspections are performed for furnaces at their early stage of campaign or with good refractory
condition; however, for furnaces which are approaching the end of their campaign lives, more frequent inspections
will be required. This can be quarterly or half-yearly inspections to provide an accurate deterioration trend, and to
monitor the effectiveness of the mitigation measures. The schematic diagram of the stages of refractory wear and
mitigation measures are illustrated in Figure 16.
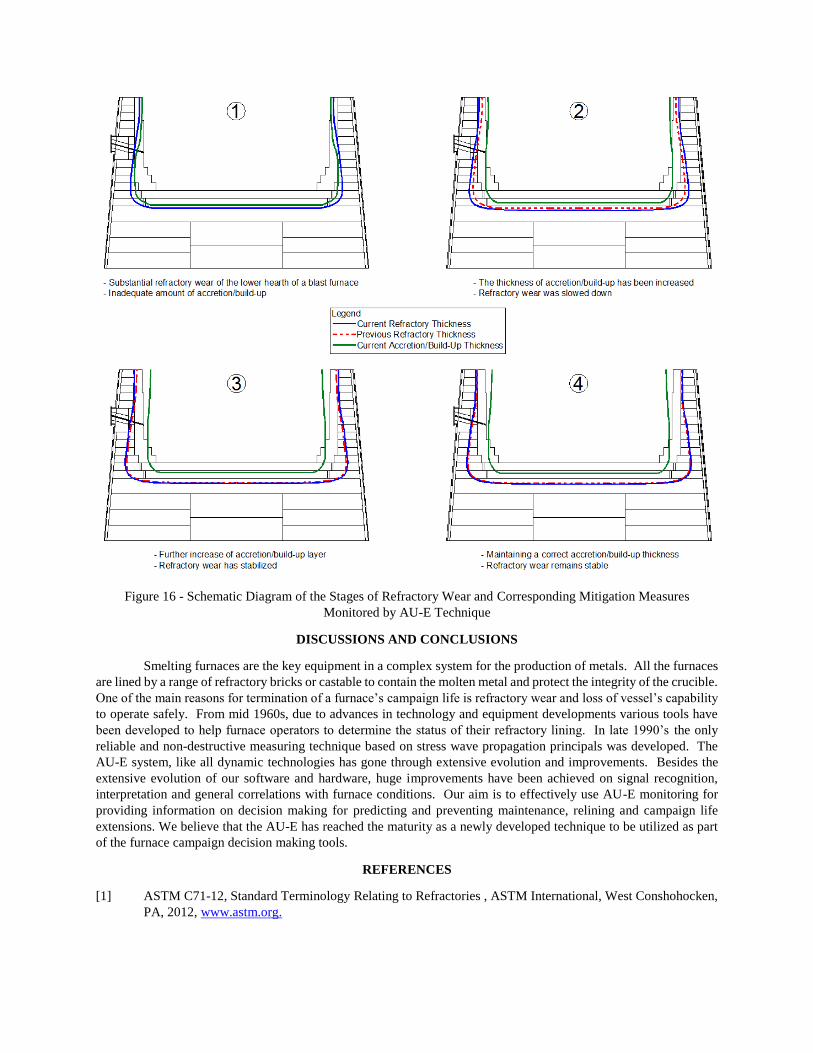
Figure 16 - Schematic Diagram of the Stages of Refractory Wear and Corresponding Mitigation Measures
Monitored by AU-E Technique
DISCUSSIONS AND CONCLUSIONS
Smelting furnaces are the key equipment in a complex system for the production of metals. All the furnaces
are lined by a range of refractory bricks or castable to contain the molten metal and protect the integrity of the crucible.
One of the main reasons for termination of a furnace’s campaign life is refractory wear and loss of vessel’s capability
to operate safely. From mid 1960s, due to advances in technology and equipment developments various tools have
been developed to help furnace operators to determine the status of their refractory lining. In late 1990’s the only
reliable and non-destructive measuring technique based on stress wave propagation principals was developed. The
AU-E system, like all dynamic technologies has gone through extensive evolution and improvements. Besides the
extensive evolution of our software and hardware, huge improvements have been achieved on signal recognition,
interpretation and general correlations with furnace conditions. Our aim is to effectively use AU-E monitoring for
providing information on decision making for predicting and preventing maintenance, relining and campaign life
extensions. We believe that the AU-E has reached the maturity as a newly developed technique to be utilized as part
of the furnace campaign decision making tools.
REFERENCES
[1] ASTM C71-12, Standard Terminology Relating to Refractories , ASTM International, West Conshohocken,
PA, 2012, www.astm.org.
[2] Preuer, A., Winter, J., & Hiebler, H. (1992). Computation of the erosion in the hearth of a blast furnace, Steel
Research, 63, 147–151.
[2] Dong, H. & Shaojun, C. (2013, June). Mathematical model for fast computation of erosion profile in
submerged arc furnace with freeze lining, Proceedings of the thirteenth International Ferroalloys Congress
Efficient technologies in ferroalloy industry, INFACON XIII, 799-810, Almaty, Kazakhstan.
[3] Borbas, J. J., Padfield, R. C. & Moscker, E., (1967) Density determination of refractories by measurement of
gamma-radiation absorption. Journal of the American Ceramic Society, 50(8), 421-424.
[4] Staicu, L. & Radu, R. (1983). The use of the (γ, n) reaction to measure wear in blast furnaces and other
industrial furnaces: comparison with present methods. Journal of Physics D: Applied Physics. 16(12), 2541-
2546.
[5] Salgado, J., Oliveira, C., Moutinho, A., & Silvério, C. (1988). Control of refractory lining wear by using
radioisotopesInternational Journal of Radiation Applications and Instrumentation. Part A. Applied Radiation
and Isotopes. 39(12), 1265–1267.
[6] Prasad, A.S.; Sinha, P.; Qamrul, M.; Chatterjee, A.; & Chakravarty, P.K. (1979, July-October). Some
experience with radioisotopes in the study of the wear of blast furnace linings. Tata Iron and Steel Co. Ltd.,
Jamshedpur, India. Research and Development Division. TISCO; v. 26(3-4), 81-87 ISSN 0496-6546;
Worldcat.
[7] Perko, J.F. & Spirko, E.J. (1979, June) Blast furnace refractory lining wear status using radioactive sources.
Repub Steel Corp, Cleveland, Ohio. Ind. Heat; v. 42(6), 74-78.
[8] Bolf. N. (2004). Application of infrared thermography in chemical engineering. Journal of Chemists and
Chemical Engineers, 53(12), 549-555.
[9] Maldague, X. (2002). Introduction to NDT by active infrared thermography. Materials Evaluation. 6(9),
1060-1073.
[10] Gebski, P., Shameli, E., & Sadri, A., (2009, January). Non-destructive testing (NDT) techniques for
determination of refractory deterioration in smelting furnace; Molten 2009, Proceedings of the VIII
International Conference on Molten Slags, Fluxes and Salts, Editors: Mario Sanchez, Roberto Parra, Gabriel
Riveros and Carlos Diaz, Santiago, Chile.
[11] Ulitzka, S., Hadrich, H., & Gebhardth, F. (1995). Non-Destructive testing of ceramically bonded refractories
– Application of Ultrasond and Microwaves. Glastech. Ber. Glass Sci Technology. 68 (2), 51-58.
[12] Varghese, B., DeConick, C., Cartee, G., Zoughi, R., Velez, M., & Moore, R. (2004, July). High‐temperature
monitoring of refractory wall recession using frequency‐modulated continuous‐wave (FM‐CW) radar
techniques. American Institute of Physics Conference. AIP Conf. Proc. 760, 1714, Golden, Colorado, USA.
[13] Parker, R. L., Meanning, J.R., & Peterson N.C. (1985.). Application of pulse-echo ultrasonics to locate the
solid/liquid interface during solidification and meltring of steel and other metals. Journal of Applied Physics,
58 (11), 4150-4164.
[14] Sadri, A., Gebski, P., Ghorbani, H., McGarrie, G., & De Vries, T. (2009,). Monitoring Deterioration of
Waffle Cooler Thickness at Polokwane Smelter, JOM: A publication of the Minerals, Metals & Materials
Society, 61(10), 69-73.
[15] Sadri, A & Ying, W. L., (2015, May) Monitoring of Stave and Castable Refractory Wear in Blast Furnaces.
Proceedings of AISTech 2015, Cleveland, USA.
[16] Retrieved on January 21, 2015 from Techno-Consulting website: http://www.techno-
consulting.ru/en/about/index.html.
[17] Sansalone, M.J., & Streett W.B. (1997). Impact-Echo: Nondestructive Evaluation of Concrete and Masonry,
Bullbrier Press, Ithaca, NY. p. 339.
[18] Sansalone, M.J. & Carino, N. J. (1986). Impact-Echo: A Method for Flaw Detection in Concrete Using
Transient Stress Waves, National Bureau of Standards, USA, NBSIR 86–3452, NTIS PNB#87-104444/AS,
Springfield, Virginia, USA. p. 222.
[19] Carino, N. J., & Sansalone, M. J., (1988, August), Impact-Echo: A new method for inspecting construction
materials. Proceedings of Nondestructive Testing and Evaluation of Materials for Construction, University
of Illinois, IL., USA.
[20] Sadri, A. (2005, August). Non-destructive determination of refractory and build-up thickness in operating
furnaces using an acousto ultrasonic reflection technique. Proceedings of the Materials Degradation:
Innovation, Inspection, Control and Rehabilitation Symposium, COM2005. Calgary, Alberta, Canada.
[21] Sadri, A. & Walters, G. (2005, August). Determination of refractory and castable quality in operating
industrial furnaces, using a stress wave reflection technique. Proceedings of the Materials Degradation:
Innovation, Inspection, Control and Rehabilitation Symposium, COM2005. Calgary, Alberta, Canada.
[22] Sadri, A., Lachemi, M., & Walters, G. (2005, June). Determination of refractory lining thickness and quality
in operating industrial furnaces using a stress wave reflection technique. Proceedings of First CSCE Specialty
Conference on Infrastructure Technologies, Management and Policy. Toronto, Ontario, Canada.
[23] Sadri, A. (2008). An introduction to stress wave non-destructive testing and evaluation (NDT&E) of
metallurgical furnaces and refractory condition monitoring. CINDE Journal, 29(2), 7-11.
[24] Sadri, A. & Timmer, R. (2006, May) Blast furnace non-destructive testing (NDT) for defect detection and
refractory thickness measurements, AISTech 2006, Proceedings for Iron and Steel Technology Conference,
Vol. II, Cleveland, Ohio, USA.
[25] Sadri, A., Gordon, I., & Rampersad, A. (2007, May). Acousto ultrasonic-echo (AU-E): A non-destructive
testing technique for blast furnace hearth refractory condition monitoring., AdMet 2007, Proceedings of
International Conference Advances in Metallurgical Processes and Materials, Vol. 2. 77-85, Dnipropetrovsk,
Ukraine.
[26] Sadri, A., Marinelli, P., Doro E., Gebski, P., & Rampersad, A. (2009, May). Comparing the accuracy of
acousto ultrasonic-echo (NDT), finite element analysis (FEA), and drilling when obtaining a blast refractory
lining wear profile; AISTech 2009, Proceedings of Iron and Steel Technology Conference, St. Louis,
Missouri, USA.
[27] Sadri, A. & Gebski, P. (2009, October). Non-destructive testing (NDT) and inspection of the blast furnace
refractory lining by stress wave propagation technique. Proceedings of the 5th International Congress on the
Science and Technology of Ironmaking (ICSTI’09); 951-955, Shanghai, China.
[28] Sadri, A., Gebski, P., Mirkhani, K. & Ying, W. L., (2011, October) Monitoring refractory lining in operating
furnaces by acousto ultrasonic-echo technique; Proceedings of Conference of Metallurgists, Com 2011;
Montreal, Quebec, Canada.
[29] Sadri, A., Gebski, P. & Shameli, E. (2010, June). Refractory wear and lining profile determination in
operating electric furnaces using stress wave non-destructive testing (NDT). Proceedings of the Twelfth
International Ferroalloys Congress, INFACON XII. 881-890. Helsinki, Finland.
[30] Sadri, A., Ying, W.L., & Gebski, P. (2013, December) Application of specialized non-destructive testing
(NDT) for operating copper process vessels. Proceedings of Eight International Copper Conference 2013,
Instituto de Ingenieros de Minas de Chile (IIMCh). 813-833Santiago, Chile.
[31] Sadri, A., Gebski, P., Rojas V. P, Ibanez S. R. & Diaz. C. W. (2008, September) Inspection and evaluation
of refractory lining for slag cleaning furnace and Teniente reactor at Fundición Hernán Videla Lira Empresa
Nacional De Minería (ENAMI). Proceedings of MAPLA 2008, International Conference in Mine Plant
Maintenance, Edited by Eduardo Nilo, Raul Stegmaier and Patrico Guzman, September 3-5, 2008, Santiago,
Chile.
[32] Sadri, A., Ying, W.L., & Dempsie, B. (2013, September), Preventing costly smelting furnace and process
vessel run-outs (both in English and Spanish versions) , Proceedings of MAPLA 2013, 10th International
conference in Mining Plant Maintenance, Edited by Sergio Armstrong, Peter Knights, José Bolaños, and
Edmundo Mares, Santiago, Chile.
[33] Sadri, A, Mirkhani K., & Ying, W.L., (2012, September) Utilization of innovative NDT and condition
monitoring techniques for improving maintenance strategies of process vessels, Proceedings of MAPLA
2012, 9th International conference in Mining Plant Maintenance, Edited by Victor Babarovich, Alvaro Endo,
Rodrigo Pascual, and Raul Stegmaier, Santiago, Chile.


![REVIEWARTICLE Hang GAO Researchprogressonultra ... · tive photoelastic coefficients, and acousto-optic figures. KDP crystal is the first choice for multi-dimensional acousto-opticaldevice[1,2]andcurrentlytheonlymaterial](https://static.fdocuments.net/doc/165x107/5fcae95a062b7d63f279a725/reviewarticle-hang-gao-researchprogressonultra-tive-photoelastic-coeficients.jpg)