Effects of shingle absorptivity, radiant barrier emissivity, attic
F
Am
YU
a
ARRAA
KLAAPD
1
iEmppaitp
flctttct
n
h2
Additive Manufacturing 12 (2016) 90–99
Contents lists available at ScienceDirect
Additive Manufacturing
journa l homepage: www.e lsev ier .com/ locate /addma
ull length article
comprehensive analytical model for laser powder-fed additiveanufacturing
uze Huang, Mir Behrad Khamesee, Ehsan Toyserkani (PhD PEng) ∗
niversity of Waterloo, Department of Mechanical and Mechatronics Engineering, Waterloo, Ontario N2L 3G1, Canada
r t i c l e i n f o
rticle history:eceived 13 February 2016eceived in revised form 28 April 2016ccepted 8 July 2016vailable online 30 July 2016
eywords:
a b s t r a c t
This paper addresses a comprehensive analytical model for the laser powder-fed additive manufactur-ing (LPF-AM) process, also known as directed energy deposition AM. The model analytically couples themoving laser beam with Gaussian energy distribution, the powder stream and the semi-infinite sub-strate together, while considering the attenuated laser power intensity distribution, the heated powderspatial distribution and the melt pool 3D shape with its boundary variation. The particles concentrationon transverse plane is modeled with Gaussian distribution based on optical measurement. The model
aser powder-fed additive manufacturingdditive manufacturingnalytical modelowder spatial distributionirected energy deposition
can effectively be used for process development/optimization and controller design, while predictingadequate clad geometry as well as the catchment efficiency rapidly. Experimental validation throughthe deposition of Inconel 625 proves the model can accurately predict the clad geometry and catchmentefficiency in the range of specific energy that is corresponding to high clad quality (maximum percentagedifference is 6.2% for clad width, 7.8% for clad height and 6.8% for catchment efficiency).
© 2016 Elsevier B.V. All rights reserved.
. Introduction
The laser powder-fed additive manufacturing (LPF-AM) processs one of the seven classes of AM that falls under the “Directednergy Deposition” class. The functionality of LPF-AM has attractedultiple industries to embrace its features for coating, repair and
art production from single or multiple materials. In the LPF-AMrocess, the powder stream interacts with the laser beam andttenuates the beam intensity, while the heated powder particlesmpinge into the melt pool adding mass and energy to the melt poolo form effective deposition. All these interactions affect the meltool temperature distribution and the final shape of the clad layer.
A comprehensive model is essential to provide the processuctuation prediction required for the design of comprehensiveontrollers for real-time closed-loop control of the process [1]. Forhe development of any closed-loop control algorithm for LPF-AM,he addition of a model-based benchmark is required. However,he model must be fast, simple but accurate enough to stabilize the
ontroller. Therefore, finite elements models are not suitable forhis purpose [2]. Analytical model that can effectively be incorpo-∗ Corresponding author at: Department of Mechanical and Mechatronics Engi-eering, University of Waterloo, Waterloo, Ontario N2L 3G1, Canada.
E-mail address: [email protected] (E. Toyserkani).
ttp://dx.doi.org/10.1016/j.addma.2016.07.001214-8604/© 2016 Elsevier B.V. All rights reserved.
rated in high speed hardware may provide a great platform for thereal-time control of LPF-AM.
Numerical methods based on finite element methods havealso proved popular and can accurately simulate the powder fluxdistribution [3], laser particle interaction process [4], melt pool for-mation [5], clad layer geometry [6,7], temperature, velocity andthermal stress fields distribution over the process [8,9]. But suchnumerical models are increasing the complexity of process model-ing and computational time.
Analytical modeling is a classic way for understanding theunfamiliar aspects of the process [10] and acts as a benchmarkreference generator inside the structure of closed-loop control sys-tem. Picasso et al. [11] established a simple but realistic analyticalmodel for LPF-AM. The powder attenuation effect for the laser beamwas accounted with simple geometry intersecting ratio. The heatedpowder energy was added together with the laser beam energy asthe heat source to calculate the substrate temperature field. Withthe relative simplicity, their model can produce immediate resultsabout scanning speed, powder feed rate and catchment efficiency.Fathi et al. [12] developed a mathematical model of LPF-AM to pre-dict the melt pool depth, dilution and the temperature field withgiven values of clad height and clad width. They built the mathe-matical top surface of the melt pool with parabolic equation and
solved the heat conduction in substrate to predict the tempera-ture field based on an infinite moving point heat source. Tan et al.[13] built an analytical model to estimate the clad layer geome-
Y. Huang et al. / Additive Manufa
Nomenclature
AS2 , AS3 Melt pool effective projection area, mm2
C Specific heat capacity, J/(kg K)D Laser spot diameter, mmE Specific energy, J/mm2
g Argon gas feed rate, dL/minh Clad height, mmH Nozzle height, mmI(x,y,z) Laser beam intensity at point (x, y, z), WIA(x,y,z) Attenuated laser beam intensity at point (x, y, z), WIp(x,y,z) Heated powder energy intensity, WInet(x,y,z) Resultant energy source intensityk Thermal conductivity, W/(m K)K Constant for powder stream boundary lineL Melt pool length, mml1,l2 Major semi-axis of the projection ellipseLf Latent heat fusion, J/Kgmp Particle mass, gm Powder feed rate, g/minn(x′,y′,z′) Powder number concentrationPL Laser power, WQext Extinct coefficientr0 Nozzle internal radius, mmrp Particle radius, �mr(z′), r(z) Powder stream effective radius at z′, z mmR0L Laser beam waist radius, mmRL(z) Laser beam effective radius at z, mmS1, S2, S3 Melt pool approximation inclined surfacetn Nozzle tube thickness (mm)T0 Ambient temperature, KTm Material melting temperature, KTP (x, y, z) Particle temperature at point (x, y, z), Kv Process speed, m/svp Particle velocity, m/sw Minor semi-axis of the projection ellipse, mmW Melt pool width, mmz0 Laser beam waist position, mm�T Temperature increment, K� Melt pool inclination angle, degree� Thermal diffusivity, m2/s˛w Brewster effect coefficient
Powder laser absorptivityˇw Substrate laser power absorptivity� Catchment efficiency� Powder stream divergence angle, degree�L Laser beam far-field divergence angle, rad�L Fiber laser wavelength, �m� Thermal conductivity correction factor�(x′,y′,z′) Powder spatial mass concentration, g/mm3
�p Particle density, Kg/m3
Extinction cross section of a sphere particle, mm2
ϕ Nozzle angle, degree
tficTpwima
� Melt pool boundary
ry based on a moving disc heat source model. The melt pool wastted as an ellipse and the powder catchment efficiency was cal-ulated directly as melt pool and the powder stream area ratio.hey also considered the powder flux distribution in clad heightrediction and pointed out that both the melt pool length and clad
idth increasing with decreasing scanning velocity and increas-ng laser power. Shengfeng et al. [14] proposed a similar analyticalodel to predict the cladding height and catchment efficiency with
ssuming the melt pool to be a flat plane on substrate. Experi-
cturing 12 (2016) 90–99 91
mental results show that the catchment efficiency has the samevarying trend with the nozzle angle. Xinyong et al. [15] developeda mathematical model to estimate the catchment efficiency basedon mass conservation and kinematic equations, but no considera-tion was paid to the interaction effect between the laser beam andthe particles.
Most of the above analytical models have decoupled the massand energy flows, ignored the changes of the laser power absorp-tivity due to the varying of clad geometry(Brewster effect), andcalculated the melt pool limits only based upon laser power source.As a result, those models may have different prediction accuracy.Based on these papers, we built a comprehensive analytical modelfor LPF-AM. The novelty of the model is based on the fact that itunifies the main physical changes of the whole process by couplingthe attenuated laser power, the heated powder stream and thesemi-infinite substrate with considering their concentration andintensity spatial distribution. In addition, the catchment efficiencymodel takes into account both the powder spatial distribution andthe melt pool shape variation.
2. Analytical modelling
An analytical model for laser powder-fed additive manufac-turing has been developed in this paper with the followingassumptions:
(1) The lateral nozzle has a perfect circular outlet.(2) The gas-powder flow is assumed as a steady state flow and the
effect of the gravity and drag force are considered negligible.Thus, the powder stream has a uniform velocity in transversedirection which is assumed to be the same as the gas velocitynear the nozzle outlet.
(3) The convection and radiation losses in the powder stream wasnot considered and the particles are isothermal with sphericalgeometry [16].
(4) Powder particles, impinging onto the molten pool, are consid-ered effectively added to and mixed with the liquid flow on meltpool surface. It is required that the adhesion force Fadis biggerthan and the repelling force Fr (Fad/Fr > 1) between the meltpool surface and the impinging particle. Lin [17] calculated theratio of Fad/Fr = 100 for stainless steel in coaxial LPF-AM, whichtestifies that the powder is effectively melted and attached ontothe molten pool surface. The liquid phases will then rapidlymixed and become homogeneous due to the strong convec-tion currents generated by the thermal gradients on melt poolsurface (Marangoni convection/effect) [18,19].
(5) The thermo-physical properties for both powder and substrateare considered to be temperature independent. Average valuesover the temperature variation were considred in the model.
2.1. Powder spatial distribution
The schematic of LPF-AM is shown in Fig. 1. The laser beam scansin the positive y-direction with the process velocityv, and the originof its coordinates is fixed at the center of the laser beam spot onthe substrate. The nozzle has an inclined angle ϕ and distance Hwith respect to the substrate plane. The laser beam and the powderstream interact with each other after point P.
The powder concentration mode in the transverse direction wasidentified with Gaussian distribution by Lin [20] with both opticaltechniques and the theory of particles diffusion and convection in
gaseous medium based on Fuchs’s aerosols laminar flow. Opticalluminance experimental analysis of Pinkerton’s research [21] veri-fied that the particles stream have Gaussian concentration profilesin the transverse plane. Yang [22] and Gangxian [23] also built the
92 Y. Huang et al. / Additive Manufacturing 12 (2016) 90–99
Fig. 1. Schematic diagram for laser powder-fed additive manufacturing.
F = 5(gs ng res
pptptptwbcsLcgG
a
�
n
wp
ig. 2. Inconel 625 powder stream grayscale intensity distribution measurement (mal green dot lines (b) Measured grayscale intensity distribution with Gaussian fitti
owder stream concentration with a Gaussian model and the modelredicted values were consistent with the experimental results. Inhis paper, the powder concentration distributions in the transverselane were expressed by the powder stream luminance distribu-ions. Based on Mie theory, the luminance of the powder stream isroportional to particles concentration, so the luminance distribu-ion in the image expresses the particles concentration distributionithin the powder stream. The powder stream images were taken
y a Canon EOS 60D camera (Canon, Oita, Japan) with a Penta-on 135 mm f/2.8 lens (Pentacon, Dresden, Germany). The powdertream luminance was measured by grayscale intensity with MAT-AB Image-Processing Software, in which the RGB images wereonverted to grayscale images. As the Inconel 625 powder streamrayscale image shown in Fig. 2, the powder concentration hasaussian distribution in transverse plane with varying distances.
From the results, powder spatial mass concentration �(x′, y′, z′)nd the number concentration n(x′, y′, z′) can be derived as
(x′, y′, z′) = 2mvp�r2(z′)
exp
[− 2(x′2 + y′2)
r2(z′)
](1)
2m[
2(x′2 + y′2)]
(x′, y′, z′) =vpmp�r2(z′)
exp −r2(z′)
(2)
here m is the powder feed rate, mp the average mass for eacharticle, vp = g/�r2
0 the average powder velocity (based on assump-
/ min), ϕ = 60◦ ,g = 2.5(dL/ min), r0 = 0.7(mm)): (a) Grayscale image with transver-ults on transversal lines.
tion 2), g the gas flow rate, r0 the nozzle internal radius and r(z′)is the effective radius of powder stream reaching 1/e2 of the peakconcentration value of the powder stream center [23]. Based onthe measurement and derivation highlighted in Appendix A, theeffective radius of powder stream can be expressed as
r(z′) = r0 − z′ tan �, z′ < 0 (3)
where � is the effective divergence angle. Considering the coordi-nates transformation from x′y′z′ to xyz
x′ = x
y′ = (y − H/tan ϕ) sin ϕ − (z − H)cos ϕ
z′ = (y − H/tan ϕ) cos ϕ + (z − H) sin ϕ
(4)
Then the powder mass concentration in xyz coordinates will bederived as
�(x, y, z) = 2mvp�r2(z)
exp
[−
2[x2 + [(y − H/tan ϕ) sin ϕ − (z − H)cos ϕ]2
]r2(z)
],
r(z) = −[
(y − H/tan ϕ) cos � + (z − H) sin ϕ]
tan � + r0
(5)
2.2. Laser beam and gas-powder stream interaction
The laser beam and consequently its power intensity is atten-uated by the powder stream during their interaction [16,18]. The

anufa
ti
s
I
wbwR
R
w
d
wtcb
n
tteoats�oipiu[
iio
I
waz
ipft
ˇ
T( m)]
×
Y. Huang et al. / Additive M
otal attenuation is a sum effect of scattering and absorption, whichs also named as extinction.
This paper uses a Gaussian TEM00 mode laser power with inten-ity distribution as [19]
(x, y, z) = 2PL�R2
L (z)exp
[− 2(x2 + y2)
R2L (z)
](6)
here PL is the laser power, RL(z) is the effective radius of the laseream at a distance z = z0 − z from the beam waist position z0ith R0L radius for the laser beam and far-field divergence angle �L .L(z) is expressed as [19]
L(z) =√R2
0L+ 4�2
L (z0 − z)2 (7)
The laser power intensity that is attenuated by powder streamith dz distance could be calculated based on Mie’ theory [18,24]
I = −I(x, y, z)n(x, y, z)dz (8)
here I(x, y, z) is the laser intensity at point (x, y, z), the extinc-ion cross section of a sphere particle ( = Qext�r2
p ), Qextthe extinctoefficient, and rp is the mean radius of the particles. n(x, y, z)cane calculated by
(x, y, z) = 2mvpmp�r2(z)
exp
⎡⎣−
2
[x2 +
[(y − H/tan ϕ)sinϕ − (z − H)cos ϕ
]2]
r2(z)
⎤⎦(9)
In LPF-AM process, as the particle size is much bigger thanhe laser wavelength, it is reasonable to assume that the extinc-ion coefficient Qext = 1[18,25] and most of the attenuated lasernergy is absorbed by the particle. Eq. (8) is derived from the first-rder approximation of the Mie’s theory, which calculates the totalttenuation or extinction power for the laser beam travels throughhe powder stream and is valid when 2�rp/�L < 300[18]. In thistudy, the average particle radiusrp = 42(�m), laser wavelengthL = 1.06(�m), therefore the condition is satisfied. We should pointut that this criterion is only considered when the scattering is
ncluded for total attenuated power calculation. But in the LPF-AMrocess, rp is normally much larger than �L , the powder absorption
s the predominant attenuation type. Thus, Eq. (8) can be directlysed based on Lambert-Beer law without considering this condition8,20,21].
As shown in Fig. 1, the powder stream and laser beam will benteracted with each other after point P. The attenuated laser beamntensity IA(x, y, z) may be calculated with the integration of Eq. (8)ver the interaction length in z-axis as
A(x, y, z) = I(x, y, z)exp
⎡⎣−
zp(x,y)∫z
n(x, y, z)dz
⎤⎦ (10)
here zp(x, y) is the upper surface of the powder stream, which ispproximated with the powder stream top boundary line zp(y)
p(y) = K + (y − K/ tan ϕ) · tan(ϕ − �), (K = H + r0 sin ϕ/ tan �, ϕ > 0) (11)
The powder absorbs energy from the laser beam during theirnteraction, and the absorbed energy increases the particles tem-erature. Based on assumption 3, the temperature increment T
x, y, z) − T0 = 12�k
�=rL (z)∫�=−rL (z)
∫ �=√
r2L
(z)−�2
�=−√
r2L
(z)−�2
[ˇwIA(�, �, z) + cp�(�, �, z)(Tp(�, �, z) − T
or time interval t = dz/vp sin ϕ follows the energy balance equa-ion
IA(x, y, z)�r2P�t = cp�p
43�r3P�T (12)
cturing 12 (2016) 90–99 93
where is the powder laser absorptivity, cp the material specificheat capacity, and �p is the average particle density. IntegratingEq. (12) over the interaction length in z-axis allows the particletemperature Tp(x, y, z) to be calculated as
Tp(x, y, z) = T0 + 3ˇ4 sin ϕvpcp�PrP
|zp(y)∫z
IA(x, y, z)dz| (13)
where zp(y) = zp(−y) is the symmetrical line of zp(y) about z-axis,and T0 is the ambient temperature. The path of integration fromz to zp(y) was used to approximate the particle traveling distancecomponent in the laser beam transverse direction.
As the powder impinges onto the melt pool, it draws energy toincrease its enthalpy to that of the melt pool in a short time [25].Thus, the heated powder energy intensity Ip(x, y, z) is expressedas a negative energy source. It should be noted that the heatedpowder does add positive energy to the melt pool, therefore thenegative energy source defining here is used to couple the powdermass flow with the melt pool under the consideration of melt poolenergy variation due to the added powder.
Ip(x, y, z) = cp�(x, y, z)[Tp(x, y, z) − Tm
](14)
2.3. Thermal conduction on substrate
On the substrate surface, the coming energy from the attenuatedlaser beam IA(x, y, z) and heated powder flux Ip(x, y, z) are summedup and treated as a bulk heating source. Thus, the resultant energysource intensity Inet(x, y, z)
Inet(x, y, z) = IA(x, y, z) + Ip(x, y, z) (15)
For a moving heat source on a semi-infinite work-piece sur-face, the temperature field T(x, y, z) could be expressed based onRosenthal’s equation [26]
T(x, y, z) − T0 = PL2�k
e−v(x+R)/2˛
R, R =
√x2 + y2 + z2, (16)
where PL is the laser beam power, k the thermal conductivity, thethermal diffusivity, and v is the process velocity. With consideringthe resultant energy intensity distribution, the temperature fieldon substrate is derived by integrating Eq. (16) over the laser beamarea based on superposition.
exp[−�(y − � + R)/2˛
]R
d�d�, R =√
(x − �)2 + (y − �)2 + z2 (17)
where ˇw is the substrate laser power absorptivity. In order toapproach reality more precise platform, the latent heat of fusion,thermo-capillary phenomena (Marangoni effect) and the varyinglaser power absorptivity (Brewster effect) are taking into consider-ation with the following approximations.
• The effect of latent heat fusion Lf on temperature distributioncan be approximated by increasing the specific heat capacity c∗
as [27]
c∗p = LfTm − T0
+ cp (18)
• The effect of Marangoni flow can be accounted by using the mod-ified thermal conductivity k∗ with a correction factor � as [7]
k∗(T) = �k(Tm), T > Tm (19)
• The absorption of an inclined plane for a linearly polarized laserbeam is affected by the plane inclination angle (Brewster effect)

94 Y. Huang et al. / Additive Manuf
ˇ
wttaD
�
2
b
T
ac⎧⎪⎪⎪⎪⎨⎪⎪⎪⎪⎩b
˝
w˝thop
z
Fig. 3. Schematic diagram for melt pool geometry.
[11]. For our case, the laser beam is circularly polarized and theabsorptivity ˇw(�) can be expressed as [6,26]
w(�) = ˇw(0)(1 + ˛w�) (20)
here � is the inclination angle, ˇw(0) the laser power absorp-ivity for a flat plane, and ˛w is a constant coefficient depends onhe material. For the sake of simplification, the inclination angle ispproximated based on the clad height h and laser beam diameter
= tan−1(h
D) (21)
.4. Melt pool geometry
Melt pool projection limits on substrate surface is approximatedy the solid-liquid line. Eq. (17) is simplified as
(x, y, z) − T0 = � (x, y, z) (22)
As shown in Fig. 3, points A, B, C and D are located on the bound-ry of the melt pool, according to Eq. (22), the coordinate valuesan be calculated as
� (yA, 0, 0) = Tm − T0, yA > 0
� (yB, 0, 0) = Tm − T0, yB < 0
� (0, xD, 0) = Tm − T0, xD > 0
� (0, xC, 0) = Tm − T0, xC < 0
(23)
The projection of the melt pool on substrate plane has theoundary ˝
= {yB ≤ y ≤ yA, xC ≤ x ≤ xD} , L = yA − yB, W = |xC | = |xD| (24)
here L and W are the melt pool length and width for boundary, respectively. The boundary of the melt pool is approximated by
wo half ellipses with same minor semi-axis of W/2 (The left partas a major semi-axis of |yB| and the right part has major semi-axisf |yA|). With considering the melt pool top surface boundary as a
arabolic curve, the melt pool top surface is expressed as [12](x, y) =[
−h (y − yB)2
(yA − yB)2+ h
]· (1 − 4x2
W2(y)), (x ∈ [xC , xD] , y ∈ [yB, yA]) (25)
acturing 12 (2016) 90–99
The width of the melt pool W(y) can be expressed as
W(y) =
⎧⎪⎪⎨⎪⎪⎩W ·
√(1 − y2
yA2), y ≥ 0
W ·√
(1 − y2
yB2), y < 0
(26)
2.5. Clad geometry
With dividing the substrate surface into small elemental patchesdS, each patch is so small that the powder flow density over it isessentially uniform. The powder mass dm that impinged onto dS inan elemental elapsed time can be approximated as
dm = �(x, y, 0) · dS · vp sin ϕ (27)
The clad height on dS area can be calculated based on the sumof the powder impinging onto it during the dwelling time
hdS = 1�PdS
D/�∫0
dmdt (28)
Then, for any point within the melt pool boundary, the cladheight can be derived as
h(x, y) = limı→0hdS = 2 sin ϕ Dm
v�P�r2(z = 0)exp[− 2[x2 + [(y − H/tan ϕ) sin ϕ + H cos ϕ]2]
r2(z = 0)],
(x, y) ∈ ˝
(29)
where ı is the largest diameter of patch dS. Based on Eq. (29), theoriginal clad height h0 is estimated with an average value over thelaser beam spot boundary and the process clad height h (along thelaser scanning direction) is calculated over the melt pool boundary˝. The clad width is approximated with the melt pool width W(y)as expressed by Eq. (26).
2.6. Catchment efficiency
The melt pool has a curved top surface as derived in Section 2.4,which has an inclined angle with the substrate surface. Particlesthat fall into the melt pool surface are considered to be effectivelyintegrated with melt pool based on assumption 4. To calculate themelt pool effective area in the coming powder stream, the meltpool is approximated by an inclined surface S1, which is then pro-jected to powder transverse planes S2 and S3 that cuts through thehighest and lowest point of the melt pool top surface, respectively(see Appendix B). The particles number probability density for perunit time per unit area on powder stream transverse plane can beexpressed as
f (x′, y′, z′) = n(x′, y′, z)+∞∫−∞
+∞∫−∞
n(x′, y′, z′)dx′dy′
= 2�rp2(z′)
exp
[− 2(x′2 + y′2)
rp2(z′)
](30)
Then the catchment efficiency can be derived as the integrationof the particle number probability over the melt pool projectionarea on the powder transverse plane. By integrating Eq. (30) overthe effective projection area AS2 and AS3 , the overall catchmentefficiency is derived as∫ ∫ ∫ ∫
� =AS2
f (x′, y′, z′)dx′dy′ +AS3
f (x′, y′, z′)dx′dy′
2(31)
Y. Huang et al. / Additive Manufacturing 12 (2016) 90–99 95
F nuation (b) Attenuated laser intensity loss by Inconel 625 powder (m = 7(g/ min),PL =1
3
pb
rpuomim4
sot(mi
4
NMtOipf
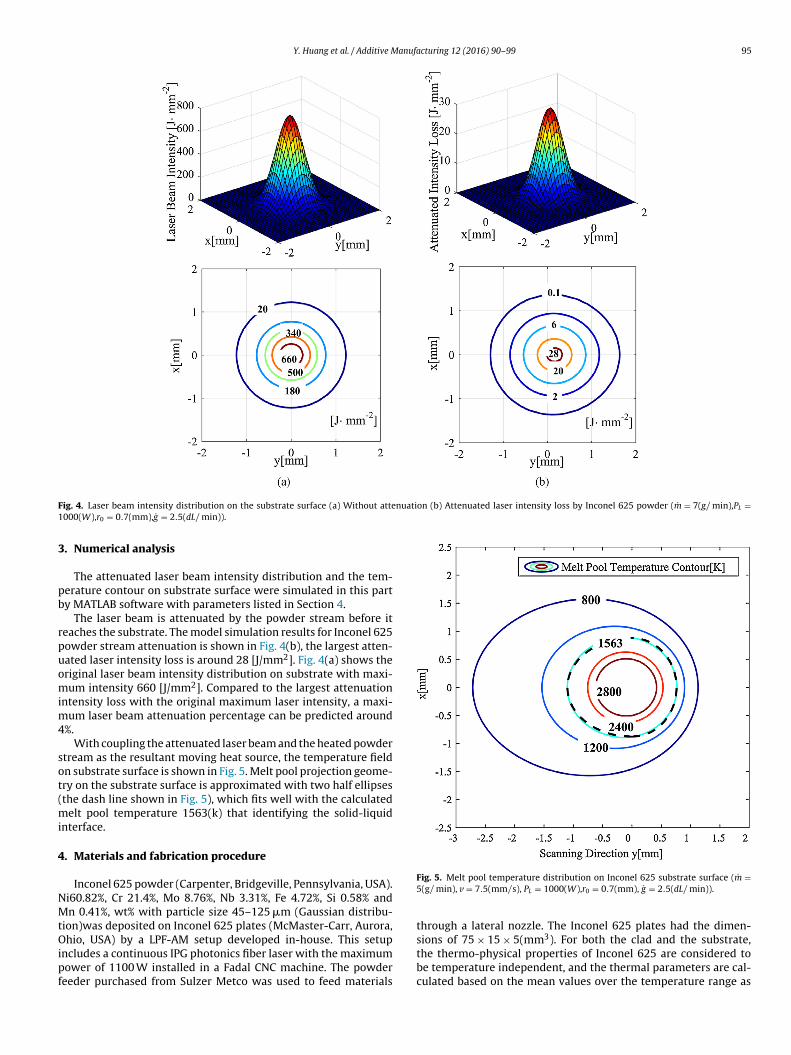
ig. 4. Laser beam intensity distribution on the substrate surface (a) Without atte000(W),r0 = 0.7(mm),g = 2.5(dL/ min)).
. Numerical analysis
The attenuated laser beam intensity distribution and the tem-erature contour on substrate surface were simulated in this party MATLAB software with parameters listed in Section 4.
The laser beam is attenuated by the powder stream before iteaches the substrate. The model simulation results for Inconel 625owder stream attenuation is shown in Fig. 4(b), the largest atten-ated laser intensity loss is around 28 [J/mm2]. Fig. 4(a) shows theriginal laser beam intensity distribution on substrate with maxi-um intensity 660 [J/mm2]. Compared to the largest attenuation
ntensity loss with the original maximum laser intensity, a maxi-um laser beam attenuation percentage can be predicted around
%.With coupling the attenuated laser beam and the heated powder
tream as the resultant moving heat source, the temperature fieldn substrate surface is shown in Fig. 5. Melt pool projection geome-ry on the substrate surface is approximated with two half ellipsesthe dash line shown in Fig. 5), which fits well with the calculated
elt pool temperature 1563(k) that identifying the solid-liquidnterface.
. Materials and fabrication procedure
Inconel 625 powder (Carpenter, Bridgeville, Pennsylvania, USA).i60.82%, Cr 21.4%, Mo 8.76%, Nb 3.31%, Fe 4.72%, Si 0.58% andn 0.41%, wt% with particle size 45–125 �m (Gaussian distribu-
ion)was deposited on Inconel 625 plates (McMaster-Carr, Aurora,
hio, USA) by a LPF-AM setup developed in-house. This setupncludes a continuous IPG photonics fiber laser with the maximumower of 1100 W installed in a Fadal CNC machine. The powder
eeder purchased from Sulzer Metco was used to feed materials
Fig. 5. Melt pool temperature distribution on Inconel 625 substrate surface (m =5(g/ min), v = 7.5(mm/s), PL = 1000(W),r0 = 0.7(mm), g = 2.5(dL/ min)).
through a lateral nozzle. The Inconel 625 plates had the dimen-3
sions of 75 × 15 × 5(mm ). For both the clad and the substrate,the thermo-physical properties of Inconel 625 are considered tobe temperature independent, and the thermal parameters are cal-culated based on the mean values over the temperature range as

96 Y. Huang et al. / Additive Manufacturing 12 (2016) 90–99
Table 1Inconel 625 thermo-physical properties [28].
Density �P [Kg/m3] Thermal conductivity k[W m−1 K−1]
Specific heat capacity C[J kg−1 K−1]
Melting temperatureTm [K]
8440 9.8(21 ◦C)–25.6 (1000 ◦C) 410(21 ◦C)–670 (1090 ◦C) 1563(1290 ◦C)
Table 2Laser metal direct deposition process parameters.
Parameters Values Parameters Values
Process velocity (v) 3, 4.5, 6, 7.5 (mm/s) Laser power (PL) 1000(W)Powder feed rate (m) 5, 7 (g/ min) Absorptivity (ˇ) 35%[29]Fiber laser wavelength(�L) 1.06 (�m) Latent heat of fusion (Lf ) 204500(J/Kg)[29]Beam waist radius (R0L) 0.43(mm) Far-field divergence angle (�L) 0.02 (rad)Beam waist position(z0) 19.8 (mm) Argon gas feed rate (g) 2.5 (dL/ min)Nozzle height (H) 7(mm) Nozzle angle (�) 60◦
Nozzle internal radius (r0) 0.7 (mm) Laser spot diameter (D) 1.8 (mm)Nozzle tube thickness (tn) 0.8 (mm) Brewster effect coefficient (˛w) 0.0196Correction factor (�) 2.5
F1m
ltEp
ddpeowm
5
livsewwc
a
ig. 6. Inconel 625 single layer deposition profile by LPF-AM, m = 7(g/ min) (a)E =85.2(J · mm−2), (b) E = 123.5(J · mm−2), (c) E = 92.6(J · mm−2) (d) E = 74.1(J ·m−2).
isted in Table 1. Single layer deposition experiments were done toest the model with varying process velocity and powder feed rate.ach group experiment was repeated five times and the processarameters are listed in Table 2.
To measure the LPF-AM powder catchment, the attached pow-er was evaluated by weighing the substrate before and aftereposition, the total ejected powder was calculated with theroduct of the powder feed rate and deposition time. Then thexperimental catchment efficiency was evaluated as the ratiof that attached powder weight divided by ejected powdereight. The clad width and clad height were measured by opticalicroscopy.
. Results and discussion
During the clad formation in LPF-AM, the input energy from theaser beam is used to heat the moving substrate and the incom-ng powder, which is mainly influenced by laser power, processelocity and powder feed rate. In this paper, a combined parameterpecific energy E = PL/vD[19], which describes the energy deliv-red by the laser power per unit feed rate area of the laser track,as used to address the process and validate the analytical model
ith comparing the modeled and measured clad dimension andatchment efficiency.Fig. 6 shows the single layer deposition profiles of Inconel 625
t different specific energy. As seen, the layer profiles keep smooth
Fig. 7. Model predicted and measured catchment efficiency (m = 5(g/ min)).
with a higher specific energy ((a) (b) and (c)). And both the cladwidth and height increase with the increasing of specific energy.
Fig. 7 shows that the built model successfully predicts the exper-imentally observed trend of that catchment efficiency increasingwith increasing specific energy. But it also shows that there willbe great gaps between the predicted and the measured catchmentvalue if the laser power absorptivity is set to a stable value (30%,40%, 50% or 60%). On the contrary, as the Brewster effect describes,the results match well by using varying laser power absorptivity.In this paper, an average Brewster effect coefficient ˛w was calcu-lated by adjusting the laser power absorptivity ˇw(�) to match themeasured catchment efficiency based on Eqs. (20)–(21).
Fig. 8 compares the modeled and measured clad widths, cladheights and catchment efficiencies with varying specific energyand powder feed rate. The experimental results have low standarddeviation values, indicating an excellent repeatability and preci-sion. The model matches well with the experimental results. Withincreasing specific energy, the clad width, melt pool length, cladheight and catchment efficiency increase as well, which is consis-tent with the results in references [13,14]. For a given condition in
the LPF-AM process, the higher specific energy means there is morelaser power at per unit area of laser track, which enlarges the meltpool area as well as the powder catchment.
Y. Huang et al. / Additive Manufacturing 12 (2016) 90–99 97
rison,
dawoaecaiialmtvfs
atsoaat
Fig. 8. Experimental and model predicted results compa
From Fig. 8(a), (c) and (d), it can be seen that for a given pow-er feed rate (m = 5(g/ min)) the predicted clad width, clad heightnd catchment efficiency are bigger than the measured results butith increasing the specific energy, the difference gap is smaller
r disappear, which may be attributed to an elevated radiativend convective heat losses. This causes the melt pool not to havenough energy to melt the total incoming powder at lower spe-ific energy. But for higher specific energy, the measured resultsre bigger than the predicted results. The higher specific energyncreases the powder catchment as well as the clad height andts non-planar geometrical features. With an elevated clad heightt a relatively fixed width, the wetting angle increases thus theaser power absorptivity is increased due to Brewster effect. The
odel uses an average Brewster effect coefficient to compensatehe increasing absorptivity, which is smaller than the real time-arying laser power absorptivity. This may be one of the reasonsor the disagreement of the measured and predicted clad heighthown in Fig. 8 (c) for a higher powder feed rate (m = 7(g/ min)).
There are other sources of discrepancies between the modellingnd experimental results. Major source of errors may attribute tohe simplification assumptions listed in Section 2. In particular, con-idering the thermal/optical parameters based on the mean values
ver the temperature range may highly contribute to the discrep-ncies. The assumptions to ignore gravity, drag force, convection,nd radiation losses, and consider effective particle attachment tohe melt pool, provide a reasonable solution to couple the mass(a), (b) and (c) clad geometry, (d) catchment efficiency.
flux (powder stream), the heat flux (laser beam) and the melt poolwith analytical functions. The temperature independent thermalparameter calculation simplifies the model and provides closedform solutions for the powder stream and melt pool temperatureanalytical integrations.
In the range 100–190 (J/mm−2) for the specific energy, themaximum percentage difference for the model predicted andexperimental results are 6.2% for the clad width, 7.8% for the cladheight and 6.8% for the catchment efficiency. These results validatethe accuracy of the model.
The developed model has the potential to effectively be usedfor designing comprehensive controllers for the process by incor-porating into high speed hardware platform. And the model canbe expanded to multi-nozzle LPF-AM setups [e.g., LENS technologyfrom Optomec] by combining each single powder stream as shownin references [16,25]. The modified procedure for adding multiplenozzles to the analytical model is listed as follows:
1. Build the effective radius ri for each single powder stream withthe optical method in Appendix A, leading to new equationsof �i(x, y, z), ni(x, y, z), IAi (x, y, z) and Ipi (x, y, z)for each nozzlebased on Eqs. (1)–(14).
2. For the powder stream above the consolidation plane, the com-bined powder flux (�(x, y, z), n(x, y, z)Ip(x, y, z)) and laser fluxIA(x, y, z) can be developed with integrating each nozzle flux(from step 1) based on superposition principle.

9 anufacturing 12 (2016) 90–99
3
4
5
6
aptmpAomtccpu
A
t(
A
rceoltp
TP
8 Y. Huang et al. / Additive M
. New resultant energy source intensity Inet(x, y, z) can be builtwith Eq. (15).
. For the powder stream beyond the consolidation plane, it hastwo options depending on the powder stream distribution [16].(1) For lower powder velocity nozzle, experiments in refer-ences [21,30] have testified that the powder stream is Gaussiandistribution. New effective radius and nozzle flux can be builtwith repeating steps 1–3. (2) For high powder velocity nozzle,the powder stream beyond the consolidation plane will keepdiscrete and divergent, it is recommended to continue the inte-gration model above the consolidation plane and rebuild theIp(x, y, z),IA(x, y, z)and Inet(x, y, z)based on Eqs. (10)–(15).
. Build the melt pool 3D geometry, clad geometry and processcatchment efficiency model based on Eqs. (17)–(31) with incor-porating the results from steps 1–3.
. Conclusion
An analytical model of LPF-AM was developed in this paper. Thettenuated laser power and heated powder stream flow were cou-led together with Gaussian intensity distribution. By substitutinghe coupled energy into the Rosenthal’s 3D moving heat source
odel, and combining with the calculated clad height, the 3D meltool geometry was built with consideration of the Brewster effect.
solution to calculate the process catchment efficiency was devel-ped with considering the powder concentration distribution, theelt pool inclination and boundary variation. Experimental valida-
ion using Inconel 625 shows the model can accurately predict thelad geometry as well as the process catchment efficiency in thease of high clad quality expected. The built analytical model canrovide a proper platform for the design of controllers for LPF-AMsing high speed hardware.
cknowledgements
The authors would like to acknowledge the financial support ofhe Natural Sciences and Engineering Research Council of CanadaNSERC) and China Scholarship Council (CSC).
ppendix A. Powder stream effective radius
The effective radius of powder stream is defined as one thateduced to 1/e2 of the peak concentration value in the streamenter. As the luminance distribution in the CCD camera imagexpresses the particles concentration in the powder stream based
n Mie theory, so the effective radius can be measured by theuminance value of the CCD camera image that reduced to 1/e2ofhe center luminance value. The grey values of the images for theowder stream in transverse direction were measured by ImageJ
able A1owder stream effective divergence angles.
Powder feed rate (g/min) Argon gasfeed rate(dL/min)
r0 =0.35(mm)
DivergenceAngle (◦)
Valid for(mm)
3 2.5 4.5 ± 0.2 Z < 18
3 3.5 4.7 ± 0.2 i < 18
3 4.5 5.2 ± 0.2 Z < 17
5 2.5 5.7 ± 0.2 Z < 17
5 3.5 6.4 ± 0.2 Z < 17
5 4.5 6.6 ±0.2 Z < 17
7 2.5 7.3 ± 0.2 Z < 16
7 3.5 7.7 ± 0.2 Z < 16
7 4.5 8.1 ± 0.2 Z < 16
Fig. A1. Powder stream effective divergence angle measurement.
software, which shows a Gaussian distribution (Fig. A1). Then theeffective radius of powder stream r(z) at a distance z with thenozzle outlet can be measured in ImageJ. For simplification of themodeling, the powder stream is approximated with circular conegeometry. And the effective radius of powder stream can be derivedas
r(z) = r0 + z tan � (A.1)
In which � is the effective divergence angle, r0 is the nozzle inter-nal radius. Cold flow experiments were designed to measure theeffective divergence angle with various settings of nozzle internaldiameter, argon gas velocity and powder feed rate by a CCD camera(see Table A1).
Appendix B. Effective melt pool projection area
To calculate the effective melt pool projection area, the meltpool top surface is approximated by the inclined surface S1 that cutsthrough its highest point E and lowest point A. Then S1 is projectedto powder transverse planes S2 and S3 with the effective projection
area AS2 and AS3 as shown in Fig. B1.Based on the 3D melt pool geometry function built in Section2.4 (Eqs. (25)–(26)), the melt pool projections on inclined surfacesS2 and S3 are approximated with the geometry of ellipses.
r0 =0.7(mm)
r0 =0.8(mm)
DivergenceAngle (◦)
Valid for(mm)
DivergenceAngle (◦)
Valid for(mm)
5.8 ± 0.2 Z < 20 6.4 ± 0.2 Z < 246 ±0.2 Z < 20 6.8 ± 0.2 Z < 246.4 ± 0.2 Z < 19 7.1 ± 0.2 Z < 236.8 ± 0.2 Z < 18 7.6 ± 0.2 i < 248 ± 0.2 Z < 18 8.1 ± 0.2 Z < 228.4 ± 0.2 i < 18 8.5 ± 0.2 Z < 228.6 ± 0.2 Z < 17 9 ±0.2 Z < 218.9 ± 0.2 Z < 17 9.5 ± 0.2 Z < 209.3 ± 0.2 Z < 17 9.8 ± 0.2 Z < 20

Y. Huang et al. / Additive Manufa
Clad
H
φ
y
z
z'
A
E
S1
0
Melt Poo l Top Surface
h
⎧⎪⎪⎨⎪⎪⎩⎧⎪⎪⎨⎪⎪⎩wArip
R
[
[
[
[
[
[
[
[
[
[[
[
[
[
[
[
[
[
[
S2S3
Fig. B1. Melt pool projection on powder transverse plane.
Projection area AS2 :
y′2
�12+ x′2
w2= 1, z′ = zS2 , y′ ∈ [−�1, 0] , x′ ∈
[−w
2,w
2
]y′2
�22+ x′2
w2= 1, z′ = zS2 , y′ ∈ [0, �2] , x′ ∈
[−w
2,w
2
] (B.1)
Projection area AS3 :
y′2
�12+ x′2
w2= 1, z′ = zS3 , y′ ∈ [−�1, 0] , x′ ∈
[−w
2,w
2
]y′2
�22+ x′2
w2= 1, z′ = zS3 , y′ ∈ [0, �2] , x′ ∈
[−w
2,w
2
] (B.2)
here l1 and l2 is the major semi-axis of the ellipse projection areas2 and AS3 , respectively, and can be calculated based on geometricelationships as shown in Fig. B1. w is the minor semi-axis, whichs parallel with the substrate surface and is equal to half of the meltool projection width on substrate surface.
eferences
[1] A. Fathi, A. Khajepour, E. Toyserkani, M. Durali, Clad height control in lasersolid freeform fabrication using a feedforward PID controller, Int. J. Adv.Manuf. Technol. 35 (2006) 280–292, http://dx.doi.org/10.1007/s00170-006-0721-1.
[2] E. Toyserkani, A. Khajepour, S. Corbin, Application of experimental-basedmodeling to laser cladding, J. Laser Appl. 14 (2002) 165, http://dx.doi.org/10.2351/1.1494079.
[3] I. Tabernero, A. Lamikiz, E. Ukar, L.N. López de Lacalle, C. Angulo, G. Urbikain,Numerical simulation and experimental validation of powder fluxdistribution in coaxial laser cladding, J. Mater. Process. Technol. 210 (2010)2125–2134, http://dx.doi.org/10.1016/j.jmatprotec.2010.07.036.
[4] S.Y. Wen, Y.C. Shin, J.Y. Murthy, P.E. Sojka, Modeling of coaxial powder flowfor the laser direct deposition process, Int. J. Heat Mass Transf. 52 (2009)5867–5877, http://dx.doi.org/10.1016/j.ijheatmasstransfer.2009.07.018.
[5] Y. Lee, M. Nordin, S. Babu, D. Farson, Influence of fluid convection on weld
pool formation in laser cladding, Weld. J. 93 (2014) 292s–300s.[6] E. Toyserkani, A. Khajepour, S. Corbin, Three-dimensional finite elementmodeling of laser cladding by powder injection: effects of powder feedrateand travel speed on the process, J. Laser Appl. 15 (2003) 153, http://dx.doi.org/10.2351/1.1585087.
[
[
cturing 12 (2016) 90–99 99
[7] E. Toyserkani, A. Khajepour, S. Corbin, 3-D Finite element modeling of lasercladding by powder injection: effects of laser pulse shaping on the process,Opt. Lasers Eng. 41 (2004) 849–867, http://dx.doi.org/10.1016/S0143-8166(03)00063-0.
[8] X. He, J. Mazumder, Transport phenomena during direct metal deposition, J.Appl. Phys. 101 (2007) 053113, http://dx.doi.org/10.1063/1.2710780.
[9] M. Alimardani, E. Toyserkani, J.P. Huissoon, A 3D dynamic numericalapproach for temperature and thermal stress distributions in multilayer lasersolid freeform fabrication process, Opt. Lasers Eng. 45 (2007) 1115–1130,http://dx.doi.org/10.1016/j.optlaseng.2007.06.010.
10] A.J. Pinkerton, Advances in the modeling of laser direct metal deposition, J.Laser Appl. 27 (2015) S15001, http://dx.doi.org/10.2351/1.4815992.
11] M. Picasso, C.F. Marsden, J.-D. Wagniére, a Frenk, M. Rappaz, A simple butrealistic model for laser cladding, Metall. Mater. Trans. A 25 (1994) 281–291,http://dx.doi.org/10.1007/BF02665211.
12] A. Fathi, E. Toyserkani, A. Khajepour, M. Durali, Prediction of melt pool depthand dilution in laser powder deposition, J. Phys. D: Appl. Phys. 39 (2006)2613–2623, http://dx.doi.org/10.1088/0022-3727/39/12/022.
13] H. Tan, J. Chen, F. Zhang, X. Lin, W. Huang, Estimation of laser solid formingprocess based on temperature measurement, Opt. Laser Technol. 42 (2010)47–54, http://dx.doi.org/10.1016/j.optlastec.2009.04.016.
14] S. Zhou, X. Dai, H. Zheng, Analytical modeling and experimental investigationof laser induction hybrid rapid cladding for Ni-based WC composite coatings,Opt. Laser Technol. 43 (2011) 613–621, http://dx.doi.org/10.1016/j.optlastec.2010.09.001.
15] X. Gong, Y. Zhang, M. Liu, Powder transport model for laser cladding by lateralpowder feeding: I. Powder flow field with cylindrical distribution, Int. J. Adv.Manuf. Technol. 67 (2012) 2501–2509, http://dx.doi.org/10.1007/s00170-012-4667-1.
16] A.J. Pinkerton, An analytical model of beam attenuation and powder heatingduring coaxial laser direct metal deposition, J. Phys. D: Appl. Phys. 40 (2007)7323–7334, http://dx.doi.org/10.1088/0022-3727/40/23/012.
17] J. Lin, A Simple model of powder catchment in coaxial laser cladding, Opt.Laser Technol. 31 (1999) 233–238, http://dx.doi.org/10.1016/S0030-3992(99)00046-8.
18] A. Frenk, M. Vandyoussefi, J. Wagniere, Analysis of the laser-cladding processfor stellite on steel, Mater. Trans. B (1997), http://dx.doi.org/10.1007/s11663-997-0117-0.
19] E. Toyserkani, A. Khajepour, S. Corbin, Laser cladding, CRC Press, 2004.20] J. Lin, Concentration mode of the powder stream in coaxial laser cladding,
Opt. Laser Technol. 31 (1999) 251–257, http://dx.doi.org/10.1016/S0030-3992(99)00049-3.
21] A.J. Pinkerton, L. Li, Modelling powder concentration distribution from acoaxial deposition nozzle for laser-based rapid tooling, J. Manuf. Sci. Eng. 126(2004) 33, http://dx.doi.org/10.1115/1.1643748.
22] N. Yang, Concentration model based on movement model of powder flow incoaxial laser cladding, Opt. Laser Technol. 41 (2009) 94–98, http://dx.doi.org/10.1016/j.optlastec.2008.03.008.
23] G. Zhu, D. Li, A. Zhang, G. Pi, Y. Tang, The influence of laser and powderdefocusing characteristics on the surface quality in laser direct metaldeposition, Opt. Laser Technol. 44 (2012) 349–356, http://dx.doi.org/10.1016/j.optlastec.2011.07.013.
24] C. Bohren, D. Huffman, Absorption and scattering of light by small particles(2008) http://dx.doi.org/10.1002/9783527618156.
25] A.J. Pinkerton, R. Moat, K. Shah, L. Li, M. Preuss, P.J. Withers, A verified modelof laser direct metal deposition using an analytical enthalpy balance method.http://eprints.lancs.ac.uk/59694/, 2007 (accessed 28.04.16).
26] W. Steen, J. Mazumder, Laser material processing, Springer Science & BusinessMedia, 2010.
27] S. Brown, H. Song, Finite element simulation of welding of large structures, J.Eng. Ind. 114 (1992) 441, http://dx.doi.org/10.1115/1.2900696.
28] Special Metals, Inconel alloy 625. accessed 7.02.16, http://www.specialmetals.com/assets/documents/alloys/inconel/inconel-alloy-625.pdf .
29] N. Ahmed, K.T. Voisey, D.G. McCartney, Investigation into the effect of beamshape on melt pool characteristics using analytical modelling, Opt. Lasers Eng.48 (2010) 548–554, http://dx.doi.org/10.1016/j.optlaseng.2009.12.013.
30] J. Lin, Laser attenuation of the focused powder streams in coaxial lasercladding, J. Laser Appl. 12 (2000) 28, http://dx.doi.org/10.2351/1.521910.