A Competitive Realities Report for the Evansville Metro ...ftpcontent4.worldnow.com/wfie/Images/EVV...
84
1 E April 1, 2011 A Competitive Realities Report for the Evansville Metro and Southwest Indiana Region Prepared especially for the:
Transcript of A Competitive Realities Report for the Evansville Metro ...ftpcontent4.worldnow.com/wfie/Images/EVV...

1
E
April 1, 2011
A Competitive Realities Report for the Evansville Metro and Southwest Indiana Region
Prepared especially for the:
2
TABLE OF CONTENTS
ABOUT OUR COMPANIES ................................................................................................................ 3
INTRODUCTION AND METHODOLOGY ............................................................................................ 3
SECTION 1: ASSETS AND CHALLENGES ASSESSMENT ...................................................................... 5
SECTION 2: DASHBOARD INDICATORS SUMMARY ........................................................................ 15
SECTION 3: DEMOGRAPHIC & LABOR DYNAMICS ......................................................................... 17
SECTION 4: ECONOMIC DYNAMICS ............................................................................................... 34
SECTION 5: LOCAL SPECIALIZATION, COMPETITIVENESS & GROWTH .......................................... 51
CONCLUSION ................................................................................................................................. 70
APPENDICES ................................................................................................................................... 71

3
ABOUT OUR COMPANIES
INTRODUCTION AND METHODOLOGY
The Economic Development Coalition of Southwest Indiana
(EDC) retained Garner Economics, LLC, a nationally known
economic development and site location consulting firm based
in Atlanta to develop a regional economic development
strategy for the four county service area of the EDC consisting of Vanderburgh, Warrick, Gibson and
Posey Counties. Garner Economics has collaborated with Newmark Knight Frank of Chicago to assist in
this project related to key deliverables utilizing their expertise.
Our firms have assisted many local, regional and statewide
economic development organizations in creating proactive
business and community development strategies and
implementation guidance with the ultimate goal of quality jobs creation and capital investment. Our
combined companies’ site selection consulting experience has assisted volumes of corporate clients in
their expansion and relocation needs with a truly global reach. We are able to apply that knowledge of
what corporate investors consider important in their location search to our work with community
clients in devising “solutions that work”.
he Economic Development Coalition of Southwest
Indiana (EDC) retained Garner Economics, LLC in late
January of 2011 to conduct a regional economic
development strategy for the four county service area of the
EDC. The scope of services included analyzing the regional
economy, conduct an assets and challenges assessment of the
region from the eyes of a site location consultant, recommend
industry clusters suitable for the region based on our research
and analysis, and finally provide a set of implementable
recommendations that the stakeholders in the region can
utilize to enhance the economic well being of the region. Jay
Garner, President of Garner Economics, served as the lead
consultant with this project for the region. Tom Tveidt, research
economist for Garner Economics, provided the analytical analysis
and business target recommendations. Robert Hess and Tim Walden of Newmark Knight Frank (NKF)
were involved in analyzing the region’s assets and challenges and in recommendations for the EDC to
help in gaining a competitive advantage in business development and economic growth opportunities.
T
Map courtesy by the EDC of Southwest Indiana

4
This Competitive Realities Report is the first of three reports we are providing to the EDC. The second
report will consist of our industry cluster recommendations and the third and final report will be a
consolidation of all of the reports along with our conclusions and recommendations in how the region
can enhance its global competitiveness.
Our approach began with the Garner Economics team conducting an Assets and Challenges
assessment of the region. We have conducted hundreds of Assets and Challenges assessments (also
referred to as a SWOT analysis) on behalf of our economic development and corporate clients
throughout the United States. We apply many of the same criteria to assess a community that we use
when a corporate client engages us to evaluate communities on their behalf for possible corporate
investment. Our assessment, which follows in this report, is both an objective and subjective
evaluation of the community from the eyes of a site location consultant. Our Assets and Challenges
assessment allows us to document what problems exist in the region that constitutes barriers for
successfully achieving the vision of its leadership.
The objectives of this assessment are to:
● Identify key strengths to emphasize in economic development marketing efforts, and;
● Identify key weaknesses that may limit investment in the region so that remediation of these local challenges may occur.
A multi-day windshield tour was provided by representatives of the EDC to review those items that
were necessary for us to evaluate as outlined in our assets and challenges below. This research then
supplemented the economic analysis we conducted to identify the best possible opportunities for
business targets.
We then conducted focus groups and interviews with key stakeholders in the region. This gave us an
overview of how local businesses and residents evaluate the business climate of the area. We
facilitated eight focus groups over a two day period with seventy participants. Focus group categories
included large employers, small to midsized employers, elected/government officials,
entrepreneurs/start-ups, financing/banking, academia/career development, and design/engineering
(see the appendix for a summary of the focus groups).
Finally, as it relates to the completion of this Competitive Realities Report, we evaluated key
demographic and economic indicators for the region as compared to state and national trends as well
as the comparison of the Chattanooga, TN MSA and the Davenport-Moline-Rock Island, IA-IL MSA,
which were selected as benchmark communities by the EDC. These areas both have or had a high
concentration of similar industry specialization to the Evansville region, and all three MSA’s have
multiple states in their geography.
To enable readers a summary overview of the report’s main findings, a set of dashboard icons is
presented. Each finding has an accompanying icon to assist with interpretation. Readers are
encouraged to review the supporting data to gain a more complete understanding in those areas of
interest in the full report.

5
The Garner Economics team analyzed sixty five (65)
community factors as part of the assessment for the region. These
are many of the same factors that are used when we conduct a
site/community evaluation for a company that is considering a
new location, expansion, consolidation or closure.
SECTION 1: ASSETS AND CHALLENGES ASSESSMENT
he Garner Economics team analyzed sixty five (65) community
factors as part of the assessment for the region. These are
many of the same factors that are used when we conduct
a site/community evaluation for a company that is considering
a new location, expansion, consolidation or closure. Our
methodology was both objective - using published statistical
sources such as crime rate data and wage data, and
subjective - based on our many years of working in the
economic development profession and in representing
companies evaluating communities for investment. Tours of
the region took place in February and March as part of our
asset mapping methodology.
We define an Asset as a positive feature of the region that would
be evaluated and rated by the Garner Economics team as normal or
better. A challenge is considered by us as a deficiency that should be
addressed for future remediation and may be an impediment for economic
development if not resolved over time. Neutral is considered normal in the realm of economic
development opportunity and competitiveness.
T
REPORT DASHBOARD
Indicates the region is better (more positive) compared to a majority of the benchmark geographies, or points to a positive trend or asset within the region.
Indicates the region is neutral, neither positive nor negative. Indicator may represent an observation, or be in the middle of the benchmark geographies.
Indicates the region is worse compared to a majority of the benchmark geographies, or points to a negative trend or challenge within the region.

6
he Evansville region is
well positioned
geographically for access
to regional, national and in some
aspects, international markets.
The area is within a one day
drive of more than two-thirds of
the U.S. population. It has good
east/west access with I-64, but
its north/south access is
contingent on the successful
completion of I-69. Four rail
lines serve the area and the Port
of Indiana at Mount Vernon in
Posey County has a 30ft. river
depth. Companies like Shoe
Carnival however use a rail/truck
land bridge system to transport
imports from the Port of Long
Beach or other west coast ports
to area distribution centers. The
Port of Indiana’s focus is bulk commodities.
High speed internet service is slow. On multiple trips to Evansville, we experienced very slow
download times from various locations, including different hotels in the area. According to the
National Broadband Map, Evansville ranks 368 of 370 metros in the U.S. on upload and download
speeds (see endnote 8). This is a serious impediment for the attraction of certain IT types of
companies, and to mobile entrepreneurs that rely on the internet for their work.
The Evansville Regional Airport provides good air service for a region of its size. However, the schedule
is not necessarily business friendly. For example, it is difficult to do a day trip to and from Atlanta.
Currently, the first flight from ATL to EVV which is nonstop arrives in EVV at 10:25am. The last
departure from EVV back to ATL (non stop) is at 3:45pm. This only leaves a four hour window of work.
This provides a challenge for companies that are engaged in office/shared services and in some sales
positions.
ACCESS TO MARKETS RATING
Centrally located for major regional market 1
Centrally located for national market 2
Well positioned to serve international markets 3
Interstate highways 4
Rail service 5
Port facilities 6
Scheduled airfreight services
Within 1 hour of commercial air passenger service
7
General aviation airport capable of handling corporate aircraft
High speed internet services 8
Connection of local telephone company to national fiber optics network
9
T

7
During our focus group sessions,
many of the respondents who
are either employers, or who
serve as a resource to help train
employees for employers, cited
the difficulty to find and retain
skilled industrial, technical and
managerial talent. There was
near unanimity of that opinion
from most if not all of the 70
focus groups participants we
interviewed. The cost of labor is
comparable to the benchmark
regions we analyzed, except for
certain counties that are skewed
because of a dominate
employer. Southwest Indiana is
the home of the University of
Evansville, the University of
Southern Indiana and Oakland City University. Ivy Tech Community College and Vincennes University
both do a good job of providing a curriculum to meet the demands and needs of employers.
U of E offers civil, computer, electrical and mechanical engineering degrees and is a valuable asset to
the region with its degreed offerings. USI offers a BS degree in industrial supervision.
Many regions around the U.S. are experiencing the same challenges Southwest Indiana faces in finding
and retaining skilled talent. Those that are able to differentiate their regions with a method to attract
and retain people will flourish in a highly competitive global marketplace.
LABOR RATING
Availability of skilled industrial workers 10
Availability of skilled clerical workers
Availability of technicians and scientists
Availability of managerial personnel
Cost of labor 11
Quality of labor-management relations 12
Availability of post-secondary vocational training 13
Availability of free on-the-job training assistance 14
Within 1/2 hour of four year university/college and post graduate degrees
15
Availability of engineering program 16

8
Agricultural production is an
unsung asset in the region.
Posey and Gibson counties are
large growers of corn, soybean,
wheat, melons and sorghum
(see endnote 17). With a
movement by many food
processing manufacturers to
locate closer to the food
commodity, Southwest Indiana
can potentially position itself as a
suitable location for food
processing manufactures.
Coal production is dominant in
the region. We believe that
there is potential for energy research related to coal to be more of a factor in the area. This would
typically be done in cooperation with an academic institution, e.g. Indiana Center for Coal and
Technology Research at Purdue University.
Southwest Indiana has a high per capita ratio of both manufacturing employment and manufactures’
shipments compared to many other regions in the U.S. Shipments from the region are in excess of
$3.6 billion annually.
ACCESS TO RESOURCES RATING
Availability of agricultural products for food processing
17
Availability of minerals 18
Availability of manufacturing processes 19
Availability of business and professional services
Cost of electricity for industrial use 20
Availability of high quality electric service
Availability of uninterruptible natural gas
Availability of water/cost of water/sewer Varies by county
9
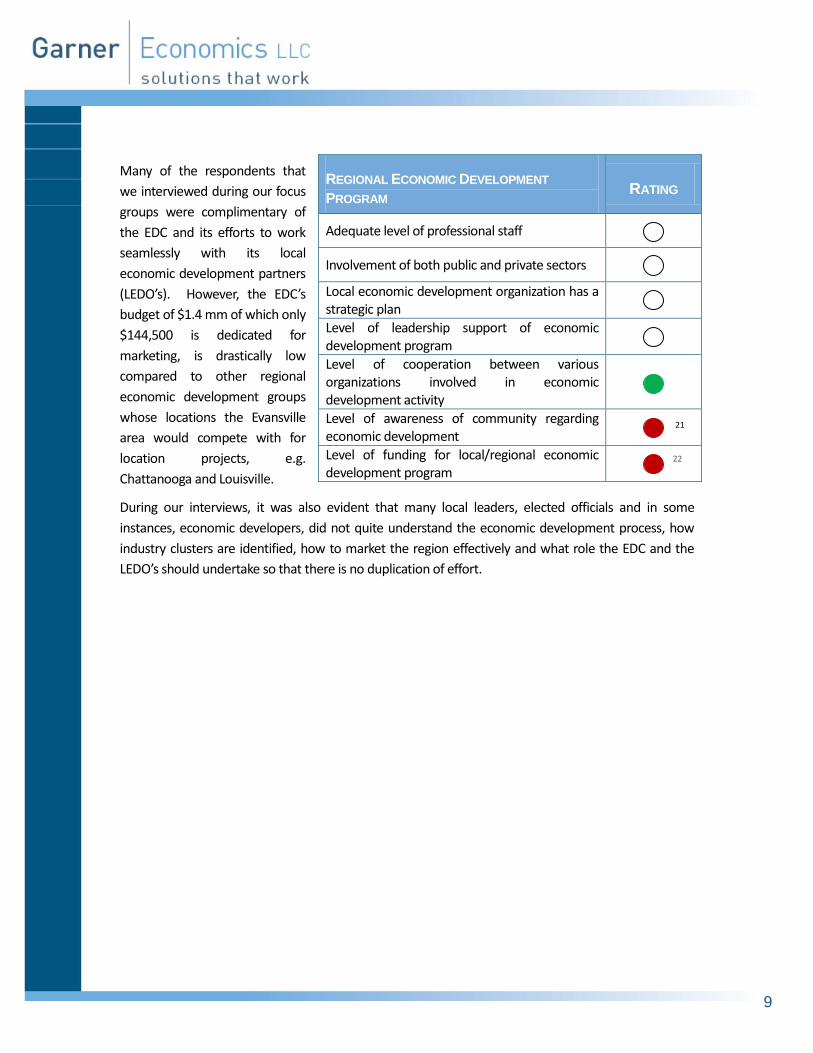
Many of the respondents that
we interviewed during our focus
groups were complimentary of
the EDC and its efforts to work
seamlessly with its local
economic development partners
(LEDO’s). However, the EDC’s
budget of $1.4 mm of which only
$144,500 is dedicated for
marketing, is drastically low
compared to other regional
economic development groups
whose locations the Evansville
area would compete with for
location projects, e.g.
Chattanooga and Louisville.
During our interviews, it was also evident that many local leaders, elected officials and in some
instances, economic developers, did not quite understand the economic development process, how
industry clusters are identified, how to market the region effectively and what role the EDC and the
LEDO’s should undertake so that there is no duplication of effort.
REGIONAL ECONOMIC DEVELOPMENT
PROGRAM RATING
Adequate level of professional staff
Involvement of both public and private sectors
Local economic development organization has a strategic plan
Level of leadership support of economic development program
Level of cooperation between various organizations involved in economic development activity
Level of awareness of community regarding economic development
21
Level of funding for local/regional economic development program
22

10
Clearly, one of the most
significant challenges in the
region is the lack of suitable and
available industrial and office
space related to industrial parks,
industrial sites and available,
quality class A office space.
There are available industrial
parks in Warrick County, but
most of what we saw during our
tour of the region was land that
may be for sale and with little to no infrastructure already to the location. It is not defined as a site
until there is an agreed to price on the property with infrastructure in place. As such, the region is site
deficient and our focus group participants said the same.
The availability of venture or
angel capital for entrepreneurs
and start up ventures related to
non retail enterprises is virtually
nonexistent in the region.
Entrepreneurial growth and the
need to attract and retain early-
stage, high-growth, innovative
companies is important for the region to grow economically. Many analysts and economists believe
that up to 70% of the net new jobs in this decade will be created by high potential entrepreneurial
companies in a variety of industries and niches.
ACCESS TO SPACE RATING
Availability of fully served and attractive industrial sites
23
Availability of fully served and attractive office sites
Reasonably priced sites
Availability of suitable industrial space
Availability of suitable office space
ACCESS TO CAPITAL RATING
Availability of tax-exempt financing for new industrial facilities
Availability of low interest loans for small business
Availability of venture capital from local sources for business startups
24
11
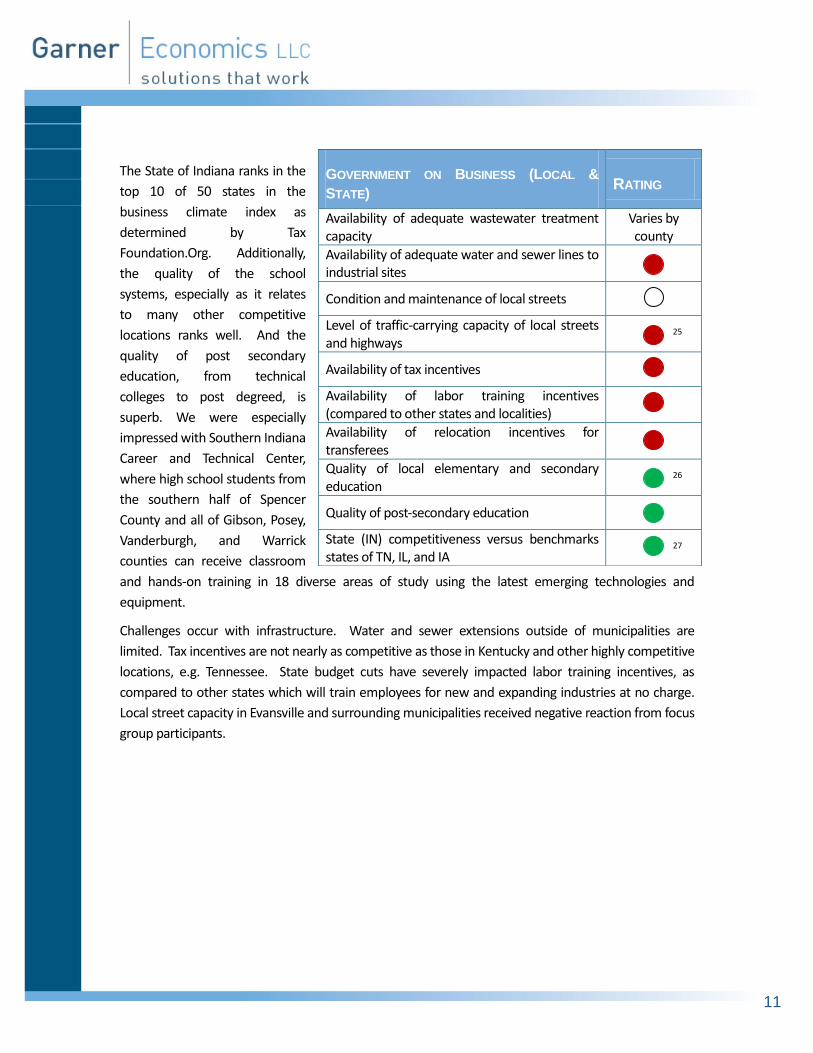
The State of Indiana ranks in the
top 10 of 50 states in the
business climate index as
determined by Tax
Foundation.Org. Additionally,
the quality of the school
systems, especially as it relates
to many other competitive
locations ranks well. And the
quality of post secondary
education, from technical
colleges to post degreed, is
superb. We were especially
impressed with Southern Indiana
Career and Technical Center,
where high school students from
the southern half of Spencer
County and all of Gibson, Posey,
Vanderburgh, and Warrick
counties can receive classroom
and hands-on training in 18 diverse areas of study using the latest emerging technologies and
equipment.
Challenges occur with infrastructure. Water and sewer extensions outside of municipalities are
limited. Tax incentives are not nearly as competitive as those in Kentucky and other highly competitive
locations, e.g. Tennessee. State budget cuts have severely impacted labor training incentives, as
compared to other states which will train employees for new and expanding industries at no charge.
Local street capacity in Evansville and surrounding municipalities received negative reaction from focus
group participants.
GOVERNMENT ON BUSINESS (LOCAL &
STATE) RATING
Availability of adequate wastewater treatment capacity
Varies by county
Availability of adequate water and sewer lines to industrial sites
Condition and maintenance of local streets
Level of traffic-carrying capacity of local streets and highways
25
Availability of tax incentives
Availability of labor training incentives (compared to other states and localities)
Availability of relocation incentives for transferees
Quality of local elementary and secondary education
26
Quality of post-secondary education
State (IN) competitiveness versus benchmarks states of TN, IL, and IA
27
12
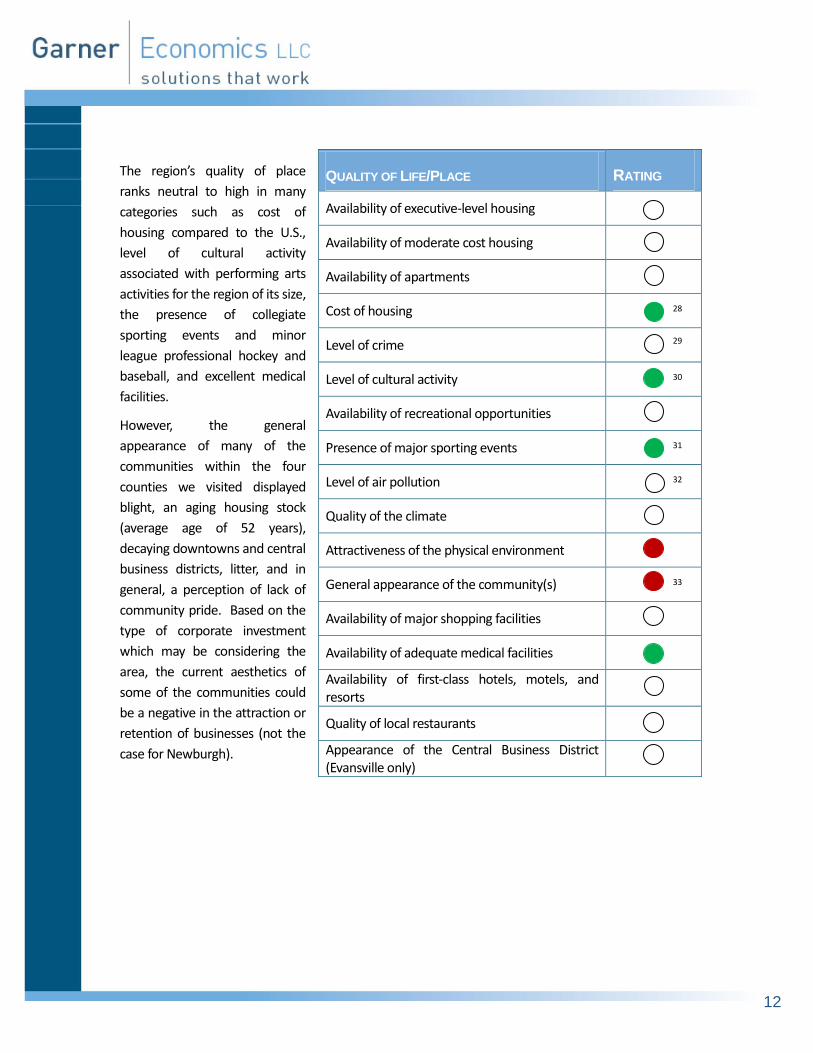
The region’s quality of place
ranks neutral to high in many
categories such as cost of
housing compared to the U.S.,
level of cultural activity
associated with performing arts
activities for the region of its size,
the presence of collegiate
sporting events and minor
league professional hockey and
baseball, and excellent medical
facilities.
However, the general
appearance of many of the
communities within the four
counties we visited displayed
blight, an aging housing stock
(average age of 52 years),
decaying downtowns and central
business districts, litter, and in
general, a perception of lack of
community pride. Based on the
type of corporate investment
which may be considering the
area, the current aesthetics of
some of the communities could
be a negative in the attraction or
retention of businesses (not the
case for Newburgh).
QUALITY OF LIFE/PLACE RATING
Availability of executive-level housing
Availability of moderate cost housing
Availability of apartments
Cost of housing 28
Level of crime 29
Level of cultural activity 30
Availability of recreational opportunities
Presence of major sporting events 31
Level of air pollution 32
Quality of the climate
Attractiveness of the physical environment
General appearance of the community(s) 33
Availability of major shopping facilities
Availability of adequate medical facilities
Availability of first-class hotels, motels, and resorts
Quality of local restaurants
Appearance of the Central Business District (Evansville only)
13
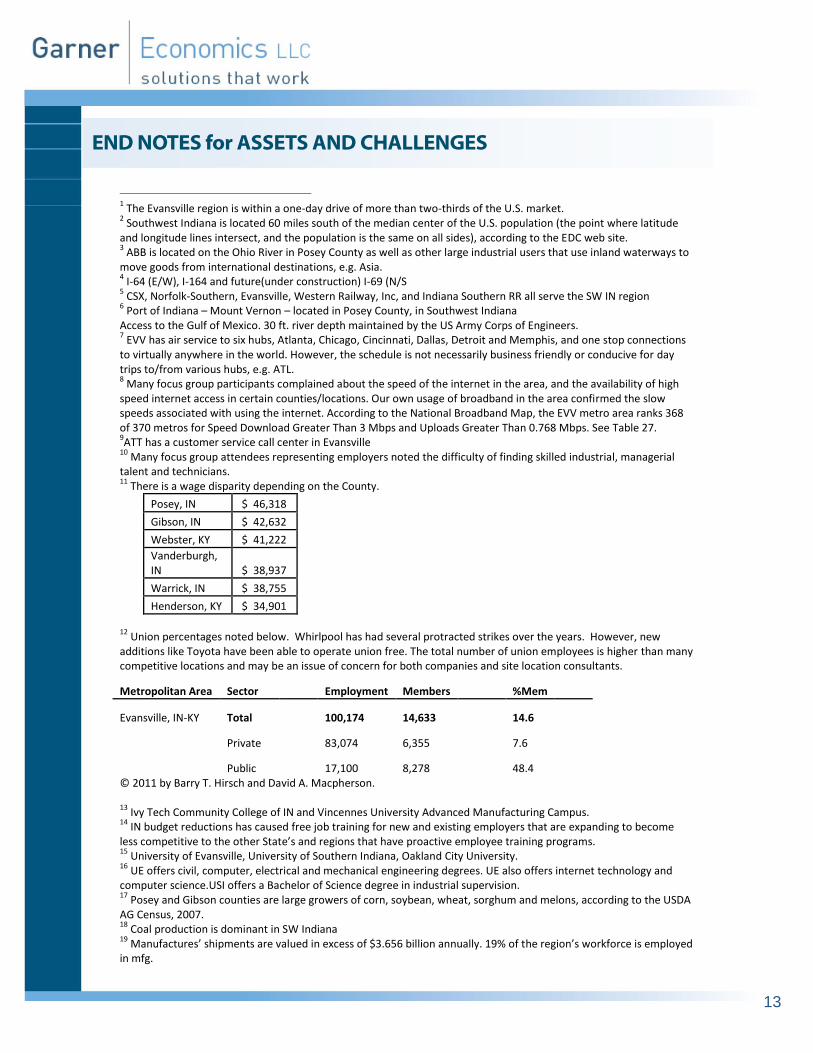
END NOTES for ASSETS AND CHALLENGES
1 The Evansville region is within a one-day drive of more than two-thirds of the U.S. market.
2 Southwest Indiana is located 60 miles south of the median center of the U.S. population (the point where latitude
and longitude lines intersect, and the population is the same on all sides), according to the EDC web site. 3 ABB is located on the Ohio River in Posey County as well as other large industrial users that use inland waterways to
move goods from international destinations, e.g. Asia. 4 I-64 (E/W), I-164 and future(under construction) I-69 (N/S
5 CSX, Norfolk-Southern, Evansville, Western Railway, Inc, and Indiana Southern RR all serve the SW IN region
6 Port of Indiana – Mount Vernon – located in Posey County, in Southwest Indiana
Access to the Gulf of Mexico. 30 ft. river depth maintained by the US Army Corps of Engineers. 7 EVV has air service to six hubs, Atlanta, Chicago, Cincinnati, Dallas, Detroit and Memphis, and one stop connections
to virtually anywhere in the world. However, the schedule is not necessarily business friendly or conducive for day trips to/from various hubs, e.g. ATL. 8 Many focus group participants complained about the speed of the internet in the area, and the availability of high
speed internet access in certain counties/locations. Our own usage of broadband in the area confirmed the slow speeds associated with using the internet. According to the National Broadband Map, the EVV metro area ranks 368 of 370 metros for Speed Download Greater Than 3 Mbps and Uploads Greater Than 0.768 Mbps. See Table 27. 9ATT has a customer service call center in Evansville
10 Many focus group attendees representing employers noted the difficulty of finding skilled industrial, managerial
talent and technicians. 11
There is a wage disparity depending on the County.
Posey, IN $ 46,318
Gibson, IN $ 42,632
Webster, KY $ 41,222
Vanderburgh, IN $ 38,937
Warrick, IN $ 38,755
Henderson, KY $ 34,901
12
Union percentages noted below. Whirlpool has had several protracted strikes over the years. However, new additions like Toyota have been able to operate union free. The total number of union employees is higher than many competitive locations and may be an issue of concern for both companies and site location consultants.
Metropolitan Area Sector
Employment Members
%Mem
Evansville, IN-KY Total
100,174 14,633
14.6
Private
83,074 6,355
7.6
Public
17,100 8,278
48.4
© 2011 by Barry T. Hirsch and David A. Macpherson. 13
Ivy Tech Community College of IN and Vincennes University Advanced Manufacturing Campus. 14
IN budget reductions has caused free job training for new and existing employers that are expanding to become less competitive to the other State’s and regions that have proactive employee training programs. 15
University of Evansville, University of Southern Indiana, Oakland City University. 16
UE offers civil, computer, electrical and mechanical engineering degrees. UE also offers internet technology and computer science.USI offers a Bachelor of Science degree in industrial supervision. 17
Posey and Gibson counties are large growers of corn, soybean, wheat, sorghum and melons, according to the USDA AG Census, 2007. 18
Coal production is dominant in SW Indiana 19
Manufactures’ shipments are valued in excess of $3.656 billion annually. 19% of the region’s workforce is employed in mfg.

14
20
Average Retail Price of Electricity to Ultimate Customers by End-Use Sector, by State, Year-to-Date through November 2010, U.S. Energy Information Administration, for industrial users:
East North Central 6.52
Illinois 6.72
Indiana (includes Duke and Vectren)
5.96
Michigan 7.19
Ohio 6.32
21
Some focus group participants noted that there is a disconnect between local elected officials and a better understanding of the economic development process. We too observed that as a challenge during the focus groups. 22
The EDC’s annual budget is $1.4mm, of which $144,500 is designated for marketing and external outreach. Based on our analysis of best practice regional economic development programs, the EDC’s marketing budget is drastically low. 23
There are two industrial parks in Warrick County. 24 Venture capital and a formal angel network are nonexistent in the region 25
Many focus group participants complained about the conditions and traffic flow of local streets 26
http://www.evscschools.com/AdminDefault.aspx?portalId=c45369af-1b9a-4929-a2a1-446af4fcbf7d&pid=65744905-4419-4c19-81ae-03f1440d3d4d 27
Indiana ranks number 10 of the 50 states in the State rankings business climate index, as determined by the Tax Foundation, 2011 http://www.taxfoundation.org/research/show/22658.html 28
*For Evansville (Sperling’s 2011): Housing Evansville, IN United States
Median Home Age
52 33
Median Home Cost
$97,020 $183,450
Home Appreciation
1.91% -5.21%
Homes Owned
53.10% 60.14%
Housing Vacant
10.91% 10.50%
Homes Rented
35.99% 29.36%
Property Tax Rate
$7.85 $11.20
29 See Table 10.
30 For the size of the region’s population, there are a number of documented performing arts activities that give the
area a good rating. However, most focus group participants did not feel that there were many cultural assets in the region. 31
UE, USI and Oakland City University both offer NCAA Div I and II college sports. There is minor league hockey and baseball team. 32
Vanderburgh and Warrick Counties are both attainment areas with a maintenance plan. Posey and Gibson counties are attainment. Air quality in Evansville, IN is 38 on a scale to 100 (higher is better). This is based on ozone alert days and number of pollutants in the air, as reported by the EPA. 33
Newburgh shows exceptionally well. Evansville, which is the dominant city in the region, does not. Princeton and Oakland City do not present itself well either. An aged housing stock and what appears to be lack of community pride in the aesthetes of the community is evident. The median age of Evansville real estate is 52 years (Sperling’s, 2011).

15
SECTION 2: DASHBOARD INDICATORS SUMMARY
he following analysis examines the economic position and competitiveness of the six county
Evansville metropolitan economy. Throughout the report, references to Evansville imply the
entire metropolitan area, unless otherwise noted. Besides the nation and state of Indiana, the
report also compares Evansville to two benchmark communities, which are Chattanooga TN, and
Davenport-Moline-Rock Island IA-IL.
The analysis relies heavily on raw objective data collected by impartial governmental or impartial
agencies. In all cases the original and most current available data as of March 31, 2011 is used. All
unique calculations and computations from the original data were conducted by Garner Economics,
who will gladly share methodology to clients upon request.
Population growth, while positive at a rate of 4.6 percent over the last decade, is below both the nation, state and one benchmark community.
Over the period of 2000-2009, natural growth accounted for an estimated 83 percent of net new residents. Over the same period, Evansville lost a net of 657 residents due to domestic out-migration. Growth from natural and international sources, while positive, is less likely to satisfy immediate workforce demands.
o With 89.9 percent of the population categorizing themselves as white, the population of Evansville is less diverse relative to the state, nation, and benchmark communities.
At 38.5 years, the median age in Evansville is very close to the medians in both benchmark communities, and approximately two years above the state and nation.
Relative to the state and nation, Evansville has a lower proportion of its population ages 5-24, and 35-44. Conversely, the area has a higher relative proportion of population ages 45 and older.
Evansville has a higher relative proportion of residents whose highest level of educational attainment is “High school diploma”, compared to the nation, state and both benchmark communities. Likewise, the area has a lower relative proportion of residents whose highest level of attainment is “Bachelor’s Degree” and above.
At eight percent, or 3,952 of all bachelor degree holders, Evansville has a relatively high proportion of residents with degrees in Engineering.
Average ACT scores for Evansville schools within the four metro Indiana counties are notably above the nation, and both benchmark communities, across all subjects tested.
o A total of 8 percent of the population age 18 and over are enrolled in college or graduate school in Evansville, a percentage that is slightly less than the nation, state, and one benchmark community.
T
16
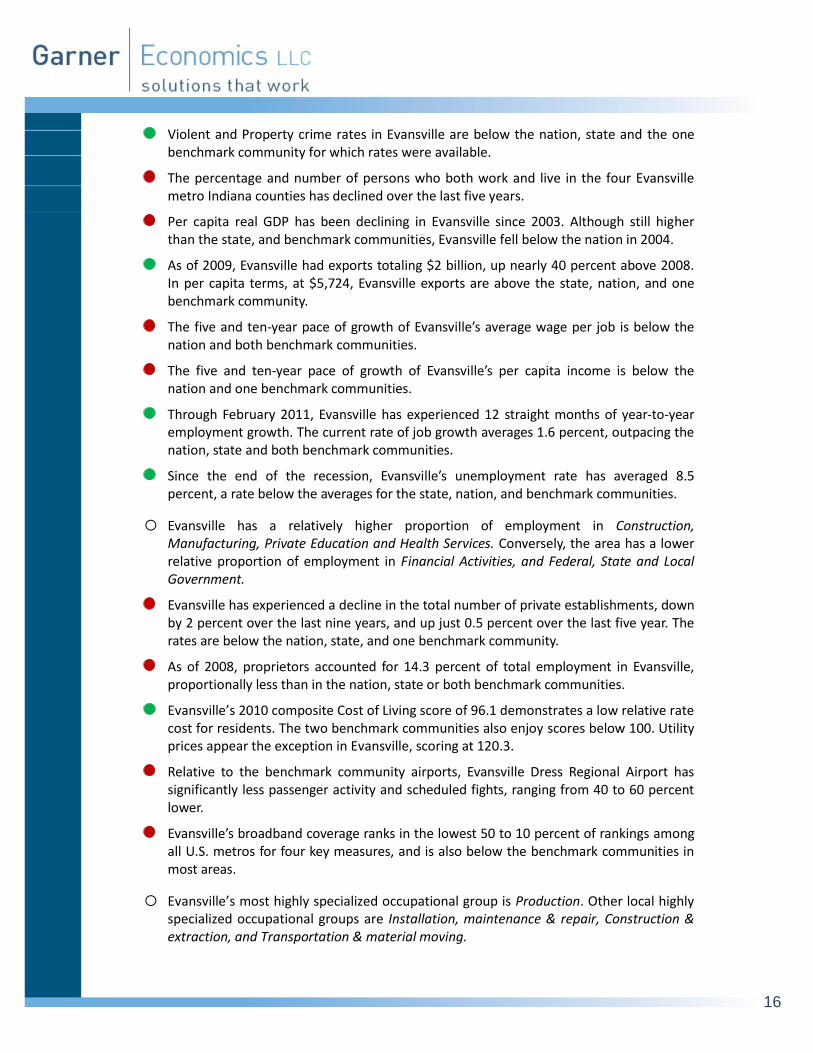
Violent and Property crime rates in Evansville are below the nation, state and the one benchmark community for which rates were available.
The percentage and number of persons who both work and live in the four Evansville metro Indiana counties has declined over the last five years.
Per capita real GDP has been declining in Evansville since 2003. Although still higher than the state, and benchmark communities, Evansville fell below the nation in 2004.
As of 2009, Evansville had exports totaling $2 billion, up nearly 40 percent above 2008. In per capita terms, at $5,724, Evansville exports are above the state, nation, and one benchmark community.
The five and ten-year pace of growth of Evansville’s average wage per job is below the nation and both benchmark communities.
The five and ten-year pace of growth of Evansville’s per capita income is below the nation and one benchmark communities.
Through February 2011, Evansville has experienced 12 straight months of year-to-year employment growth. The current rate of job growth averages 1.6 percent, outpacing the nation, state and both benchmark communities.
Since the end of the recession, Evansville’s unemployment rate has averaged 8.5 percent, a rate below the averages for the state, nation, and benchmark communities.
o Evansville has a relatively higher proportion of employment in Construction, Manufacturing, Private Education and Health Services. Conversely, the area has a lower relative proportion of employment in Financial Activities, and Federal, State and Local Government.
Evansville has experienced a decline in the total number of private establishments, down by 2 percent over the last nine years, and up just 0.5 percent over the last five year. The rates are below the nation, state, and one benchmark community.
As of 2008, proprietors accounted for 14.3 percent of total employment in Evansville, proportionally less than in the nation, state or both benchmark communities.
Evansville’s 2010 composite Cost of Living score of 96.1 demonstrates a low relative rate cost for residents. The two benchmark communities also enjoy scores below 100. Utility prices appear the exception in Evansville, scoring at 120.3.
Relative to the benchmark community airports, Evansville Dress Regional Airport has significantly less passenger activity and scheduled fights, ranging from 40 to 60 percent lower.
Evansville’s broadband coverage ranks in the lowest 50 to 10 percent of rankings among all U.S. metros for four key measures, and is also below the benchmark communities in most areas.
o Evansville’s most highly specialized occupational group is Production. Other local highly specialized occupational groups are Installation, maintenance & repair, Construction & extraction, and Transportation & material moving.
17
SECTION 3: DEMOGRAPHIC & LABOR DYNAMICS
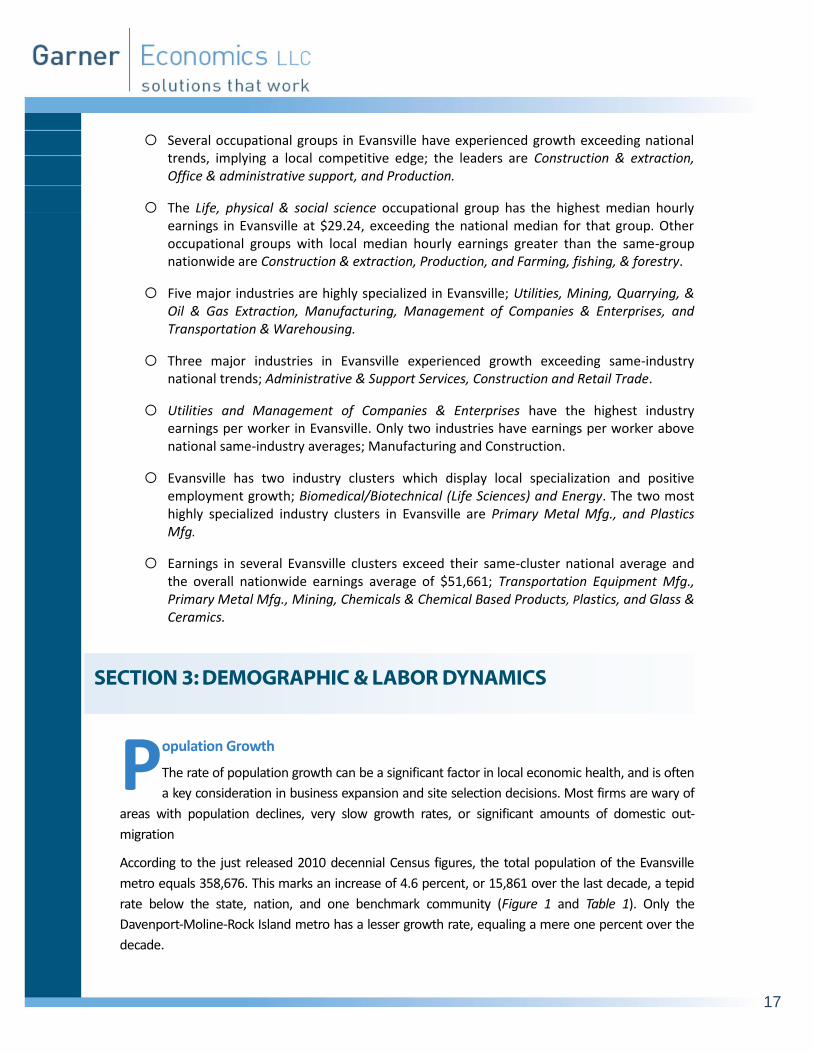
o Several occupational groups in Evansville have experienced growth exceeding national trends, implying a local competitive edge; the leaders are Construction & extraction, Office & administrative support, and Production.
o The Life, physical & social science occupational group has the highest median hourly earnings in Evansville at $29.24, exceeding the national median for that group. Other occupational groups with local median hourly earnings greater than the same-group nationwide are Construction & extraction, Production, and Farming, fishing, & forestry.
o Five major industries are highly specialized in Evansville; Utilities, Mining, Quarrying, & Oil & Gas Extraction, Manufacturing, Management of Companies & Enterprises, and Transportation & Warehousing.
o Three major industries in Evansville experienced growth exceeding same-industry national trends; Administrative & Support Services, Construction and Retail Trade.
o Utilities and Management of Companies & Enterprises have the highest industry earnings per worker in Evansville. Only two industries have earnings per worker above national same-industry averages; Manufacturing and Construction.
o Evansville has two industry clusters which display local specialization and positive employment growth; Biomedical/Biotechnical (Life Sciences) and Energy. The two most highly specialized industry clusters in Evansville are Primary Metal Mfg., and Plastics Mfg.
o Earnings in several Evansville clusters exceed their same-cluster national average and the overall nationwide earnings average of $51,661; Transportation Equipment Mfg., Primary Metal Mfg., Mining, Chemicals & Chemical Based Products, Plastics, and Glass & Ceramics.
opulation Growth
The rate of population growth can be a significant factor in local economic health, and is often
a key consideration in business expansion and site selection decisions. Most firms are wary of
areas with population declines, very slow growth rates, or significant amounts of domestic out-
migration
According to the just released 2010 decennial Census figures, the total population of the Evansville
metro equals 358,676. This marks an increase of 4.6 percent, or 15,861 over the last decade, a tepid
rate below the state, nation, and one benchmark community (Figure 1 and Table 1). Only the
Davenport-Moline-Rock Island metro has a lesser growth rate, equaling a mere one percent over the
decade.
P

18
Figure 1 2000-2010 Population Change
Source: US Census Bureau
Table 1 2000-2010 Population Change
2000 2010 Change Change %
Evansville 342,815 358,676 15,861 4.6%
Chattanooga 476,531 528,143 51,612 10.8%
Davenport-Moline—Rock Island 376,019 379,690 3,671 1.0%
Indiana 6,080,485 6,483,802 403,317 6.6%
US 281,421,906 308,745,538 27,323,632 9.7%
Source: US Census Bureau
ources of Population Change
Population change has three major sources: 1) natural (births minus deaths), 2) domestic
migration, and, 3) international migration1. The leading contributor to changes in Evansville
population is natural (Figure 1 andTable 1). Over the period of 2000-2009, natural growth accounted
1 Migration of the foreign born; lawful permanent residents (immigrants), temporary migrants (such as students), people illegally present in the United States, and additionally net movements of the Armed Forces population between the United States and overseas.
4.6%
10.8%
1.0%
6.6%
9.7%
0% 2% 4% 6% 8% 10% 12%
Evansville
Chattanooga
Davenport--Moline--Rock Island
Indiana
US
S

19
for an estimated 83 percent of net new residents. International in-migration was responsible for the
remaining 17 percent of net new residents. Over the same period, Evansville lost a net of 657 residents
due to domestic out-migration. Growth from natural and international sources, while positive, is less
likely to satisfy immediate workforce demands.
Compared to the benchmark communities, the contribution to net the population increase in
Chattanooga has been due overwhelmingly to domestic in-migration, while Davenport-Moline-Rock
Island’s slow growth is due to strong out-migration (Figure 3).
Figure 2 Annual Sources of Population Change
Evansville Metro
Source: US Census Bureau
-1,500
-1,000
-500
0
500
1,000
1,500
2,000
2,500
2000 2001 2002 2003 2004 2005 2006 2007 2008 2009
Natural International Domestic

20
Table 2 Annual Sources of Population Change
Evansville Metro
Year Natural International Domestic
2000 193 38 (69)
2001 960 260 (891)
2002 747 249 154
2003 997 224 810
2004 1,102 221 347
2005 1,083 226 (62)
2006 1,082 228 34
2007 1,355 204 (185)
2008 1,159 198 (796)
2009 1,091 203 1
Components do not total exactly due to inter-year residual adjustments made by the Census Bureau.
Source: US Census Bureau
Figure 3 Net Source of Population Change
2000-2009 Estimate
Source: US Census Bureau
-20,000
-10,000
0
10,000
20,000
30,000
40,000
Evansville Chattanooga Davenport-Moline-Rock Island
Natural International Domestic
21
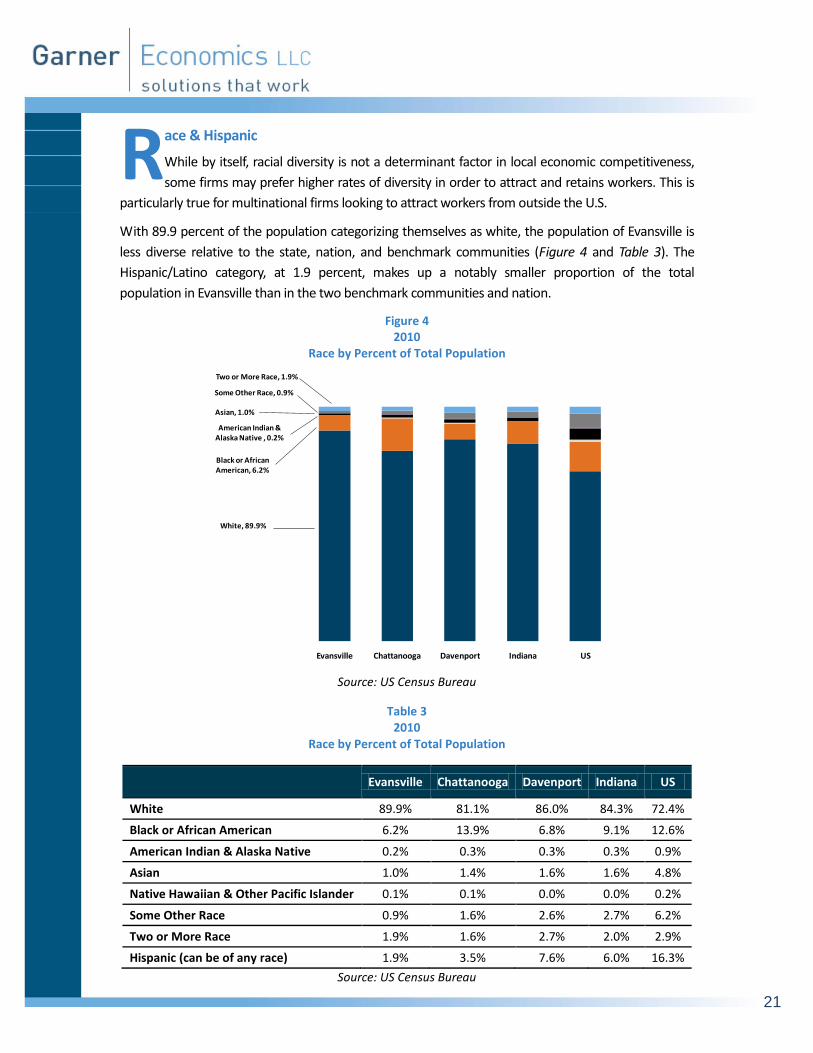
ace & Hispanic
While by itself, racial diversity is not a determinant factor in local economic competitiveness,
some firms may prefer higher rates of diversity in order to attract and retains workers. This is
particularly true for multinational firms looking to attract workers from outside the U.S.
With 89.9 percent of the population categorizing themselves as white, the population of Evansville is
less diverse relative to the state, nation, and benchmark communities (Figure 4 and Table 3). The
Hispanic/Latino category, at 1.9 percent, makes up a notably smaller proportion of the total
population in Evansville than in the two benchmark communities and nation.
Figure 4 2010
Race by Percent of Total Population
Source: US Census Bureau
Table 3 2010
Race by Percent of Total Population
Evansville Chattanooga Davenport Indiana US
White 89.9% 81.1% 86.0% 84.3% 72.4%
Black or African American 6.2% 13.9% 6.8% 9.1% 12.6%
American Indian & Alaska Native 0.2% 0.3% 0.3% 0.3% 0.9%
Asian 1.0% 1.4% 1.6% 1.6% 4.8%
Native Hawaiian & Other Pacific Islander 0.1% 0.1% 0.0% 0.0% 0.2%
Some Other Race 0.9% 1.6% 2.6% 2.7% 6.2%
Two or More Race 1.9% 1.6% 2.7% 2.0% 2.9%
Hispanic (can be of any race) 1.9% 3.5% 7.6% 6.0% 16.3%
Source: US Census Bureau
White, 89.9%
Black or African American, 6.2%
American Indian & Alaska Native , 0.2%
Asian, 1.0%
Some Other Race, 0.9%
Two or More Race, 1.9%
Evansville Chattanooga Davenport Indiana US
R

22
ge
The age composition of a local population can be an important determinant in business
decisions and competitiveness. The lack or underrepresentation of younger workers may
defer some firms from considering some communities for their long term plans. Low proportions of
middle age workers may prevent firms from initiating expansions requiring quick start-up operations.
The presence of older workers may indicate certain incumbent skills or the need to replace soon-to-
retire workers.
Median Age
At 38.5 years, the median age in Evansville is very close to the medians in both benchmark
communities, but approximately two years above the state and nation. (Figure 5 and Table 4).
Figure 5 Median Age 2005-2009
Source: US Census Bureau
Table 4
Median Age 2005-2009
Evansville 38.5
Chattanooga 38.6
Davenport-Moline—Rock Island 38.6
Indiana 36.4
US 36.5
Source: US Census Bureau
38.538.6 38.6
36.436.5
35
36
37
38
39
Evansville Chattanooga Davenport-Moline Rock Island
Indiana US
A
23
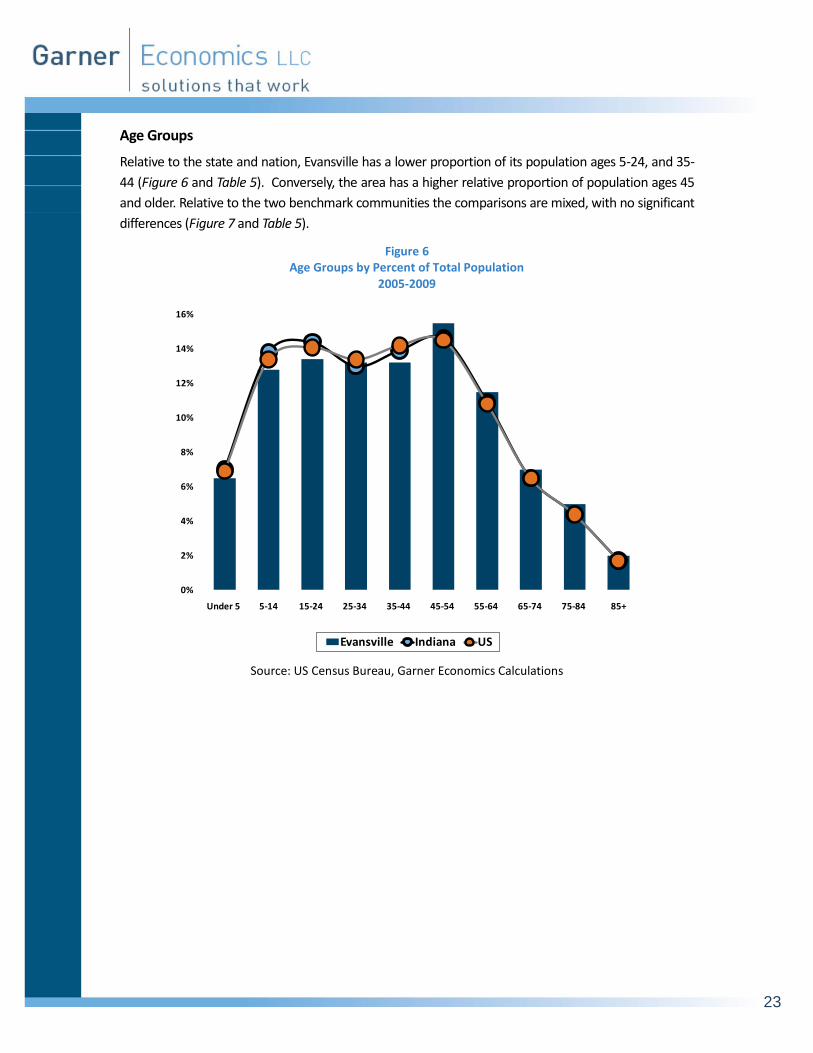
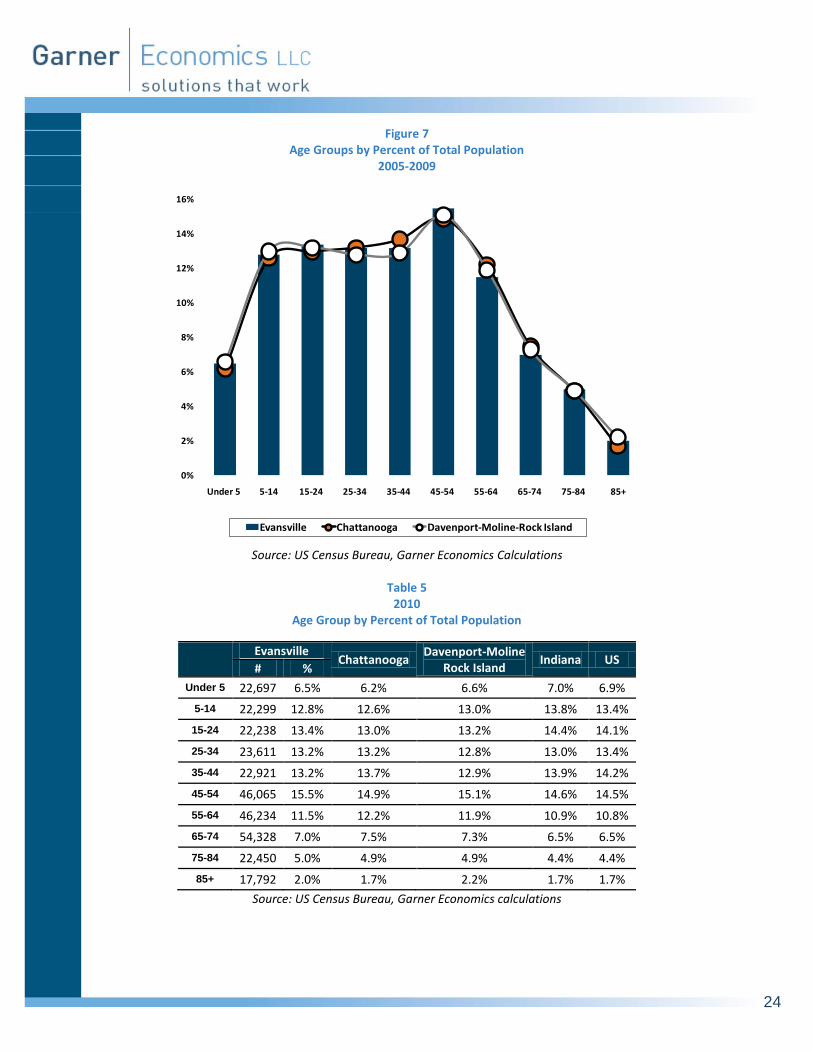
Age Groups
Relative to the state and nation, Evansville has a lower proportion of its population ages 5-24, and 35-
44 (Figure 6 and Table 5). Conversely, the area has a higher relative proportion of population ages 45
and older. Relative to the two benchmark communities the comparisons are mixed, with no significant
differences (Figure 7 and Table 5).
Figure 6 Age Groups by Percent of Total Population
2005-2009
Source: US Census Bureau, Garner Economics Calculations
0%
2%
4%
6%
8%
10%
12%
14%
16%
Under 5 5-14 15-24 25-34 35-44 45-54 55-64 65-74 75-84 85+
Evansville Indiana US
24
Figure 7 Age Groups by Percent of Total Population
2005-2009
Source: US Census Bureau, Garner Economics Calculations
Table 5 2010
Age Group by Percent of Total Population
Evansville
Chattanooga Davenport-Moline
Rock Island Indiana US
# %
Under 5 22,697 6.5% 6.2% 6.6% 7.0% 6.9%
5-14 22,299 12.8% 12.6% 13.0% 13.8% 13.4%
15-24 22,238 13.4% 13.0% 13.2% 14.4% 14.1%
25-34 23,611 13.2% 13.2% 12.8% 13.0% 13.4%
35-44 22,921 13.2% 13.7% 12.9% 13.9% 14.2%
45-54 46,065 15.5% 14.9% 15.1% 14.6% 14.5%
55-64 46,234 11.5% 12.2% 11.9% 10.9% 10.8%
65-74 54,328 7.0% 7.5% 7.3% 6.5% 6.5%
75-84 22,450 5.0% 4.9% 4.9% 4.4% 4.4%
85+ 17,792 2.0% 1.7% 2.2% 1.7% 1.7%
Source: US Census Bureau, Garner Economics calculations
0%
2%
4%
6%
8%
10%
12%
14%
16%
Under 5 5-14 15-24 25-34 35-44 45-54 55-64 65-74 75-84 85+
Evansville Chattanooga Davenport-Moline-Rock Island

25
ducation
Increasingly, the level of education of a communities’ population is becoming a decisive factor
in economic competitiveness. Firms understand the need to operate in economies that offer a
sufficient supply of workers that meet or exceed their demands. They also know that the lack of an
educated workforce can significantly affect business performance.
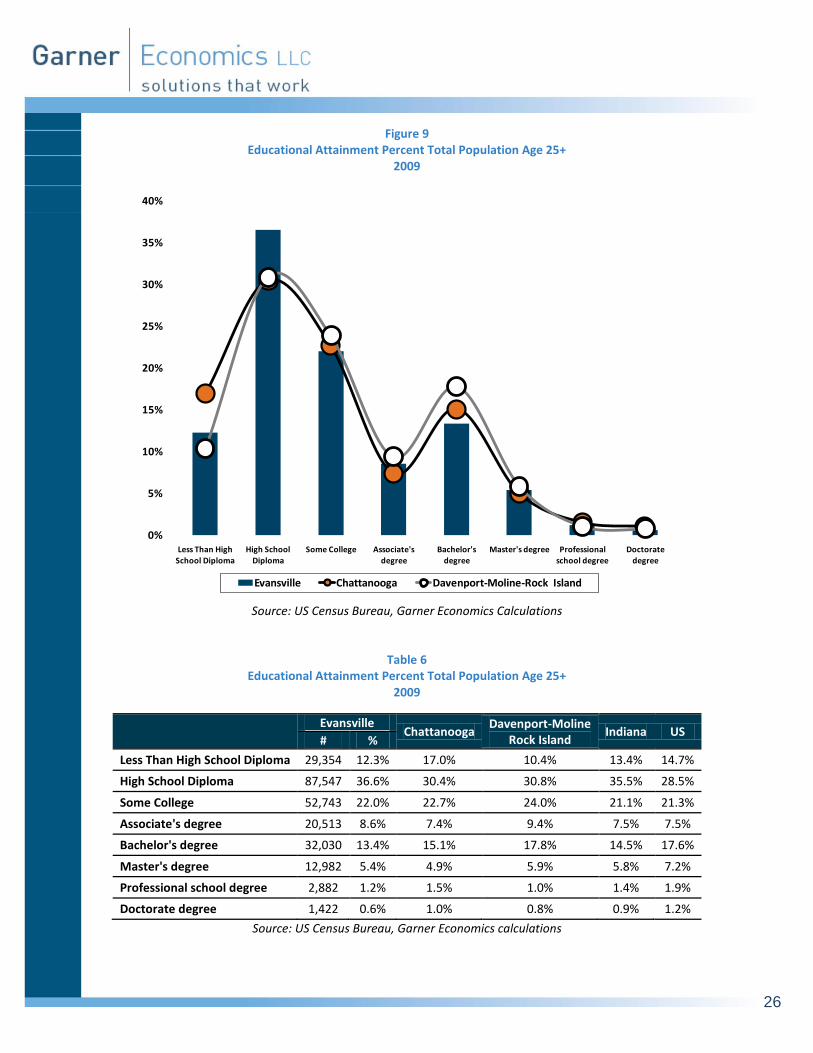
Educational Attainment
Comparing levels of educational attainment reveals several distinct characteristics among Evansville’s
residents ages 25 and over. Evansville has a higher relative proportion of residents whose highest level
of educational attainment is “High school diploma”, compared to the nation, state and both
benchmark communities. Likewise, Evansville has a lower relative proportion of residents whose
highest level of attainment is “Bachelor’s Degree” and above (Figure 8, Figure 9 and Table 6).
While the differences are not entirely striking, they may influence the attraction of firms demanding a
sizeable pool of highly educated workers, or cause firms to reconsider Evansville for large scale
research and development type operations.
Figure 8 Educational Attainment Percent Total Population Age 25+
2009
Source: US Census Bureau, Garner Economics calculations
0%
5%
10%
15%
20%
25%
30%
35%
40%
Less Than High School Diploma
High School Diploma
Some College Associate's degree
Bachelor's degree
Master's degree Professional school degree
Doctorate degree
Evansville Indiana US
E
26
Figure 9 Educational Attainment Percent Total Population Age 25+
2009
Source: US Census Bureau, Garner Economics Calculations
Table 6 Educational Attainment Percent Total Population Age 25+
2009
Evansville
Chattanooga Davenport-Moline
Rock Island Indiana US
# %
Less Than High School Diploma 29,354 12.3% 17.0% 10.4% 13.4% 14.7%
High School Diploma 87,547 36.6% 30.4% 30.8% 35.5% 28.5%
Some College 52,743 22.0% 22.7% 24.0% 21.1% 21.3%
Associate's degree 20,513 8.6% 7.4% 9.4% 7.5% 7.5%
Bachelor's degree 32,030 13.4% 15.1% 17.8% 14.5% 17.6%
Master's degree 12,982 5.4% 4.9% 5.9% 5.8% 7.2%
Professional school degree 2,882 1.2% 1.5% 1.0% 1.4% 1.9%
Doctorate degree 1,422 0.6% 1.0% 0.8% 0.9% 1.2%
Source: US Census Bureau, Garner Economics calculations
0%
5%
10%
15%
20%
25%
30%
35%
40%
Less Than High School Diploma
High School Diploma
Some College Associate's degree
Bachelor's degree
Master's degree Professional school degree
Doctorate degree
Evansville Chattanooga Davenport-Moline-Rock Island
27
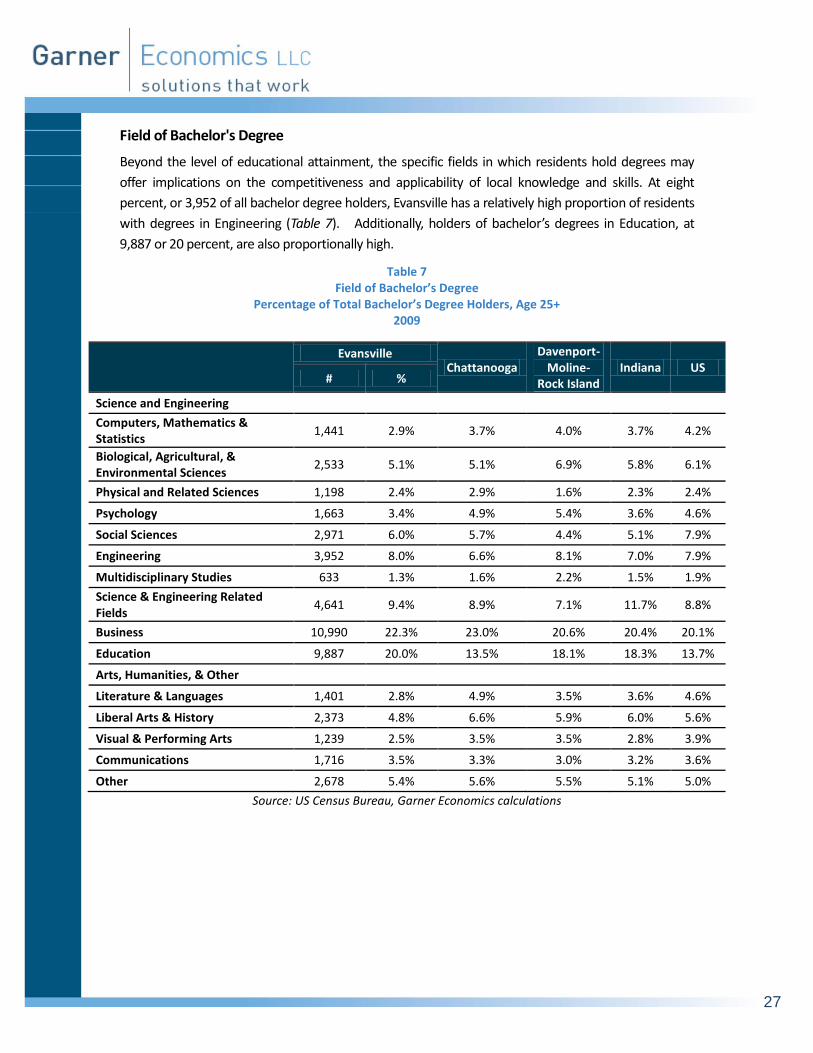
Field of Bachelor's Degree
Beyond the level of educational attainment, the specific fields in which residents hold degrees may
offer implications on the competitiveness and applicability of local knowledge and skills. At eight
percent, or 3,952 of all bachelor degree holders, Evansville has a relatively high proportion of residents
with degrees in Engineering (Table 7). Additionally, holders of bachelor’s degrees in Education, at
9,887 or 20 percent, are also proportionally high.
Table 7 Field of Bachelor’s Degree
Percentage of Total Bachelor’s Degree Holders, Age 25+ 2009
Evansville Chattanooga
Davenport-Moline-
Rock Island Indiana US
# %
Science and Engineering
Computers, Mathematics & Statistics
1,441 2.9% 3.7% 4.0% 3.7% 4.2%
Biological, Agricultural, & Environmental Sciences
2,533 5.1% 5.1% 6.9% 5.8% 6.1%
Physical and Related Sciences 1,198 2.4% 2.9% 1.6% 2.3% 2.4%
Psychology 1,663 3.4% 4.9% 5.4% 3.6% 4.6%
Social Sciences 2,971 6.0% 5.7% 4.4% 5.1% 7.9%
Engineering 3,952 8.0% 6.6% 8.1% 7.0% 7.9%
Multidisciplinary Studies 633 1.3% 1.6% 2.2% 1.5% 1.9%
Science & Engineering Related Fields
4,641 9.4% 8.9% 7.1% 11.7% 8.8%
Business 10,990 22.3% 23.0% 20.6% 20.4% 20.1%
Education 9,887 20.0% 13.5% 18.1% 18.3% 13.7%
Arts, Humanities, & Other
Literature & Languages 1,401 2.8% 4.9% 3.5% 3.6% 4.6%
Liberal Arts & History 2,373 4.8% 6.6% 5.9% 6.0% 5.6%
Visual & Performing Arts 1,239 2.5% 3.5% 3.5% 2.8% 3.9%
Communications 1,716 3.5% 3.3% 3.0% 3.2% 3.6%
Other 2,678 5.4% 5.6% 5.5% 5.1% 5.0%
Source: US Census Bureau, Garner Economics calculations
28
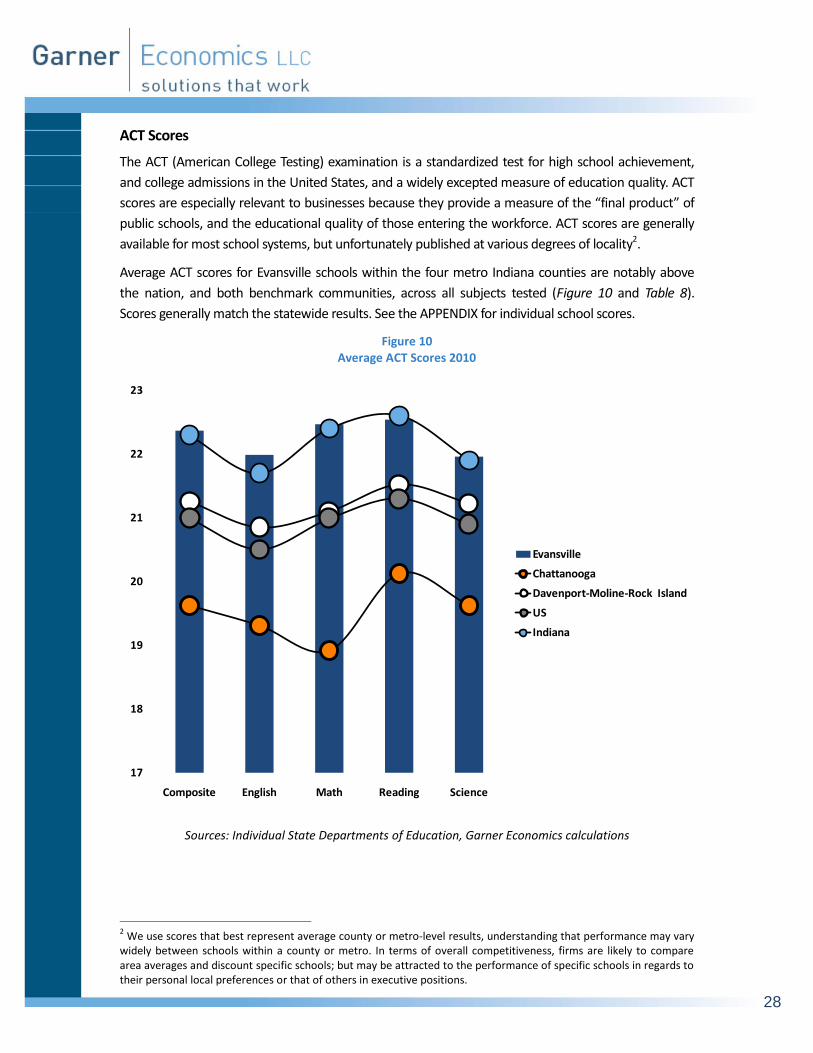
ACT Scores
The ACT (American College Testing) examination is a standardized test for high school achievement,
and college admissions in the United States, and a widely excepted measure of education quality. ACT
scores are especially relevant to businesses because they provide a measure of the “final product” of
public schools, and the educational quality of those entering the workforce. ACT scores are generally
available for most school systems, but unfortunately published at various degrees of locality2.
Average ACT scores for Evansville schools within the four metro Indiana counties are notably above
the nation, and both benchmark communities, across all subjects tested (Figure 10 and Table 8).
Scores generally match the statewide results. See the APPENDIX for individual school scores.
Figure 10 Average ACT Scores 2010
Sources: Individual State Departments of Education, Garner Economics calculations
2 We use scores that best represent average county or metro-level results, understanding that performance may vary
widely between schools within a county or metro. In terms of overall competitiveness, firms are likely to compare area averages and discount specific schools; but may be attracted to the performance of specific schools in regards to their personal local preferences or that of others in executive positions.
17
18
19
20
21
22
23
Composite English Math Reading Science
Evansville
Chattanooga
Davenport-Moline-Rock Island
US
Indiana
29
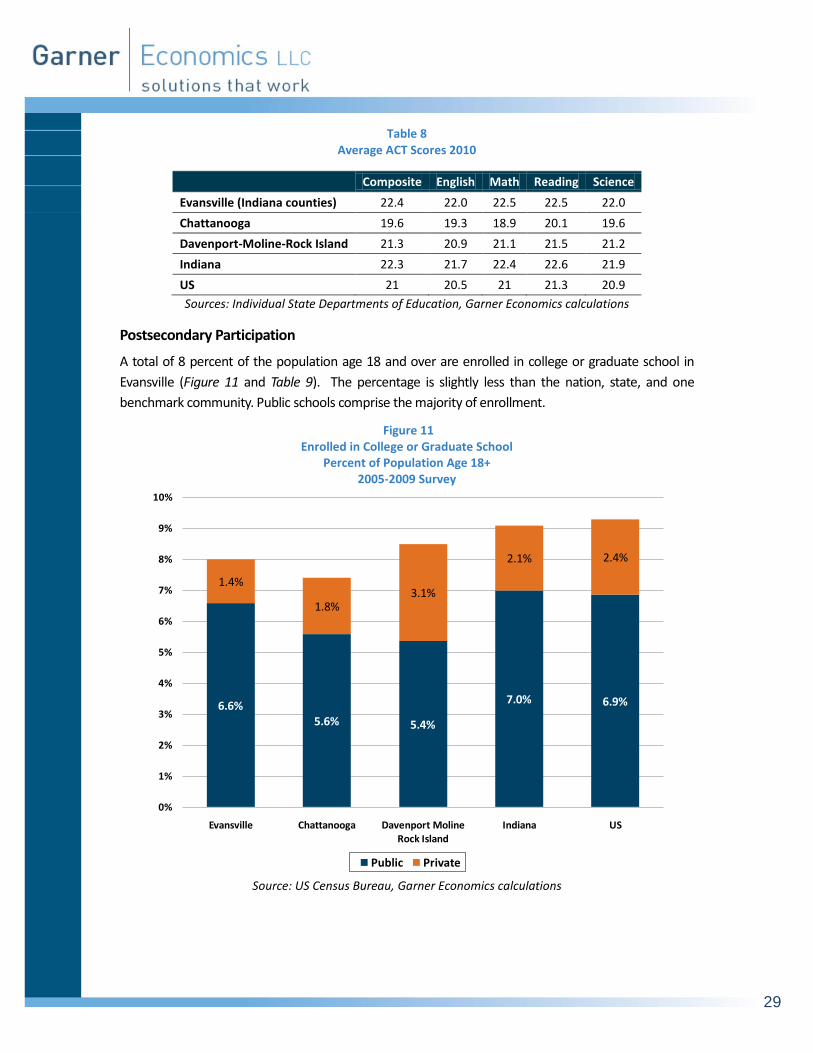
Table 8 Average ACT Scores 2010
Composite English Math Reading Science
Evansville (Indiana counties) 22.4 22.0 22.5 22.5 22.0
Chattanooga 19.6 19.3 18.9 20.1 19.6
Davenport-Moline-Rock Island 21.3 20.9 21.1 21.5 21.2
Indiana 22.3 21.7 22.4 22.6 21.9
US 21 20.5 21 21.3 20.9
Sources: Individual State Departments of Education, Garner Economics calculations
Postsecondary Participation
A total of 8 percent of the population age 18 and over are enrolled in college or graduate school in
Evansville (Figure 11 and Table 9). The percentage is slightly less than the nation, state, and one
benchmark community. Public schools comprise the majority of enrollment.
Figure 11 Enrolled in College or Graduate School
Percent of Population Age 18+ 2005-2009 Survey
Source: US Census Bureau, Garner Economics calculations
6.6%5.6% 5.4%
7.0% 6.9%
1.4%
1.8%3.1%
2.1% 2.4%
0%
1%
2%
3%
4%
5%
6%
7%
8%
9%
10%
Evansville Chattanooga Davenport Moline Rock Island
Indiana US
Public Private

30
Table 9 Enrolled in College or Graduate School
Percent of Population Age 18+ 2005-2009 Survey
Total Public Private
21,459 17,682 3,777
Evansville 8.0% 6.6% 1.4%
Chattanooga 7.4% 5.6% 1.8%
Davenport-Moline-Rock Island 8.5% 5.4% 3.1%
Indiana 9.1% 7.0% 2.1%
US 9.3% 6.9% 2.4%
Source: US Census Bureau, Garner Economics calculations
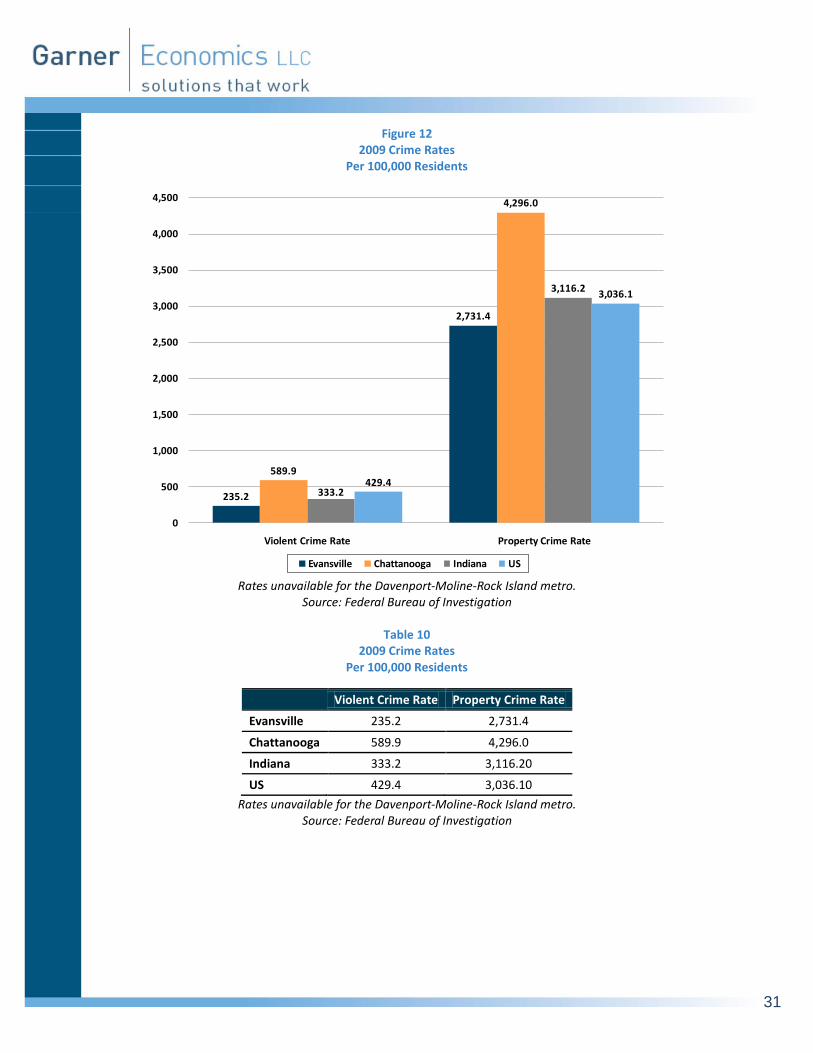
rime Rate
Crime rates may seem outside the typical measures of economic competitiveness, but they
represent a widely-accepted objective gauge used by firms. Crime rates generally reflect
underlying economic conditions, and may signal deeper systemic problems better than standard
economic measures.
According to the most current FBI data, 2009 Violent and Property crime rates in Evansville are below
the nation, state and one benchmark community (Figure 12 and Table 10). The FBI does not publish
rates for the Davenport-Moline-Rock Island metro.
C
31
Figure 12 2009 Crime Rates
Per 100,000 Residents
Rates unavailable for the Davenport-Moline-Rock Island metro.
Source: Federal Bureau of Investigation
Table 10 2009 Crime Rates
Per 100,000 Residents
Violent Crime Rate Property Crime Rate
Evansville 235.2 2,731.4
Chattanooga 589.9 4,296.0
Indiana 333.2 3,116.20
US 429.4 3,036.10
Rates unavailable for the Davenport-Moline-Rock Island metro. Source: Federal Bureau of Investigation
235.2
2,731.4
589.9
4,296.0
333.2
3,116.2
429.4
3,036.1
0
500
1,000
1,500
2,000
2,500
3,000
3,500
4,000
4,500
Violent Crime Rate Property Crime Rate
Evansville Chattanooga Indiana US
32
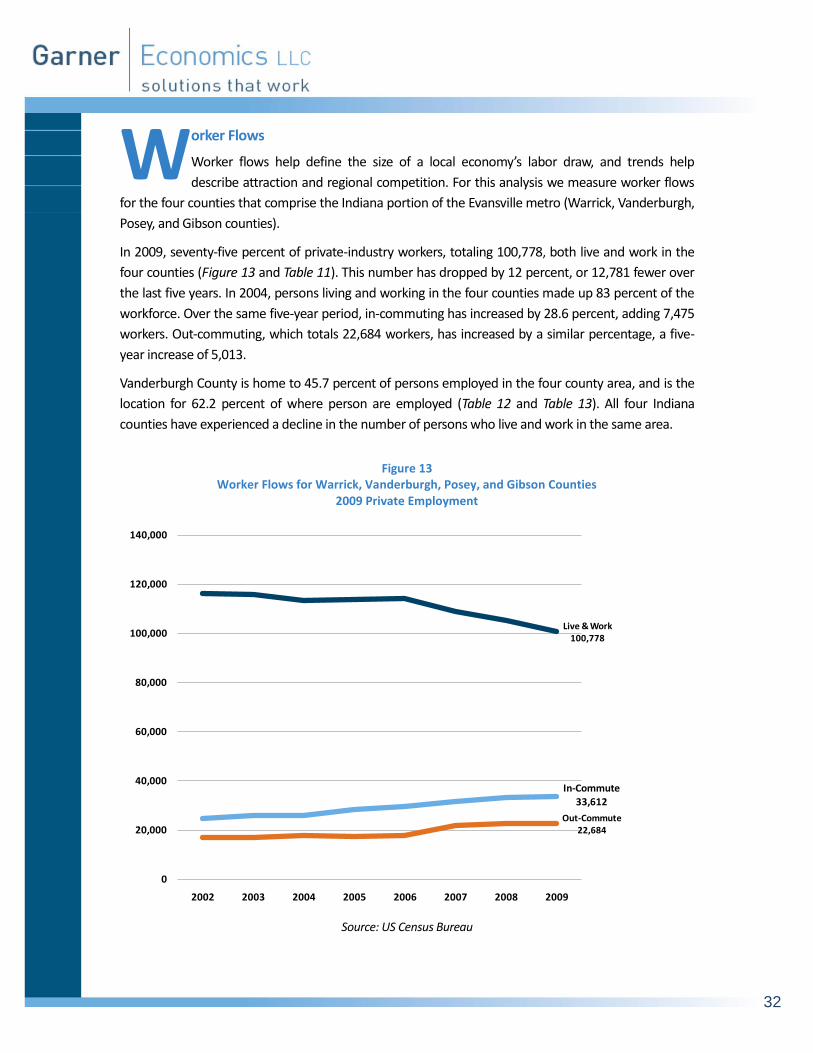
orker Flows
Worker flows help define the size of a local economy’s labor draw, and trends help
describe attraction and regional competition. For this analysis we measure worker flows
for the four counties that comprise the Indiana portion of the Evansville metro (Warrick, Vanderburgh,
Posey, and Gibson counties).
In 2009, seventy-five percent of private-industry workers, totaling 100,778, both live and work in the
four counties (Figure 13 and Table 11). This number has dropped by 12 percent, or 12,781 fewer over
the last five years. In 2004, persons living and working in the four counties made up 83 percent of the
workforce. Over the same five-year period, in-commuting has increased by 28.6 percent, adding 7,475
workers. Out-commuting, which totals 22,684 workers, has increased by a similar percentage, a five-
year increase of 5,013.
Vanderburgh County is home to 45.7 percent of persons employed in the four county area, and is the
location for 62.2 percent of where person are employed (Table 12 and Table 13). All four Indiana
counties have experienced a decline in the number of persons who live and work in the same area.
Figure 13
Worker Flows for Warrick, Vanderburgh, Posey, and Gibson Counties 2009 Private Employment
Source: US Census Bureau
Live & Work100,778
Out-Commute22,684
In-Commute33,612
0
20,000
40,000
60,000
80,000
100,000
120,000
140,000
2002 2003 2004 2005 2006 2007 2008 2009
W

33
Table 11 Worker Flows for Warrick, Vanderburgh, Posey, and Gibson Counties
Private Employment
2004 2009
5-Year Net
Change
5-Year Percent Change
Live & Work 113,559 100,778 (12,781) -11.3%
Out-Commute 17,671 22,684 5,013 28.4%
In-Commute 26,137 33,612 7,475 28.6%
Source: US Census Bureau, Garner Economics calculations
Table 12 Where Workers Live Who are Employed
in Warrick, Vanderburgh, Posey, and Gibson Counties 2009 Private Employment
Home
County Percent of
Total 5-Year Change
Vanderburgh IN 61,411 45.7% (11,056)
Warrick IN 20,037 14.9% (798)
Posey IN 9,681 7.2% (494)
Gibson IN 9,649 7.2% (433)
Henderson KY 3,792 2.8% (210)
Marion IN 2,679 2.0% 524
Spencer IN 2,056 1.5% 187
Dubois IN 1,783 1.3% 550
Pike IN 1,348 1.0% 322
Daviess KY 1,258 0.9% (30)
All Other Locations 20,696 15.4% 6,132
Source: US Census Bureau, Garner Economics calculations
34
SECTION 4: ECONOMIC DYNAMICS
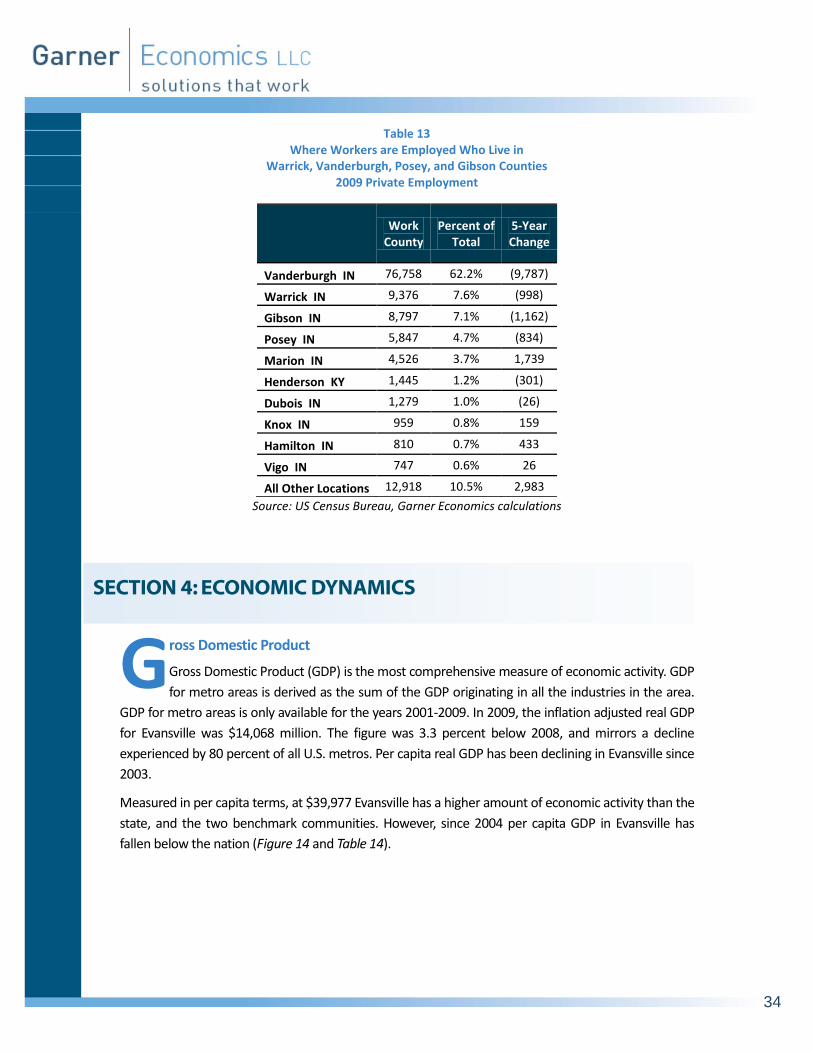
Table 13 Where Workers are Employed Who Live in
Warrick, Vanderburgh, Posey, and Gibson Counties 2009 Private Employment
Source: US Census Bureau, Garner Economics calculations
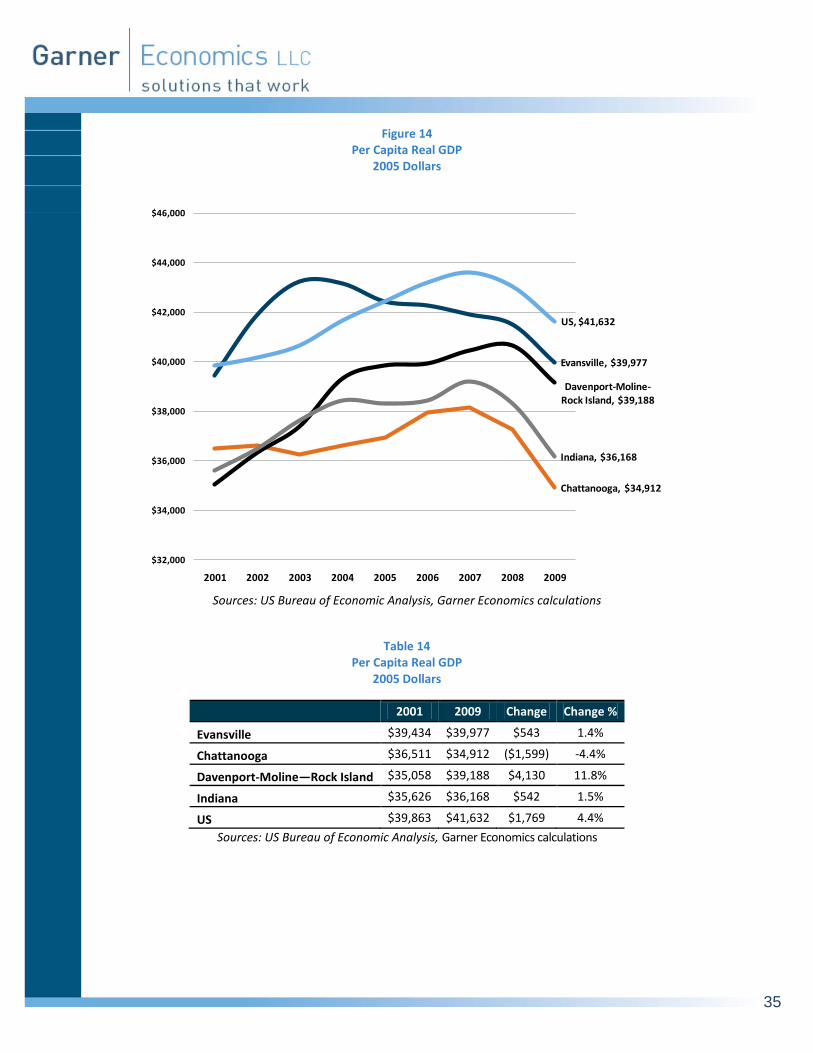
ross Domestic Product
Gross Domestic Product (GDP) is the most comprehensive measure of economic activity. GDP
for metro areas is derived as the sum of the GDP originating in all the industries in the area.
GDP for metro areas is only available for the years 2001-2009. In 2009, the inflation adjusted real GDP
for Evansville was $14,068 million. The figure was 3.3 percent below 2008, and mirrors a decline
experienced by 80 percent of all U.S. metros. Per capita real GDP has been declining in Evansville since
2003.
Measured in per capita terms, at $39,977 Evansville has a higher amount of economic activity than the
state, and the two benchmark communities. However, since 2004 per capita GDP in Evansville has
fallen below the nation (Figure 14 and Table 14).
Work
County Percent of
Total 5-Year Change
Vanderburgh IN 76,758 62.2% (9,787)
Warrick IN 9,376 7.6% (998)
Gibson IN 8,797 7.1% (1,162)
Posey IN 5,847 4.7% (834)
Marion IN 4,526 3.7% 1,739
Henderson KY 1,445 1.2% (301)
Dubois IN 1,279 1.0% (26)
Knox IN 959 0.8% 159
Hamilton IN 810 0.7% 433
Vigo IN 747 0.6% 26
All Other Locations 12,918 10.5% 2,983
G
35
Figure 14 Per Capita Real GDP
2005 Dollars
Sources: US Bureau of Economic Analysis, Garner Economics calculations
Table 14 Per Capita Real GDP
2005 Dollars
2001 2009 Change Change %
Evansville $39,434 $39,977 $543 1.4%
Chattanooga $36,511 $34,912 ($1,599) -4.4%
Davenport-Moline—Rock Island $35,058 $39,188 $4,130 11.8%
Indiana $35,626 $36,168 $542 1.5%
US $39,863 $41,632 $1,769 4.4%
Sources: US Bureau of Economic Analysis, Garner Economics calculations
Evansville, $39,977
Chattanooga, $34,912
Davenport-Moline-Rock Island, $39,188
Indiana, $36,168
US, $41,632
$32,000
$34,000
$36,000
$38,000
$40,000
$42,000
$44,000
$46,000
2001 2002 2003 2004 2005 2006 2007 2008 2009
36
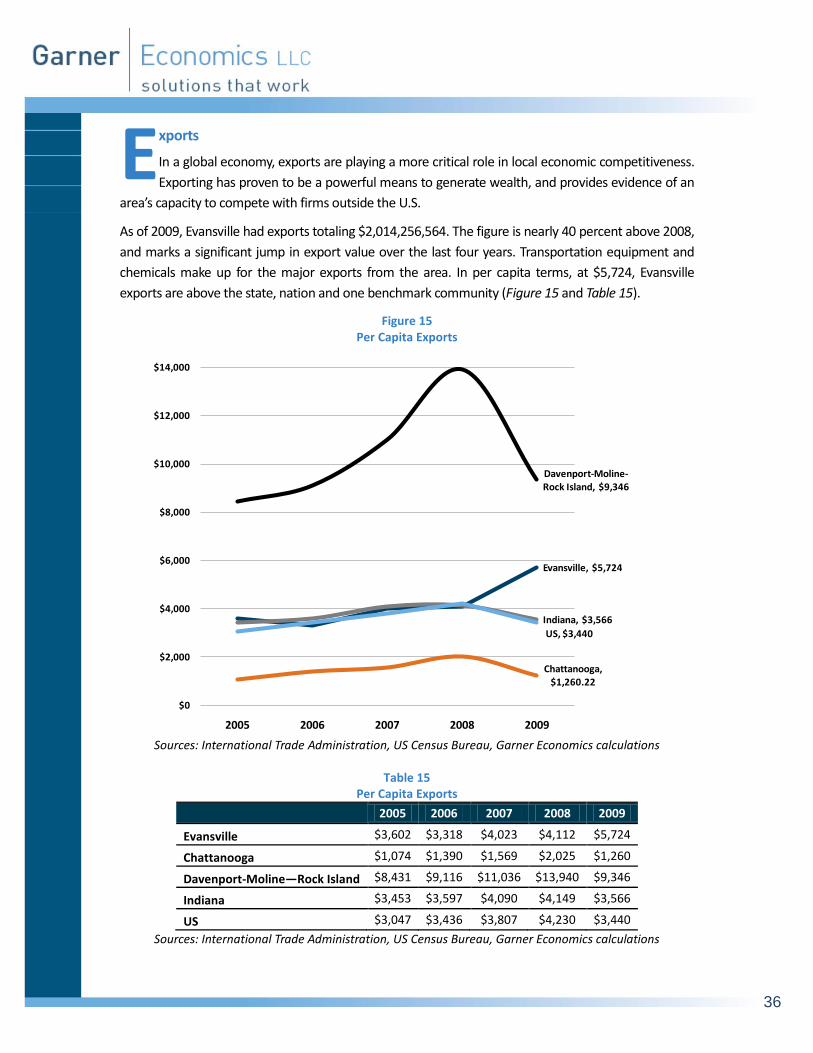
xports
In a global economy, exports are playing a more critical role in local economic competitiveness.
Exporting has proven to be a powerful means to generate wealth, and provides evidence of an
area’s capacity to compete with firms outside the U.S.
As of 2009, Evansville had exports totaling $2,014,256,564. The figure is nearly 40 percent above 2008,
and marks a significant jump in export value over the last four years. Transportation equipment and
chemicals make up for the major exports from the area. In per capita terms, at $5,724, Evansville
exports are above the state, nation and one benchmark community (Figure 15 and Table 15).
Figure 15 Per Capita Exports
Sources: International Trade Administration, US Census Bureau, Garner Economics calculations
Table 15
Per Capita Exports
2005 2006 2007 2008 2009
Evansville $3,602 $3,318 $4,023 $4,112 $5,724
Chattanooga $1,074 $1,390 $1,569 $2,025 $1,260
Davenport-Moline—Rock Island $8,431 $9,116 $11,036 $13,940 $9,346
Indiana $3,453 $3,597 $4,090 $4,149 $3,566
US $3,047 $3,436 $3,807 $4,230 $3,440
Sources: International Trade Administration, US Census Bureau, Garner Economics calculations
Evansville, $5,724
Chattanooga, $1,260.22
Davenport-Moline-Rock Island, $9,346
Indiana, $3,566
US, $3,440
$0
$2,000
$4,000
$6,000
$8,000
$10,000
$12,000
$14,000
2005 2006 2007 2008 2009
E
37
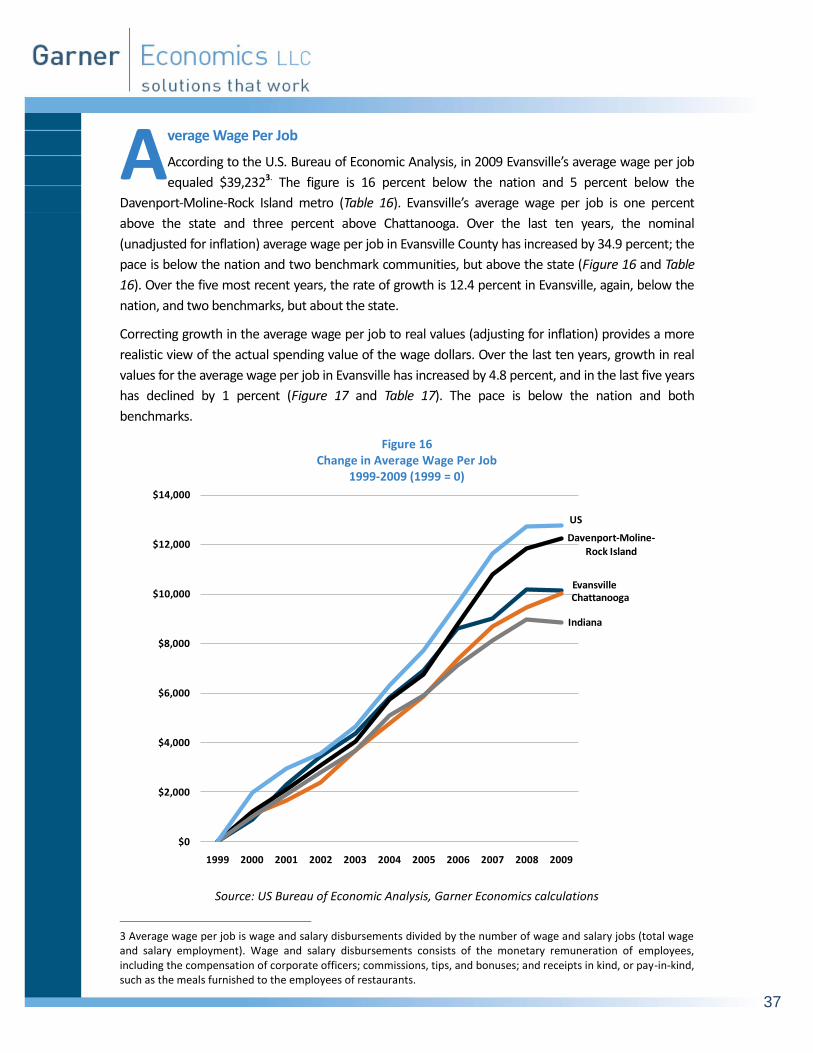
verage Wage Per Job
According to the U.S. Bureau of Economic Analysis, in 2009 Evansville’s average wage per job
equaled $39,2323. The figure is 16 percent below the nation and 5 percent below the
Davenport-Moline-Rock Island metro (Table 16). Evansville’s average wage per job is one percent
above the state and three percent above Chattanooga. Over the last ten years, the nominal
(unadjusted for inflation) average wage per job in Evansville County has increased by 34.9 percent; the
pace is below the nation and two benchmark communities, but above the state (Figure 16 and Table
16). Over the five most recent years, the rate of growth is 12.4 percent in Evansville, again, below the
nation, and two benchmarks, but about the state.
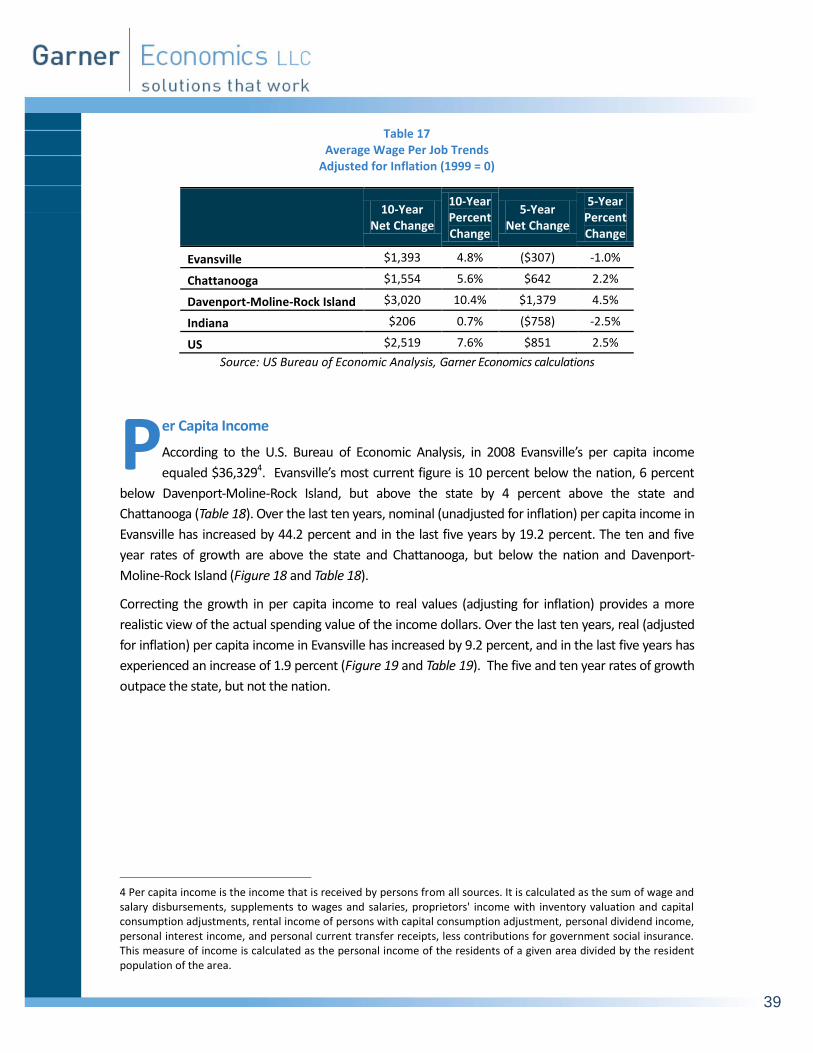
Correcting growth in the average wage per job to real values (adjusting for inflation) provides a more
realistic view of the actual spending value of the wage dollars. Over the last ten years, growth in real
values for the average wage per job in Evansville has increased by 4.8 percent, and in the last five years
has declined by 1 percent (Figure 17 and Table 17). The pace is below the nation and both
benchmarks.
Figure 16 Change in Average Wage Per Job
1999-2009 (1999 = 0)
Source: US Bureau of Economic Analysis, Garner Economics calculations
3 Average wage per job is wage and salary disbursements divided by the number of wage and salary jobs (total wage and salary employment). Wage and salary disbursements consists of the monetary remuneration of employees, including the compensation of corporate officers; commissions, tips, and bonuses; and receipts in kind, or pay-in-kind, such as the meals furnished to the employees of restaurants.
EvansvilleChattanooga
Davenport-Moline-Rock Island
Indiana
US
$0
$2,000
$4,000
$6,000
$8,000
$10,000
$12,000
$14,000
1999 2000 2001 2002 2003 2004 2005 2006 2007 2008 2009
A

38
Table 16 Average Wage Per Job
2009
10-Year Net Change
10-Year Percent Change
5-Year Net Change
5-Year Percent Change
Evansville $39,232 $10,159 34.9% $4,340 12.4%
Chattanooga $38,017 $10,049 35.9% $5,271 16.1%
Davenport-Moline-Rock Island $41,265 $12,240 42.2% $6,495 18.7%
Indiana $38,809 $8,878 29.7% $3,778 10.8%
US $45,831 $12,760 38.6% $6,442 16.4%
Source: US Bureau of Economic Analysis, Garner Economics calculations
Figure 17 Change in Average Wage Per Job (Adjusted for Inflation)
1999-2009 (1999 = 0)
Source: US Bureau of Economic Analysis, Garner Economics calculations
Evansville
Chattanooga
Davenport-Moline-Rock Island
Indiana
US
-$500
$0
$500
$1,000
$1,500
$2,000
$2,500
$3,000
$3,500
1999 2000 2001 2002 2003 2004 2005 2006 2007 2008 2009
39
Table 17 Average Wage Per Job Trends
Adjusted for Inflation (1999 = 0)
10-Year
Net Change
10-Year Percent Change
5-Year Net Change
5-Year Percent Change
Evansville $1,393 4.8% ($307) -1.0%
Chattanooga $1,554 5.6% $642 2.2%
Davenport-Moline-Rock Island $3,020 10.4% $1,379 4.5%
Indiana $206 0.7% ($758) -2.5%
US $2,519 7.6% $851 2.5%
Source: US Bureau of Economic Analysis, Garner Economics calculations
er Capita Income
According to the U.S. Bureau of Economic Analysis, in 2008 Evansville’s per capita income
equaled $36,3294. Evansville’s most current figure is 10 percent below the nation, 6 percent
below Davenport-Moline-Rock Island, but above the state by 4 percent above the state and
Chattanooga (Table 18). Over the last ten years, nominal (unadjusted for inflation) per capita income in
Evansville has increased by 44.2 percent and in the last five years by 19.2 percent. The ten and five
year rates of growth are above the state and Chattanooga, but below the nation and Davenport-
Moline-Rock Island (Figure 18 and Table 18).
Correcting the growth in per capita income to real values (adjusting for inflation) provides a more
realistic view of the actual spending value of the income dollars. Over the last ten years, real (adjusted
for inflation) per capita income in Evansville has increased by 9.2 percent, and in the last five years has
experienced an increase of 1.9 percent (Figure 19 and Table 19). The five and ten year rates of growth
outpace the state, but not the nation.
4 Per capita income is the income that is received by persons from all sources. It is calculated as the sum of wage and salary disbursements, supplements to wages and salaries, proprietors' income with inventory valuation and capital consumption adjustments, rental income of persons with capital consumption adjustment, personal dividend income, personal interest income, and personal current transfer receipts, less contributions for government social insurance. This measure of income is calculated as the personal income of the residents of a given area divided by the resident population of the area.
P

40
Figure 18 Change in Per Capita Income
1998-2008 (1998 = 0)
Source: US Bureau of Economic Analysis, Garner Economics calculations
Table 18
Per Capita Income
2008
10-Year Net Change
10-Year Percent Change
5-Year Net Change
5-Year Percent Change
Evansville $36,329 $11,134 44.2% $5,850 19.2%
Chattanooga $34,784 $10,189 41.4% $5,613 19.2%
Davenport-Moline-Rock Island $38,571 $12,588 48.4% $8,276 27.3%
Indiana $34,543 $9,374 37.2% $4,970 16.8%
US $40,166 $12,908 47.4% $7,895 24.5%
Source: US Bureau of Economic Analysis, Garner Economics calculations
Evansville
Chattanooga
Davenport-Moline-Rock Island
Indiana
US
$0
$2,000
$4,000
$6,000
$8,000
$10,000
$12,000
$14,000
1998 1999 2000 2001 2002 2003 2004 2005 2006 2007 2008

41
Figure 19 Change in Per Capita Income (Adjusted for Inflation)
1998-2008 (1998 = 0)
Source: US Bureau of Economic Analysis, Garner Economics calculations
Table 19 Per Capita Income Trends
Adjusted for Inflation (1998 = 0)
10-Year
Net Change
10-Year Percent Change
5-Year Net Change
5-Year Percent Change
Evansville $2,309 9.2% $503 1.9%
Chattanooga $1,739 7.1% $492 1.9%
Davenport-Moline-Rock Island $3,218 12.4% $2,364 8.8%
Indiana $983 3.9% ($46) -0.2%
US $3,151 11.6% $1,821 6.4%
Source: US Bureau of Economic Analysis, Garner Economics calculations
Evansville
Chattanooga
Davenport-Moline-Rock Island
Indiana
US
-$500
$0
$500
$1,000
$1,500
$2,000
$2,500
$3,000
$3,500
$4,000
1998 1999 2000 2001 2002 2003 2004 2005 2006 2007 2008

42
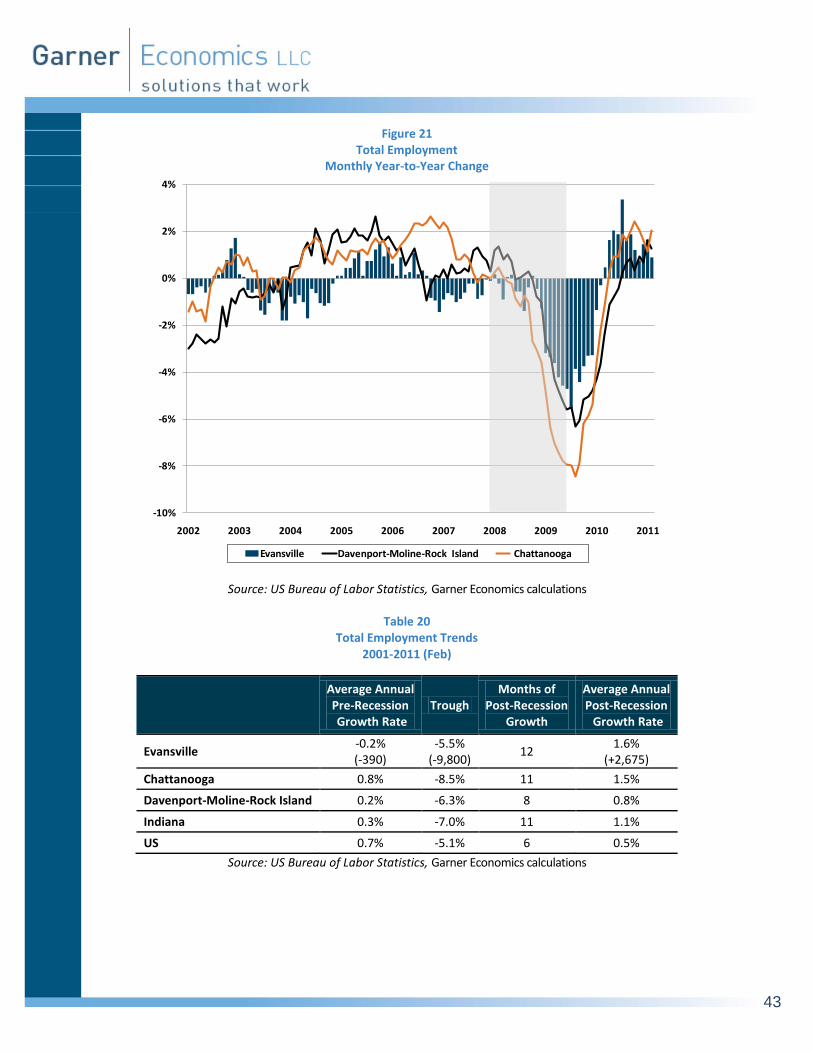
otal Employment
Through February 2011, Evansville has experienced 12 straight months of year-to-year
employment growth (Figure 20, Figure 21 and Table 20). The current pace of job growth is
averaging 1.6 percent, or an annual increase of 2,675 net new jobs. Evansville current pace of growth
is greater than the nation, state and both benchmark communities. At its lowest point, Evansville was
down 9,800 jobs, or -5.5 percent, just one month past the official end of the recent recession.5
Figure 20 Total Employment
Monthly Year-to-Year Change
Source: US Bureau of Labor Statistics, Garner Economics calculations
5 The recession is officially dated as beginning December 2007 and ending June 2009.
-8%
-6%
-4%
-2%
0%
2%
4%
2002 2003 2004 2005 2006 2007 2008 2009 2010 2011
Evansville Indiana US
T
43
Figure 21 Total Employment
Monthly Year-to-Year Change
Source: US Bureau of Labor Statistics, Garner Economics calculations
Table 20 Total Employment Trends
2001-2011 (Feb)
Average Annual Pre-Recession Growth Rate
Trough Months of
Post-Recession Growth
Average Annual Post-Recession Growth Rate
Evansville -0.2% (-390)
-5.5% (-9,800)
12 1.6%
(+2,675)
Chattanooga 0.8% -8.5% 11 1.5%
Davenport-Moline-Rock Island 0.2% -6.3% 8 0.8%
Indiana 0.3% -7.0% 11 1.1%
US 0.7% -5.1% 6 0.5%
Source: US Bureau of Labor Statistics, Garner Economics calculations
-10%
-8%
-6%
-4%
-2%
0%
2%
4%
2002 2003 2004 2005 2006 2007 2008 2009 2010 2011
Evansville Davenport-Moline-Rock Island Chattanooga
44
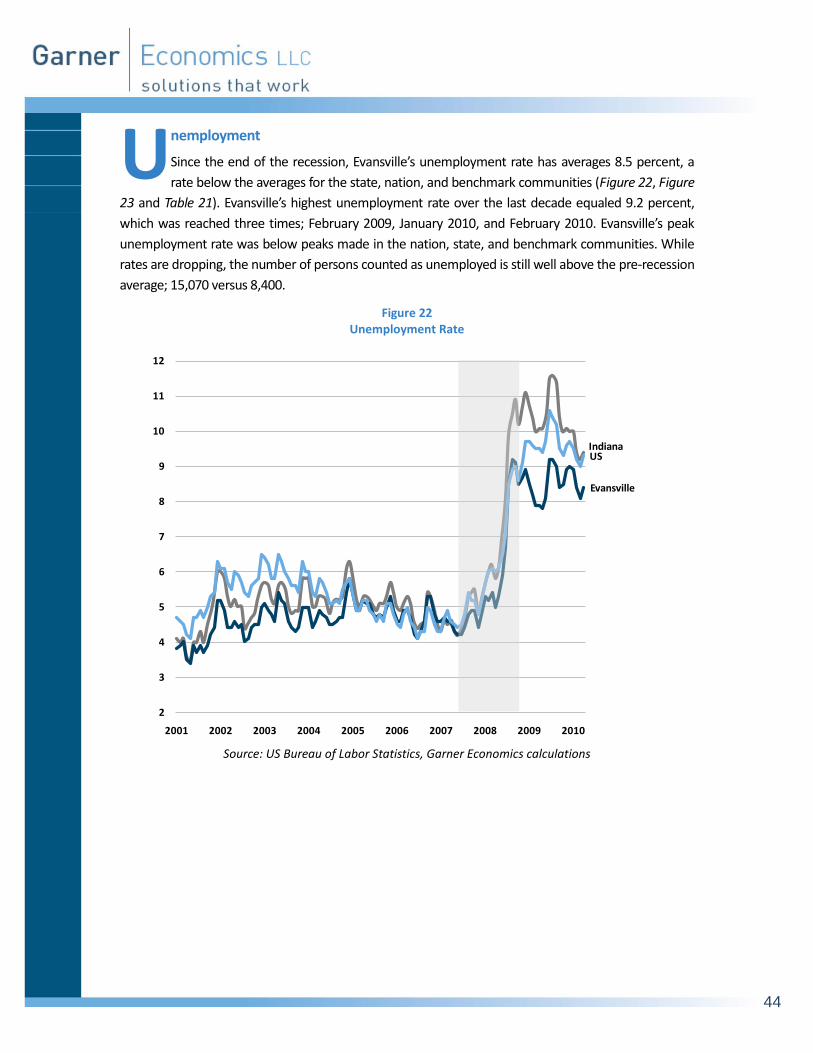
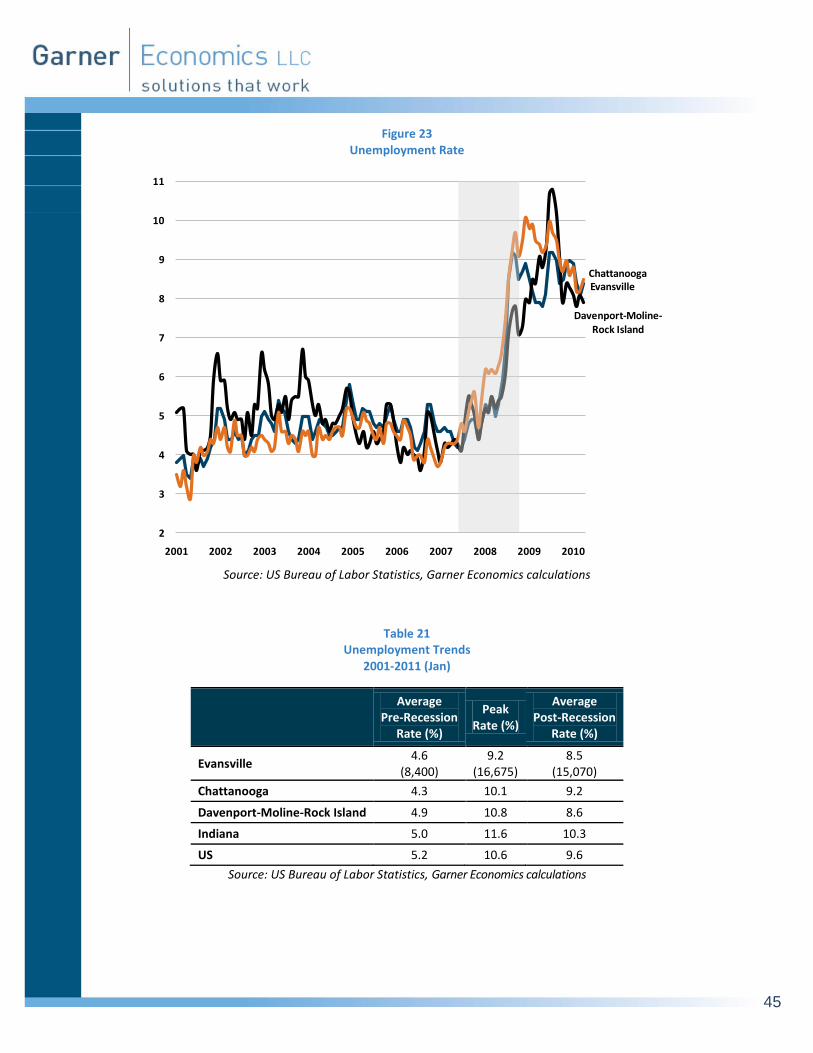
nemployment
Since the end of the recession, Evansville’s unemployment rate has averages 8.5 percent, a
rate below the averages for the state, nation, and benchmark communities (Figure 22, Figure
23 and Table 21). Evansville’s highest unemployment rate over the last decade equaled 9.2 percent,
which was reached three times; February 2009, January 2010, and February 2010. Evansville’s peak
unemployment rate was below peaks made in the nation, state, and benchmark communities. While
rates are dropping, the number of persons counted as unemployed is still well above the pre-recession
average; 15,070 versus 8,400.
Figure 22 Unemployment Rate
Source: US Bureau of Labor Statistics, Garner Economics calculations
Indiana
Evansville
US
2
3
4
5
6
7
8
9
10
11
12
2001 2002 2003 2004 2005 2006 2007 2008 2009 2010
U
45
Figure 23 Unemployment Rate
Source: US Bureau of Labor Statistics, Garner Economics calculations
Table 21 Unemployment Trends
2001-2011 (Jan)
Average Pre-Recession
Rate (%)
Peak Rate (%)
Average Post-Recession
Rate (%)
Evansville 4.6
(8,400) 9.2
(16,675) 8.5
(15,070)
Chattanooga 4.3 10.1 9.2
Davenport-Moline-Rock Island 4.9 10.8 8.6
Indiana 5.0 11.6 10.3
US 5.2 10.6 9.6
Source: US Bureau of Labor Statistics, Garner Economics calculations
Evansville
Davenport-Moline-Rock Island
Chattanooga
2
3
4
5
6
7
8
9
10
11
2001 2002 2003 2004 2005 2006 2007 2008 2009 2010

46
ajor Industry Sector Composition
A comparison of major industry composition provides a broad relative assessment of
differences among economies, and may help indicate areas of uniqueness. Generally,
Evansville has a relatively higher proportion of employment in Construction, Manufacturing, Private
Education and Health Services (Table 22). Conversely, the area has a lower relative proportion of
employment in Financial Activities, and Federal, State and Local Government. A much more detailed
analysis of Evansville’s industrial, occupational, and cluster specialization relative to the nation can be
found in Section 5.
Table 22 Percentage of Employment by Sector
September 2010
Evansville Chattanooga
Davenport-Moline
Rock Island Indiana US
# %
Natural Resources & Mining 2,063 1.2% 0.1% 0.7% 0.8% 1.5%
Construction 10,459 6.3% 4.0% 5.7% 4.4% 4.4%
Manufacturing 27,575 16.6% 13.1% 15.3% 16.6% 9.0%
Information 2,320 1.4% 1.5% 1.8% 1.3% 2.1%
Financial Activities 5,556 3.3% 7.4% 5.3% 4.5% 5.7%
Professional & Business Services 18,732 11.3% 9.2% 14.1% 10.2% 13.1%
Leisure & Hospitality 16,707 10.0% 10.9% 11.8% 10.2% 10.3%
Trade, Transportation, & Utilities 32,440 19.5% 21.5% 24.5% 19.6% 19.0%
Private Education & Health Services 27,576 16.6% 13.4% 16.8% 14.5% 14.5%
Total Private 148,780 89.4% 84.2% na 85.1% 83.3%
Total Government 17,575 10.6% 15.8% na 14.9% 16.7%
Federal Government 1,336 0.8% 2.8% na 1.4% 2.2%
State Government 3,249 2.0% 2.2% na 3.3% 3.6%
Local Government 12,990 7.8% 10.8% na 10.2% 10.8%
Source: US Bureau of Labor Statistics, Garner Economics calculations
M

47
rivate Business Establishments
Tracking the growth and decline in the number of private business establishments is a broad
indicator of economic vitality and dynamism. Over the nine most current years of data
available, Evansville has experienced subpar establishment activity, down over the entire 9 year period
by 2 percent, and up just 0.5 percent over the last five years (Figure 24 and Table 23). The rates are
below the nation, state, and one benchmark community.
Figure 24 Change in the Number of Private Business Establishments
2001 (3Q) - 2010 (3Q)
Source: US Bureau of Labor Statistics, Garner Economics calculations
Table 23 Private Business Establishments
2010 (3Q)
9-Year Net
Change
9-Year %
Change
5-Year Net
Change
5-Year %
Change
Evansville 8,228 (147) -1.8% 40 0.5%
Chattanooga 10,649 801 8.1% (82) -0.8%
Davenport-Moline-Rock Island 9,736 457 4.9% 189 2.0%
Indiana 151,190 4,744 3.2% 2,783 1.9%
US 8,746,332 997,988 12.9% 409,355 4.9%
Source: US Bureau of Labor Statistics, Garner Economics calculations
13%
3%
5%
8%
-2%
5%
2%
2%
-1%
0%
-2% 0% 2% 4% 6% 8% 10% 12% 14%
US
Indiana
Davenport-Moline-Rock Island
Chattanooga
Evansville
5-Year 9-Year
P

48
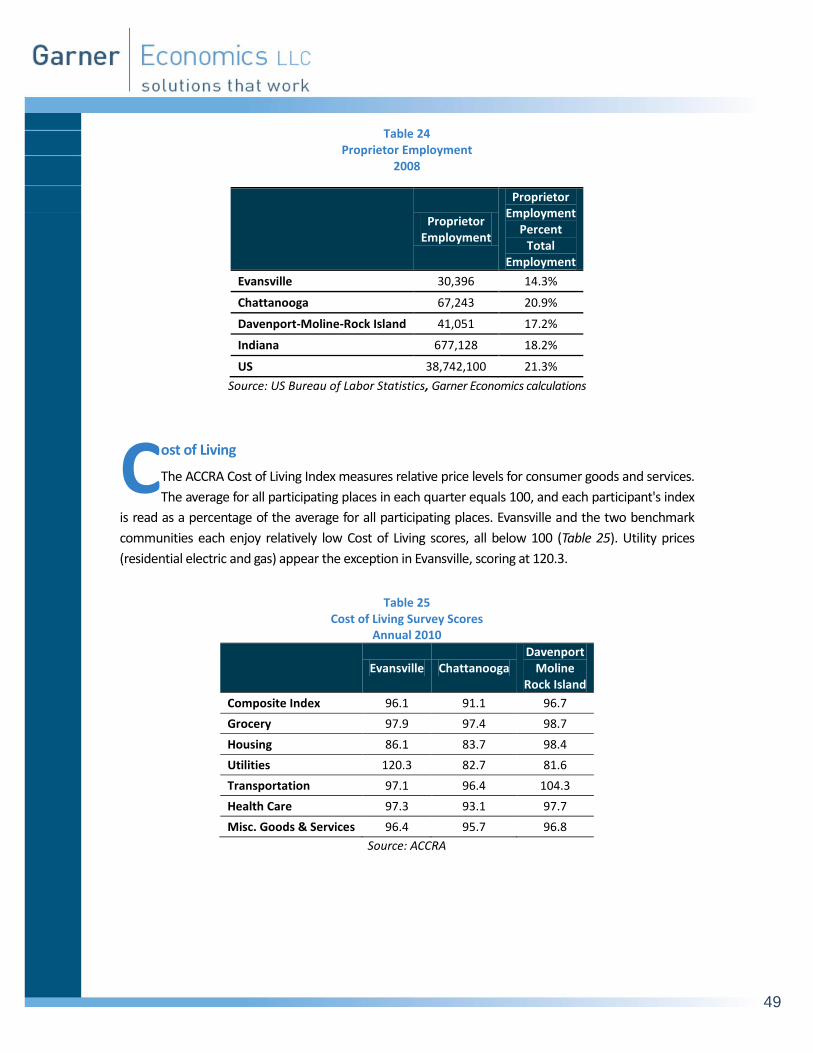
roprietor Employment
Measuring the relative proportion of proprietor employment is a means to gauge
entrepreneurial activity, which in turn provides a view of local risk-taking and dynamism.
According to the U.S. Bureau of Economic Analysis, as of 2008, proprietors accounted for 14.3 percent
of total employment in Evansville (Figure 25 and Table 24). The percentage is less than in the nation,
state or both benchmark communities.
Figure 25 Proprietor Employment as a Percent of Total Employment
2008
Source: US Bureau of Economic Analysis, Garner Economics calculations
14.3%
20.9%
17.2%18.2%
21.3%
0%
5%
10%
15%
20%
25%
Evansville Chattanooga Davenport-Moline Rock Island
Indiana US
P
49
Table 24 Proprietor Employment
2008
Proprietor
Employment
Proprietor Employment
Percent Total
Employment
Evansville 30,396 14.3%
Chattanooga 67,243 20.9%
Davenport-Moline-Rock Island 41,051 17.2%
Indiana 677,128 18.2%
US 38,742,100 21.3%
Source: US Bureau of Labor Statistics, Garner Economics calculations
ost of Living
The ACCRA Cost of Living Index measures relative price levels for consumer goods and services.
The average for all participating places in each quarter equals 100, and each participant's index
is read as a percentage of the average for all participating places. Evansville and the two benchmark
communities each enjoy relatively low Cost of Living scores, all below 100 (Table 25). Utility prices
(residential electric and gas) appear the exception in Evansville, scoring at 120.3.
Table 25
Cost of Living Survey Scores Annual 2010
Evansville Chattanooga
Davenport Moline
Rock Island
Composite Index 96.1 91.1 96.7
Grocery 97.9 97.4 98.7
Housing 86.1 83.7 98.4
Utilities 120.3 82.7 81.6
Transportation 97.1 96.4 104.3
Health Care 97.3 93.1 97.7
Misc. Goods & Services 96.4 95.7 96.8
Source: ACCRA
C
50
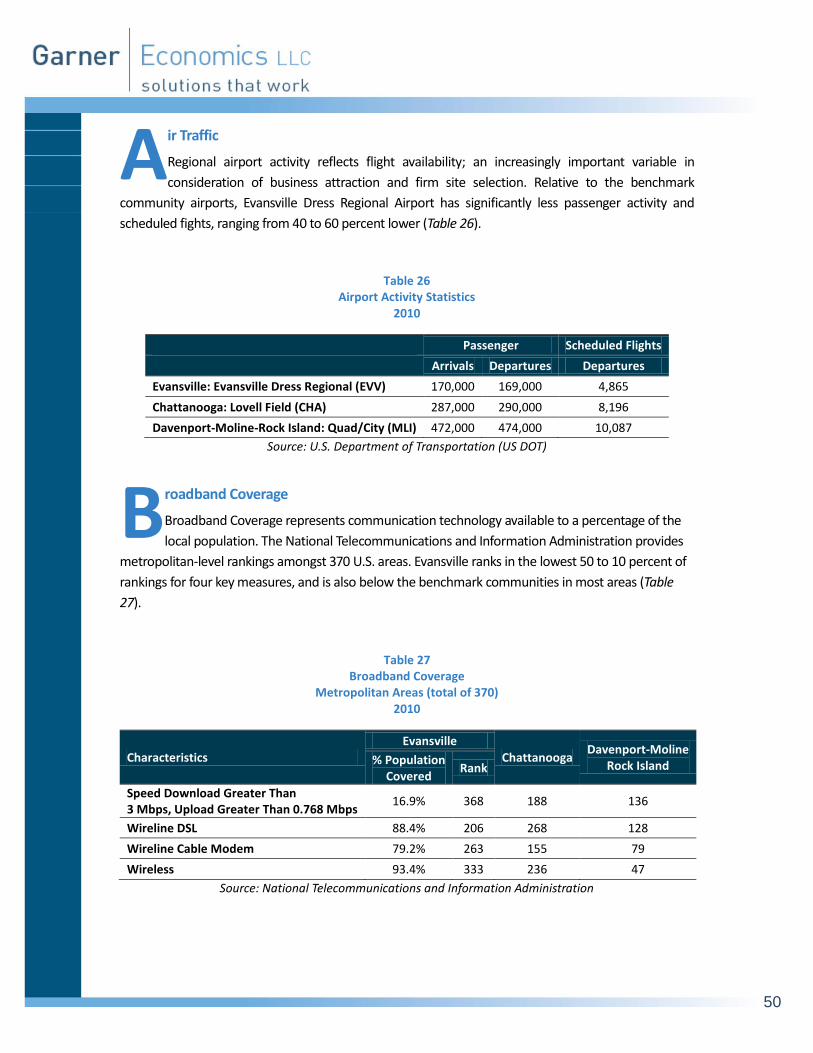
ir Traffic
Regional airport activity reflects flight availability; an increasingly important variable in
consideration of business attraction and firm site selection. Relative to the benchmark
community airports, Evansville Dress Regional Airport has significantly less passenger activity and
scheduled fights, ranging from 40 to 60 percent lower (Table 26).
Table 26 Airport Activity Statistics
2010
Passenger Scheduled Flights
Arrivals Departures Departures
Evansville: Evansville Dress Regional (EVV) 170,000 169,000 4,865
Chattanooga: Lovell Field (CHA) 287,000 290,000 8,196
Davenport-Moline-Rock Island: Quad/City (MLI) 472,000 474,000 10,087
Source: U.S. Department of Transportation (US DOT)
roadband Coverage
Broadband Coverage represents communication technology available to a percentage of the
local population. The National Telecommunications and Information Administration provides
metropolitan-level rankings amongst 370 U.S. areas. Evansville ranks in the lowest 50 to 10 percent of
rankings for four key measures, and is also below the benchmark communities in most areas (Table
27).
Table 27 Broadband Coverage
Metropolitan Areas (total of 370) 2010
Characteristics
Evansville
Chattanooga Davenport-Moline
Rock Island % Population Covered
Rank
Speed Download Greater Than 3 Mbps, Upload Greater Than 0.768 Mbps
16.9% 368 188 136
Wireline DSL 88.4% 206 268 128
Wireline Cable Modem 79.2% 263 155 79
Wireless 93.4% 333 236 47
Source: National Telecommunications and Information Administration
A
B

51
SECTION 5: LOCAL SPECIALIZATION, COMPETITIVENESS & GROWTH
he following section provides a detailed and objective assessment of the Evansville economy.
The analysis examines the local economy from several different perspectives, each adding a
supporting layer of information. The assessment’s main goals are to provide historic context,
reveal areas of unique specialization, gauge competitiveness, and help uncover emerging trends and
opportunities.
The three main subjects of analysis are: occupations, major industries, and industry clusters. For each
area there are relative measures of specialization, growth, local competitiveness, and earnings.
The presentation tools of the assessment are bubble/scatter charts, ranking charts and tables.
Definitions:
Specialization: measured using location quotient (LQ).6 Reflects the level of relative
concentration of a particular occupation/industry/cluster in Evansville to the nation. In
simple terms, a high LQ’s (above 1.2) indicates what a local economy is good at doing,
and infers there are unique skills, institutions, raw materials, etc. that support this
position.
Occupational or Industry Effect: The portion of growth/decline attributed to a particular
occupation or industry nationwide. For example, if nurse or hospital employment grew
by 5 percent nationwide in 2009, we would expect to see the same percentage increase
locally, assuming that the forces driving nationwide growth would have a similar local
impact.
Local Competitive Effect: The proportion of growth/decline not captured by the
occupational or industry effect, indicating local unique performance. The local
competitive effect measures local activity outside the expected nationwide trend. A
consistent positive local competitive effect signals superior local performance.
Detailed occupational and industry information for Evansville can be found in the Appendix.
6 To measure local specialization, location quotients (LQs) for each occupation, industry or cluster is derived. LQs are ratios of an area's distribution of employment for a specific occupation/industry/cluster compared to a reference or base area's distribution. In this analysis the reference area is the U.S. If an LQ is equal to 1, then the industry has the same share of its area employment as it does in the reference area. An LQ greater than 1 indicates an industry with a greater share of the local area employment than is the case in the reference area and implies local specialization. LQs are calculated by first, dividing local industry employment by the all industry total of local employment. Second, reference area industry employment is divided by the all industry total for the reference area. Finally, the local ratio is divided by the reference area ratio.
T

52
ccupational Specialization & Growth
Evansville’s most highly specialized major occupational group is Production, with an LQ of
2.06 and total employment equaling 22,303 (Figure 26 and Table 28). Other highly
specialized occupational groups are Installation, maintenance & repair, Construction & extraction, and
Transportation & material moving.
Although not as specialized, Healthcare practitioners & technical and Healthcare support experienced
net growth over the 2006-2011 (1Q) period.
Figure 26 Major Occupational Groups
Growth & Specialization Evansville Metro
Source: Economic Modeling Specialist, Garner Economics calculations
Management
Business & financial operations
Computer & mathematical science
Architecture & engineering
Life, physical, & social science
Community & social services
Legal
Education, training, & library
Arts, design, entertainment, sports, & media
Healthcare practitioners & technical
Healthcare support
Protective service
Food preparation & serving related
Building & grounds cleaning & maintenance
Personal care & service
Sales & related
Office & administrative support
Farming, fishing, & forestry
Construction & extraction
Installation, maintenance, & repair
Production
Transportation & material moving
Military
0.0
0.5
1.0
1.5
2.0
2.5
-5,000 -4,000 -3,000 -2,000 -1,000 0 1,000 2,000
De
gre
e o
f Sp
eci
aliz
atio
n
Employment Growth 2006-2011 (1Q)
AT-RISK COMPETITIVE
DECLINING EMERGING
O
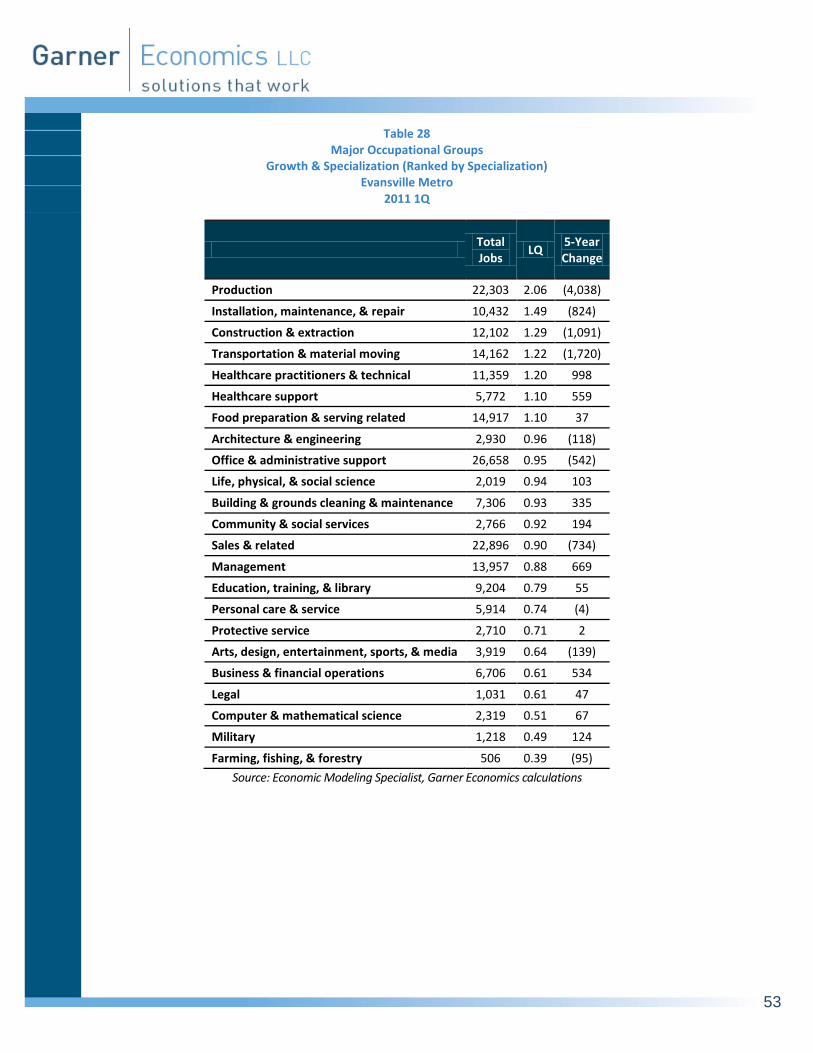
53
Table 28 Major Occupational Groups
Growth & Specialization (Ranked by Specialization) Evansville Metro
2011 1Q
Total Jobs
LQ 5-Year Change
Production 22,303 2.06 (4,038)
Installation, maintenance, & repair 10,432 1.49 (824)
Construction & extraction 12,102 1.29 (1,091)
Transportation & material moving 14,162 1.22 (1,720)
Healthcare practitioners & technical 11,359 1.20 998
Healthcare support 5,772 1.10 559
Food preparation & serving related 14,917 1.10 37
Architecture & engineering 2,930 0.96 (118)
Office & administrative support 26,658 0.95 (542)
Life, physical, & social science 2,019 0.94 103
Building & grounds cleaning & maintenance 7,306 0.93 335
Community & social services 2,766 0.92 194
Sales & related 22,896 0.90 (734)
Management 13,957 0.88 669
Education, training, & library 9,204 0.79 55
Personal care & service 5,914 0.74 (4)
Protective service 2,710 0.71 2
Arts, design, entertainment, sports, & media 3,919 0.64 (139)
Business & financial operations 6,706 0.61 534
Legal 1,031 0.61 47
Computer & mathematical science 2,319 0.51 67
Military 1,218 0.49 124
Farming, fishing, & forestry 506 0.39 (95)
Source: Economic Modeling Specialist, Garner Economics calculations

54
Occupational Competitiveness
Several occupational groups in Evansville have experienced growth exceeding national trends, implying a local competitive edge; the leaders are Construction & extraction, office & administrative
support, and Production (Figure 27 and Table 29). Four occupational groups experienced positive Occupational/Industry and local competitive effect growth; Management, Building & grounds cleaning & maintenance, Military, and Legal.
Figure 27 Major Occupational Groups
Sources of Employment Change Evansville Metro 2006-2011 (1Q)
Source: Economic Modeling Specialist, Garner Economics calculations
Architecture & engineering Arts, design, entertainment,
sports, & media
Building & grounds cleaning & maintenance
Business & financial operations
Community & social services
Computer & mathematical science
Construction & extraction
Education, training, & library
Farming, fishing, & forestry
Food preparation & serving related
Healthcare practitioners & technical
Healthcare support
Installation, maintenance, & repair
Legal
Life, physical, & social science
Management
Military
Office & administrative support
Personal care & service
Production
Protective service Sales & related
Transportation & material moving
-5,000
-4,000
-3,000
-2,000
-1,000
0
1,000
2,000
-1,000 -500 0 500 1,000 1,500
Occ
up
atio
nal
/In
du
stry
Eff
ect
Local Competitive Effect
Locally UncompetitiveGrowing Field
Locally CompetitiveGrowing Field
Locally UncompetitiveDecling Field
Locally CompetitiveDeclining Field
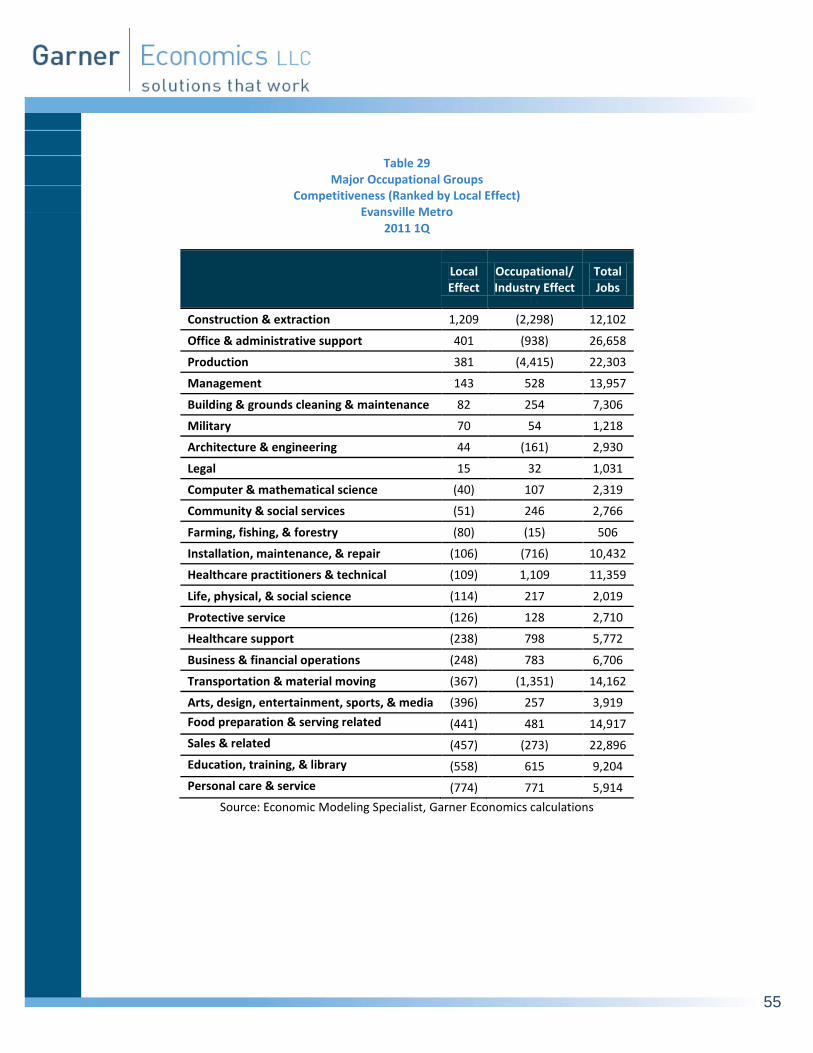
55
Table 29 Major Occupational Groups
Competitiveness (Ranked by Local Effect) Evansville Metro
2011 1Q
Local Effect
Occupational/ Industry Effect
Total Jobs
Construction & extraction 1,209 (2,298) 12,102
Office & administrative support 401 (938) 26,658
Production 381 (4,415) 22,303
Management 143 528 13,957
Building & grounds cleaning & maintenance 82 254 7,306
Military 70 54 1,218
Architecture & engineering 44 (161) 2,930
Legal 15 32 1,031
Computer & mathematical science (40) 107 2,319
Community & social services (51) 246 2,766
Farming, fishing, & forestry (80) (15) 506
Installation, maintenance, & repair (106) (716) 10,432
Healthcare practitioners & technical (109) 1,109 11,359
Life, physical, & social science (114) 217 2,019
Protective service (126) 128 2,710
Healthcare support (238) 798 5,772
Business & financial operations (248) 783 6,706
Transportation & material moving (367) (1,351) 14,162
Arts, design, entertainment, sports, & media (396) 257 3,919
Food preparation & serving related (441) 481 14,917
Sales & related (457) (273) 22,896
Education, training, & library (558) 615 9,204
Personal care & service (774) 771 5,914
Source: Economic Modeling Specialist, Garner Economics calculations
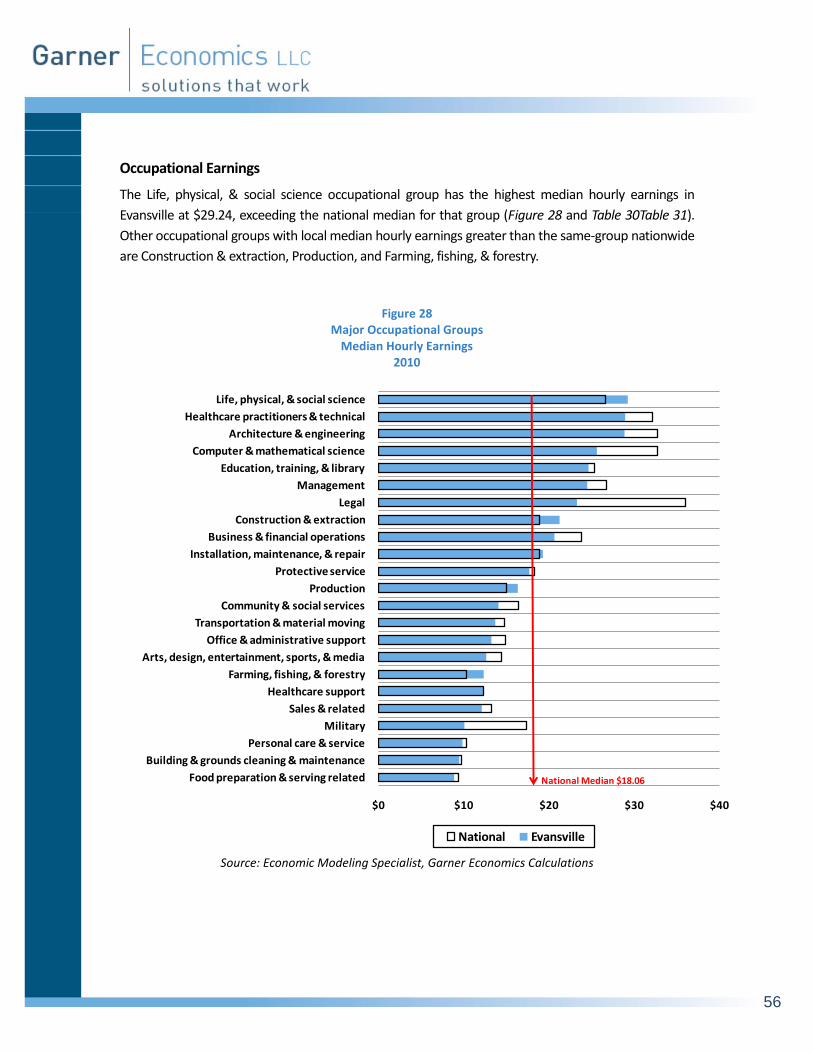
56
Occupational Earnings
The Life, physical, & social science occupational group has the highest median hourly earnings in
Evansville at $29.24, exceeding the national median for that group (Figure 28 and Table 30Table 31).
Other occupational groups with local median hourly earnings greater than the same-group nationwide
are Construction & extraction, Production, and Farming, fishing, & forestry.
Figure 28 Major Occupational Groups
Median Hourly Earnings 2010
Source: Economic Modeling Specialist, Garner Economics Calculations
$0 $10 $20 $30 $40
Food preparation & serving related
Building & grounds cleaning & maintenance
Personal care & service
Military
Sales & related
Healthcare support
Farming, fishing, & forestry
Arts, design, entertainment, sports, & media
Office & administrative support
Transportation & material moving
Community & social services
Production
Protective service
Installation, maintenance, & repair
Business & financial operations
Construction & extraction
Legal
Management
Education, training, & library
Computer & mathematical science
Architecture & engineering
Healthcare practitioners & technical
Life, physical, & social science
National Evansville
National Median $18.06

57
Table 30 Major Occupational Groups
Median Hourly Earnings (Ranked) 2010
Evansville National
Life, physical, & social science $29.24 $26.65
Healthcare practitioners & technical $28.99 $32.16
Architecture & engineering $28.89 $32.79
Computer & mathematical science $25.68 $32.72
Education, training, & library $24.65 $25.37
Management $24.54 $26.77
Legal $23.29 $36.08
Construction & extraction $21.25 $18.95
Business & financial operations $20.67 $23.83
Installation, maintenance, & repair $19.32 $18.85
Protective service $17.76 $18.34
Production $16.33 $15.07
Community & social services $14.08 $16.48
Transportation & material moving $13.75 $14.80
Office & administrative support $13.25 $14.90
Arts, design, entertainment, sports, & media $12.64 $14.47
Farming, fishing, & forestry $12.33 $10.39
Healthcare support $12.27 $12.37
Sales & related $12.11 $13.29
Military $10.09 $17.41
Personal care & service $9.86 $10.31
Building & grounds cleaning & maintenance $9.52 $9.80
Food preparation & serving related $8.89 $9.41
Source: Economic Modeling Specialist, Garner Economics calculations
.
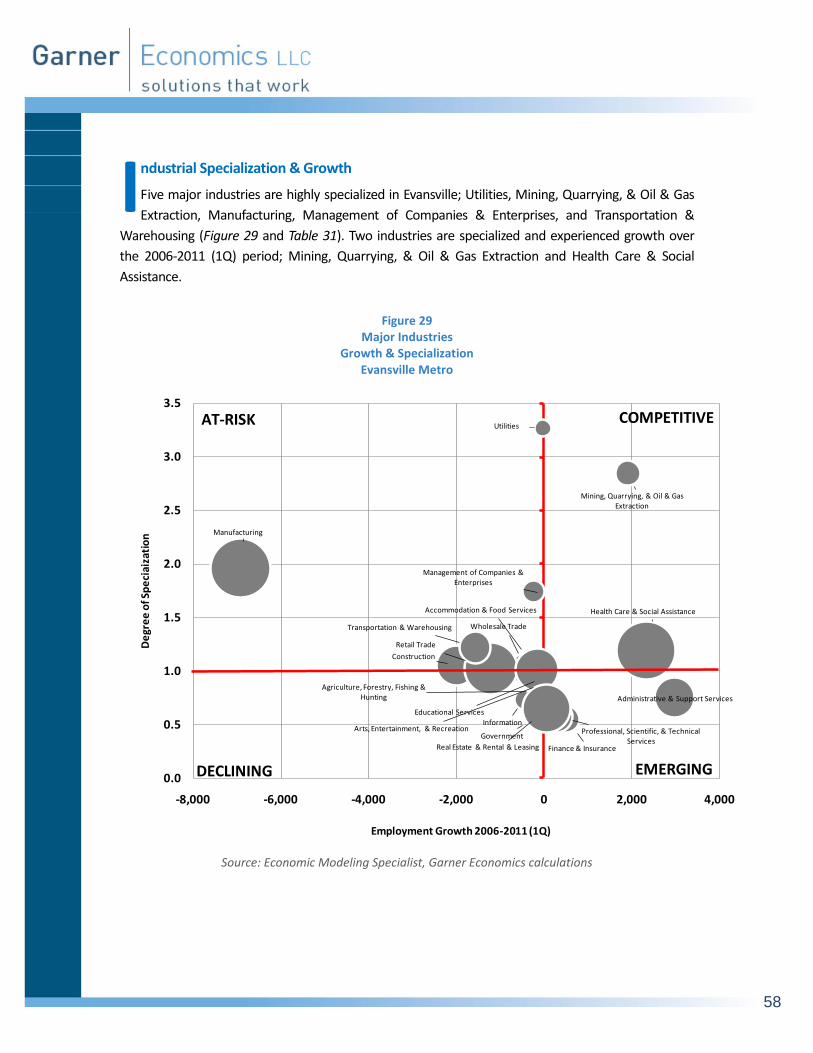
58
ndustrial Specialization & Growth
Five major industries are highly specialized in Evansville; Utilities, Mining, Quarrying, & Oil & Gas
Extraction, Manufacturing, Management of Companies & Enterprises, and Transportation &
Warehousing (Figure 29 and Table 31). Two industries are specialized and experienced growth over
the 2006-2011 (1Q) period; Mining, Quarrying, & Oil & Gas Extraction and Health Care & Social
Assistance.
Figure 29
Major Industries Growth & Specialization
Evansville Metro
Source: Economic Modeling Specialist, Garner Economics calculations
Agriculture, Forestry, Fishing & Hunting
Mining, Quarrying, & Oil & Gas Extraction
Utilities
Construction
Manufacturing
Wholesale Trade
Retail Trade
Transportation & Warehousing
Information
Finance & InsuranceReal Estate & Rental & Leasing
Professional, Scientific, & Technical Services
Management of Companies & Enterprises
Administrative & Support Services
Educational Services
Health Care & Social Assistance
Arts, Entertainment, & Recreation
Accommodation & Food Services
Government
0.0
0.5
1.0
1.5
2.0
2.5
3.0
3.5
-8,000 -6,000 -4,000 -2,000 0 2,000 4,000
De
gre
e o
f Sp
eci
aiza
tio
n
Employment Growth 2006-2011 (1Q)
AT-RISK COMPETITIVE
DECLINING EMERGING
I
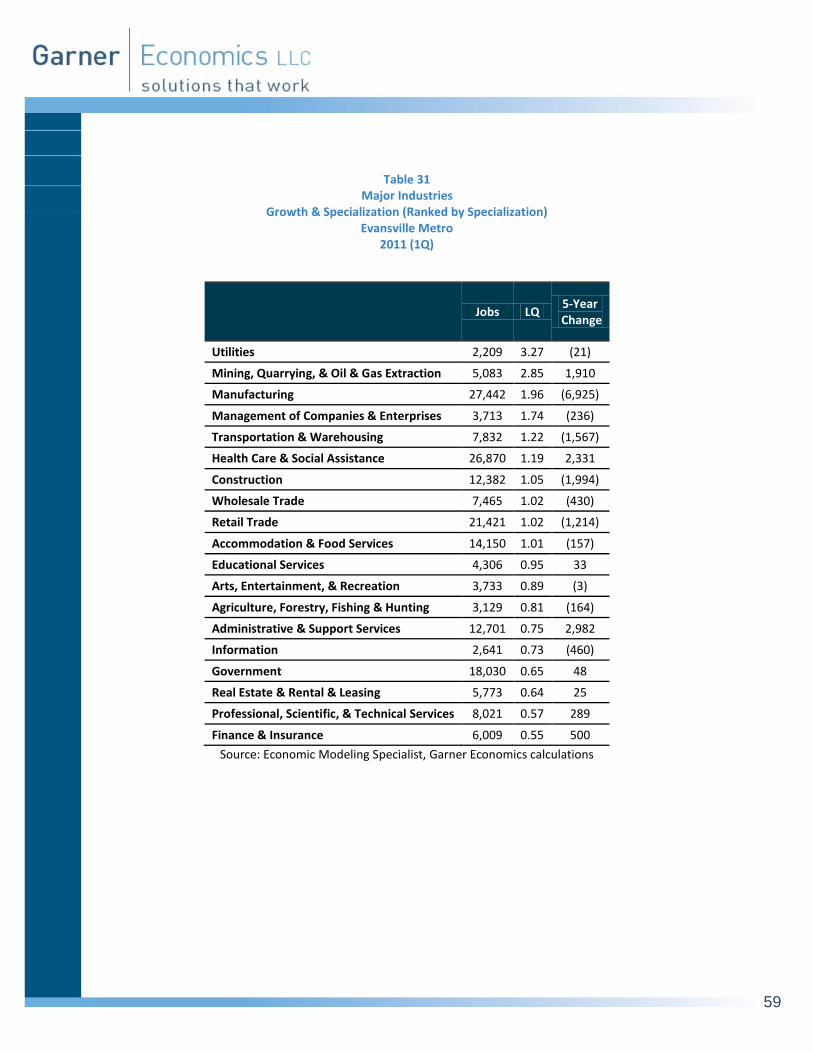
59
Table 31 Major Industries
Growth & Specialization (Ranked by Specialization) Evansville Metro
2011 (1Q)
Jobs LQ
5-Year Change
Utilities 2,209 3.27 (21)
Mining, Quarrying, & Oil & Gas Extraction 5,083 2.85 1,910
Manufacturing 27,442 1.96 (6,925)
Management of Companies & Enterprises 3,713 1.74 (236)
Transportation & Warehousing 7,832 1.22 (1,567)
Health Care & Social Assistance 26,870 1.19 2,331
Construction 12,382 1.05 (1,994)
Wholesale Trade 7,465 1.02 (430)
Retail Trade 21,421 1.02 (1,214)
Accommodation & Food Services 14,150 1.01 (157)
Educational Services 4,306 0.95 33
Arts, Entertainment, & Recreation 3,733 0.89 (3)
Agriculture, Forestry, Fishing & Hunting 3,129 0.81 (164)
Administrative & Support Services 12,701 0.75 2,982
Information 2,641 0.73 (460)
Government 18,030 0.65 48
Real Estate & Rental & Leasing 5,773 0.64 25
Professional, Scientific, & Technical Services 8,021 0.57 289
Finance & Insurance 6,009 0.55 500
Source: Economic Modeling Specialist, Garner Economics calculations
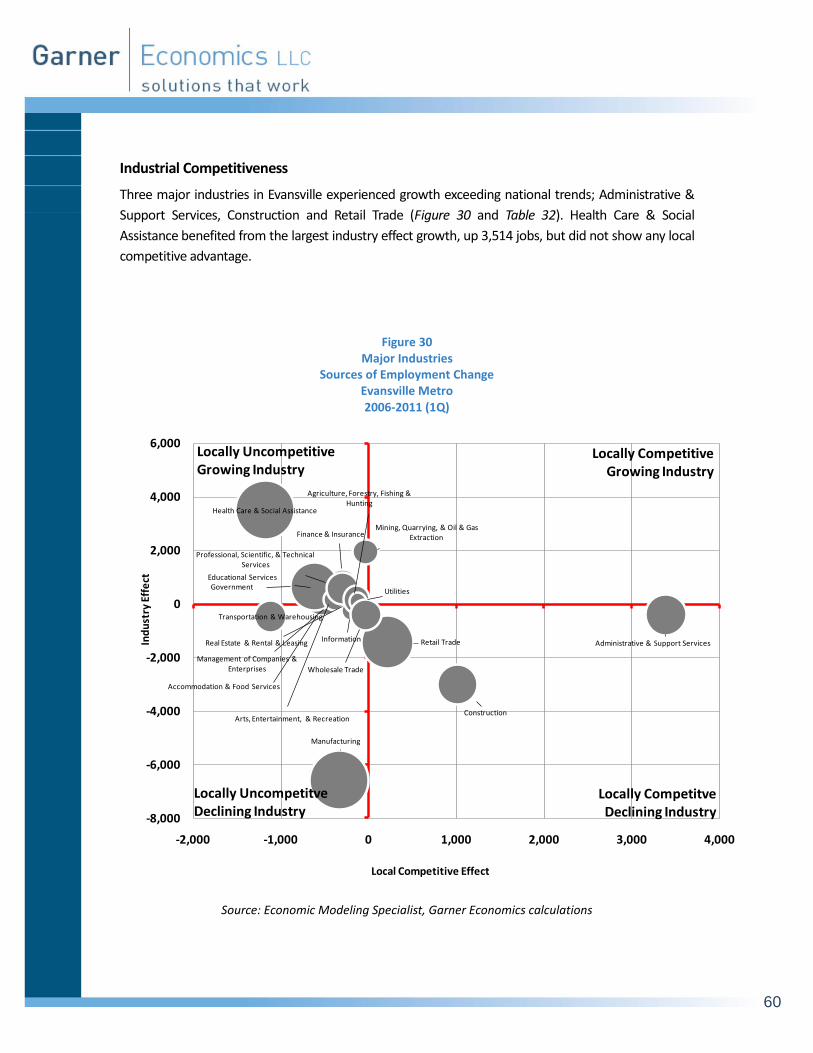
60
Industrial Competitiveness
Three major industries in Evansville experienced growth exceeding national trends; Administrative &
Support Services, Construction and Retail Trade (Figure 30 and Table 32). Health Care & Social
Assistance benefited from the largest industry effect growth, up 3,514 jobs, but did not show any local
competitive advantage.
Figure 30 Major Industries
Sources of Employment Change Evansville Metro 2006-2011 (1Q)
Source: Economic Modeling Specialist, Garner Economics calculations
Accommodation & Food Services
Administrative & Support Services
Agriculture, Forestry, Fishing & Hunting
Arts, Entertainment, & RecreationConstruction
Educational Services
Finance & Insurance
Government
Health Care & Social Assistance
Information
Management of Companies & Enterprises
Manufacturing
Mining, Quarrying, & Oil & Gas Extraction
Professional, Scientific, & Technical Services
Real Estate & Rental & Leasing Retail Trade
Transportation & Warehousing
Utilities
Wholesale Trade
-8,000
-6,000
-4,000
-2,000
0
2,000
4,000
6,000
-2,000 -1,000 0 1,000 2,000 3,000 4,000
Ind
ust
ry E
ffe
ct
Local Competitive Effect
Locally UncompetitiveGrowing Industry
Locally CompetitiveGrowing Industry
Locally UncompetitveDeclining Industry
Locally CompetitveDeclining Industry
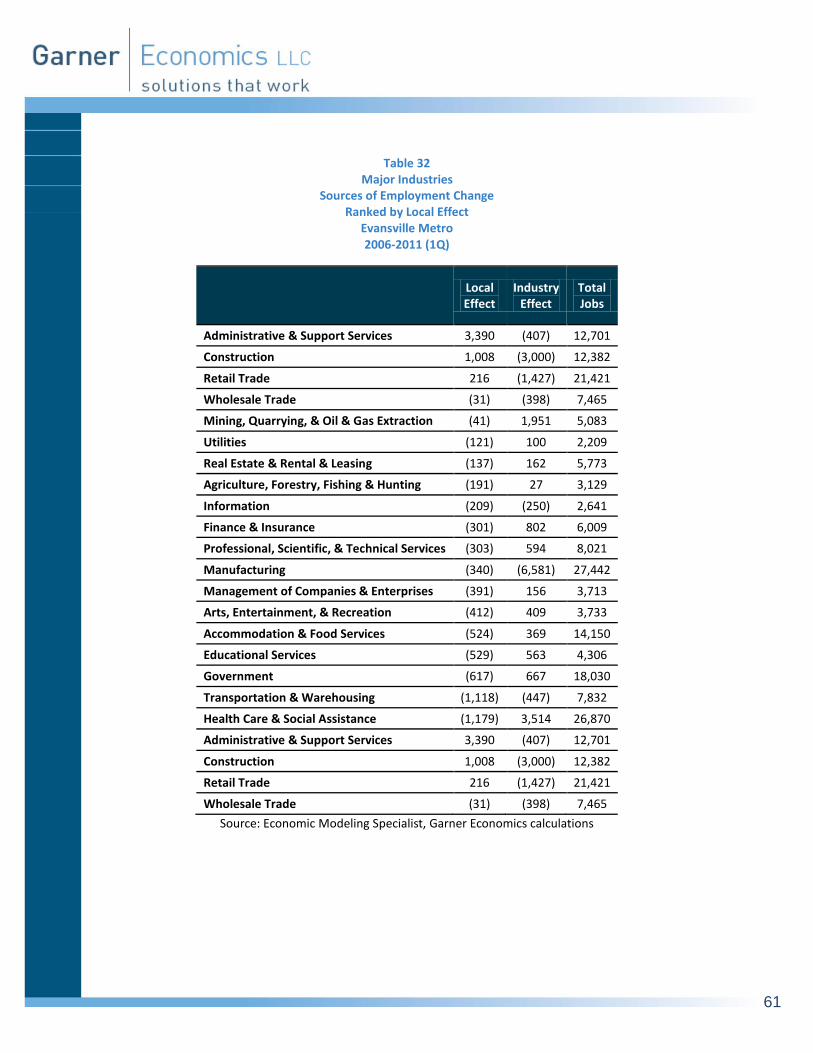
61
Table 32 Major Industries
Sources of Employment Change Ranked by Local Effect
Evansville Metro 2006-2011 (1Q)
Local Effect
Industry Effect
Total Jobs
Administrative & Support Services 3,390 (407) 12,701
Construction 1,008 (3,000) 12,382
Retail Trade 216 (1,427) 21,421
Wholesale Trade (31) (398) 7,465
Mining, Quarrying, & Oil & Gas Extraction (41) 1,951 5,083
Utilities (121) 100 2,209
Real Estate & Rental & Leasing (137) 162 5,773
Agriculture, Forestry, Fishing & Hunting (191) 27 3,129
Information (209) (250) 2,641
Finance & Insurance (301) 802 6,009
Professional, Scientific, & Technical Services (303) 594 8,021
Manufacturing (340) (6,581) 27,442
Management of Companies & Enterprises (391) 156 3,713
Arts, Entertainment, & Recreation (412) 409 3,733
Accommodation & Food Services (524) 369 14,150
Educational Services (529) 563 4,306
Government (617) 667 18,030
Transportation & Warehousing (1,118) (447) 7,832
Health Care & Social Assistance (1,179) 3,514 26,870
Administrative & Support Services 3,390 (407) 12,701
Construction 1,008 (3,000) 12,382
Retail Trade 216 (1,427) 21,421
Wholesale Trade (31) (398) 7,465
Source: Economic Modeling Specialist, Garner Economics calculations
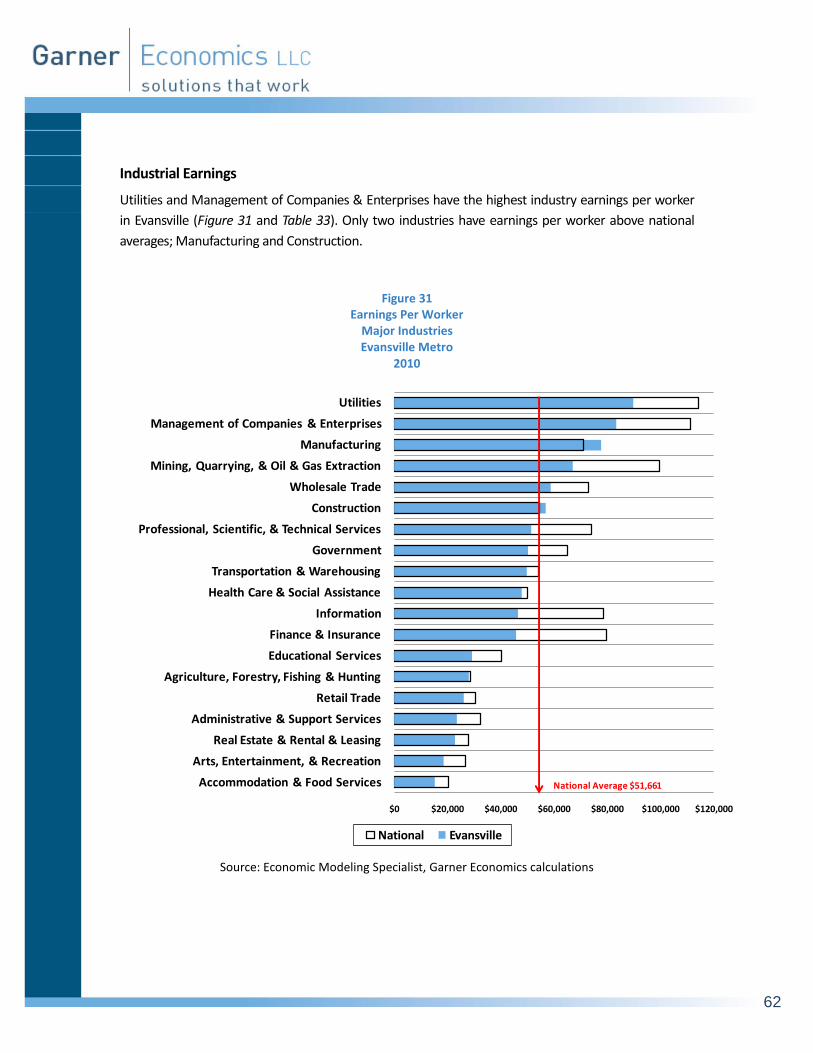
62
Industrial Earnings
Utilities and Management of Companies & Enterprises have the highest industry earnings per worker
in Evansville (Figure 31 and Table 33). Only two industries have earnings per worker above national
averages; Manufacturing and Construction.
Figure 31 Earnings Per Worker
Major Industries Evansville Metro
2010
Source: Economic Modeling Specialist, Garner Economics calculations
$0 $20,000 $40,000 $60,000 $80,000 $100,000 $120,000
Accommodation & Food Services
Arts, Entertainment, & Recreation
Real Estate & Rental & Leasing
Administrative & Support Services
Retail Trade
Agriculture, Forestry, Fishing & Hunting
Educational Services
Finance & Insurance
Information
Health Care & Social Assistance
Transportation & Warehousing
Government
Professional, Scientific, & Technical Services
Construction
Wholesale Trade
Mining, Quarrying, & Oil & Gas Extraction
Manufacturing
Management of Companies & Enterprises
Utilities
National Evansville
National Average $51,661
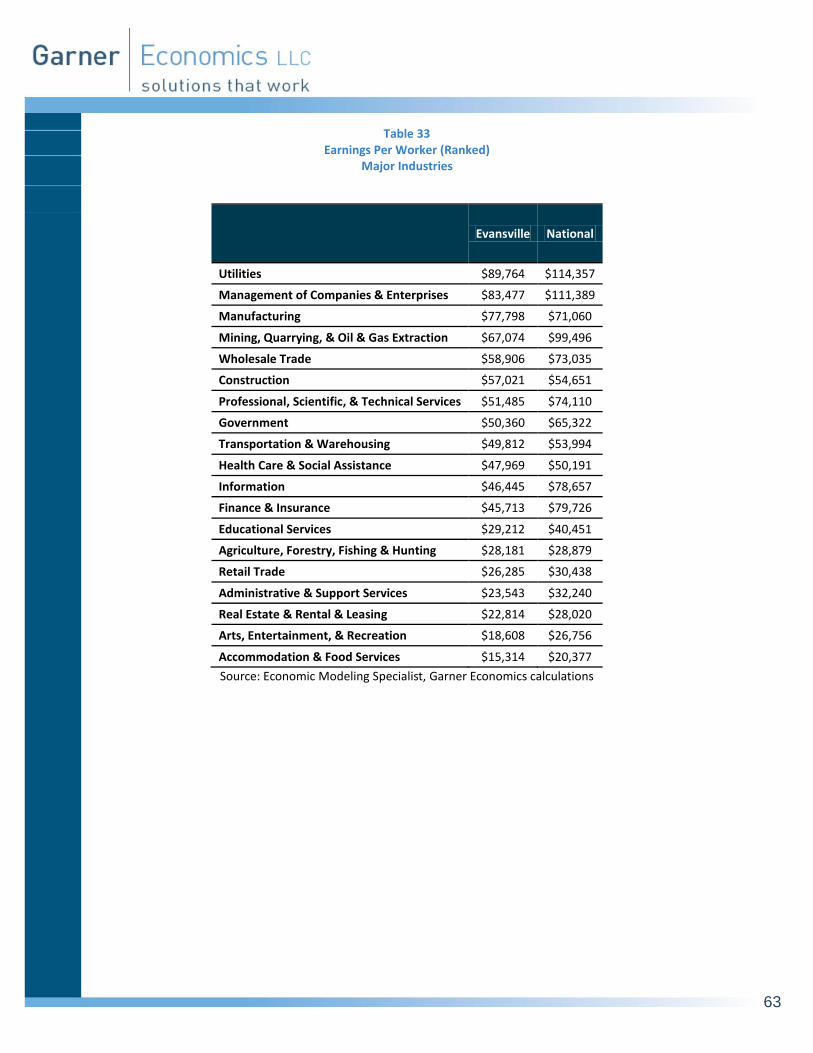
63
Table 33 Earnings Per Worker (Ranked)
Major Industries
Evansville National
Utilities $89,764 $114,357
Management of Companies & Enterprises $83,477 $111,389
Manufacturing $77,798 $71,060
Mining, Quarrying, & Oil & Gas Extraction $67,074 $99,496
Wholesale Trade $58,906 $73,035
Construction $57,021 $54,651
Professional, Scientific, & Technical Services $51,485 $74,110
Government $50,360 $65,322
Transportation & Warehousing $49,812 $53,994
Health Care & Social Assistance $47,969 $50,191
Information $46,445 $78,657
Finance & Insurance $45,713 $79,726
Educational Services $29,212 $40,451
Agriculture, Forestry, Fishing & Hunting $28,181 $28,879
Retail Trade $26,285 $30,438
Administrative & Support Services $23,543 $32,240
Real Estate & Rental & Leasing $22,814 $28,020
Arts, Entertainment, & Recreation $18,608 $26,756
Accommodation & Food Services $15,314 $20,377
Source: Economic Modeling Specialist, Garner Economics calculations

64
ndustry Cluster Specialization & Growth
Evansville has two industry clusters7 which display local specialization and positive employment
growth; Biomedical/Biotechnical (Life Sciences) and Energy (Figure 32 and Table 34). The two most
highly specialized industry clusters in Evansville are Primary Metal Mfg. and Plastics Mfg.
Figure 32 Industry Clusters
Growth & Specialization Evansville Metro
Source: Economic Modeling Specialist, Garner Economics calculations
7 Industry clusters are geographic concentrations of interconnected businesses, suppliers, and associated institutions
in a particular field. Clusters are considered to increase the productivity with which companies can compete, nationally and globally. For the analysis we start with cluster definitions developed by the Purdue Center for Regional Development, and the Indiana Business Research Center at Indiana University's Kelley School of Business through work funded by U.S. Commerce Department's Economic Development Administration. Garner Economics adjusts cluster components to better match the location and particular economic situation. Additionally new clusters are developed to align with unique regional economic activity.
Advanced Materials
Agribusiness, Food Processing &
Technology
Apparel & Textiles
Arts, Entertainment, Recreation & Visitor Industries
Biomedical/Biotechnical (Life Sciences)
Business & Financial Services
Chemicals & Chemical Based Products
Computer & Electronic Product Mfg
Defense & Security
Education & Knowledge Creation
Electrical Equipment, Appliance &
Component Mfg
Energy (Fossil & Renewable)
Fabricated Metal Product Mfg
Forest & Wood Products
Glass & Ceramics
Information Technology &
Telecommunications
Machinery Mfg
Mining
Primary Metal Mfg
Printing & Publishing
Transportation & Logistics
Transportation Equipment Mfg
Plastics Mfg
0
1
2
3
4
5
6
7
8
-4,000 -3,000 -2,000 -1,000 0 1,000 2,000 3,000
Deg
ree
of S
pec
ializ
atio
n
Employment Growth 2006-2011 (1Q)
AT-RISK COMPETITIVE
EMERGINGDECLINING
I

65
Table 34
Industry Clusters Growth & Specialization (Ranked by Specialization)
Evansville Metro 2011 (1Q)
Cluster Name LQ Jobs 5-Year
Change
Primary Metal Mfg 7.47 3,046 (1,332)
Plastics Mfg 6.96 4,708 (1,064)
Electrical Equipment, Appliance & Component Mfg 4.02 1,679 (1,357)
Transportation Equipment Mfg 3.83 5,949 (366)
Chemicals & Chemical Based Products 3.72 8,834 (2,043)
Advanced Materials 2.02 11,285 (3,489)
Glass & Ceramics 1.95 594 (234)
Energy (Fossil & Renewable) 1.88 10,643 1,728
Biomedical/Biotechnical (Life Sciences) 1.31 20,912 2,128
Transportation & Logistics 1.16 6,810 (1,442)
Agribusiness, Food Processing & Technology 1.11 6,616 (485)
Fabricated Metal Product Mfg 0.93 1,387 (404)
Mining 0.90 490 (66)
Forest & Wood Products 0.85 2,460 (904)
Apparel & Textiles 0.79 1,151 (335)
Education & Knowledge Creation 0.75 3,413 (198)
Machinery Mfg 0.70 817 (230)
Arts, Entertainment, Recreation & Visitor Industries 0.69 5,658 (529)
Printing & Publishing 0.67 2,321 (310)
Information Technology & Telecommunications 0.60 4,901 (649)
Business & Financial Services 0.50 12,356 821
Defense & Security 0.48 2,907 181
Computer & Electronic Product Mfg 0.30 379 (214)
Source: Economic Modeling Specialist, Garner Economics calculations
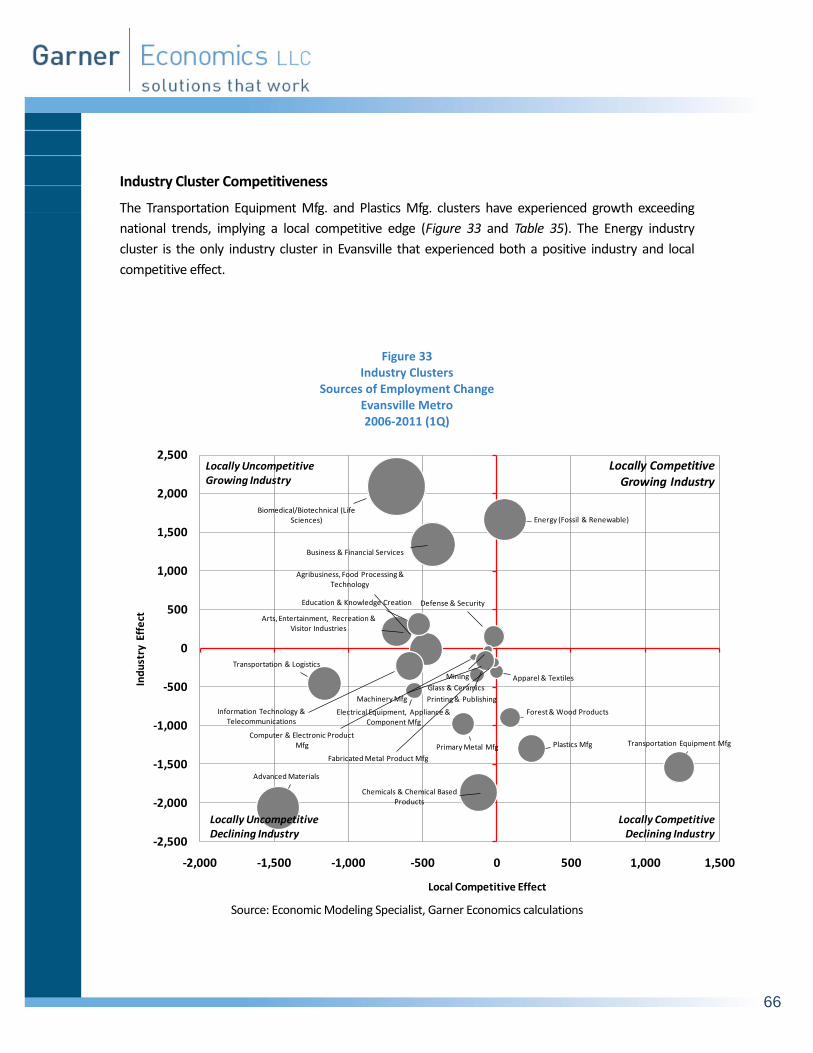
66
Industry Cluster Competitiveness
The Transportation Equipment Mfg. and Plastics Mfg. clusters have experienced growth exceeding
national trends, implying a local competitive edge (Figure 33 and Table 35). The Energy industry
cluster is the only industry cluster in Evansville that experienced both a positive industry and local
competitive effect.
Figure 33 Industry Clusters
Sources of Employment Change Evansville Metro 2006-2011 (1Q)
Source: Economic Modeling Specialist, Garner Economics calculations
Advanced Materials
Agribusiness, Food Processing & Technology
Apparel & Textiles
Arts, Entertainment, Recreation & Visitor Industries
Biomedical/Biotechnical (Life Sciences)
Business & Financial Services
Chemicals & Chemical Based Products
Computer & Electronic Product Mfg
Defense & Security Education & Knowledge Creation
Electrical Equipment, Appliance & Component Mfg
Energy (Fossil & Renewable)
Fabricated Metal Product Mfg
Forest & Wood Products
Glass & Ceramics
Information Technology & Telecommunications
Machinery Mfg
Mining
Primary Metal Mfg
Printing & Publishing
Transportation & Logistics
Transportation Equipment Mfg Plastics Mfg
-2,500
-2,000
-1,500
-1,000
-500
0
500
1,000
1,500
2,000
2,500
-2,000 -1,500 -1,000 -500 0 500 1,000 1,500
Ind
ust
ry E
ffe
ct
Local Competitive Effect
Locally CompetitiveGrowing Industry
Locally CompetitiveDeclining Industry
Locally UncompetitiveGrowing Industry
Locally UncompetitiveDeclining Industry
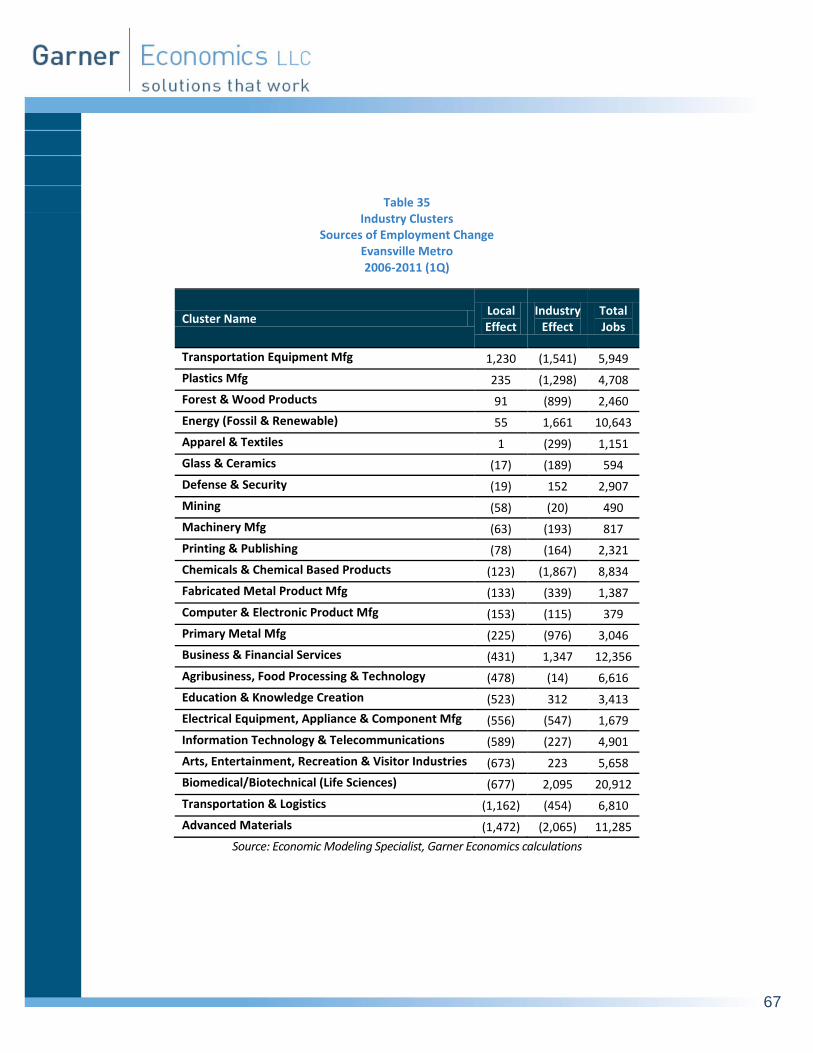
67
Table 35 Industry Clusters
Sources of Employment Change Evansville Metro 2006-2011 (1Q)
Cluster Name Local Effect
Industry Effect
Total Jobs
Transportation Equipment Mfg 1,230 (1,541) 5,949
Plastics Mfg 235 (1,298) 4,708
Forest & Wood Products 91 (899) 2,460
Energy (Fossil & Renewable) 55 1,661 10,643
Apparel & Textiles 1 (299) 1,151
Glass & Ceramics (17) (189) 594
Defense & Security (19) 152 2,907
Mining (58) (20) 490
Machinery Mfg (63) (193) 817
Printing & Publishing (78) (164) 2,321
Chemicals & Chemical Based Products (123) (1,867) 8,834
Fabricated Metal Product Mfg (133) (339) 1,387
Computer & Electronic Product Mfg (153) (115) 379
Primary Metal Mfg (225) (976) 3,046
Business & Financial Services (431) 1,347 12,356
Agribusiness, Food Processing & Technology (478) (14) 6,616
Education & Knowledge Creation (523) 312 3,413
Electrical Equipment, Appliance & Component Mfg (556) (547) 1,679
Information Technology & Telecommunications (589) (227) 4,901
Arts, Entertainment, Recreation & Visitor Industries (673) 223 5,658
Biomedical/Biotechnical (Life Sciences) (677) 2,095 20,912
Transportation & Logistics (1,162) (454) 6,810
Advanced Materials (1,472) (2,065) 11,285
Source: Economic Modeling Specialist, Garner Economics calculations
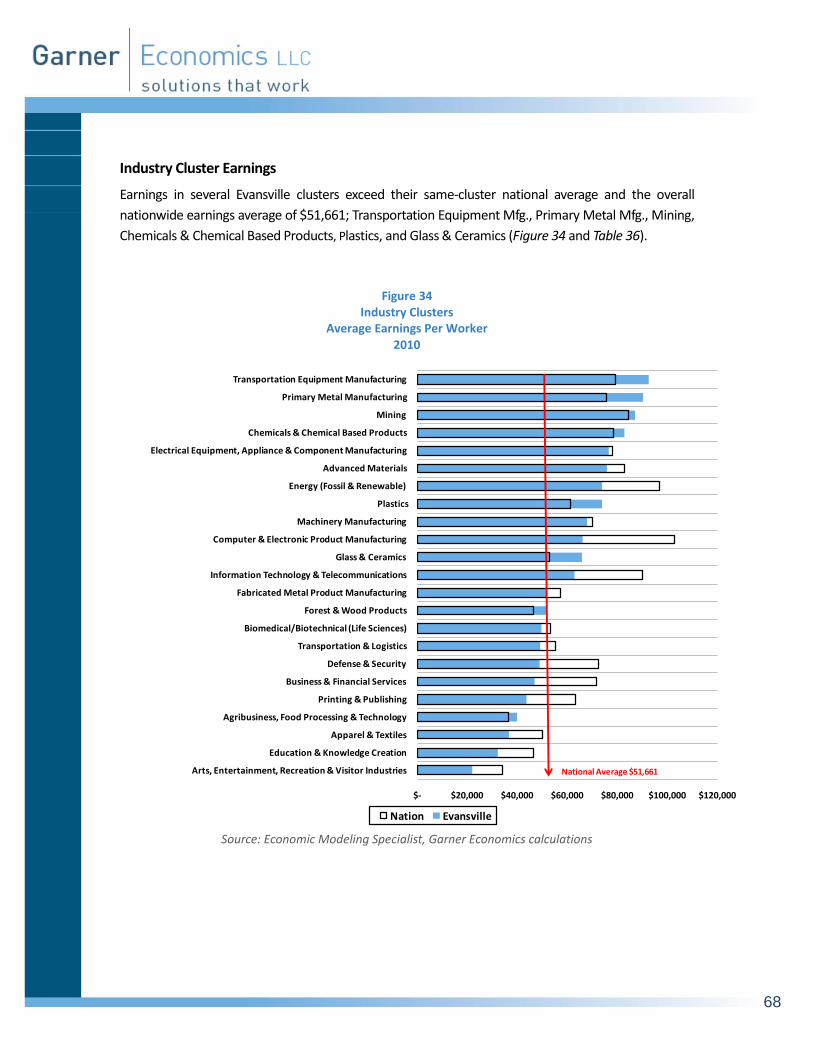
68
Industry Cluster Earnings
Earnings in several Evansville clusters exceed their same-cluster national average and the overall
nationwide earnings average of $51,661; Transportation Equipment Mfg., Primary Metal Mfg., Mining,
Chemicals & Chemical Based Products, Plastics, and Glass & Ceramics (Figure 34 and Table 36).
Figure 34 Industry Clusters
Average Earnings Per Worker 2010
Source: Economic Modeling Specialist, Garner Economics calculations
$- $20,000 $40,000 $60,000 $80,000 $100,000 $120,000
Arts, Entertainment, Recreation & Visitor Industries
Education & Knowledge Creation
Apparel & Textiles
Agribusiness, Food Processing & Technology
Printing & Publishing
Business & Financial Services
Defense & Security
Transportation & Logistics
Biomedical/Biotechnical (Life Sciences)
Forest & Wood Products
Fabricated Metal Product Manufacturing
Information Technology & Telecommunications
Glass & Ceramics
Computer & Electronic Product Manufacturing
Machinery Manufacturing
Plastics
Energy (Fossil & Renewable)
Advanced Materials
Electrical Equipment, Appliance & Component Manufacturing
Chemicals & Chemical Based Products
Mining
Primary Metal Manufacturing
Transportation Equipment Manufacturing
Nation Evansville
National Average $51,661
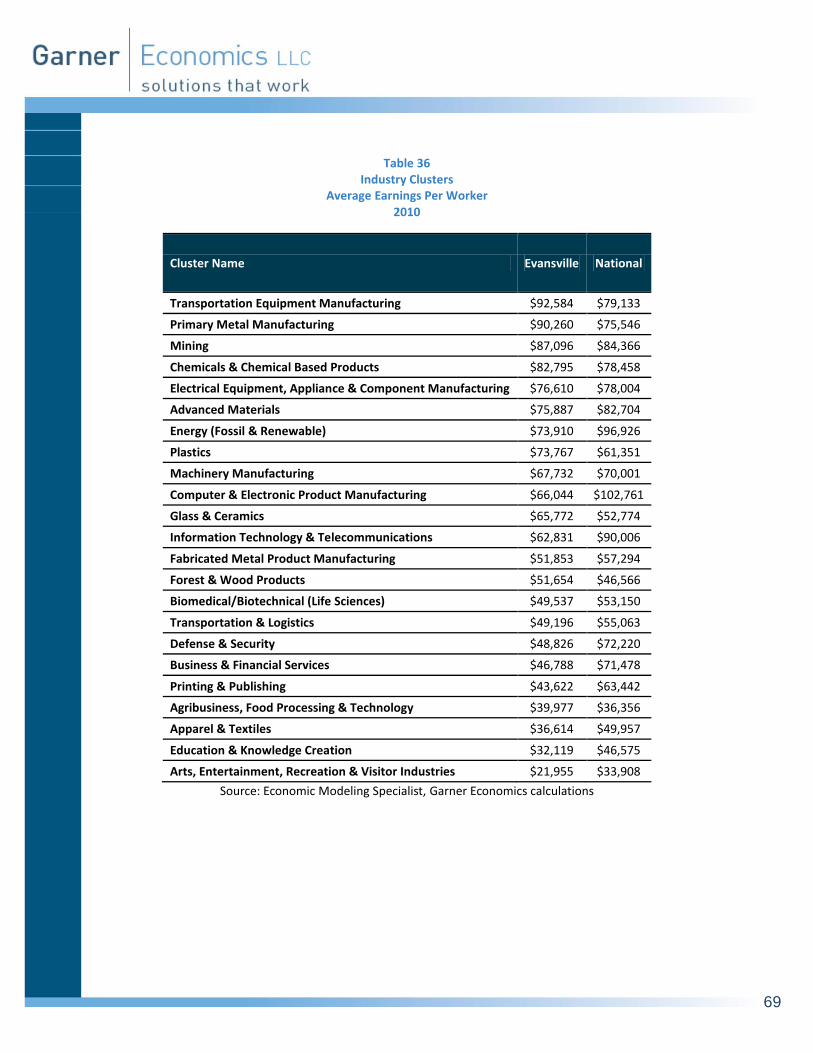
69
Table 36 Industry Clusters
Average Earnings Per Worker 2010
Cluster Name Evansville National
Transportation Equipment Manufacturing $92,584 $79,133
Primary Metal Manufacturing $90,260 $75,546
Mining $87,096 $84,366
Chemicals & Chemical Based Products $82,795 $78,458
Electrical Equipment, Appliance & Component Manufacturing $76,610 $78,004
Advanced Materials $75,887 $82,704
Energy (Fossil & Renewable) $73,910 $96,926
Plastics $73,767 $61,351
Machinery Manufacturing $67,732 $70,001
Computer & Electronic Product Manufacturing $66,044 $102,761
Glass & Ceramics $65,772 $52,774
Information Technology & Telecommunications $62,831 $90,006
Fabricated Metal Product Manufacturing $51,853 $57,294
Forest & Wood Products $51,654 $46,566
Biomedical/Biotechnical (Life Sciences) $49,537 $53,150
Transportation & Logistics $49,196 $55,063
Defense & Security $48,826 $72,220
Business & Financial Services $46,788 $71,478
Printing & Publishing $43,622 $63,442
Agribusiness, Food Processing & Technology $39,977 $36,356
Apparel & Textiles $36,614 $49,957
Education & Knowledge Creation $32,119 $46,575
Arts, Entertainment, Recreation & Visitor Industries $21,955 $33,908
Source: Economic Modeling Specialist, Garner Economics calculations
70
CONCLUSION
This report notes the many key
assets the EDC region has in its
ability to attract, retain and grow
opportunity. Conversely, the
report notes a number of
challenges that the region must
address for the area to enhance its
global competitiveness.
his Competitive Realities Report is the first report of three reports for the Coalition’s economic
development strategy process. This document helps to identify the
area’s strengths which can be marketed, and the region’s
challenges, which will need to be addressed and remediated as
Southwest Indiana seeks to further develop its regional economy.
Careful consideration was given in the selection of the region’s
benchmarks. The Chattanooga TN metro area and the
Davenport-Moline-Rock Island of Iowa and Illinois were
selected based on comparable demographic and industry
specialization similarities. This report notes the many key
assets the EDC region has in its ability to attract retain and grow
opportunity. Conversely, the report notes a number of
challenges that the region must address for the area to enhance its
global competitiveness.
T
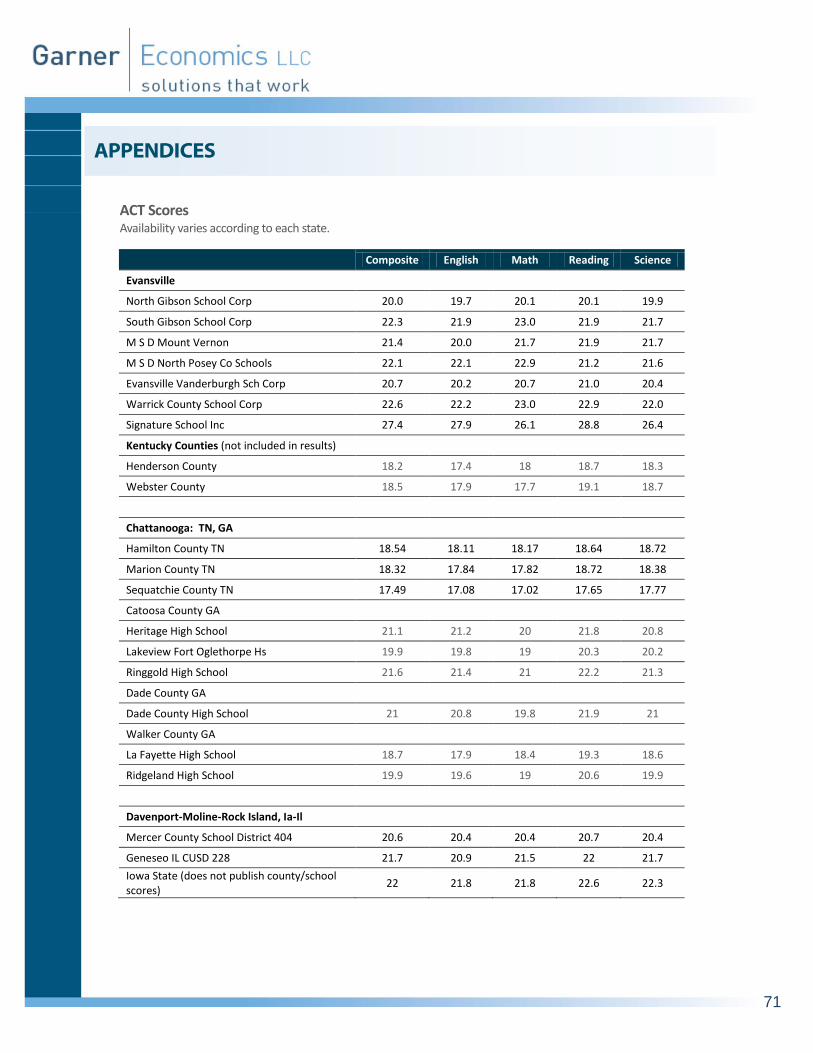
71
APPENDICES
ACT Scores Availability varies according to each state.
Composite English Math Reading Science
Evansville
North Gibson School Corp 20.0 19.7 20.1 20.1 19.9
South Gibson School Corp 22.3 21.9 23.0 21.9 21.7
M S D Mount Vernon 21.4 20.0 21.7 21.9 21.7
M S D North Posey Co Schools 22.1 22.1 22.9 21.2 21.6
Evansville Vanderburgh Sch Corp 20.7 20.2 20.7 21.0 20.4
Warrick County School Corp 22.6 22.2 23.0 22.9 22.0
Signature School Inc 27.4 27.9 26.1 28.8 26.4
Kentucky Counties (not included in results)
Henderson County 18.2 17.4 18 18.7 18.3
Webster County 18.5 17.9 17.7 19.1 18.7
Chattanooga: TN, GA
Hamilton County TN 18.54 18.11 18.17 18.64 18.72
Marion County TN 18.32 17.84 17.82 18.72 18.38
Sequatchie County TN 17.49 17.08 17.02 17.65 17.77
Catoosa County GA
Heritage High School 21.1 21.2 20 21.8 20.8
Lakeview Fort Oglethorpe Hs 19.9 19.8 19 20.3 20.2
Ringgold High School 21.6 21.4 21 22.2 21.3
Dade County GA
Dade County High School 21 20.8 19.8 21.9 21
Walker County GA
La Fayette High School 18.7 17.9 18.4 19.3 18.6
Ridgeland High School 19.9 19.6 19 20.6 19.9
Davenport-Moline-Rock Island, Ia-Il
Mercer County School District 404 20.6 20.4 20.4 20.7 20.4
Geneseo IL CUSD 228 21.7 20.9 21.5 22 21.7
Iowa State (does not publish county/school scores)
22 21.8 21.8 22.6 22.3
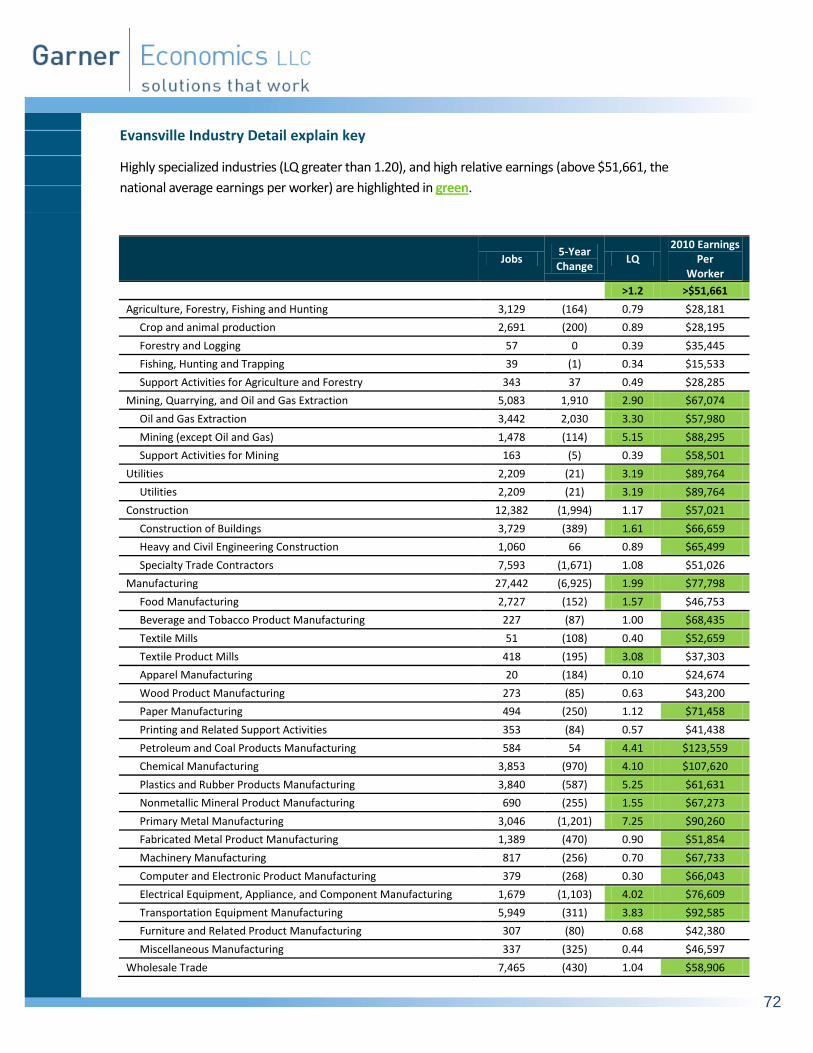
72
Evansville Industry Detail explain key
Highly specialized industries (LQ greater than 1.20), and high relative earnings (above $51,661, the
national average earnings per worker) are highlighted in green.
Jobs
5-Year Change
LQ 2010 Earnings
Per Worker
>1.2 >$51,661
Agriculture, Forestry, Fishing and Hunting 3,129 (164) 0.79 $28,181
Crop and animal production 2,691 (200) 0.89 $28,195
Forestry and Logging 57 0 0.39 $35,445
Fishing, Hunting and Trapping 39 (1) 0.34 $15,533
Support Activities for Agriculture and Forestry 343 37 0.49 $28,285
Mining, Quarrying, and Oil and Gas Extraction 5,083 1,910 2.90 $67,074
Oil and Gas Extraction 3,442 2,030 3.30 $57,980
Mining (except Oil and Gas) 1,478 (114) 5.15 $88,295
Support Activities for Mining 163 (5) 0.39 $58,501
Utilities 2,209 (21) 3.19 $89,764
Utilities 2,209 (21) 3.19 $89,764
Construction 12,382 (1,994) 1.17 $57,021
Construction of Buildings 3,729 (389) 1.61 $66,659
Heavy and Civil Engineering Construction 1,060 66 0.89 $65,499
Specialty Trade Contractors 7,593 (1,671) 1.08 $51,026
Manufacturing 27,442 (6,925) 1.99 $77,798
Food Manufacturing 2,727 (152) 1.57 $46,753
Beverage and Tobacco Product Manufacturing 227 (87) 1.00 $68,435
Textile Mills 51 (108) 0.40 $52,659
Textile Product Mills 418 (195) 3.08 $37,303
Apparel Manufacturing 20 (184) 0.10 $24,674
Wood Product Manufacturing 273 (85) 0.63 $43,200
Paper Manufacturing 494 (250) 1.12 $71,458
Printing and Related Support Activities 353 (84) 0.57 $41,438
Petroleum and Coal Products Manufacturing 584 54 4.41 $123,559
Chemical Manufacturing 3,853 (970) 4.10 $107,620
Plastics and Rubber Products Manufacturing 3,840 (587) 5.25 $61,631
Nonmetallic Mineral Product Manufacturing 690 (255) 1.55 $67,273
Primary Metal Manufacturing 3,046 (1,201) 7.25 $90,260
Fabricated Metal Product Manufacturing 1,389 (470) 0.90 $51,854
Machinery Manufacturing 817 (256) 0.70 $67,733
Computer and Electronic Product Manufacturing 379 (268) 0.30 $66,043
Electrical Equipment, Appliance, and Component Manufacturing 1,679 (1,103) 4.02 $76,609
Transportation Equipment Manufacturing 5,949 (311) 3.83 $92,585
Furniture and Related Product Manufacturing 307 (80) 0.68 $42,380
Miscellaneous Manufacturing 337 (325) 0.44 $46,597
Wholesale Trade 7,465 (430) 1.04 $58,906
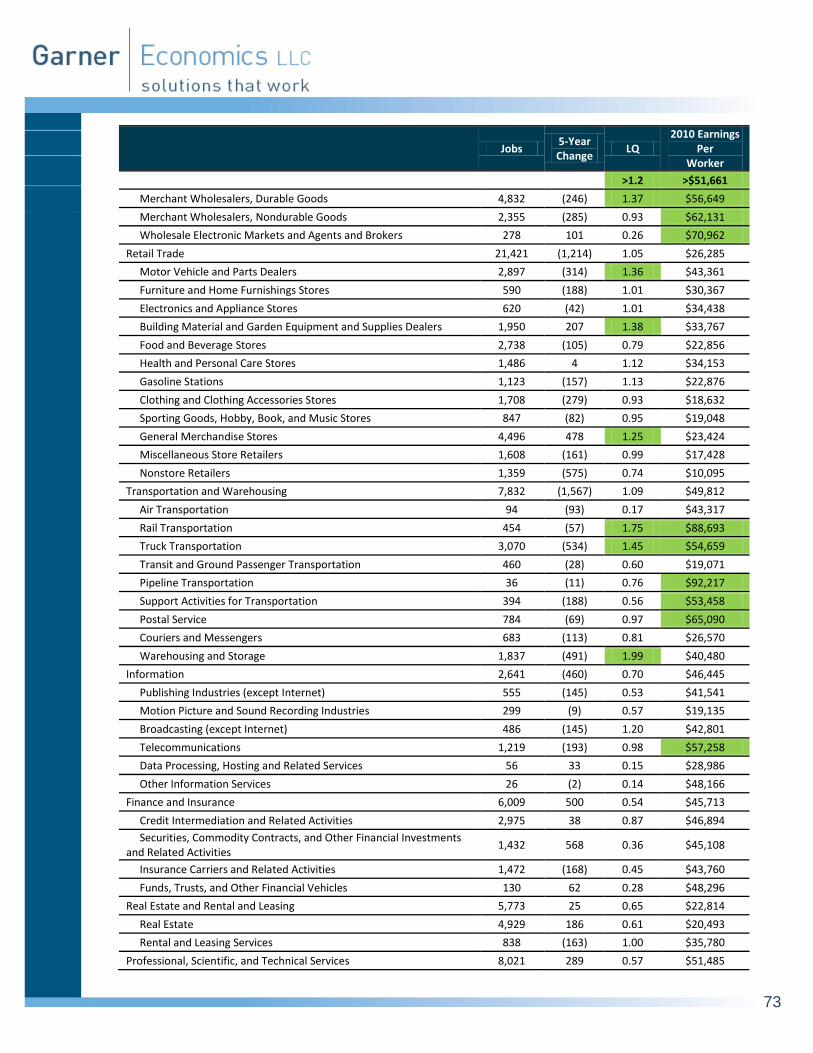
73
Jobs
5-Year Change
LQ 2010 Earnings
Per Worker
>1.2 >$51,661
Merchant Wholesalers, Durable Goods 4,832 (246) 1.37 $56,649
Merchant Wholesalers, Nondurable Goods 2,355 (285) 0.93 $62,131
Wholesale Electronic Markets and Agents and Brokers 278 101 0.26 $70,962
Retail Trade 21,421 (1,214) 1.05 $26,285
Motor Vehicle and Parts Dealers 2,897 (314) 1.36 $43,361
Furniture and Home Furnishings Stores 590 (188) 1.01 $30,367
Electronics and Appliance Stores 620 (42) 1.01 $34,438
Building Material and Garden Equipment and Supplies Dealers 1,950 207 1.38 $33,767
Food and Beverage Stores 2,738 (105) 0.79 $22,856
Health and Personal Care Stores 1,486 4 1.12 $34,153
Gasoline Stations 1,123 (157) 1.13 $22,876
Clothing and Clothing Accessories Stores 1,708 (279) 0.93 $18,632
Sporting Goods, Hobby, Book, and Music Stores 847 (82) 0.95 $19,048
General Merchandise Stores 4,496 478 1.25 $23,424
Miscellaneous Store Retailers 1,608 (161) 0.99 $17,428
Nonstore Retailers 1,359 (575) 0.74 $10,095
Transportation and Warehousing 7,832 (1,567) 1.09 $49,812
Air Transportation 94 (93) 0.17 $43,317
Rail Transportation 454 (57) 1.75 $88,693
Truck Transportation 3,070 (534) 1.45 $54,659
Transit and Ground Passenger Transportation 460 (28) 0.60 $19,071
Pipeline Transportation 36 (11) 0.76 $92,217
Support Activities for Transportation 394 (188) 0.56 $53,458
Postal Service 784 (69) 0.97 $65,090
Couriers and Messengers 683 (113) 0.81 $26,570
Warehousing and Storage 1,837 (491) 1.99 $40,480
Information 2,641 (460) 0.70 $46,445
Publishing Industries (except Internet) 555 (145) 0.53 $41,541
Motion Picture and Sound Recording Industries 299 (9) 0.57 $19,135
Broadcasting (except Internet) 486 (145) 1.20 $42,801
Telecommunications 1,219 (193) 0.98 $57,258
Data Processing, Hosting and Related Services 56 33 0.15 $28,986
Other Information Services 26 (2) 0.14 $48,166
Finance and Insurance 6,009 500 0.54 $45,713
Credit Intermediation and Related Activities 2,975 38 0.87 $46,894
Securities, Commodity Contracts, and Other Financial Investments and Related Activities
1,432 568 0.36 $45,108
Insurance Carriers and Related Activities 1,472 (168) 0.45 $43,760
Funds, Trusts, and Other Financial Vehicles 130 62 0.28 $48,296
Real Estate and Rental and Leasing 5,773 25 0.65 $22,814
Real Estate 4,929 186 0.61 $20,493
Rental and Leasing Services 838 (163) 1.00 $35,780
Professional, Scientific, and Technical Services 8,021 289 0.57 $51,485
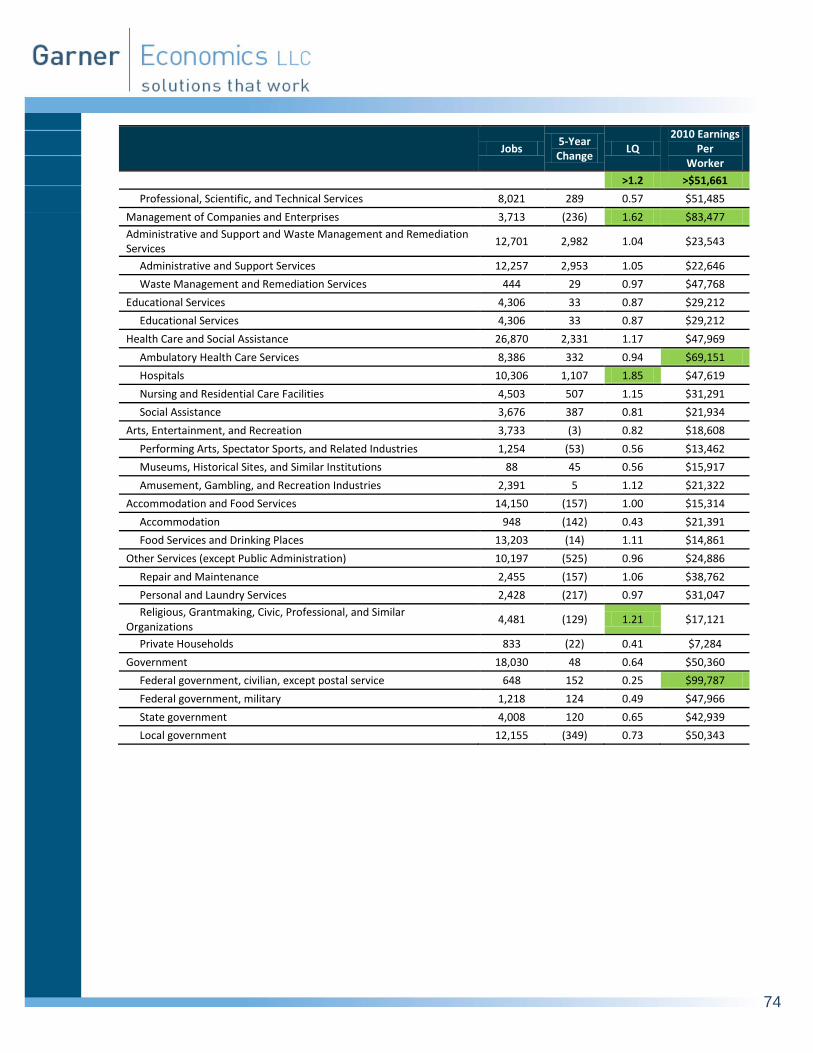
74
Jobs
5-Year Change
LQ 2010 Earnings
Per Worker
>1.2 >$51,661
Professional, Scientific, and Technical Services 8,021 289 0.57 $51,485
Management of Companies and Enterprises 3,713 (236) 1.62 $83,477
Administrative and Support and Waste Management and Remediation Services
12,701 2,982 1.04 $23,543
Administrative and Support Services 12,257 2,953 1.05 $22,646
Waste Management and Remediation Services 444 29 0.97 $47,768
Educational Services 4,306 33 0.87 $29,212
Educational Services 4,306 33 0.87 $29,212
Health Care and Social Assistance 26,870 2,331 1.17 $47,969
Ambulatory Health Care Services 8,386 332 0.94 $69,151
Hospitals 10,306 1,107 1.85 $47,619
Nursing and Residential Care Facilities 4,503 507 1.15 $31,291
Social Assistance 3,676 387 0.81 $21,934
Arts, Entertainment, and Recreation 3,733 (3) 0.82 $18,608
Performing Arts, Spectator Sports, and Related Industries 1,254 (53) 0.56 $13,462
Museums, Historical Sites, and Similar Institutions 88 45 0.56 $15,917
Amusement, Gambling, and Recreation Industries 2,391 5 1.12 $21,322
Accommodation and Food Services 14,150 (157) 1.00 $15,314
Accommodation 948 (142) 0.43 $21,391
Food Services and Drinking Places 13,203 (14) 1.11 $14,861
Other Services (except Public Administration) 10,197 (525) 0.96 $24,886
Repair and Maintenance 2,455 (157) 1.06 $38,762
Personal and Laundry Services 2,428 (217) 0.97 $31,047
Religious, Grantmaking, Civic, Professional, and Similar Organizations
4,481 (129) 1.21 $17,121
Private Households 833 (22) 0.41 $7,284
Government 18,030 48 0.64 $50,360
Federal government, civilian, except postal service 648 152 0.25 $99,787
Federal government, military 1,218 124 0.49 $47,966
State government 4,008 120 0.65 $42,939
Local government 12,155 (349) 0.73 $50,343

75
Evansville Occupations explain key
Highly specialized occupations (LQ greater than 1.20), and median hourly earnings (above $18.06, the
national median average) are highlighted in green.
2011 Jobs
5-Year Change
LQ Median Hourly Wage
>1.2 >$18.06
Management 13,957 719 0.88 $24.54
Top executives 2,196 6 0.77 $39.24
Advertising, marketing, promotions, public relations, & sales managers 773 18 0.92 $32.89
Operations specialties managers 1,862 (93) 0.89 $37.56
Other management 9,126 788 0.90 $17.62
Business & financial operations 6,706 548 0.61 $20.67
Business operations specialists 3,526 167 0.65 $22.41
Financial specialists 3,180 381 0.57 $18.74
Computer & mathematical science 2,319 87 0.51 $25.68
Computer specialists 2,261 84 0.52 $25.66
Mathematical science 58 3 0.42 $26.34
Architecture & engineering 2,930 (133) 0.96 $28.89
Architects, surveyors, & cartographers 205 7 0.66 $20.58
Engineers 1,753 (70) 0.95 $33.39
Drafters, engineering, & mapping technicians 973 (70) 1.09 $22.50
Life, physical, & social science 2,019 119 0.94 $29.24
Life scientists 343 42 0.99 $35.38
Physical scientists 584 4 1.68 $35.97
Social scientists & related 460 35 0.46 $23.31
Life, physical, & social science technicians 632 39 1.41 $23.97
Community & social services 2,766 240 0.92 $14.08
Counselors, social workers, & other community & social service specialists
1,998 225 0.81 $16.04
Religious workers 768 15 1.41 $9.15
Legal 1,031 54 0.61 $23.29
Lawyers, judges, & related workers 498 (22) 0.46 $30.53
Legal support workers 533 76 0.87 $16.42
Education, training, & library 9,204 119 0.79 $24.65
Postsecondary teachers 1,496 54 0.85 $38.20
Primary, secondary, & special education teachers 4,935 79 0.87 $27.44
Other teachers & instructors 1,287 (20) 0.69 $11.40
Librarians, curators, & archivists 339 (2) 0.98 $16.51
Other education, training, & library 1,147 8 0.58 $12.30
Arts, design, entertainment, sports, & media 3,919 (109) 0.64 $12.64
Art & design 964 (12) 0.61 $12.54
Entertainers & performers, sports & related 1,083 5 0.69 $10.68
Media & communication 1,107 (47) 0.69 $14.47
Media & communication equipment 765 (55) 0.57 $12.89
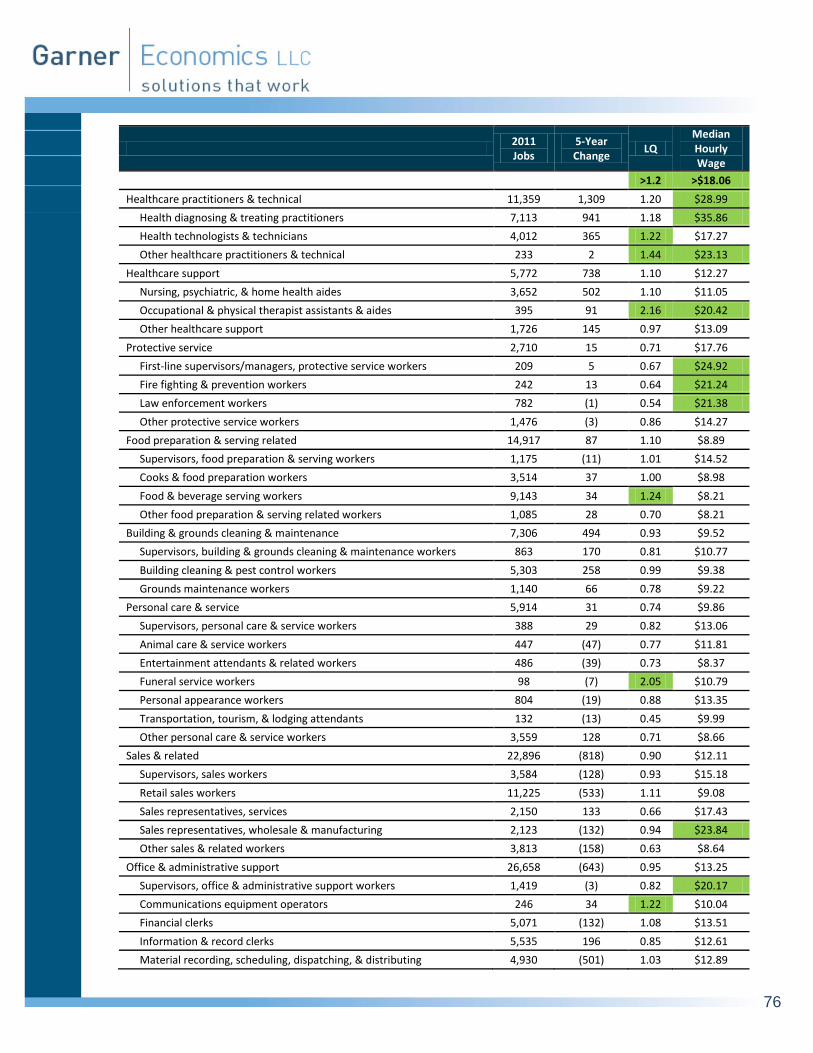
76
2011 Jobs
5-Year Change
LQ Median Hourly Wage
>1.2 >$18.06
Healthcare practitioners & technical 11,359 1,309 1.20 $28.99
Health diagnosing & treating practitioners 7,113 941 1.18 $35.86
Health technologists & technicians 4,012 365 1.22 $17.27
Other healthcare practitioners & technical 233 2 1.44 $23.13
Healthcare support 5,772 738 1.10 $12.27
Nursing, psychiatric, & home health aides 3,652 502 1.10 $11.05
Occupational & physical therapist assistants & aides 395 91 2.16 $20.42
Other healthcare support 1,726 145 0.97 $13.09
Protective service 2,710 15 0.71 $17.76
First-line supervisors/managers, protective service workers 209 5 0.67 $24.92
Fire fighting & prevention workers 242 13 0.64 $21.24
Law enforcement workers 782 (1) 0.54 $21.38
Other protective service workers 1,476 (3) 0.86 $14.27
Food preparation & serving related 14,917 87 1.10 $8.89
Supervisors, food preparation & serving workers 1,175 (11) 1.01 $14.52
Cooks & food preparation workers 3,514 37 1.00 $8.98
Food & beverage serving workers 9,143 34 1.24 $8.21
Other food preparation & serving related workers 1,085 28 0.70 $8.21
Building & grounds cleaning & maintenance 7,306 494 0.93 $9.52
Supervisors, building & grounds cleaning & maintenance workers 863 170 0.81 $10.77
Building cleaning & pest control workers 5,303 258 0.99 $9.38
Grounds maintenance workers 1,140 66 0.78 $9.22
Personal care & service 5,914 31 0.74 $9.86
Supervisors, personal care & service workers 388 29 0.82 $13.06
Animal care & service workers 447 (47) 0.77 $11.81
Entertainment attendants & related workers 486 (39) 0.73 $8.37
Funeral service workers 98 (7) 2.05 $10.79
Personal appearance workers 804 (19) 0.88 $13.35
Transportation, tourism, & lodging attendants 132 (13) 0.45 $9.99
Other personal care & service workers 3,559 128 0.71 $8.66
Sales & related 22,896 (818) 0.90 $12.11
Supervisors, sales workers 3,584 (128) 0.93 $15.18
Retail sales workers 11,225 (533) 1.11 $9.08
Sales representatives, services 2,150 133 0.66 $17.43
Sales representatives, wholesale & manufacturing 2,123 (132) 0.94 $23.84
Other sales & related workers 3,813 (158) 0.63 $8.64
Office & administrative support 26,658 (643) 0.95 $13.25
Supervisors, office & administrative support workers 1,419 (3) 0.82 $20.17
Communications equipment operators 246 34 1.22 $10.04
Financial clerks 5,071 (132) 1.08 $13.51
Information & record clerks 5,535 196 0.85 $12.61
Material recording, scheduling, dispatching, & distributing 4,930 (501) 1.03 $12.89

77
2011 Jobs
5-Year Change
LQ Median Hourly Wage
>1.2 >$18.06
Secretaries & administrative assistants 4,618 (91) 0.93 $14.27
Other office & administrative support workers 4,839 (147) 0.94 $11.23
Farming, fishing, & forestry 506 (101) 0.39 $12.33
Supervisors, farming, fishing, & forestry workers 34 (4) 0.44 $16.21
Agricultural workers 396 (90) 0.39 $12.21
Fishing & hunting workers 35 0 0.34 $8.46
Forest, conservation, & logging workers 41 (7) 0.37 $13.52
Construction & extraction 12,102 (944) 1.29 $21.25
Supervisors, construction & extraction workers 1,275 101 1.36 $26.43
Construction trades & related workers 8,949 (1,141) 1.26 $21.22
Helpers, construction trades 390 (73) 1.05 $13.63
Other construction & related workers 567 (20) 1.06 $16.89
Extraction workers 921 188 2.30 $20.37
Installation, maintenance, & repair 10,432 (633) 1.49 $19.32
Supervisors of installation, maintenance, & repair workers 875 (76) 1.74 $28.10
Electrical & electronic equipment mechanics, installers, & repairers 1,047 (42) 1.32 $22.31
Vehicle & mobile equipment mechanics, installers, & repairers 2,588 (246) 1.29 $17.34
Other installation, maintenance, & repair 5,921 (269) 1.61 $18.35
Production 22,303 (4,696) 2.06 $16.33
Supervisors, production workers 1,816 (428) 2.53 $26.36
Assemblers & fabricators 7,095 (1,264) 3.57 $15.71
Food processing 864 (150) 1.06 $11.91
Metal workers & plastic workers 4,971 (1,489) 2.27 $17.35
Printing 362 (99) 0.97 $18.75
Textile, apparel, & furnishings 799 (270) 0.80 $10.23
Woodworkers 219 (47) 0.63 $12.65
Plant & system operators 1,093 (25) 2.76 $24.60
Other production 5,084 (925) 1.69 $12.52
Transportation & material moving 14,162 (1,811) 1.22 $13.75
Supervisors, transportation & material moving workers 576 (105) 1.29 $21.35
Air transportation 59 (6) 0.32 $37.81
Motor vehicle operators 6,154 (524) 1.15 $14.19
Rail transportation 249 (24) 1.71 $18.60
Water transportation 82 7 0.79 $18.18
Other transportation workers 256 (36) 0.76 $10.08
Material moving 6,787 (1,123) 1.34 $12.41
Military 1,218 123 0.49 $10.09
Military 1,218 123 0.49 $10.09
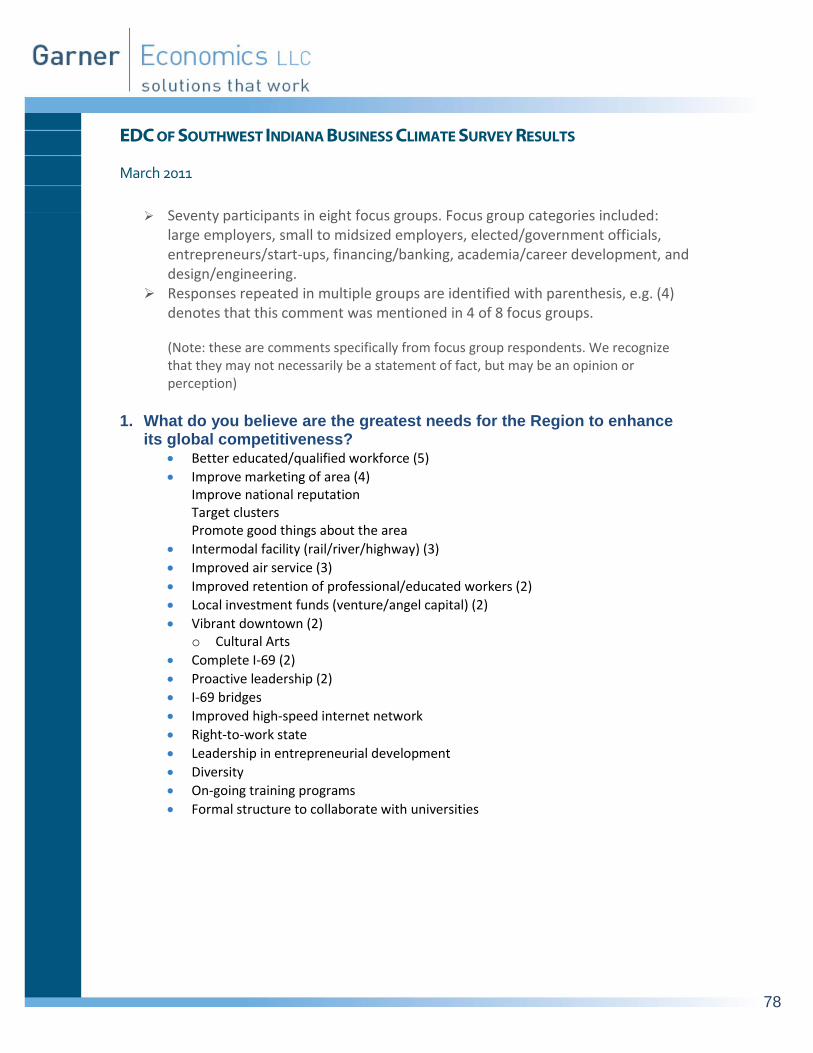
78
EDC OF SOUTHWEST INDIANA BUSINESS CLIMATE SURVEY RESULTS
March 2011
Seventy participants in eight focus groups. Focus group categories included:
large employers, small to midsized employers, elected/government officials, entrepreneurs/start-ups, financing/banking, academia/career development, and design/engineering.
Responses repeated in multiple groups are identified with parenthesis, e.g. (4) denotes that this comment was mentioned in 4 of 8 focus groups.
(Note: these are comments specifically from focus group respondents. We recognize that they may not necessarily be a statement of fact, but may be an opinion or perception)
1. What do you believe are the greatest needs for the Region to enhance
its global competitiveness? Better educated/qualified workforce (5)
Improve marketing of area (4) Improve national reputation Target clusters Promote good things about the area
Intermodal facility (rail/river/highway) (3)
Improved air service (3)
Improved retention of professional/educated workers (2)
Local investment funds (venture/angel capital) (2)
Vibrant downtown (2) o Cultural Arts
Complete I-69 (2)
Proactive leadership (2)
I-69 bridges
Improved high-speed internet network
Right-to-work state
Leadership in entrepreneurial development
Diversity
On-going training programs
Formal structure to collaborate with universities

79
2. On a scale of 1 to 5 with five being best, how would you rate the business climate of the Region?
Forty-four percent of participants asked to rank the business climate responded with a rank of 3. Three participants ranked 1, and two ranked 5. The average rank was 3.2.
Ranking of the Business Climate, 5 is Best
Reasons for Scores
Permitting is hard (3)
Local government lacks leadership skills
Local government is not visionary
Local government is easy to work with
City & county governments should consolidate
Vanderburgh County good to work with
Warrick County hard to work with
Warrick County Sewer District limits new business development
Warrick County tax abatement is year-year, not long-term
Warrick County is trying, tax allocation to ED
High utility rates
Local politics too partisan
Lack of coordination between state & local government for new construction
Regional ED collaboration is improvement
Oakland City lacks pride
Oakland City poor water & sewer service, high costs
Too business friendly
3
7
1
31
5
21
2
1 2 2.5 3 3.5 4 5
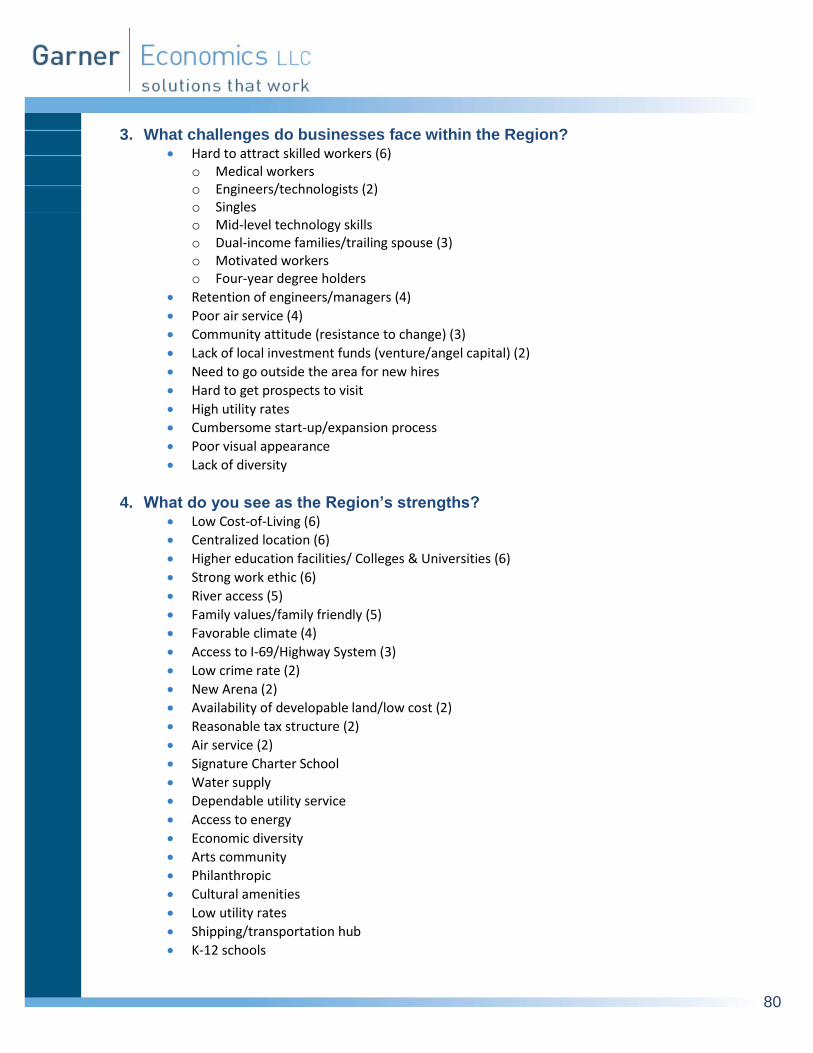
80
3. What challenges do businesses face within the Region? Hard to attract skilled workers (6)
o Medical workers o Engineers/technologists (2) o Singles o Mid-level technology skills o Dual-income families/trailing spouse (3) o Motivated workers o Four-year degree holders
Retention of engineers/managers (4)
Poor air service (4)
Community attitude (resistance to change) (3)
Lack of local investment funds (venture/angel capital) (2)
Need to go outside the area for new hires
Hard to get prospects to visit
High utility rates
Cumbersome start-up/expansion process
Poor visual appearance
Lack of diversity
4. What do you see as the Region’s strengths?
Low Cost-of-Living (6)
Centralized location (6)
Higher education facilities/ Colleges & Universities (6)
Strong work ethic (6)
River access (5)
Family values/family friendly (5)
Favorable climate (4)
Access to I-69/Highway System (3)
Low crime rate (2)
New Arena (2)
Availability of developable land/low cost (2)
Reasonable tax structure (2)
Air service (2)
Signature Charter School
Water supply
Dependable utility service
Access to energy
Economic diversity
Arts community
Philanthropic
Cultural amenities
Low utility rates
Shipping/transportation hub
K-12 schools

81
5. How do you see the current labor situation in the area (both quality and employee attraction and availability)?
Availability of entry level/blue collar of workers is good (3)
Bad image of union presence/legacy (3)
Generational gap (attitude/education) (2)
Hard to attract: o Engineering skills (2) o Younger people for factory work o Applied skills o Machinist
High drug-test failure rate
Family and Medical Leave Act (FMLA) makes it hard to get workers
No state assistance
Good supply of technical skills from local colleges/universities
Loyalty of workers is high
Some basic screening assistance from state
Retention not a problem
Poor health/wellness of workers
6. What infrastructure is missing or unsatisfactory in the area? Green space/walking paths/bike paths (6)
High speed fiber/broadband (5) Rural internet access (2) Free wireless downtown
Air service/price & flights (4) Lack of jet-ways (2)
East-west corridor without multiple stops (2)
Completion of I-69 (2)
Sewer to outlying areas (2)
Public transportation (2)
Trails system
Intermodal facility
Truck availability
State parks
Recreational development/access to river
Long range water capacity
Improved K-12 education
Greenfield sites
Entertainment/sporting events
Air quality constraint
7. Without regard to money or politics, what would you work to change about the area?
Develop vibrant downtown (4)
Activate community planning (4)
Reduce air pollution (2)

82
Develop marketing image (be known for something) (2)
Develop shovel-ready sites, Mega sites (2)
Consolidate local government (2)
High speed rail (2)
Attract high-quality/good paying jobs
Improve housing stock
Leverage energy assets (coal, nuclear, oil)
Improve air service o Attract Southwest Airlines
Highway to Indianapolis
Residential broadband
Leverage military history
Develop local investment funds (venture/angel capital)
Attract R & D firms
Mandatory associates degree
Develop bike/trail system
8. What types of companies do you think would be a good fit for the area?
Plastics mfg (7)
Logistics/Distribution (4)
Research & Development (3)
Life sciences/ Bio-medical/Medical (3)
Advanced mfg (3)
Coal users/research (3)
Automotive supplier mfg (2)
Defense/Crane collaboration (2)
Energy related
Family oriented
Chemical mfg
Corporate headquarters
Agricultural distribution
Firms that demand inland waterways
Assisted living
Bio-fuels
9. Are there any suppliers/businesses/operations that would complement yours?
Coal mining machinery mfg.
Medical device mfg.
Plastics OEM for Toyota
83
10. What are your past experiences with and current perceptions of various economic development efforts by the Chamber of Commerce, the EDC, the County Commission, the City and any other group(s)? How could these efforts or groups be improved?
Regional collaboration is a positive/good outcomes (4)
No clear roles, fragmented (3)
GAGE is broken, needs identity (2)
EDC is a positive (2) o EDC is stable o Appreciate EDC as a resource/grant writer o EDC is professional
Lack of resources/appreciation of existing businesses (2)
Need to connect outcomes to show success
More reactive than proactive
Incentives not competitive
No incentives to retain workers/businesses
Cross-state incentive support is good
Need to educate local government
Chamber does a good job.
GAGE had issues, but is ok now
No leader for tourism bureau
Too focused on big buffalo, not small firms
Don’t leverage University/College assets
No unified vision
Never been contacted
11. Are there any other issues of concern to you?
We don’t market our assets (river)
Poor community aesthetics (trash, streetscape)
Need to focus efforts
Be candid about shortcomings
Need downtown hotel development for arena
12. Without regard to money or politics, what would you work to change
about the area? Improve K-12 education (2)
Increase CRP funding (2)
Develop spec buildings
Raise High-School degree to level of an AA degree
Improve cross state-line infrastructure development
Reduce crime
Develop growth policies

84
13. Are there any other issues of concern to you?
Focus more on entrepreneurial creation than attraction
Attract baby-boomers
Focus more on existing industry
Reduce delayed flights
Promote local attractions