a comparison of two plate waste evaluation methods in public ...
58
A COMPARISON OF TWO PLATE WASTE EVALUATION METHODS IN PUBLIC SCHOOLS by KATHERINE NOTZON ANDERSON, B.S. A THESIS IN RESTAURANT, HOTEL, AND INSTITUTIONAL MANAGEMENT Submitted to the Graduate Faculty of Texas Tech University in Partial Fulfillment of the Requirements for the Degree of MASTER OF SCIENCE Approved Accepted August, 1994
Transcript of a comparison of two plate waste evaluation methods in public ...
A COMPARISON OF TWO PLATE WASTE EVALUATION
METHODS IN PUBLIC SCHOOLS
by
KATHERINE NOTZON ANDERSON, B.S.
A THESIS
IN
RESTAURANT, HOTEL, AND INSTITUTIONAL MANAGEMENT
Submitted to the Graduate Faculty of Texas Tech University in
Partial Fulfillment of the Requirements for
the Degree of
MASTER OF SCIENCE
Approved
Accepted
August, 1994

~0 .s ~3 11'1~4 tJ (). i ~r'
ACKNOWLEDGEMENTS
I would like to thank the members of my thesis
committee, Dr. Hoover, Dr. Huffman, and Dr. Martin. They
all aided in my achievement of this goal, which at times,
felt quite elusive. A most special thanks must go to my
committee chairperson, Dr. Hoover. She spent a considerable
amount of time and effort helping me to get this thesis into
a publishable form.
For the love, support, prayers, and encouragement, I
would like to thank my entire family but especially my
parents, Frederic and Estela Notzon. Their support always
kept me going. A most special thanks must also go to my
beloved late husband, Conde Nevin Anderson, III.
Remembering both his encouragement and continuous belief 1n
me made this dream a reality.

TABLE OF CONTENTS
ACKNOWLEDGEMENTS. . . . . . . . . . . . . . . . . . . . . . . . . . . . . . . . . . . . . . . 11
L I S T 0 F TAB L E S . . . . . . . . . . . . . . . . . . . . . . . . . . . . . . . . . . . . . . . . . v
CHAPTER
I. INTRODUCTION. . . . . . . . . . . . . . . . . . . . . . . . . . . . . . . . . . 1
Statement of the Problem...................... 2
Purpose of the Study.......................... 3
Hypotheses. . . . . . . . . . . . . . . . . . . . . . . . . . . . . . . . . . . . 3
Definitions................................... 3
Research Assumptions.......................... 4
Research Limitations.......................... 5
II. REVIEW OF LITERATURE.......................... 6
History of School Food Service and Governmental Support. . . . . . . . . . . . . . . . . . . . . . . . . . . . . . . . . . . . . . . 6
Dietary Guidelines. . . . . . . . . . . . . . . . . . . . . . . . . . . . 8
Nutrition Education and Training.............. 10
Plate Waste................................... 11
Plate Waste Methods........................... 12
Time Studies.................................. 15
Summary. . . . . . . . . . . . . . . . . . . . . . . . . . . . . . . . . . . . . . . 16
I I I . METHODOLOGY. . . . . . . . . . . . . . . . . . . . . . . . . . . . . . . . . . . 17
Site.......................................... 17
Sub j e c t s • . • • . . • . • . . . . . • • . . . . . . . . . . . . . . • . . . . . . • 18
Pilot Study................................... 18
Data Collection............................... 19
Variables..................................... 21
111

D at a An a 1 y s i s . . . . . . . . . . . . . . . . . . . . . . . . . . . . . . . . . 21
IV. RESULTS AND DISCUSSION........................ 23
Participant Demographics...................... 23
Correlation of Plate Waste Methods............ 25
Time Required to Assess Plate Waste........... 30
An a 1 y s i s o f R e s u 1 t s . . . . . . . . . . . . . . . . . . . . . . . . . . . 3 2
V. SUMMARY AND CONCLUSIONS....................... 36
Major Findings of the Study................... 37
Impact of the Study........................... 38
Recommendations for Further Research.......... 39
Conclusion.s ................................... 39
REFERENCES. . . . . . . . . . . . . . . . . . . . . . . . . . . . . . . . . . . . . . . . . . . . . 41
APPENDICES
A. PLATE WASTE RECORD. . . . . . . . . . . . . . . . . . . . . . . . . . . . 44
B. BACKGROUND OF RESEARCHERS..................... 46
C. STANDARD WEIGHT RECORD........................ 47
D. VISUAL ASSESSMENT PLATE WASTE PROCEDURES ....... 48
E. SCRAPE/WEIGH PLATE WASTE PROCEDURES ............ 50
F. PLATE WASTE TIME SHEET. . . . . . . . . . . . . . . . . . . . . . . . . 52
lV
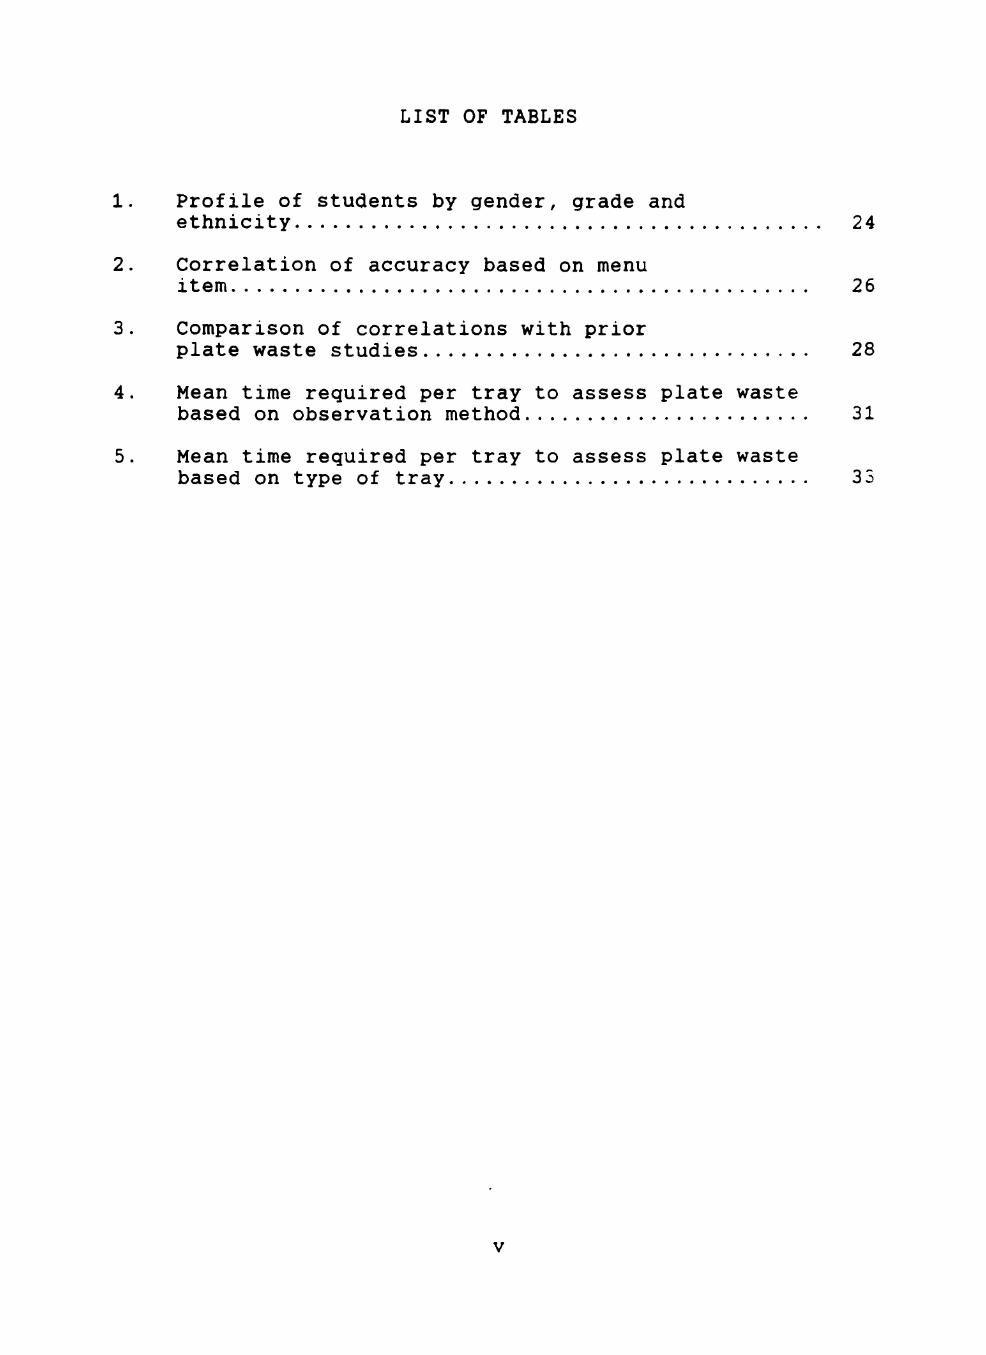
LIST OF TABLES
1. Profile of students by gender, grade and ethnic i t y . . . . . . . . . . . . . . . . . . . . . . . . . . . . . . . . . . . . . . . . . . 2 4
2. Correlation of accuracy based on menu item.............................................. 26
3 . Comparison of correlations with prior plate waste studies .............................. . 28
4. Mean time required per tray to assess plate waste based on observation method ...................... . 31
5 . Mean time required per tray to assess plate waste based on type of tray ............................ . 33
v
CHAPTER I
INTRODUCTION
School food service personnel have the responsibility
of adequately feeding the nation's school-aged children
according to guidelines set forth by the United States
Department of Agriculture (USDA). School lunches served, as
specified by the National School Lunch Program (NSLP), must
account for one-third of the children's required daily
intake (Public Law 79-396). Although the majority of the
school meals offered should be consumed by the children,
plate waste is a serious problem that plagues the school
food service industry.
The National School Lunch Act of 1946 (Public Law 79-
396) and the Child Nutrition Act of 1966 (Public Law 89-642)
authorized the federal financing of food assistance to
approximately 28 million children through nine various
programs which are all classified as child nutrition
programs ("Chapter IV: Child Nutrition Programs," 1989).
The USDA subsidizes school food service operations only for
meals which follow the meal patterns and serving sizes
specified by the Child Nutrition Program. Although simply
offering the appropriate meal patterns in the mandated
amounts keeps the school food service operations in
compliance and in business, the reason for the existence of
the food service programs must not be overlooked. The focus
1

of a school food serv1ce operation should be to offer
nutritious and appealing food which contributes to the
health and well-being of children. This goal cannot be
accomplished if food is not consumed by the children,
resulting in large amounts of waste.
Statement of the Problem
Plate waste is measured for various reasons. Food
service personnel measure plate waste to determine the
popularity of given menu items, especially when trying out
new products or when serving traditional menu items that
have been prepared with revised recipes. Educators look at
plate waste when determining the effectiveness of nutrition
education curriculum. Effective curriculum not only
1ncreases nutrition knowledge, but also, can cause a
positive change in eating behavior. This change would be
noted by the decreased amount of food the children discard
on their trays (Graves & Shannon, 1983). Parents and
taxpayers, although not actively involved in studying plate
waste, need to be aware of the problem. It costs both
groups 1n the monetary sense, and for parents, the loss of
nutrition for their children. Keeping in mind resources
such as time, money, and effort, identifying accurate and
efficient methods for determining plate waste is necessary
both from a research, and an economic point of view.
2

Purpose of the Study
The purpose of the study was to compare the visual
assessment method and the scrape/weigh method for
determining plate waste. Specific objectives of the study
were to:
1. Measure plate waste utilizing the visual method
and the scrape/weigh method.
2. Compare the accuracy of the visual assessment
method with the scrape/weigh method.
3. Compare the time required for data collection for
each method.
Hypotheses
This study incorporated the following null hypotheses:
1. The correlation for accuracy is low between the
visual assessment and the scrape/weigh method when
determining plate waste.
2. There is no significant difference 1n the time
required for data collection for the two methods.
Definitions
A contract management company 1s a company which runs
the food service operation of a third party by providing a
management team, policies and procedures, and other
operational provisions in exchange for a management fee.
3
Plate waste constitutes any food which is left uneaten

4
on a tray with the intention that it be thrown away (Spears,
1990).
The scrape/weigh method involves scrap1ng the edible
portions of food left on a tray, onto a pre-weighed
container, placing this container onto a scale and recording
the weight (Spears, 1990).
Type A school lunch refers to the lunch served in a
school cafeteria which meets the USDA criteria for meal
pattern and serving sizes. It is also referred to as a
reimbursable lunch (Pannell, 1990).
The visual assessment method is used in determining
plate waste by visually estimating food left on a tray and
recording observations by means of predetermined coding
(Spears, 1990).
Research Assumptions
The first assumption in this study was that the
individuals who observed and recorded plate waste possessed
the skills necessary to collect accurate data. With the
scrape/weigh method, a digital scale was used to determine
an objective measure of plate waste. Therefore, the next
assumption was that the scrape/weigh method yielded an
accurate measure.
Method bias was controlled by: (1) the order of data
collection (visual assessment was performed before the
scrape/weigh method so that the researchers were not either
5
consciously nor unconsciously trying to match the known
plate waste); (2) the design of the data collection forms
(results for each method were recorded on separate pages, to
avoid the opportunity to match data); and (3) limiting the
communication during assessments strictly to verbalizing
plate waste measurements and indicating when to start and
stop timing (to avoid possible cuing).
Research Limitations
The most substantial limitation in this study is that
of human error. Although all effort was made to ensure
accuracy of results, findings may not be 100% accurate.
Another possible limitation of this research is that the
findings cannot be generalized to other sites and types of
food service operations.
CHAPTER II
REVIEW OF LITERATURE
History of School Food Service and Governmental Support
The practice of serving food at school had its
beginnings as early as 1853 and was accomplished primarily
through volunteer groups. It was not long before schools
across the country took on the responsibility of serving
lunches. However, school lunch (program) expansion was not
seen until the Great Depression of the 1930s. It was at
this time that modest efforts by the federal government to
assist school lunch programs were initiated (Pannell, 1990).
Federal support of the school lunch program was
provided initially by relief programs. Relief included
employment within the school lunch program, and also, the
donation of surplus commodities. From the perspective of
the federal government, the school lunch program served two
basic purposes: to offer employment (at a time when this
country had under 25% of its workforce unemployed), and to
help farmers unload their price depressing agricultural
surpluses ("Chapter IV: Child Nutrition Programs," 1989).
As the growing awareness of the relationship between
nutrition, good health, and learning was becoming more
apparent, Congress approved the National School Lunch Act on
June 4th, 1946 (Public Law 79-396). Its intent was to
provide a basic level of support for all school children
6

both nutritionally and financially ("Chapter IV: Child
Nutrition Programs," 1989).
7
As early as the 1960s, legislators and other
policymakers began to focus on America's hunger and poverty.
This interest led to the passing of the Child Nutrition Act
of 1966 (Public Law 89-642). The Act provided for the first
substantial funding for needy children's meals, developed
guidelines for identification of the needy, and provided the
basis to pilot a breakfast program (Pannell, 1990).
Pressures mounted based on the growing number of
schools operating lunch programs, increased concern about
balanced diets, good nutrition, and the changing economy.
Due to these pressures, the USDA came to the realization
that commodities alone did not provide adequate support for
school lunch programs. Therefore, increased financial aid
would be necessary. After 1970, federal cash assistance
finally exceeded commodity aid to child nutrition programs.
Through the years, cash aid for child nutrition programs has
increased. For fiscal year ending in 1993, preliminary data
indicated cash assistance for the National School Lunch
Program (NSLP) topped $4 billion for the first time
(Hiemstra, 1994). School Breakfast, although a considerably
smaller program, received $868 million in 1993, an 1ncrease
of 10% (Hiemstra, 1994). The financial assistance for both
the breakfast and lunch child nutrition programs represents

participation of 29,400,000 children (United States
Department of Commerce, 1993).
Dietary Guidelines
8
To g1ve additional support to the NSLP, the USDA worked
1n conjuction with the United States Department of Health
and Human Services (DHHS) to issue the Dietary Guidelines
for Americans (USDA & DHHS, 1990). This pamphlet has been
used as a nutrition education tool for the public and
school-aged children (DeMicco, 1990). The USDA highly
recommended that school districts use the Dietary Guidelines
for Americans (DGA) in planning the breakfast and lunch
menus.
In order to assist in meeting DGA objectives, the USDA
developed new recipes, as well as modified pre-existing
government issued recipes, for use in school kitchens across
the nation. The recipes were lower in salt, fat, and sugar
(Glover, Stitt, Kendrick, & Hayes, 1991). However, s1nce
plate waste and participation have been problems in the
past, some food service managers and directors were
concerned about using the new rec1pes. They questioned
whether the new recipes would result in students being even
less likely to eat foods with reduced fats, salt, and sugar.
Many food service managers and directors were fearful that
plate waste would increase while participation would
decrease. Investigators have, however, reported that

9
reduced fat and sodium foods are acceptable to school-aged
children (Coale & Bedford, 1984; Sandoval, Lockner, &
Adkins, 1986). However, preference for higher fat foods was
evident.
To implement the DGA, it is important to first identify
possible barriers and to address them. Barriers likely to
be faced by school food personnel are: lack of awareness or
knowledge regarding the DGA; apathy toward using DGA; and
non-support by school administrators, teachers, and parents.
Additional barriers are: fear of risks associated with
trying new menu items such as student rejection of foods or
financial risk; lack of culinary, nutrition, or food science
skills in developing, modifying, or preparing appropriate
recipes; and contraints imposed by the operation such as
kitchen equipment (DeMicco, 1990).
To eliminate the barriers for implementing DGA, Glover
et al. (1991) indicated that cafeteria managers needed
assistance. This assistance should come in the form of
increasing the availability of ingredients and food items
that make it possible for them to plan and prepare meals
that follow DGA.
DeMicco (1990) offered many strategies to help
implement DGA. Strategies included: (1) gaining support
from administrators, school food service staff, teachers,
and parents; (2) developing educational programs for
elementary school teachers in order for them to teach

10
students about the DGAs; (3) developing training programs
for food service personnel on the DGA; and (4) continuing to
work on developing and modifying recipes to reflect DGA.
Nutrition Education and Training
As the links between eating and learning, health and
well-being are being recognized, nutrition education has
gained importance in the schools. The intent of legislation
in establishing nutrition education programs such as
Nutrition, Education, and Training (NET), is to "teach
children through a positive daily lunchroom experience and
appropriate classroom reinforcement, the value of a
nutritionally balanced diet" (Maretzkik, 1979, p. 176).
Until recently, most nutrition education programs have
emphasized learning to choose from the four basic food
groups and, presumably, this knowledge would assure adequate
nutrient intake. Although such programs do increase
nutrition knowledge when students are subsequently tested, a
corresponding improvement in student food behavior is often
lacking (Green & Munroe, 1987; Contento, Manning, & Shannon,
1992).
Many nutrition education programs are currently
available and utilized. Most of these programs share some
basic characteristics. They are designed primarily to: (1)
encourage positive eating habits through alternative menus;
(2) promote nutrition education in the classroom; and (3)
11
train teachers and food service personnel to carry out these
goals {Contento, Manning, & Shannon, 1992; Sandoval,
Lockner, & Adkins, 1986). Regardless of the curriculum
implemented, a means of program assessment is necessary.
One of the most valid assessments of any nutrition
education program 1s through monitoring student plate
waste/consumption data. Therefore, plate waste evaluations
should be an integral part of any nutrition education
program {Green & Munroe, 1987).
Plate Waste
In any non-commercial food service program, one would
expect to observe some degree of plate waste (Lilly, Davis,
Wilkening, & Shank 1980). Many factors contribute to this
problem in the school setting: scheduling recess either
before or immediately after the lunch period (Read &
Moosburne, 1985; Schwab, 1989); serving too large a portion
of food; differences in food preferences {Lachance, 1976;
Jansen & Harper, 1978); lack of nutrition educat1on (Kirks &
Wolff, 1985; Graves & Shannon, 1983); and lack of food
quality due to poor preparation techniques (Devan, Gregoire,
& Spears, 1988).
The need to curb plate waste is vitally important for
two basic reasons, the first being cost. In 1987, it was
estimated that $600 m1llion was spent in the US on plate
waste (Green & Munroe, 1987). Secondly, and even more
12
critical than the monetary issue is the loss of nutrients to
the school children. Although most Type A school lunches
achieve the standard for many nutrients, some noon meals
will fall below the desired level of nutrients when all of
the food served is not eaten (Lilly et al., 1980).
Recent research has indicated that most adult heart
disease begins in childhood. Therefore, not only how much
children eat, but what children eat will have an impact on
their health as adults ("Project 2001," 1991).
Plate Waste Methods
Three generally accepted methods for determining plate
waste are: self-report, scrape/weigh, and visual
assessment. Of the three methods, self-reporting 1s the
least utilized. Although the self-report method has been
shown to produce similar results when compared to
scrape/weigh and visual assessment methods, scrape/weigh and
visual assessment are most highly correlated (Comstock, St.
Pierre, & Mackiernan, 1981; Holdt, Sitter, & Gates, 1993).
Comstock, St. Pierre, and Mackiernan (1981) documented
correlations of .93 when compar1ng scrape/weigh and visual
assessment, and .74 when compar1ng scrape/weigh and self
report. A study by Holdt, Sitter, and Gates (1993) which
also compared the scrape/weigh to visual assessment and the
scrape/weigh to self-report produced correlation
coefficients of .92 and .78, respectively. In addit1on to
the differences in correlations, an added concern is the
potential for errors in self-reported dietary intake data
(Dubois, 1990).
13
Scraping and weighing edible portions of plate waste is
the most traditional method and thought to be most accurate
(Comstock, St. Pierre, & Mackiernan, 1981). This method
does have inherent weaknesses. It 1s messy, time-consuming,
and requires adequate staffing and space (Comstock, St.
Pierre, & Mackiernan, 1981). The visual assessment method
has positive aspects for food service personnel who may
continue plate waste observations in the future. Advantages
of visually assessing plate waste includes the modest time
required, simple equipment (paper and pencil) needed, and
the amount of data that can be obtained in a short time
(Lachance, 1976).
Because of the visual assessment method's s1mplicity,
it would appear to be the method of choice for most
researchers. The scrape/weigh method and the visual
assessment method have been compared to determine the
similarity of results. In a study conducted by Lachance
(1976), it was found that as long as the visual method was
perfomed in a very systematic manner, the method yielded
reliable data. Data gathered from 85 trays showed total
plate waste amounts of 41.2% for the visual est1mation
method, and 43.3% for scraping and weighing, a difference of
only 2.1%. Likewise, Comstock, St. Pierre, and Mack1ernan
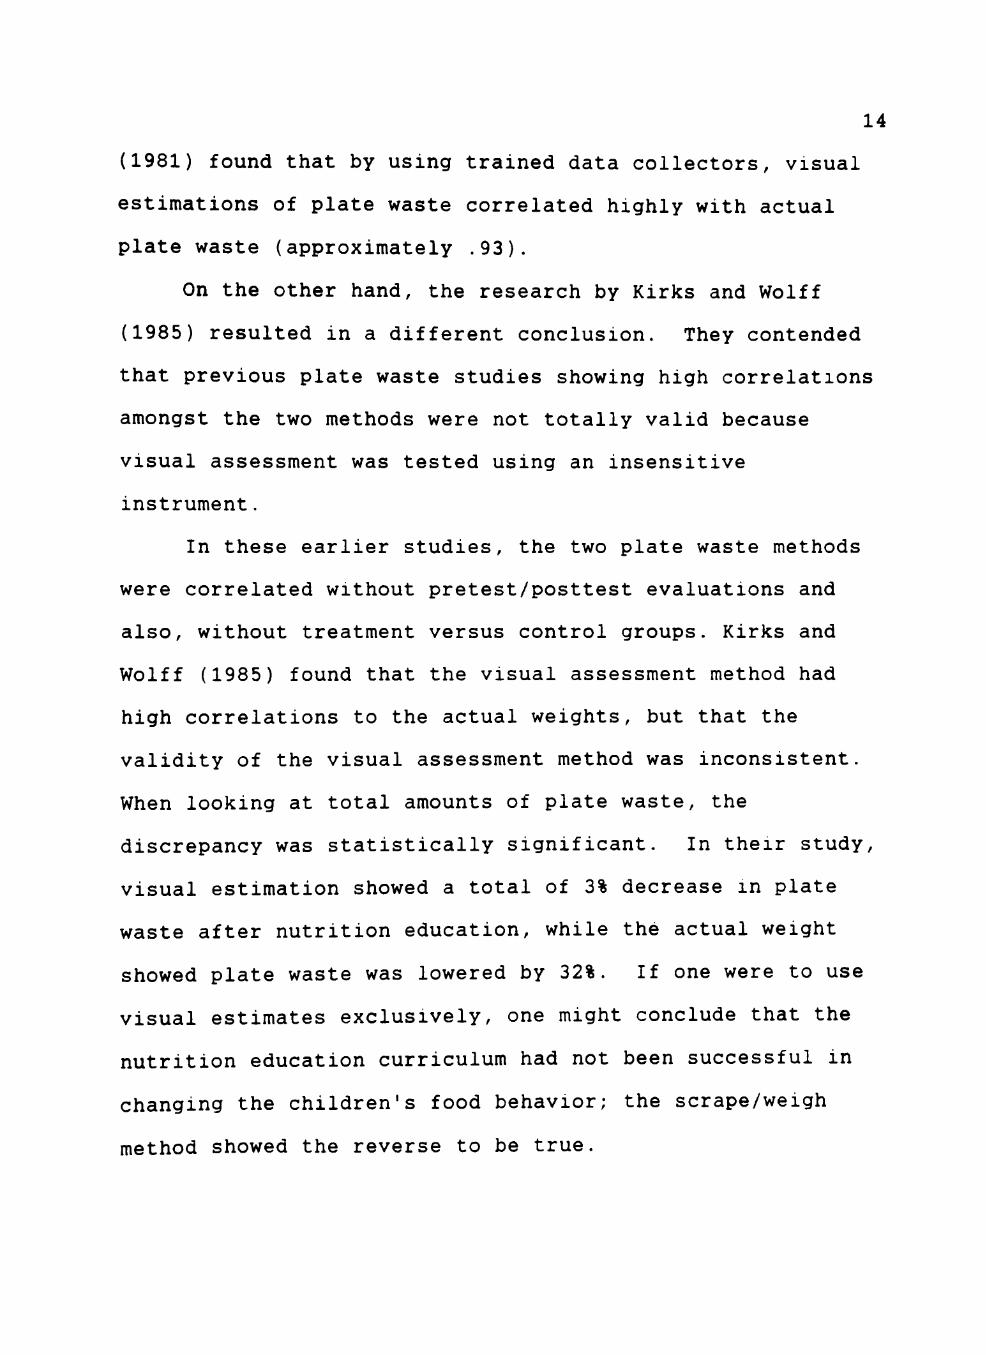
(1981) found that by us1ng trained data collectors, visual
estimations of plate waste correlated highly with actual
plate waste (approximately .93).
14
On the other hand, the research by Kirks and Wolff
(1985) resulted in a different conclusion. They contended
that previous plate waste studies showing high correlat1ons
amongst the two methods were not totally valid because
visual assessment was tested using an insensitive
instrument.
In these earlier studies, the two plate waste methods
were correlated without pretest/posttest evaluations and
also, without treatment versus control groups. Kirks and
Wolff (1985) found that the visual assessment method had
high correlations to the actual weights, but that the
validity of the visual assessment method was inconsistent.
When looking at total amounts of plate waste, the
discrepancy was statistically significant. In their study,
visual estimation showed a total of 3% decrease in plate
waste after nutrition education, while the actual weight
showed plate waste was lowered by 32%. If one were to use
visual estimates exclusively, one might conclude that the
nutrition education curriculum had not been successful in
changing the children•s food behavior; the scrape/weigh
method showed the reverse to be true.
15
Time Studies
Previous researchers have indicated that in using
either the scrape/weigh or the visual assessment method, a
time difference exists between using the two. To determine
if the scrape/weigh method is a more time consuming
procedure as compared to the visual assessment method, a
time study must be conducted. The direct time study
approach, often called a time study, a stopwatch study, or
clocking the job, is the most widely used method for
establishing work standards (Adam & Ebert, 1989).
Work measurement, another term which can be used
interchangeably with time study, is defined as a method of
establishing an equitable relationship between the amount of
work performed and the human input used to do that work.
Time studies or work measurement are necessary to determine
if human resources are being effectively used (Spears,
1990).
The importance of timing is that standard time data are
established, and reasonable estimates of cost for utilizing
a given method may be determined. Timing is helpful in that
one can use the information to better schedule and staff for
the method chosen, and overall, timing allows one to
effectively evaluate alternatives (Konz, 1990).
Summary
There is a concern amongst parents, taxpayers, school
food serv1ce personnel, educators, and the federal
government. This concern centers on whether children are
receiving and consuming nutritious meals while at school.
School food service personnel strive to serve nutritious
meals, and educators, strive to improve the nutrition
knowledge and eating behaviors of the children.
Assessing whether children are consuming the meals
offered at school can be determined through plate waste
analysis. The plate waste method chosen should be
effective, accurate, and efficiently utilize resources.
16

CHAPTER III
METHODOLOGY
The purpose of this study was to determine the degree
of correlation for accuracy existing between the
scrape/weigh method and the visual assessment method for
identifying plate waste. Time requirements were calculated
for both methods to determine which plate waste method was
more efficient. Ease of use for a particular method was not
quantitatively measurable and so was not included in this
study as a dependent variable. However, this factor will be
discussed.
Site
The site chosen for data collection was an elementary
school located in west Texas, and representative of those in
the area. The food service department at this school was
operated by a contract management company. The dining room
contained seating for 240 students.
The dishroom, where plate waste measurements were made,
was a 10 x 13 1/2 foot facility. The counters were made of
stainless steel and ran the length and width of the room.
Three food carts were available for retrieving and
transporting lunch trays to the dishroom.
17

18
Subjects
The subjects from whom plate waste data were collected
included children enrolled in kindergarten through fourth
grade at an elementary school. Only children eating a lunch
provided by the school were included in this study. The
data were collected over a period of two days. The subjects
were from a random sample and were stratified based on
grade.
The number of students in the study per day was based
on 10% of the school's enrollment per grade. The current
enrollment averaged 530. The study incorporated a m1n1mum
of 50 students daily, with nine or more students per grade.
Every eighth student was counted upon exiting the lunch line
and was given a Plate Waste Record (Appendix A) at the
dining table.
Pilot Study
A pilot study was conducted to develop and refine
procedures and forms that were to be used in the actual
study. Based on results of the pilot study, m1nor rev1s1ons
were made on the Plate Waste Record. The original form did
not incorporate a means for recording demographic data. In
addition, data not considered pertinent for this study (such
as school number) was omitted from the form used for the
present study.
The subjects used in the pilot study were third and
fourth graders. In total, 72 trays were collected.
19
The visual assessment was first used to determine plate
waste. After recording visual assessment data, the Plate
Waste Record form was turned over so that the weight of the
plate waste could be recorded. The pilot test procedures
used to measure plate waste for both methods were effective
and were utilized for the present study.
Data Collection
Data on plate waste were collected over a two day
period during the spring of 1994. Three researchers
(Appendix B) collected the data. One researcher assessed
the plate waste by the visual assessment method and by the
scrape/weigh method. The second researcher recorded the
data, and the third researcher took the timings for both
methods and recorded the timings. A training sess1on for
the researchers was held prior to collecting data for the
study. Additionally, the researchers spent one day on site,
practicing the procedures and protocol which were to be used
1n the actual study.
The Standard Weight Form (Appendix C), which was
designed to provide a record of the average weight for all
menu items, was filled out prior to the beginning of meal
service. To accomplish this, five trays were purchased and
taken to the dishroom where each menu item was scraped and

20
weighed. Using the five weight scores per item, an average
was computed for each menu item resulting in standard
weights.
Forms, which had been customized and preprinted based
on the menu, were checked against the food on the serving
line. Any menu substitutions, additions or deletions were
noted and the forms modified. Forms were sequentially
numbered prior to arriving at the site.
Four of the five trays which were purchased to obtain
standard weights, were altered to resemble the various
stages of plate waste using the visual assessment scale:
(1) majority of food consumed; (2) 50% consumed; (3) 1 bite
to 25% consumed; and (4) none consumed. The altered trays
were used as a visual standard for the researcher during
actual plate waste assessment.
After the dishroom was set up and all forms were
prepared, the researchers went into the cafeteria area to
select the subjects. The researchers were stationed at the
end of the cafeteria line. Two of the researchers counted
off the appropriate number of children, followed the
children to their tables to record the necessary information
(a legend was attached to the researchers' clipboards which
revealed the meaning of demographic codes), and proceeded as
outlined in Appendices D and E. The third researcher
collected the trays and forms as the children finished
lunch, set them up in the dishroom according to grade, and
21
discarded any disposable items (i.e., plastic forks, spoons,
napkins) which would not be used for either method of plate
waste analysis.
Plate waste procedures for the visual assessment method
(Appendix D) were used to guide researchers. Research
procedures required the timing of the visual assessment
method to begin when each tray was ready to be assessed, and
to stop after each of the trays had been assessed. Appendix
E was used to guide researchers through the plate waste
procedures using the scrape/weigh method. Research
procedures required that the timing for each tray assessed
by the scrape/weigh method begin as soon as food was
prepared for weighing and to stop timing after all menu
items on the tray were weighed. Timings for the two methods
were recorded on the Plate Waste Time Sheet (Appendix F).
Variables
The independent variable in this study was the method
used to determine plate waste. The dependent variables were
the accuracy of the results and the time involved in
measuring plate waste.
Data Analysis
Analysis included descriptive statistics for the
demographic data. To determine the degree to which a
relationship existed between the two methods of plate waste,
correlations were calculated us1ng Pearson r. Analysis
included the correlations for specific menu items, and
overall for meals.
22
To ascertain if there was a difference in the time
required for data collection for the two methods, the t-test
for nonindependent samples was used. The alpha level was
considered significant at .05.
CHAPTER IV
RESULTS AND DISCUSSION
This study compared two plate waste evaluation methods,
scrape/weigh and visual assessment. Both methods were
utilized to measure plate waste at an elementary school
cafeteria in west Texas. The degree to which the plate
waste results correlated was determined, as well as the time
that was required to assess each tray by method. The data
for this study were collected over two nonconsecutive days,
during the months of April and May of 1994.
Participant Demographics
Table 1 shows the demographic profile of those who
participated in this study. Kindergarten through fourth
grade students were included. Each grade was represented
relatively evenly, although observations of first graders
was slightly higher due to a larger enrollment of this
grade.
There were 54 subjects on the first day of the study,
50 subjects on the second day, resulting in 104 total
observations. The ratio of males to females in this study
was evenly divided. However, this factor occurred by chance
and was not manipulated by the researcher. The students
were predominantly White (64%), followed by Hispanic (28%).
23

Table 1: Profile of students by gender, grade and ethnici ty. a
Characteristic Number
Gender
Female 50
Male 49
Data unavailable 5
Grade
Kindergarten 18
Grade 1 24
Grade 2 19
Grade 3 19
Grade 4 20
Data unavailable 4
Ethnicity
African American 2
American Indian 0
Asian 0
Hispanic 29
White 67
Data unavailable 6
24
Percent
48.1
47.1
4.8
17.3
23.1
18.3
18.3
19.2
4.8
1.9
0.0
0.0
27.9
64.4
5.8

25
Correlation of Plate Waste Methods
Plate waste data for the scrape/weigh and the visual
assessment method were collected according to the procedures
outlined in Appendices D and E. From the data, a
correlation coefficient for the two methods, based on menu
items, was computed (Table 2).
The correlation coefficients 1n this study ranged from
.81 to .99. Overall coefficients for day one and day two
equalled .86 and .85, respectively.
The data that were gathered to acquire correlations
between the two methods of plate waste were analyzed
further. The objective was to determine if the type of menu
item affected the accuracy of the visual assessment method
in comparison to the scrape/weigh.
Table 2 shows the results of menu item analysis. Of
the 12 menu items served, three were repeated on both days.
These repeated items included mashed potatoes, dinner rolls,
and milk. All three items closely correlated: mashed
potatoes .93 and .95; dinner rolls, .97 and .95; and for
milk, .93 and .92.
The main entree on day one was oven-fried chicken and
consisted of chicken nuggets on day two. It was in the meat
category where both the highest and the lowest correlations
for the entire study were found. As was expected, chicken
nuggets proved to have a considerably higher correlation
than the oven-fried chicken, with correlation coeffic1ents

26
Table 2: Correlation of accuracy based on menu item.
Day 1 Day 2
Corre- Corre-lation Number lation Number Coeff- of Coeff- of
Menu Item icient Servings icient Servings
Meat/Meat Alternate
Oven-fried chicken .81 54
Chicken nuggets .99 49
Vegetable/Fruit
Mashed Potatoes .93 52 .95 49
Green Beans .97 35
Spring Peas .95 31
Mixed Fruit .96 41
Bread/Bread Alternate
Dinner Roll .97 54 .95 50
Milk
Milk .93 53 .92 48
Other
Cake .94 51
Overall .86 54 .85 50
27
of .99 and .81, respectively. To visually assess the oven
fried chicken, the researcher had the chicken bone to
contend with, making it difficult to estimate how much of
the meat was actually left. The chicken nuggets, however,
were totally edible. In addition, all students were served
four chicken nuggets. This portion based on count made
estimation extremely easy, because the numbering of the
visual assessment scale coincided exactly with the number of
nuggets. For example, 1n the visual assessment method, four
signifies that no food 1s consumed. Therefore, if the four
nuggets that were served were still left on the tray, the
researcher knew that none had been consumed and assigned a
four.
Menu items in the remaining components varied only
slightly in their correlations. Within the vegetable/fruit
component, coefficients for the five items ranged from .93
to .97. In the other component, which consisted of a slice
of cake, correlations were .94. All correlations in the
study were quite high.
Previous studies conducted to determine a correlation
between the scrape/weigh and visual assessment method
provide similar findings (Table 3). For their study,
comstock, St. Pierre, and Mackiernan (1981) modified the
five-point scale recommended by Lachance (1976) into a S1X
point scale. They then proceeded to determine if there were
correlations between the two plate waste methods. The1r

28
Table 3: Comparison of correlations with prior plate waste studies.
Study
Present Study {1994)
n = 104
Correlations
By Menu Items
Overall
Comstock, St. Pierre, and Mackiernan (1981)
n = 500 By Meal Components
Overall
Dubois {1990)
n = 283 By Meal Components
Overall
Kirks and Wolffe (1985)
n = 343 By Meal Components
Overall
Stallings and McKibben {1982)
n = 250 By Menu Item
Overall
Value Range
.81 to .99
.85 to .86
.77 to .98
.90 to .95
.90 to .98
.95
.92 to .93
.80
.58 to .99
not reported
29
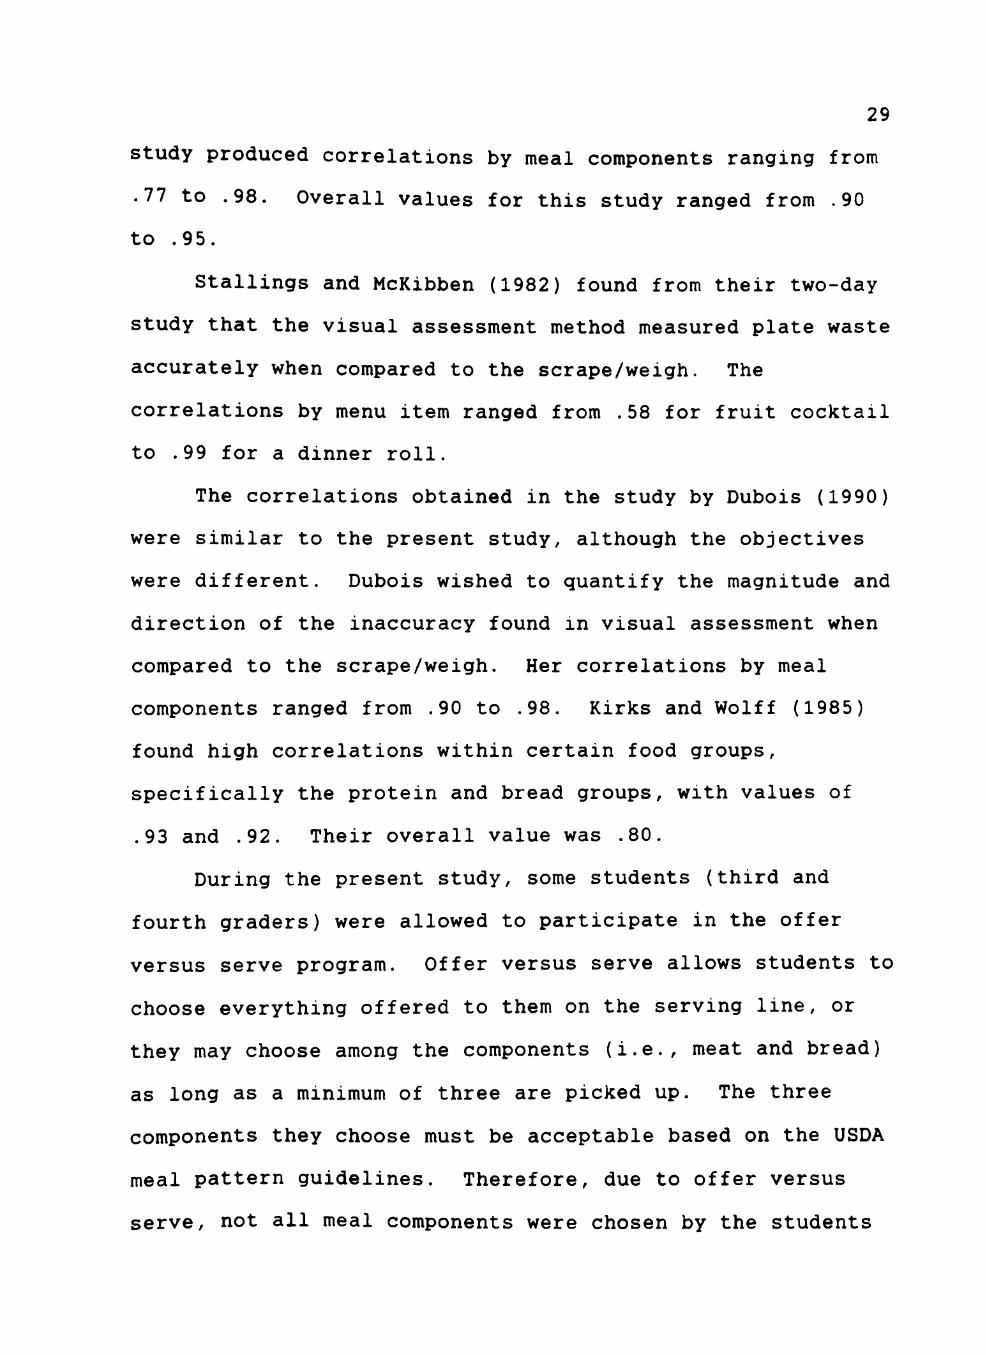
study produced correlations by meal components ranging from
.77 to .98. Overall values for this study ranged from .90
to .95.
Stallings and McKibben (1982) found from their two-day
study that the visual assessment method measured plate waste
accurately when compared to the scrape/weigh. The
correlations by menu item ranged from .58 for fruit cocktail
to .99 for a dinner roll.
The correlations obtained 1n the study by Dubois (1990)
were similar to the present study, although the objectives
were different. Dubois wished to quantify the magnitude and
direction of the inaccuracy found in visual assessment when
compared to the scrape/weigh. Her correlations by meal
components ranged from .90 to .98. Kirks and Wolff (1985)
found high correlations within certain food groups,
specifically the protein and bread groups, with values of
.93 and .92. Their overall value was .80.
During the present study, some students (third and
fourth graders) were allowed to participate in the offer
versus serve program. Offer versus serve allows students to
choose everything offered to them on the serving line, or
they may choose among the components (i.e., meat and bread)
as long as a minimum of three are picked up. The three
components they choose must be acceptable based on the USDA
meal pattern guidelines. Therefore, due to offer versus
serve, not all meal components were chosen by the students
30
~n th~s study. The number of menu items served during the
two day period reflected this choice, and hence, varied.
Since there was no component chosen less than 30 times, the
data were not adversely affected by the offer versus serve
tray, and all correlations were statistically valid.
Time Required to Assess Plate Waste
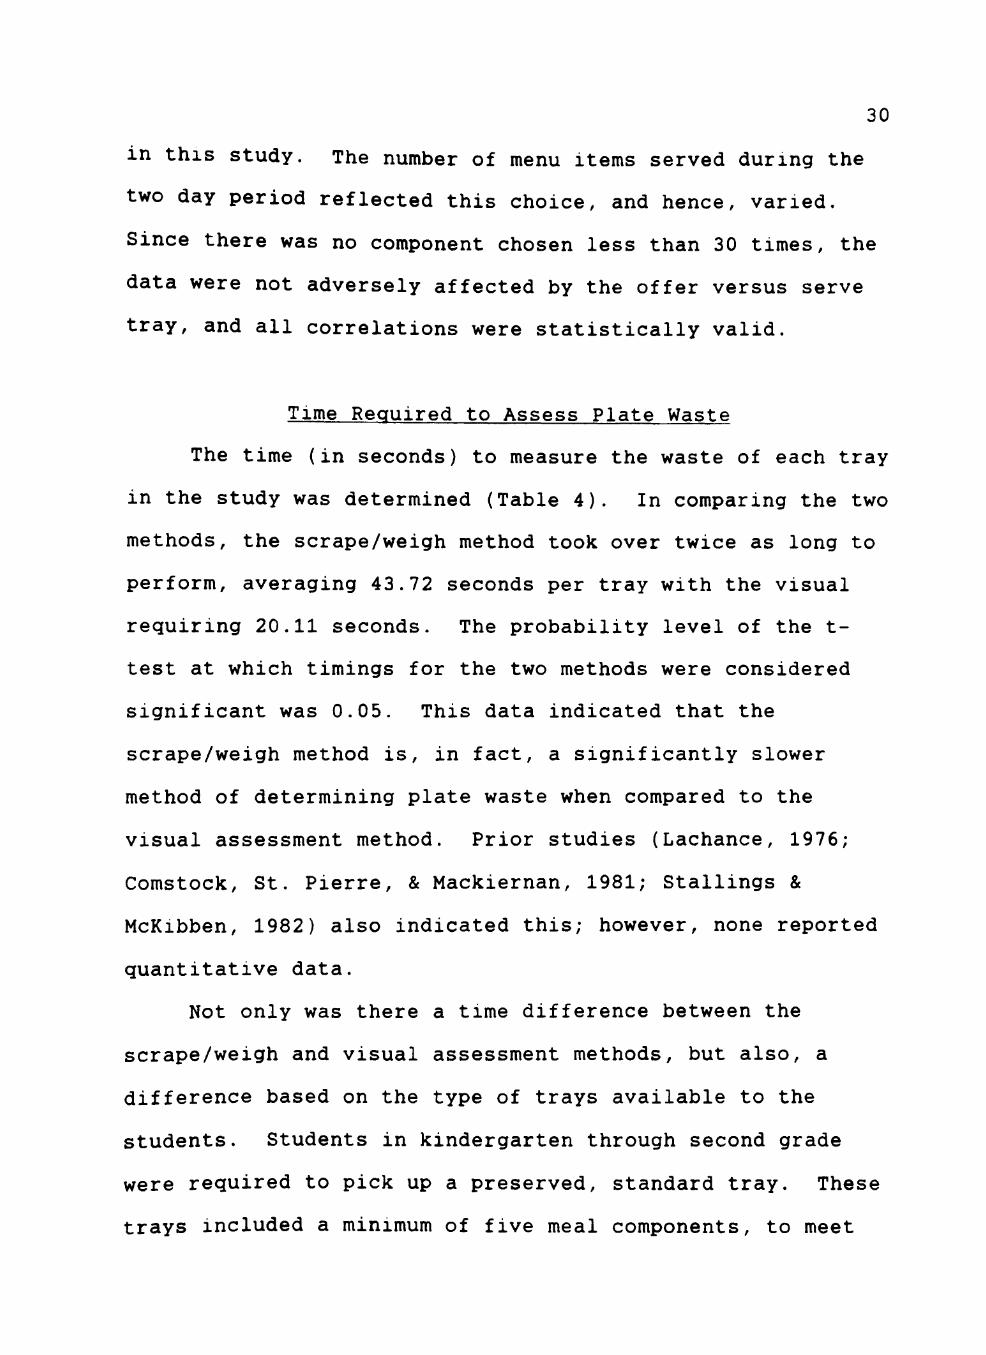
The time (in seconds) to measure the waste of each tray
~n the study was determined (Table 4). In comparing the two
methods, the scrape/weigh method took over twice as long to
perform, averaging 43.72 seconds per tray with the visual
requiring 20.11 seconds. The probability level of the t
test at which timings for the two methods were considered
significant was 0.05. This data indicated that the
scrape/weigh method is, in fact, a significantly slower
method of determining plate waste when compared to the
visual assessment method. Prior studies (Lachance, 1976;
Comstock, St. Pierre, & Mackiernan, 1981; Stallings &
McKibben, 1982) also indicated this; however, none reported
quantitative data.
Not only was there a time difference between the
scrape/weigh and visual assessment methods, but also, a
difference based on the type of trays available to the
students. Students in kindergarten through second grade
were required to pick up a preserved, standard tray. These
trays included a m~n~mum of five meal components, to meet

31
Table 4: Mean time required per tray to assess plate waste based on observation method.a
Scrape/weighb Visualb Probabili tyc
43.72 + 28.87 20.11 + 14.05 0.000
bHean in seconds + standard deviation
32
the USDA meal pattern guidelines. Third and fourth graders
were given the offer versus serve option. Since the third
and fourth graders tended to eat the items (either more of
or the entire serving) which they had personally chosen,
there was less plate waste. Less, or no plate waste, in
turn, meant that less time was required by the researchers
using either method.
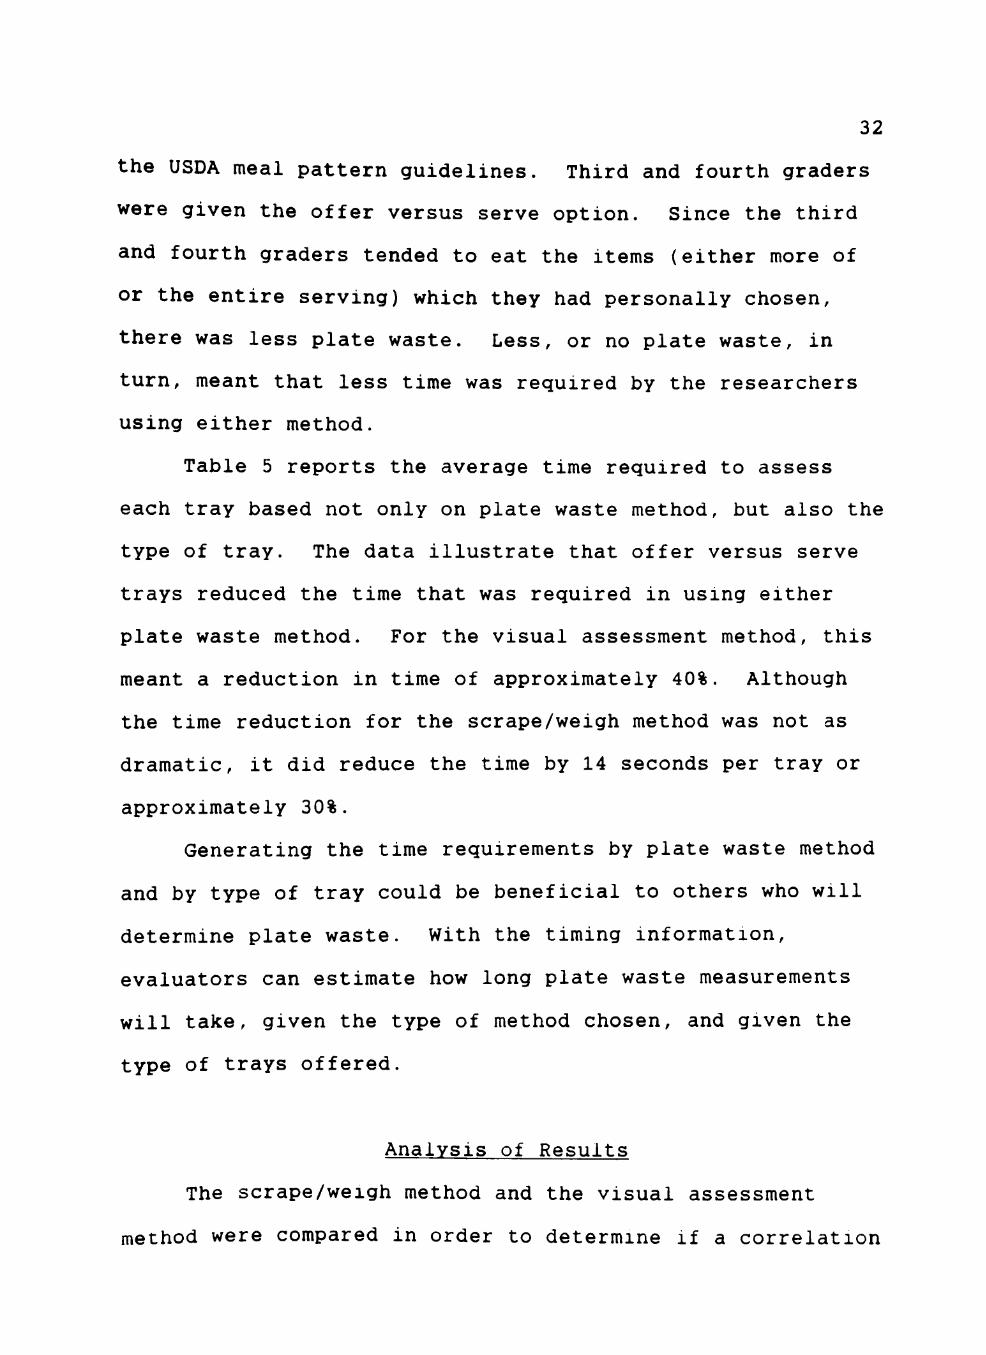
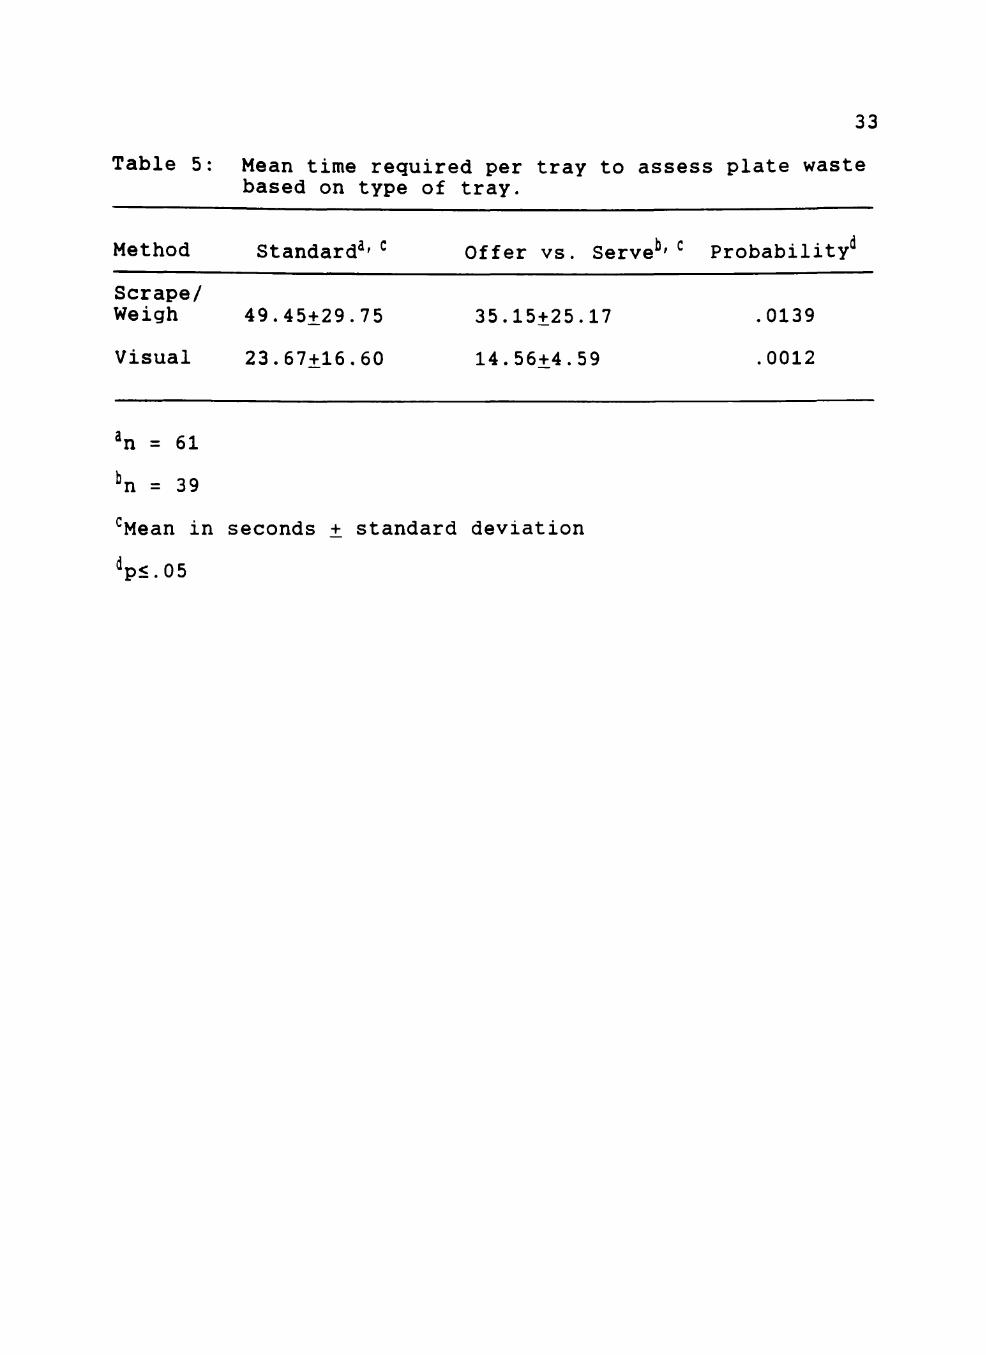
Table 5 reports the average time required to assess
each tray based not only on plate waste method, but also the
type of tray. The data illustrate that offer versus serve
trays reduced the time that was required in using either
plate waste method. For the visual assessment method, this
meant a reduction in time of approximately 40%. Although
the time reduction for the scrape/weigh method was not as
dramatic, it did reduce the time by 14 seconds per tray or
approximately 30%.
Generating the time requirements by plate waste method
and by type of tray could be beneficial to others who will
determine plate waste. With the timing information,
evaluators can estimate how long plate waste measurements
will take, given the type of method chosen, and given the
type of trays offered.
Analysis of Results
The scrape/we1gh method and the visual assessment
method were compared in order to determ1ne if a correlation
33
Table 5: Mean time required per tray to assess plate waste based on type of tray.
Method
Scrape/ Weigh
Visual
Standarda, c
49.45+29.75
23.67+16.60
Offer vs. Serveb, c Probabilityd
35.15+25.17 .0139
14.56+4.59 .0012
cMean in seconds + standard deviation

34
existed. The data showed that the two methods were
extremely close in plate waste results. The visual
assessment method had correlations as high as .99 for
individual menu items. Even when the visual method was used
on individual menu items which were difficult to discern
(such as chicken with the bone intact), the correlation was
still significant at .81.
Two possible reasons can be g1ven for the acquisition
of such reliable data on the visual assessment method in
this study. First, prior to collecting data, plate waste
method training both in-class .and on-site occurred.
Training was used to help ensure that data were collected
and measured in an orderly and systematic fashion. Second,
the researcher responsible for assessing all trays had prior
experience working in the field of school food service.
This comfort and familiarity with the surroundings, types of
foods, and portion sizes may have contributed to a higher
level of accuracy.
Timings of the methods also generated significant
findings. The scrape/weigh method required twice the amount
of time as the visual assessment method. Furthermore, the
time it took to use either method was lengthened when
measuring plate waste from a standard tray, as compared to
an offer versus serve tray.
Depending on one's motivation for determining plate
waste, visual assessment may be the method which suits many
35
purposes. It g1ves a high degree of accuracy, requ1res half
the time of the more traditional scrape/weigh method, allows
one to assess more trays due to time efficiency, requires
inexpensive equipment (paper and pencil), and it is very
easy to do.

CHAPTER V
SUMMARY AND CONCLUSIONS
Plate waste, a long standing problem within the school
food service industry, is measured for a variety of
purposes. Regardless of one's motive for determining plate
waste, an accurate and efficient method needs to be
utilized.
Three generally accepted methods for determ~ning plate
waste are: self-report, scrape/weigh, and visual
assessment. Of the three methods, the scrape/weigh and
visual assessment show the highest degree of correlation
(Comstock, St. Pierre, & Mackiernan, 1981; Holdt, Sitter, &
Gates, 1993). Scrape/weigh, the most precise method in
terms of the quantitative data it generates, has inherent
drawbacks. In general, scrape/weigh is very time consuming.
The visual assessment method, a simpler and faster means of
determining plate waste, is a possible alternative to the
scrape/weigh, although there is a question as to the
accuracy of its data.
This study measured plate waste us~ng both the
scrape/weigh and the visual assessment method. Their
results were compared to determine if v1sual assessment
produced accurate measurements. Time required to determine
waste by both methods also was identified.
36
The null hypotheses which guided this study were:
(1) the correlation for accuracy is low between the visual
assessment and the scrape/weigh method when determining
plate waste; and (2) there is no significant difference 1n
the time required for data collection for the two methods.
Major Findings of the Study
37
Plate waste data were collected for two days. The data
generated from each method were then compared. The
correlation coefficients for the scrape/weigh and the visual
assessment method, for both days, by menu items, were
statistically significant (p<O.OS). Values ranged from .81
to .99. These values were equal to or greater tnan values
found in pr1or studies which concluded that a correlation
did exist between the scrape/weigh and the visual assessment
methods.
The correlatj_ons of .81 and .99 were both from the meat
component. The higher value was the correlation for chicken
nuggets, the lower value, for oven-fried chicken. Although
the oven-fried chicken was more challenging to assess due to
the presence of a bone, it still had a correlation which was
significant. All correlations for individual menu items 1n
this study were statistically significant.
For a determination as to whether there was a time
difference 1n using either of the plate waste methods, every
tray measured for plate waste was also timed. The
38
scrape/weigh method proved to take twice as long per tray as
the visual assessment method.
Further analysis revealed that there was a time
difference based on the plate waste method, and by the type
of tray that was assessed. Students given the offer versus
serve option (as opposed to those who were given a standard
tray) had trays which required less time to assess. Offer
versus serve trays reduced the time that was needed for
assessment using either plate waste method. Using the
scrape/weigh method on an offer versus serve tray reduced
the time minimally, however, for the visual assessment, the
time needed per tray was cut in half.
Impact of the Study
The research from this study accomplished two things:
it showed that a strong relationship does exist between
accuracy of the scrape/weigh and the visual assessment
method, and that a time difference does exist between the
methods. Others who will need to measure plate waste in the
most efficient, and accurate manner would likely find the
results of this research helpful. Although the visual
assessment method is not appropriate for all situations,
particularly if one wishes to determine actual nutrlents
lost through plate waste, it would appear to work, 1n most
instances, quite effectively.

39
Recommendations for Further Research
Three basic recommendations need to be made for further
research. The first recommendation is that further research
which compares the scrape/weigh to the visual assessment
method, use a larger sample size. Although this study
included an acceptable number of observations, a more
comprehensive study could prove more conclusively the extent
to which the methods correlate.
This study suggests that a time difference exists when
collecting data for different plate waste methods. However,
this study did not establish standard times required be
either plate waste method. Therefore, the second
recommendation is that standardized times should be defined
for each method.
Since plate waste can occur 1n any setting which serves
a captive audience, the last recommendation is that the t1me
required for both plate waste methods be determined in other
non-commercial settings. The different methods of serving,
types of customers, and types of food offered, have the
potential to impact the time required for plate waste
methods.
Conclusions
To conclude, the method chosen to assess plate waste
should depend first and foremost, on how the data will
ultimately be used. Also, another basic factor that needs

40
to be considered when choosing a plate waste method is the
amount of resources available for the study. Assuming that
one has a choice in the method used, and is aware that both
methods tend to give accurate results, choosing the visual
assessment method should strongly be considered.
The visual assessment method has many benefic1al
characteristics: it is simple to learn and to use; it
requires inexpensive equipment; twice the amount of data can
be gathered, relative to using scrape/weigh; and most
importantly, data generated from the visual assessment
method are reliable. These points, in addition to the
potential cost savings from the minimal materials needed and
the reduction in staffing hours, should be convinc1ng
arguments toward measur1ng plate waste w1th the visual
assessment method.
REFERENCES
Adam, E., & Ebert, R.J. (1989). Production and operations management: Concepts, models and behav1or (4th ed. ). Englewood Cliffs, NJ: Prentice-Hall.
Chapter IV: Child nutrition programs: A narrat1ve legislative history and program analysis. (1989). School Food Service Research Review, 13,(1), 22-25.
Child Nutrition Act of 1966. Public Law 89-642. October 11, 1966. 89th Congress: U.S. Statutes at Large. Volume 80, p. 885-890.
Coale, E.K., & Bedford, M.R. (1984). Fat-controlled menus 1n a school lunch program. School Food Service Research Review, 8, 37-41.
Comstock, E.M., St. Pierre, R.B., & Mackiernan, Y.D. (1981). Measuring individual plate waste in school lunches. Journal of the American Dietetic Association, 79, 290-296.
Contento, I.R., Manning, A.D., & Shannon, B. (1992). Research perspective on school-based nutrition education. Journal of Nutrition Education, 24(5), 247-260.
DeMicco, F.J. (1990). Identification of barriers that impede school food services from implementing the dietary guidelines. School Food Service Research Review, 14, 10-13.
Devan, K.S., Gregoire, M.B., & Spears, M.C. (1988). Evaluation of a vegetable preparation training program: Part II: Assessment by plate waste observation and student and sensory panel ratings. School Food Service Research Review, 12, 24-27.
Dubois, s. (1990). Accuracy of visual estimates of plate waste in the determination of food consumption. Journal of The American Dietetic Association, 90, 382-387.
Glover, P.K., Stitt, K.R., Kendrick, O.W., & Hayes, J.S. (1991). Dietary guidelines: Knowledge of and use by dietary managers. School Food Service Research Review, 15, 111-113.
Graves, K., & Shannon, B. (1983). Using visual plate waste measurement to assess school lunch behavior. Journal of the American Dietetic Association, 82, 163-165.
41

42
Green, N.R., & Munroe, S.G. (1987). Evaluating nutrientbased nutrition education by nutrition knowledge and school lunch plate waste. School Food Service Research Review, 11, 112-115.
Hiemstra, S.J. (1994). Summary of trends. School Food Service Research Review, 18, 59-60.
Holdt, C.S., Sitter, K., & Gates, G.E. (1993). compar1son of plate waste estimation measures in a pediatric hospital. Journal of Foodservice Systems, 1, 81-90.
Jansen, G.R., & Harper, J.M. (1978). Consumption and plate waste of menu items served in the National School Lunch Program. Journal of The American Dietetic Association, IJ, 395-399.
Kirks, B.A., & Wolff, H.K. (1985). A compar1son ot methods for plate waste determinations. Journal of The American Dietetic Association, 85, 328-331.
Konz, S. (1990). Work design: Industrial ergonomics. Worthington, OH: Publishing Horizons, Inc.
Lachance, P.A. (1976). Simple research techniques for school food service. School Food Service Journal, 34, 68-76.
Lilly, H.D., Davis, D.W., Wilkening, V.L., & Shank, F.R. (1980). Findings of the report on food consumption and nutritional evaluation in the National School Lunch Program. School Food Service Research Review, 4, 7-12.
Maretzkik, A.N. (1979). A prospective on nutrition educat1on and training. Journal of Nutrition Education, 11, 176-180.
National School Lunch Act of 1946. Public Law 79-396. June 4, 1946. 79th Congress: U.S. Statutes at Large. Volume 60, part 1, p. 230-234.
Pannell, D.V. {1990). School foodservice management (4th ed. ). New York: Van Nortstrand Reinhold Publishing.
Read, M.H., & Moosburner, N. (1985). The scheduling of recess and the effect on plate waste at the elementary school level. School Food Service Research Review, 9, 40-44.
Sandoval, W.M., Lockner, D.W., & Adkins, E.W. (1986). Modified school lunch menus based on the dietary guidelines II. Acceptability as determined by plate waste. School Food Service Research Review, 10, 31-34.
43
Schwab, M.G. (1989). Participatory research with children: A new approach to nutrition education. Journal of Nutrition Education, 21, 184B.
Spears, M.C. (1990). Foodservice organizations: A managerial and systems approach. New York: Macmillan Publishing Company.
United States Department of Agriculture. Food and Nutrition Service. Southwest Region (1991). Project 2001: Nutrition for a new century. Dallas: Author.
United States Department of Agriculture and United States Department of Health and Human Services. (1990). Nutrition and your health: Dietary guidelines for Americans (3rd ed., Home and Garden Bulletin No. 232). Washington, DC: Author.
United States Department of Commerce. Economics and Statistics Administration. Bureau of the Census. (1993). Statistical abstract of the United States. (113th ed. ). Washington, DC: U.S. Government Printing Office.
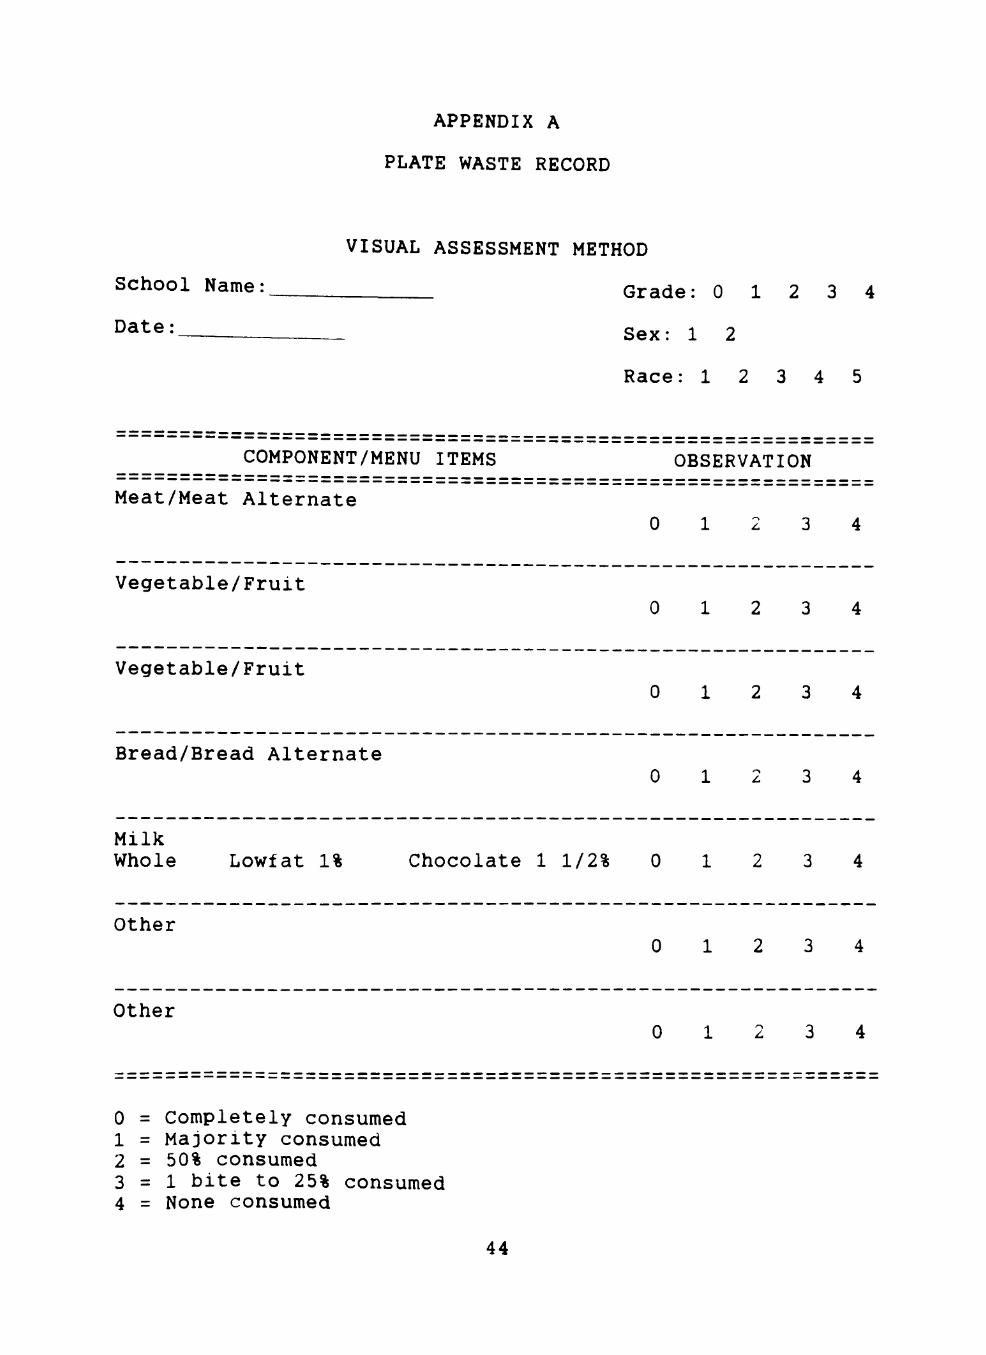
APPENDIX A
PLATE WASTE RECORD
VISUAL ASSESSMENT METHOD
School Name: ------- Grade: 0 1 2 3 4
Date: ------- Sex: 1 2
Race: 1 2 3 4 5
------------------------------------------------------------------------------------------------------------------------COMPONENT/MENU ITEMS OBSERVATION
------------------------------------------------------------------------------------------------------------------------Meat/Meat Alternate
0 1 3 4
------------------------------------------------------------Vegetable/Fruit
0 1 2 3 4
------------------------------------------------------------Vegetable/Fruit
0 1 2 3 4
------------------------------------------------------------Bread/Bread Alternate
Milk Whole
Other
Other
Lowfat 1% Chocolate 1 1/2%
0 1
0 1
0 1
0 1
3 4
2 3 4
2 3 4
3 4
============================================================ 0 = Completely consumed 1 = Majority consumed 2 = 50% consumed 3 = 1 bite to 25% consumed 4 = None consumed
44

SCRAPE/WEIGH METHOD
============================================================ COMPONENT/MENU ITEMS WEIGHT OF WASTE
============================================================ Meat/Meat Alternate
----------------------------------------Vegetable/Fruit
----------------------------------------Vegetable/Fruit
Bread/Bread Alternate
Milk Whole
Other
Lowfat 1% Chocolate 1 1/2%
----------------------------------------Other
============================================================
45

APPENDIX B
BACKGROUND OF RESEARCHERS
1. The primary researcher 1s a graduate student in
Restaurant, Hotel, and Institutional Management.
Her professional experience has primarily been
in school food service, having served 1n the
capacities of assistant, and director of school
food services.
2. The second researcher 1s a graduate advisor and
professor in the department of Restaurant,
Hotel, and Institutional Management. Her
previous professional experience was in hospital
dietetics.
3. The third researcher 1s a graduate student in
Restaurant, Hotel, and Institutional Management.
Her prior professional experience was 1n
journalism and marketing.
46

APPENDIX C
STANDARD WEIGHT RECORD
School Name: -------Date: _________ _
============================================================ COMPONENT/MENU ITEMS WEIGHT (GRAMS)
------------------------------------------------------------------------------------------------------------------------Meat/Meat Alternate
Vegetable/Fruit
Vegetable/Fruit
Bread/Bread Alternate
Milk (Boz)
Whole Lowfat 1% Chocolate 1 1/2%
Other
Other
============================================================
47

APPENDIX D
VISUAL ASSESSMENT PLATE WASTE PROCEDURES
1. Using the pre-selected number of children for the
study, Plate Waste Records are distributed as the
children sit down with their trays.
2. Before leaving forms with the students, demographic
information is filled out, the type of milk chosen is
circled, and lastly, any menu item not picked up by the
student is marked out. Forms are then slid under
trays.
3. Researchers will instruct the students to leave their
trays and forms on the table after finishing lunch.
This is done as an incentive to the participants and to
help researchers keep trays and forms together.
4. Researchers will collect the forms and trays left,
place them on utility carts, and take them to the
dishroom for analysis.
5. In the dishroom, trays are lined 1n rows with the
forms placed under them.
6. When each tray is ready to be assessed, the timing for
it will be started. The timing for each tray is
stopped when the assessment for it is completed. Time
will be taken with a digital stopwatch.
7. One researcher will begin the procedure by visually
assessing each tray, and then calling out the coded
48
49
amounts. A second researcher will record the amounts,
while the third researcher records the time.

APPENDIX E
SCRAPE/WEIGH PLATE WASTE PROCEDURES
1. Using the pre-selected number of children for the
study, Plate Waste Records are distributed as the
children sit down with their trays.
2. Before leaving the forms with the students, demographic
information is filled out, the type of milk chosen is
circled, and lastly, any menu item not picked up by the
student is marked out. Forms are then slid under
trays.
3. Researchers will instruct the students to leave their
trays and forms on table after finishing lunch. This
is done as an incentive to the participants and to help
researchers keep trays and forms together.
4. Researchers will collect the forms and trays left,
place them on utility carts, and take them to the
dishroom for analysis.
5. In dishroom, trays are lined 1n rows with the forms
placed under them.
6. The scrape/weigh procedure begins immediately after all
trays are visually assessed.
7. Each tray is assessed in the same sequential order as
the visual method.
B. Timing will begin for each tray as soon as food is
prepared for weighing. This timing includes food that
50

51
must be separated for accurate measuring (chicken meat
separated from bone, stick removed from corn dog,
etc.). Timing for each tray is stopped after all menu
items on it have been weighed.
9. Weighing of each food item will be accomplished using a
calibrated, digital gram scale.
10. One researcher will scrape all left over food into a
clean, styrofoam container. This will be done for each
menu item. Next, the researcher will call out the
reading to the second researcher who will record the
amount. The third researcher records the time.

APPENDIX F
PLATE WASTE TIME SHEET
SCHOOL
DATE· ______________ _
GRADE: -----------------------
============================================================ VISUAL ASSESSMENT METHOD
============================================================ Number
of Trays Time
MIN: SEC -----------------------
1 ----------------
2
----------------3
4
5
6
7
8
9
10
11
12
===========================================================
52

SCHOOL
DATE: ______________ _
GRADE
============================================================ SCRAPE/WEIGH METHOD
============================================================ Number
of Trays Time
MIN: SEC ------------------------
1
2
3
4
5
6
7
8
9
10
11
12
============================================================
53