A COMPARISON OF TWO METHODS FOR GENERATING … · a comparison of two methods for generating...
14
A COMPARISON OF TWO METHODS FOR GENERATING DESCRIPTIVE ATTRIBUTES WITH TRAINED ASSESSORS: CHECK-ALL-THAT-APPLY (CATA) VS. FREE CHOICE PROFILING (FCP) OXANA LAZO, ANNA CLARET and LUIS GUERRERO * IRTA-Food Technology, XaRTA, Finca Camps i Armet s/n, E-17121-Monells, Girona, Spain *Corresponding autor. TEL: 134 972630052; FAX: 134 972 630980; EMAIL: [email protected] Accepted for Publication January 11, 2016 doi:10.1111/joss.12202 ABSTRACT The quality and reliability of descriptive profiles are closely linked to an accurate selection of the attributes included therein. Descriptive profiles with trained assessors often face challenges stemming from consensual procedures and the risk of forgetting some relevant descriptors. To overcome these problems, the suitability of two nonconsensual methods performed by trained assessors, namely free choice profiling (FCP) and check-all-that-apply (CATA), are examined and compared when building a sensory profile for fish. Eighteen trained panelists having similar training were randomly split into two groups of nine assessors each. One group evaluated different fish species using CATA and the other using FCP, with both groups adopting the same experimental design. Although both methodologies generated an important number of sensory descriptors for the tested products, noticeable differences among methods were observed. CATA performed better than FCP in terms of the descriptive ability and slightly better regarding the discriminant capacity. Both methods provided similar product location in the multidimensional space. The RV coefficient was significantly different from zero for all the sensory modalities except for odor and texture. However, noticeable differences were observed in product description. The main limitations of the study were also discussed. PRACTICAL APPLICATIONS Sensory descriptive analysis is normally the first step in the characterization of a food product, thus providing valuable information for food companies when designing and/or improving a product. This study shows and compares the usefulness of two methods, namely CATA and FCP, to obtain descriptive profiles, thus avoiding some of the bias linked to consensual procedures. Both methods are suitable for product discrimination, although they provide different sensory characterization for the different samples. The use of trained assessors, both with CATA and FCP, might increase the quality of a descriptive profile by avoiding useless terms and, especially in the case of CATA, ensuring that the most relevant descriptors are included. Journal of Sensory Studies 31 (2016) 163–176 V C 2016 Wiley Periodicals, Inc. 163 Journal of Sensory Studies ISSN 0887-8250
Transcript of A COMPARISON OF TWO METHODS FOR GENERATING … · a comparison of two methods for generating...

A COMPARISON OF TWO METHODS FOR GENERATINGDESCRIPTIVE ATTRIBUTES WITH TRAINED ASSESSORS:CHECK-ALL-THAT-APPLY (CATA) VS. FREE CHOICEPROFILING (FCP)OXANA LAZO, ANNA CLARET and LUIS GUERRERO*
IRTA-Food Technology, XaRTA, Finca Camps i Armet s/n, E-17121-Monells, Girona, Spain
*Corresponding autor.
TEL: 134 972630052;
FAX: 134 972 630980;
EMAIL: [email protected]
Accepted for Publication January 11, 2016
doi:10.1111/joss.12202
ABSTRACT
The quality and reliability of descriptive profiles are closely linked to an accurate
selection of the attributes included therein. Descriptive profiles with trained
assessors often face challenges stemming from consensual procedures and the risk
of forgetting some relevant descriptors. To overcome these problems, the
suitability of two nonconsensual methods performed by trained assessors, namely
free choice profiling (FCP) and check-all-that-apply (CATA), are examined and
compared when building a sensory profile for fish.
Eighteen trained panelists having similar training were randomly split into two
groups of nine assessors each. One group evaluated different fish species using CATA
and the other using FCP, with both groups adopting the same experimental design.
Although both methodologies generated an important number of sensory descriptors
for the tested products, noticeable differences among methods were observed. CATA
performed better than FCP in terms of the descriptive ability and slightly better
regarding the discriminant capacity. Both methods provided similar product location
in the multidimensional space. The RV coefficient was significantly different from
zero for all the sensory modalities except for odor and texture. However, noticeable
differences were observed in product description. The main limitations of the study
were also discussed.
PRACTICAL APPLICATIONS
Sensory descriptive analysis is normally the first step in the characterization of a food
product, thus providing valuable information for food companies when designing
and/or improving a product. This study shows and compares the usefulness of two
methods, namely CATA and FCP, to obtain descriptive profiles, thus avoiding some of
the bias linked to consensual procedures. Both methods are suitable for product
discrimination, although they provide different sensory characterization for the
different samples. The use of trained assessors, both with CATA and FCP, might
increase the quality of a descriptive profile by avoiding useless terms and, especially in
the case of CATA, ensuring that the most relevant descriptors are included.
Journal of Sensory Studies 31 (2016) 163–176 VC 2016 Wiley Periodicals, Inc. 163
Journal of Sensory Studies ISSN 0887-8250

INTRODUCTION
Sensory descriptive analysis is normally the first step in the
characterization of a food product. It provides valuable infor-
mation for food companies when designing and/or improving
a product throughout the different steps involved, from for-
mulating a product to tracking its shelf life. Sensory descrip-
tive analysis also helps researchers to better understand the
sensory response resulting from the consumption or use of a
product and the relationship between sensory and other phys-
icochemical characteristics (Varela and Ares 2012).
Descriptive methods consist of different steps depending
on the technique chosen; however, all methods include a
step involving the selection of the most appropriate sensory
descriptors to assess (Murray et al. 2001). The quality and
reliability of a descriptive profile is closely linked to an accu-
rate selection of the attributes included in it (Montouto
et al. 2002). As stated by Stampanoni (1994), sensory termi-
nology is a determinant factor in descriptive analysis because
perceptions are greatly influenced by language.
Traditionally, the generation and selection of descriptors
have been accomplished by means of trained assessors. Meth-
ods including flavor profile (Cairncross and Sj€ostr€om 1950),
texture profile (Brandt et al. 1963), quantitative descriptive
analysis (Stone et al. 1974) and the spectrum method
(Meilgaard et al. 1991) have been used for this purpose; mean-
while, other techniques such as quantitative flavor profiling
delegate this task to a reduced group of experts (Stampanoni
et al. 1996). Although these techniques have proven to be both
powerful and highly effective in sensory profiling (Guerrero
1996; Murray et al. 2001, Varela and Ares 2012), sometimes
the assessors’ lack of product-oriented expertise and training
or time constraints constitute a handicap for obtaining a satis-
factory list of sensory descriptors. In most traditional descrip-
tive techniques, attribute elicitation can be affected by
weaknesses such as time requirement and elevated costs, low
product knowledge, and need for consensus.
To elaborate an appropriate descriptive profile, a good
knowledge of the product is recommended. Normally, concep-
tual associations are founded on self-experiences (Stolzenbach
et al. 2013); thus, familiarity with previous concepts and prod-
uct definitions makes it easier for assessors to elicit attributes
when writing descriptions (Tuorila et al. 1998). In addition, the
ease with which a person draws an association between a stim-
ulus and its defining concept is highly influenced by prior
experience with the same stimulus (Giacalone et al. 2015).
Sensory consensual methods may run the risk of producing
unreliable results, often in situations involving a panel leader
with a dominant personality (Walker 2004; Lawless and Hey-
mann 2010). In addition, assessors could make mistakes such
as sensitivity errors, which occur when some panelists are
more sensitive than others to a determined attribute, thus,
affecting the panel consensus (Meullenet 2008a). The selection
of attributes to be included in a final profile by consensus pro-
cedure could be prone to different biases originating within
the group dynamic itself. Factors such as a lack of agreement
on which attributes to select (Murray et al. 2001) or the exis-
tence of disagreements regarding the individual meaning of
some sensory characteristics (Delarue and Sieffermann 2004)
might influence the validity of the final consensus. In fact,
even after extensive panel training aimed to obtain agreement
over attribute meaning, small differences between assessors are
unavoidable (Lea et al. 2001, Martens and Martens 2001,
Granitto et al. 2008). On occasion, even trained panelists seem
to hold different conceptions of the same stimulus (Mosko-
witz 2003), thus, implying a certain communication deficiency
related to vocabulary (Fichet et al. 2011). As stated by Lawless
(1999), a stimulus may elicit responses that are quantitatively
and qualitatively different from one subject to another, espe-
cially when chemical senses are involved. The risk of forgetting
one or several important descriptors might also be an addi-
tional inconvenience in these consensual methods (Perrin and
Pages 2009).
One possible solution to solve some of these problems is
to encourage the personal generation of descriptors, as free
as possible, by means of techniques such as free choice
profiling (FCP) (Williams and Langron 1984), wherein pan-
elists are not expected to agree on the number, type or inter-
pretation of elicited attributes. This method is even faster
and more economical than traditional procedures (Jack and
Piggott 1991; Reinbach et al. 2014), although, it has some
disadvantages when performed with consumers using terms
that are too personal or difficult to interpret because of their
quantity or diversity (Piggott and Watson 1992). A majority
of those terms elicited from consumers are usually not linked
with any specific definitions or references, thus, making it
difficult to deduce a consensual use of terms (Sieffermann
2000). In addition, some terms could be related to benefits
that are consequences of consuming the product (e.g., thirst
quenching, filling up) and that seem to be linked to hedonic
issues (Veinand et al. 2011). Consequently, the use of this
technique, usually reserved for na€ıve individuals, could be
enhanced when used with trained panelists (Guerrero et al.
2001). The use of FCP among trained panelists offers the
advantages of both traditional descriptive techniques and
free eliciting techniques, thus eliminating a number of extant
inconveniences linked to consensual procedures.
Another method that might be useful in overcoming
some of the biases previously mentioned is CATA or the
Check-All-That-Apply test (Adams et al. 2007; Meullenet
et al. 2008b, Varela and Ares 2012). The CATA method is a
form of multiple choice survey wherein a list of answer alter-
natives is presented and respondents tick the options that
they consider applicable to the product. The CATA method
requires minimal instruction, is relatively easy to perform
and is completed quickly (Dooley et al. 2010). CATA’s
CATA VS. FCP O. LAZO, A. CLARET and L. GUERRERO
164 Journal of Sensory Studies 31 (2016) 163–176 VC 2016 Wiley Periodicals, Inc.

potential for eliciting reliable product characterizations has
come mostly from consumers (Ares et al. 2014, Ares et al.
2015), with a similar procedure having reportedly been used
with trained assessors (Campo et al. 2010). To our knowl-
edge, this technique has not been previously used when per-
forming free selection of descriptive terms by trained
panelists. Theoretically, the use of CATA should allow tasters
to select the most appropriate terms to describe a product
without a consensus bias, thus reducing the risk of forgetting
relevant attributes if the selected terms included in the test
have been chosen based on an extensive bibliographic search
when available. When little previous descriptive information
exists, the initial list of descriptors can be freely generated by
means of trained assessors, similarly to the procedure used
in the first stage of a FCP (individual free generation of
descriptors).
The aim of this study is to verify and compare the ability
of two nonconsensual methods, namely CATA and FCP, to
elicit sensory descriptive attributes in terms of the quantity
and quality (i.e., assessed by their discriminant power) of
descriptors generated by trained assessors.
MATERIALS AND METHODS
Sampling and Cooking Procedure
Twenty-three different fish species were selected at the fish
market based on visual differences (size, color, shape),
expected mouth characteristics (texture and flavor) and
availability throughout the duration of this study (Table 1).
Fresh samples were acquired in fillet presentation (bone-
less and without the skin). Each fillet was vacuum-packed
and stored frozen (220C) until evaluation for a maximum
of 15 days. Twenty-four hours before analysis, samples were
thawed at 4C.
In all cases, samples were cooked in a convection oven at
115C for 20 min in individual transparent glass jars designed
to make samples easy to visualize. Jar lids were used to keep
the samples’ odor from disappearing (Model B-250, Juvasa,
Spain). Jars were then placed inside electrical heaters at 60C
to keep them warm while being tasted.
Elicitation of Descriptive Terms
The descriptive terms to be analyzed and compared were
obtained by means of two different methodologies: CATA
and FCP.
CATA Test. To select the attributes to be included in the
checklist, an extensive bibliographical review was conducted,
creating a list of potential fish descriptors (Table 2). Then,
panelists assessed the 23 different species (Table 1) in four
different sessions (one for odor, one for appearance, one for
flavor and one for texture), where they were asked to indi-
vidually elicit as many sensory attributes as possible to
describe those fish samples provided. In each session or for
each sensory modality panelists evaluated five sets of four
TABLE 1. FISH SPECIES USED FOR DIFFERENT DESCRIPTIVE ANALYSES
Scientific Name Commercial name Free attribute generation CATA test FCP test
Salmo salar Salmon X X X
Argyosomus regius Meagre X X X
Perca fluviatilis Eurasian perch X X
Xiphias gladius Swordfish X X
Merluccius merluccius European hake X X
Lophius piscatorius Anglerfish (monkfish) X X X
Scomber scombrus Atlantic mackerel X X
Gadus morhua Atlantic cod X X X
Sparus auratus Gilthead seabream X X
Pangasius hypophthalmus Iridescent shark X X
Hippoglossus hippoglossus Atlantic Halibut X X X
Zeus faber John Dory or Peters fish X X
Pagrus pagrus Red porgy X
Sanders lucioperca Pikeperch X X X
Lithognathus Mormyrus Sand steenbras X
Etmopterus pusillus Smooth lanternshark X
Psetta maxima Turbot X X X
Dicentrarchus labrax European seabass X X
Diplodus sargus sargus) White seabream X
Conger conger Conger Eel X X
Solea solea Sole X X
Lepidorhombus boscii Four spot megrim X X
Salmo trutta Brown trout X X X
O. LAZO, A. CLARET and L. GUERRERO CATA VS. FCP
Journal of Sensory Studies 31 (2016) 163–176 VC 2016 Wiley Periodicals, Inc. 165

TABLE 2. SENSORY ATTRIBUTES OBTAINED FROM THE BIBLIOGRAPHY
Attribute Specie tested Description Reference Country
Odor
Acetic Atlantic cod Acetic acid Sveinsdottir et al. (2009) Iceland
Ammonia Cod TMA concentrated Cardenas et al. (2007) Iceland
Butter Atlantic cod Popcorn Sveinsdottir et al. (2009) Iceland
Dairy Sea bream Boiled milk Cardinal et al. (2011) France
Earthy Sea bream Intense odor Cardinal et al. (2011) France
Manure Salmon Barn cow manure Farmer et al. (2000) Ireland
Meat Cod Boiled meat Sveinsdottir et al. (2009) Iceland
Metallic Salmon Iron, blood sulfate Rødbotten et al. (2009) Norway
Potato Cod Cooked potato Sveinsdottir et al. (2010) Iceland
Rancid Meagre Oxidized fat Hern�andez et al. (2009) Spain
Rotten Cod Old fish Cardenas et al. (2007) Iceland
Sea water Salmon Fresh salty ocean Rødbotten et al. (2009) Norway
Sea weed Cod Seafood, alga Sveinsdottir et al. (2010) Iceland
Sour Salmon Organic acids Rødbotten et al. (2009) Norway
Stagnant water Salmon Intensity of the attribute Farmer et al. (2000) Ireland
Sulfur Cod Phosphorus Sulfur Sveinsdottir et al. (2009) Iceland
Vanilla Cod Milky vanilla Sveinsdottir et al. (2010) Iceland
Appearance
Black veins Sea bream Black grooves Cardinal et al. (2011) France
Coagulated proteins Sea bream Brown spots Cardinal et al. (2011) France
Color ivory Salmon Yellow notes Rødbotten et al. (2009) Norway
Color white Halibut Intensity pure color Olsson et al. (2003) Norway
Color homogeneity Cod Color uniformity Sveinsdottir et al. (2009) Iceland
Exudates presence Salmon Released liquid Farmer et al. (2000) Ireland
Fat droplets in exudates Salmon Fat released in fish exudates Farmer et al. (2000) Ireland
Laminar structure Salmon Visual flake openings Veiseth-Kent et al. (2010) Norway
Shine Sea bream Bright surface Orban et al. (1997) Italy
Suspended particles Cod Precipitation of meat Sveinsdottir et al. (2010) Iceland
Flavor
Acid Cod Flavor intensity Rødbotten et al. (2009) Norway
Ammonia Cod Amine flavor Sveinsdottir et al. (2009) Iceland
Bitter Salmon Intensity quinine Rødbotten et al. (2009) Norway
Butter Cod Popcorn like Sveinsdottir et al. (2009) Iceland
Earthy Sea bream Flavor Intensity Cardinal et al. (2011) France
Fish oil Salmon Oily Intensity Farmer et al. (2000) Ireland
Meat Cod Boiled meat Sveinsdottir et al. (2009) Iceland
Manure Salmon Intensity barn Farmer et al. (2000) Ireland
Metallic Sea bream Flavor Intensity Cardinal et al. (2011) France
Nutty Salmon Almond hazelnut Veiseth-Kent et al. (2010) Norway
Old Salmon Not fresh Rødbotten et al. (2009) Norway
Potato Sea bream Flavor Intensity Cardinal et al. (2011) France
Pungent Cod Intense Cardenas et al. (2007) Iceland
Rancid Salmon Oxidized fat Bencze et al. (1998) Norway
Rotten Cod Putrid Sveinsdottir et al. (2009) Iceland
Salty Salmon Intensity Farmer et al. (2000) Ireland
Sea water Salmon Fresh, ocean Rødbotten et al. (2009) Norway
Sour Cod Deteriorated Sveinsdottir et al. (2009) Iceland
Smoked Salmon Intensity Bencze et al. (1998) Norway
Sweet Cod Intensity Cardenas et al. (2007) Iceland
Texture
Chewiness Meager Number of chews
before swallowing
Hern�andez et al. (2009) Spain
Cohesiveness Meager Fish structure Giogios et al. (2013) Greece
Elastic Salmon Degree of recovery when
applying Biting force
Veiseth-Kent et al. (2010) Norway
Perch
CATA VS. FCP O. LAZO, A. CLARET and L. GUERRERO
166 Journal of Sensory Studies 31 (2016) 163–176 VC 2016 Wiley Periodicals, Inc.

samples and one set of three samples. Assessors had a short
break of 5 min between each set of samples. Finally, a list of
attributes was revealed to the panelists. This list included the
attributes from the bibliographical review and some addi-
tional attributes that had been obtained from the previous
four different sessions after removing those terms considered
redundant by means of a triangulation process (Guerrero
et al. 2010). CATA analysis was carried out over this final
checklist, which had a total of 103 descriptors that included
odor, appearance, flavor and texture attributes. To reduce
the number of samples requiring assessment, and based on
the previous descriptive task (the four different sessions
mentioned above), 19 fish species (those presenting the
highest sensory diversity) were evaluated in one session (in
four sets of four samples each and one set of three samples,
thus allowing assessors to have a short break of 5 min
between each set of samples). Due to the large amount of
attributes to evaluate, they were grouped by sensory modal-
ity and presented to the assessors in separated paper sheets.
To make the task easier, the order of the descriptors was
always the same for all the assessors and for the five sets of
samples in order to reduce the effort spent on locating and
checking the attributes on the ballot. Panelists were asked to
smell samples at the beginning of the test so that the odor
would not disappear before they completed the task. For
every sample, panelists were instructed to mark in the check-
list only those attributes that were clearly perceived to more
effectively capture the relevant differences among selected
fish species. This procedure was performed species by species
within each set of sample, so for each assessor each specific
attribute could be ticked up to a maximum of 19 times. Pan-
elists also had the opportunity to add new descriptors if they
considered it necessary.
FCP. Eight fish species were selected from among the previ-
ous 19 species assessed in the CATA sessions. Selection was
designed to choose those that were most different from each
other from a sensory point of view in the CATA test. Species
selected for this technique were salmon, meager, angler fish,
Atlantic cod, halibut, turbot, pikeperch and brown trout (sea
trout). The FCP technique was performed in three sessions.
In the first session, panelists evaluated the eight samples to
generate the personal attributes they could perceive as rele-
vant when describing each fish species. In the next two ses-
sions, panelists had to rate the same eight samples in each of
them using their own attributes in a lineal scale from 0 to
10, anchored with the words low intensity/absence (0) and
high intensity (10).
Panelists and Procedure
Eighteen panelists with more than 4 years of experience in
the sensory profiling of food products (previously selected
and trained according to ISO regulations) were recruited for
this study. Nine panelists were randomly selected to partici-
pate in the CATA analysis and the other nine in the FCP
method. All of them had similar descriptive and quantitative
sensory performance and were between 31–52 years old.
In each session, the order of sample presentation and the
first order and carry-over effects (Macfie et al. 1989) were
blocked. In all cases, the generation of descriptors was per-
formed in isolated sensory testing booths (ISO, 2007). All
assessors were provided with mineral water to cleanse their
palates between samples.
Data Analysis
To analyze and visualize the CATA data, a Factorial Corre-
spondence analysis was performed over the contingency
matrix obtained (frequency of each selected term for each
species). Previously, only those descriptors being cited eight
or more times (taking into account all assessors and the 19
products) were kept. FCP data were analyzed using the Gen-
eralized Procrustes Analysis (GPA) (Gower 1975). In this
case, only discriminant descriptors after performing a two-
TABLE 2. CONTINUED
Attribute Specie tested Description Reference Country
Flakes Cod Fish breaks in flakes when pressing Sveinsdottir et al. (2009) Iceland
Film palate Salmon Degree in which fish sticks to mouth Farmer et al. (2000) Ireland
Firmness Halibut Hardness in the first bite Olsson et al. (2003) Norway
Gummy Perch Like chewing gum Stejskal et al. (2011) Czech Republic
T-Juicy Salmon Water released after chewing Veiseth-Kent et al. (2010) Norway
Halibut
Mouth residue Salmon Intensity Farmer et al. (2000) Ireland
Stringiness Meager Fibred tissue Giogios et al. (2013) Greece
Sea bream
Cod
Teeth adherence Salmon Degree in which fish sticks to teeth Farmer et al. (2000) Ireland
Cod
Sea bream
O. LAZO, A. CLARET and L. GUERRERO CATA VS. FCP
Journal of Sensory Studies 31 (2016) 163–176 VC 2016 Wiley Periodicals, Inc. 167

way ANOVA (fish species and tasting session) for each asses-
sor (P< 0.25) were retained. The mean value of the two rep-
licates performed was submitted to the GPA analysis. Using
these two selecting criteria (frequency of elicitation equal or
higher than 8 for CATA and discriminant ability of P< 0.25)
a similar reduction of the initial number of descriptors were
obtained (70.9% for CATA and 70.0% for FCP), thus, being
both methods easier to compare.
A comparison between the CATA and FCP techniques was
drawn by calculating the overall number of attributes elicited
in each method and sensory modality (appearance, odor, fla-
vor and texture attributes). Differences between the 8 fish
samples were examined to check the discriminant ability of
each method, thus, involving all the selected descriptors in
each of them. In the case of FCP the consensual coordinates
for each assessor and for all the samples, after performing
the corrections done by the GPA (translation, scaling and
rotation), were kept, thus obtaining the consensual results
for each individual. For CATA data a Multiple Factorial
Analysis was performed and again the consensual coordi-
nates for each assessor and for all the samples were kept. In
both cases, all the factors obtained were retained to cover
100% of the variability. Consensual configurations were
always compared for the two methods. The consensual coor-
dinates obtained in each method for the 8 fish species were
submitted to an Analysis of Variance, a Discriminant analysis
and a RV coefficient test for each sensory modality.
All statistical analyses were performed using XLSTAT soft-
ware (2014).
RESULTS AND DISCUSSION
The results and discussion are presented in two differenti-
ated parts. In the first section, the differences between the
CATA and FCP methods are discussed, with a focus on the
number of descriptors selected in general and by sensory
modality. The second section examines and compares the
discriminant ability of these two methods.
Attributes Selected
Both CATA questions and the FCP technique proved to be
effective in generating an important number of sensory
attributes for the products tested. As shown in Table 3,
trained panelists selected, on average, 22 terms to describe
the samples provided using the FCP technique, whereas the
average number of selected terms was 50 when dealing with
the CATA procedure. The differences observed regarding the
final number of retained attributes between both methods
are probably due to the greater ease and simplicity with
which panelists selected relevant terms when using the CATA
procedure, compared with the FCP test wherein panelists
had to generate their own descriptors. According to Budiu
(2014), showing panelists stimuli that they recognize
improves their ability to select and use terminology, whereas
panelists not prompted by stimuli must recall items from
scratch. This phenomenon can be explained by looking at
human memory processing. Neural activity can be activated
TABLE 3. FREQUENCY OF DIFFERENT SELECTED ATTRIBUTES IN
CHECK-ALL-THAT-APPLY (CATA) AND IN FREE CHOICE PROFILING
(FCP) METHODS FOR THE SAME EIGHT SPECIES
Sensory
modality Panelist ID CATA FCP
Appearance P1 18 5
P2 18 5
P3 14 6
P4 17 10
P5 15 8
P6 14 3
P7 17 9
P8 11 4
P9 14 10
Average 15 (30%)
CV 5 15.29%*
7 (32%)
CV539.69%*
Odor P1 9 5
P2 11 1
P3 13 6
P4 8 5
P5 9 4
P6 9 6
P7 13 5
P8 13 4
P9 9 4
Average 10 (20%)
CV 5 19.80%*
4 (18%)
CV 5 33.96%*
Flavor P1 14 1
P2 14 2
P3 14 5
P4 9 5
P5 10 6
P6 17 4
P7 11 9
P8 11 3
P9 11 9
Average 12 (24%)
CV 5 20.67%*
5 (23%)
CV 5 57.35%*
Texture P1 11 5
P2 14 6
P3 13 9
P4 14 6
P5 15 6
P6 11 5
P7 15 9
P8 12 2
P9 13 6
Average 13 (26%)
CV 5 11.72%*
6 (27%)
CV 5 35.36%*
Total Average 50 (100%) 22 (100%)
* CV, coefficient of variation (%) for each sensory modality and method.
CATA VS. FCP O. LAZO, A. CLARET and L. GUERRERO
168 Journal of Sensory Studies 31 (2016) 163–176 VC 2016 Wiley Periodicals, Inc.

in two ways: through recognition and through recall proc-
esses (Johnson 2010). In recognition activities, the informa-
tion to be analyzed is already available along with options to
choose from, and individuals select an answer from different
alternatives, thus mirroring the CATA method. In recall
processes, no answers are available to choose from and
respondents must generate terms from the own individual
memory (Cabeza et al. 1997, Krishnan et al. 1999), a process
that occurs also in FCP. When the recognition process
occurs, long-term memory is accessed and perception is
involved; however, when a recall process occurs, neural pat-
terns must be reactivated without any perceptual input. In
general, more brain areas are activated during recall than
during recognition processes because more activity is needed
to generate a response in recall processes. Because fewer
brain areas are activated by recognition than by recall, recog-
nition is indeed easier (Cabeza et al. 1997), thus, explaining
why attribute elicitation seems to be more straightforward in
CATA than in FCP (Johnson 2010). As stated by Nevid
(2012), an individual is more likely to remember the name
of the author of a book when seeing it in a multiple choice
list than when the individual has to write it from memory
on a blank paper.
The percentages of selected attributes in the four different
modalities, both in CATA and in FCP, were very similar
(30% and 32% for appearance, 20% and 18% in odor, 24%
and 23% in flavor and 26% and 27% in texture, respec-
tively). A balanced distribution of descriptors among sensory
modalities is expected when dealing with trained subjects
(Los�o et al. 2012). By contrast, nontrained assessors utilize
attributes that tend to favor those modalities that are easier
and more familiar for them (Hersleth et al. 2013).
Even though these two methods were performed with
similarly trained assessors, a noticeable variability among
individuals was observed with regard to the number of
selected attributes within the same sensory modality. This
finding is probably a consequence of personal factors (e.g.,
minimum and maximum of 1 and 9 attributes selected,
respectively, for flavor in the FCP method). As stated by
Fichet et al. (2011) well-trained assessors are susceptible to
variation over time and a lack of agreement among them-
selves despite their skills and expertise. The results having
the highest variability (based on the coefficient of variation)
within members of the same panel, both in CATA and FCP,
were found in the flavor modality (CV 5 20.67% and
CV 5 57.35%, respectively).
Odor judgments in descriptive analysis tend to be more
difficult than visual, textural or taste judgments (Lawless and
Heymann 2010). Successful odor identification depends on
commonly encountered substances, a connection between
the odor and its name, and assistance in odor name recall.
The absence of any one of these three components impedes
performance drastically (Cain 1979). However, in this study,
agreement over the number of elicited odor attributes was
higher than in corresponding flavor, and the existence of the
recalling process in the CATA method did not seem to
increase the relative number of selected descriptors. The exis-
tence of clear odor differences between fish samples assessed
could possibly have favored the total number of attributes
elicited. Varying degrees of personal skills in the recall pro-
cess might explain the highest discrepancy observed in the
number of selected attributes when using FCP compared
with CATA (expressed as coefficient of variation).
A total of 94 different sensory descriptors were selected
for both methods and the same eight fish species (Table 4),
from which 52% were selected simultaneously in both CATA
and FCP. These attributes may be more relevant in describ-
ing the products assessed, as these attributes are generated
through both recognition and recall processes. The observed
concordance between both methods can also be explained by
the fact that all assessors were trained together and by the
same panel leader. Consequently a similar vocabulary and
descriptive sensory knowledge should be expected (Stone
et al. 2012). The remaining 48% of elicited attributes corre-
sponded to those only being selected by the CATA method
(25.5%) or by the FCP method (22.3%). The difference
between the number of attributes that were selected with
both methods (49 out of 94) and the number of descriptors
selected only in the CATA method (24 out of 94) or in the
FCP method (21 out of 94) was quite different. This differ-
ence could be due to the personal variability among individ-
uals or, more likely, to the effect of the methodology applied.
With regard to the four sensory modalities for descriptors
shared by both methods, the most noticeable difference was
observed in the odor category, which presents less agreement
between panels and methods (only eight odor descriptors
were selected simultaneously in both methods, compared to
the 15 agreed on for appearance). As already mentioned,
odor description tends to be more complex than the other
sensory modalities. Accordingly, more odor attributes were
only selected in the CATA method when compared to those
only selected in FCP method (11 vs. 5), probably because in
the CATA method, panelists were provided with assistance
(i.e., a checklist) when recalling the possible descriptors to
choose. Evident differences between the two methods were
also observed in the appearance category. However, it is
important to remark that the majority of those descriptors
only selected in the FCP method (7 out of 9) corresponded
to a visual texture (dry, firm, gelatinous, greasy, juicy, rub-
bery and shrinkage).
The agreement between assessors for the descriptors in
common was higher for the CATA method. In all cases –
except for the earthy odor – the number of panelists that
agreed on the presence of a certain descriptor was lower in
the FCP method (see frequency values in brackets in Table
4). Similar values were only observed for sour odor and
O. LAZO, A. CLARET and L. GUERRERO CATA VS. FCP
Journal of Sensory Studies 31 (2016) 163–176 VC 2016 Wiley Periodicals, Inc. 169
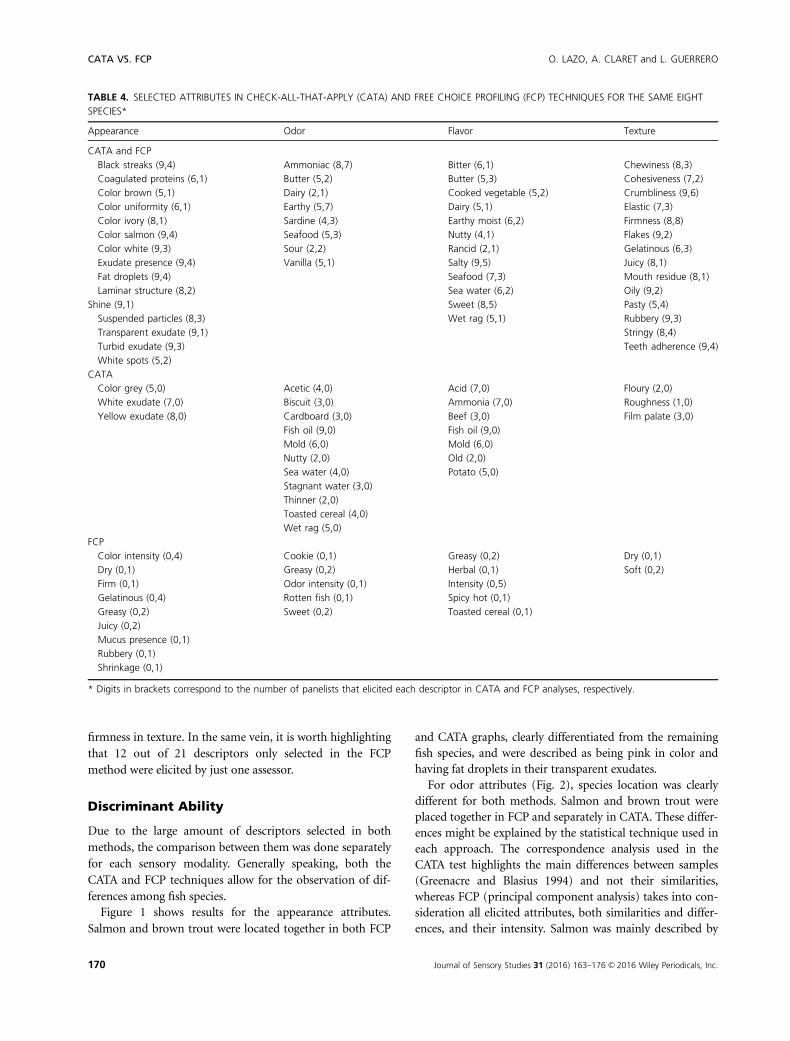
firmness in texture. In the same vein, it is worth highlighting
that 12 out of 21 descriptors only selected in the FCP
method were elicited by just one assessor.
Discriminant Ability
Due to the large amount of descriptors selected in both
methods, the comparison between them was done separately
for each sensory modality. Generally speaking, both the
CATA and FCP techniques allow for the observation of dif-
ferences among fish species.
Figure 1 shows results for the appearance attributes.
Salmon and brown trout were located together in both FCP
and CATA graphs, clearly differentiated from the remaining
fish species, and were described as being pink in color and
having fat droplets in their transparent exudates.
For odor attributes (Fig. 2), species location was clearly
different for both methods. Salmon and brown trout were
placed together in FCP and separately in CATA. These differ-
ences might be explained by the statistical technique used in
each approach. The correspondence analysis used in the
CATA test highlights the main differences between samples
(Greenacre and Blasius 1994) and not their similarities,
whereas FCP (principal component analysis) takes into con-
sideration all elicited attributes, both similarities and differ-
ences, and their intensity. Salmon was mainly described by
TABLE 4. SELECTED ATTRIBUTES IN CHECK-ALL-THAT-APPLY (CATA) AND FREE CHOICE PROFILING (FCP) TECHNIQUES FOR THE SAME EIGHT
SPECIES*
Appearance Odor Flavor Texture
CATA and FCP
Black streaks (9,4) Ammoniac (8,7) Bitter (6,1) Chewiness (8,3)
Coagulated proteins (6,1) Butter (5,2) Butter (5,3) Cohesiveness (7,2)
Color brown (5,1) Dairy (2,1) Cooked vegetable (5,2) Crumbliness (9,6)
Color uniformity (6,1) Earthy (5,7) Dairy (5,1) Elastic (7,3)
Color ivory (8,1) Sardine (4,3) Earthy moist (6,2) Firmness (8,8)
Color salmon (9,4) Seafood (5,3) Nutty (4,1) Flakes (9,2)
Color white (9,3) Sour (2,2) Rancid (2,1) Gelatinous (6,3)
Exudate presence (9,4) Vanilla (5,1) Salty (9,5) Juicy (8,1)
Fat droplets (9,4) Seafood (7,3) Mouth residue (8,1)
Laminar structure (8,2) Sea water (6,2) Oily (9,2)
Shine (9,1) Sweet (8,5) Pasty (5,4)
Suspended particles (8,3) Wet rag (5,1) Rubbery (9,3)
Transparent exudate (9,1) Stringy (8,4)
Turbid exudate (9,3) Teeth adherence (9,4)
White spots (5,2)
CATA
Color grey (5,0) Acetic (4,0) Acid (7,0) Floury (2,0)
White exudate (7,0) Biscuit (3,0) Ammonia (7,0) Roughness (1,0)
Yellow exudate (8,0) Cardboard (3,0) Beef (3,0) Film palate (3,0)
Fish oil (9,0) Fish oil (9,0)
Mold (6,0) Mold (6,0)
Nutty (2,0) Old (2,0)
Sea water (4,0) Potato (5,0)
Stagnant water (3,0)
Thinner (2,0)
Toasted cereal (4,0)
Wet rag (5,0)
FCP
Color intensity (0,4) Cookie (0,1) Greasy (0,2) Dry (0,1)
Dry (0,1) Greasy (0,2) Herbal (0,1) Soft (0,2)
Firm (0,1) Odor intensity (0,1) Intensity (0,5)
Gelatinous (0,4) Rotten fish (0,1) Spicy hot (0,1)
Greasy (0,2) Sweet (0,2) Toasted cereal (0,1)
Juicy (0,2)
Mucus presence (0,1)
Rubbery (0,1)
Shrinkage (0,1)
* Digits in brackets correspond to the number of panelists that elicited each descriptor in CATA and FCP analyses, respectively.
CATA VS. FCP O. LAZO, A. CLARET and L. GUERRERO
170 Journal of Sensory Studies 31 (2016) 163–176 VC 2016 Wiley Periodicals, Inc.

its fatty/oily character, properties shared with the Brown
trout as well, which might explain why they were located
together in the FCP map (both species had more similarities
than differences) and separated in the CATA map (the
earthy/mold descriptor was the main distinctive character
between both species). Halibut and Atlantic cod present
“ammoniac” as a common descriptor in CATA; however, in
FCP, Atlantic cod was less influenced by this attribute and
was placed consequently apart from halibut. Again, these dif-
ferences can be explained by methodological issues because
fish samples can have similar frequencies of elicitation for
some descriptors (i.e., a similar position on the CATA map)
and at the same time different intensity (i.e., different posi-
tions on the FCP map). Qualitative methods (CATA) seem to
provide less information and discriminant abilities than
quantitative data (FCP). CATA produces counts (frequencies)
FIG. 1. APPEARANCE SELECTED ATTRIBUTES FOR EIGHT FISH SPECIES FROM GENERALIZED PROCRUSTES ANALYSIS (GPA) PERFORMED ON FREE
CHOICE PROFILING (FCP) AND CORRESPONDENCE ANALYSIS PERFORMED ON CHECK-ALL-THAT-APPLY (CATA)
FIG. 2. ODOR SELECTED ATTRIBUTES FOR EIGHT FISH SPECIES FROM GENERALIZED PROCRUSTES ANALYSIS (GPA) PERFORMED ON FREE
CHOICE PROFILING (FCP) AND CORRESPONDENCE ANALYSIS PERFORMED ON CHECK-ALL-THAT-APPLY (CATA)
O. LAZO, A. CLARET and L. GUERRERO CATA VS. FCP
Journal of Sensory Studies 31 (2016) 163–176 VC 2016 Wiley Periodicals, Inc. 171

instead of scoring or intensities (Dooley et al. 2010) and as
stated by Valentin et al. (2012), nonparametric data has a
tendency to have less power than parametric data (FCP). In
any case, “ammoniac” was described as the main halibut
descriptor for odor in both methods. Finally, turbot was
described as having a “seafood odor” in both cases.
Flavor attributes are shown in Fig. 3. Atlantic cod and
Brown trout were among the most different species both in
CATA and in FCP. Again, halibut was well differentiated
with FCP procedures and not with the CATA method in
agreement with the statistical peculiarities of each method,
as previously mentioned. Brown trout was characterized by
“earthy mold” and “humid earth” flavors, as was observed
in odor attributes. However, descriptors used for Atlantic
cod were different in the two methods (“ammoniac” and
“wet rag” odors were reported in the CATA method and
FIG. 3. FLAVOR SELECTED ATTRIBUTES FOR EIGHT FISH SPECIES FROM GENERALIZED PROCRUSTES ANALYSIS (GPA) PERFORMED ON FREE
CHOICE PROFILING (FCP) AND CORRESPONDENCE ANALYSIS PERFORMED ON CHECK-ALL-THAT-APPLY (CATA)
FIG. 4. TEXTURE SELECTED ATTRIBUTES FOR EIGHT FISH SPECIES FROM GENERALIZED PROCRUSTES ANALYSIS (GPA) PERFORMED ON FREE
CHOICE PROFILING (FCP) AND CORRESPONDENCE ANALYSIS PERFORMED ON CHECK-ALL-THAT-APPLY (CATA)
CATA VS. FCP O. LAZO, A. CLARET and L. GUERRERO
172 Journal of Sensory Studies 31 (2016) 163–176 VC 2016 Wiley Periodicals, Inc.

“seafood” and “cooked vegetable” odors were reported in
the FCP method). Lastly, halibut was mainly described as
“salty.”
Figure 4 shows the sensory profile for textural attributes.
Halibut, brown trout, salmon and angler fish were all well
differentiated in both methods. Halibut was described as
“gelatinous” and “crumbly.”
Even though these figures (Figs. 1–4) provide a good
descriptive overview of the main attributes associated to
each sample and allow speculating about the respective dis-
criminant ability of each method, they do not provide strong
enough arguments to draw conclusions. Table 5 shows the
discriminant power of the two methods for each sensory
modality based on two different statistical approaches
(ANOVA and Discriminant analysis) as well as the closeness
between CATA and FCP data calculated by means of the RV
coefficient. According to the F value, FCP had higher dis-
criminant ability for appearance and odor, while CATA had
higher values for flavor and texture. However, the F value
does not allow knowing whether all the species were clearly
differentiated among each other or simply one of them dif-
fered to a great extent from the rest. This information can be
obtained from the discriminant analysis. The percentage of
samples correctly classified in their respective species (confu-
sion matrix) by means of the discriminant function was sim-
ilar for Texture descriptors (100%). However, CATA showed
higher discriminant ability than FCP for Odor and Flavor
modalities. In average, CATA had higher discriminant scores
than FCP for both the F value and the percentage of fish
samples correctly classified. These conclusions can also be
inferred from Fig. 5, where at first impression CATA seems
to discriminate better between fish species than FCP. How-
ever, some species such as meagre, pikeperch or turbot were
poorly differentiated by CATA compared to FCP data. Based
on all these results it seems difficult to conclude which
method performs better regarding the discriminant power.
FIG. 5. LOCATION OF THE SAMPLES IN THE FIRST TWO DIMENSIONS OF THE DISCRIMINANT ANALYSIS PERFORMED FOR THE FREE CHOICE
PROFILING AND CHECK-ALL-THAT-APPLY DATA. CONFIDENCE ELLIPSES WERE COMPUTED AT 5% OF ERROR
TABLE 5. DISCRIMINANT ABILITY OF CHECK-ALL-THAT-APPLY (CATA) AND FREE CHOICE PROFILING (FCP) METHOD
Sensory modality FCP‡ Discriminant analysis† CATA‡ Discriminant analysis† RV coefficient*
Appearance 8.042 100% 6.926 98.61% 0.765**
Odor 6.589 85.94% 6.478 95.83% 0.588 ns
Flavor 5.762 90.63% 7.410 100% 0.707***
Texture 7.790 100% 9.171 100% 0.602 ns
Average 7.046 94.14% 7.496 98.61%
* Ns, no significant (P> 0.05); ** P� 0.01; *** P� 0.001.
† Percentage of correctly classified fish samples in their corresponding species (confusion matrix).
‡ F values of ANOVA.
O. LAZO, A. CLARET and L. GUERRERO CATA VS. FCP
Journal of Sensory Studies 31 (2016) 163–176 VC 2016 Wiley Periodicals, Inc. 173

In any case, it is worth to mention that although CATA sim-
ply measures the frequencies of elicited attributes and FCP
measures not only their presence or absence but also the
magnitude of the differences in their intensity, both techni-
ques exhibited, at least, similar discriminant ability. Statisti-
cal test based on quantitative data (GPA) make use of more
information than those focusing on frequencies or binary
data (correspondence analysis) because real numbers pro-
vide more precise information than categories alone. Conse-
quently, parametric data tend to be more discriminating or
powerful than nonparametric data (O’Mahony 1986) con-
trary to what was observed in this study. In the same vein,
Kim et al. (2013) did not find higher discrimination between
products when comparing GPA (parametric data) vs. Corre-
spondence analysis (frequencies profile) with consumers.
The use of trained assessors for descriptive attribute elici-
tation, as described in this article, might increase the quality
of a descriptive profile by avoiding useless terms and, espe-
cially in the case of CATA, ensuring that the most relevant
descriptors are included. This fact is especially important
when explaining consumers’ preferences by means of sensory
data because small changes in the descriptive profile could
lead to important changes when drawing conclusions about
preference patterns (Gou et al. 1998). In addition, both tech-
niques can provide valuable information when selecting the
most appropriate descriptors to retain for a final descriptive
profile. Descriptors can be checked for their discriminant
ability without having to train the assessors specifically for
them and without having to develop standards (references)
before knowing whether they would be discriminant or not.
Generally speaking and based on the results obtained in
the present paper, CATA performed better than FCP in terms
of the descriptive ability and slightly better regarding the dis-
criminant capacity. According to the RV coefficients, both
methods provided similar product location in the multidi-
mensional space. This coefficient was significantly different
from zero for all the sensory modalities except for odor and
texture (Table 5). However, noticeable differences were
observed in product description (Figs. 1–4). These differen-
ces could be explained by the type of data obtained in the
different methods previously discussed in this article
(absence/presence in CATA vs. scoring in FCP) or by the
nature of the mental process involved in both methods.
One the main limitation of the present study is the lack of
a descriptive profile performed with a consensual method to
compare with both CATA and FCP. This consensual profile
would allow the assessment of the real improvement derived
from these two techniques. In addition, the use of different
number of fish species in both methods might have had a
contextual influence on the results shown. In any case, this
contextual effect cannot be estimated in this study and could
have been partially blocked by the high training and descrip-
tive experience of the assessors involved.
ACKNOWLEDGMENTS
This project has received funding from the European Union’s
Seventh Framework Programme for research, technological
development and demonstration (KBBE-2013-07 single
stage, GA 603121, DIVERSIFY).
REFERENCES
ADAMS, J., WILLIAMS, A., LANCASTER, B., and FOLEY, M.
2007. Advantages and uses of check-all-that-apply response
compared to traditional scaling of attributes for salty snacks.
7th Pangborn Sensory Science Symposium, 12–16 August 2007,
Minneapolis.
ARES, G., DAUBER, C., FERN�ANDEZ, E., GIM�ENEZ, A. and
VARELA P. 2014. Penalty analysis based on CATA questions to
identify drivers of liking and directions for product
reformulation. Food Qual. Pref. 32, 65–76.
ARES, G., ANT�UNEZ, L., BRUZZONE, F., VIDAL, L.,
GIM�ENEZ, A., PINEAU, B., BERESFORD, M.K., JIN, D.,
PAISLEY, A.G., CHHEANG, ET AL. 2015. Comparison of
sensory product profiles generated by trained assessors and
consumers using CATA questions: Four case studies with
complex and/or similar samples. Food Qual. Pref. 45, 75–86
BENCZE, A., KVALE, A., MØRKØRE, T., RØRVIK, K.A.,
HALLBJOØRN, S. and THOMASSEN, S. 1998. Process yield,
colour and sensory quality of smoked Atlantic salmon (Salmo
salar) in relation to raw material characteristics. Food Res. Int.
31, 601–609.
BRANDT, M.A., SKINNER, E.Z. and COLEMAN J.A., 1963.
Texture profile method. J. Food Sci. 28, 404–409.
BUDIU R. 2014. Memory Recognition and Recall in User
Interfaces. Retrieved from http://www.nngroup.com. Accessed
on 1 July 2014.
CABEZA, R., KAPUR, S., CRAIK, F.I.M., MCINTOSH, A.R.,
HOULE, S., and TULVING, E. 1997. Functional neuroanatomy
of recall and recognition: A petstudy of episodic memory. J.
Cognitive Neurosci. 9, 254–265.
CAIN, W.S. 1979. To know with the nose: Keys to odor
identification. Science 203, 467–470.
CAIRNCROSS, S.E. and SJOSTROM, L.B. 1950. Flavor profiles: A
new approach to flavor problems. Food Technol. 4, 308–331.
CAMPO, E., BALLESTER, J., LANGLOIS, J., DACREMONT, C.
and VALENTIN, D. 2010. Comparison of conventional
descriptive analysis and a citation frequency-based descriptive
method for odor profiling: An application to Burgundy Pinot
noir wines. Food Qual. Pref. 21, 44–55.
CARDENAS A., SVEINSDOTTIR, K., and MARTINSDOTTIR, E.
2007. Development of Quality Index Method (QIM) scheme
for fresh cod (Gadus morhua) fillets and application in shelf life
study. Food Control. 18, 352–358.
CARDINAL, M., CORNET, J., DONNAY-MORENO, C.,
GOUYGOU, J.P., BERG�E, J.P., ROCHA, E., SOARES, S.,
ESC�ORCIO, C., BORGES, P. and VALENTE, L.M.P. 2011.
Seasonal variation of physical, chemical and sensory
CATA VS. FCP O. LAZO, A. CLARET and L. GUERRERO
174 Journal of Sensory Studies 31 (2016) 163–176 VC 2016 Wiley Periodicals, Inc.
characteristics of sea bream (Sparus aurata) reared under
intensive conditions in Southern Europe. Food Control. 22,
574–585.
DELARUE, J. and SIEFFERMANN, JM. 2004. Sensory mapping
using flash profile. Comparison with a conventional descriptive
method for the evaluation of the flavor of fruit dairy products.
Food Qual. Pref. 15, 383–392.
DOOLEY, L., LEE, Y. and MEULLENET, JF. 2010. The application
of check-all-that-apply (CATA) consumer profiling to
preference mapping of vanilla ice cream and its comparison to
classical external preference mapping. Food Qual. Pref. 21,
394–40.
FARMER, L., MC CONNELL, J. and KILPATRICK, D. 2000.
Sensory characteristics of farmed and wild Atlantic salmon.
Aquaculture 187, 105–125
FICHET, B., PICCOLO, D., VERDE, R. and VICHI, M. 2011.
Classification and multivariate analysis for complex data
structures studies in classification, data analysis, and knowledge
organization. pp 335–342. Springer- Verlag, Berlin.
GIACALONE, D., BOM FROST, M., BREDIE, W., PINEAU, B.,
HUNTER, D., PAISLEY, A., BERESFORD, M. and JAEGER, S.
2015. Situational appropriateness of beer is influenced by
product familiarity. Food Qual. Pref. 39, 16–27.
GIOGIOS, K., GRIGORAKIS, K. and KALOGEROPOULOS, N.
2013. Organoleptic and chemical quality of farmed meagre
(Argyrosomus regius) as affected by size. Food. Chem. 141,
3153–3159.
GOU, P., GUERRERO, L. and ROMERO, A. 1998. The effect of
panel selection and training on external preference mapping
using a low number of samples. Food Sci. Tech. Int. 4, 85–90.
GOWER, J.C. 1975. Generalized procrustes analysis.
Psychometrika 40, 33–50.
GRANITTO, P.M., BIASIOLI, F., ENDRIZZI, I. and GASPERI, F.
2008. Discriminant models based on sensory evaluations:
Single assessors versus panel average. Food Qual. Pref. 19,
589–595.
GREENACRE, M., and BLASIUS, J. (1994). Correspondence Analysis
in the Social Sciences. Academic Press Inc. San Diego CA.
GUERRERO, L. 1996. M�etodos descriptivos de an�alisis sensorial.
II. Perfiles de libre elecci�on real y simulada y perfiles de
Consumidores. Alimentaci�on, Equipos Y Tecnolog�ıa. 15,
163–166.
GUERRERO L., ROMERO, A. and TOUS, J. 2001. Importance of
generalized procrustes analysis in sensory characterization of
virgin olive oil. Food Qual. Pref. 12, 515–520.
GUERRERO, L., CLARET, A., VERBEKE, W., ENDERLI, G.,
ZAKOWSKA-BIEMANS, S., VANHONACKER, F.,
ISSANCHOU, S., SAJDAKOWSKA, M., SIGNE, B.,
SCALVEDI, L., ET AL. 2010. Perception of traditional food
products in six European regions using free word association.
Food Qual. Pref. 21, 225–233.
HERSLETH, M., NÆS, T., GUERRERO, L., CLARET, A.,
RECCHIA, AM., DINNELLA, C., and MONTELEONE, E.
2013. Consumer perception of dry-cured ham – across-cultural
study in Italy, Norway and Spain. J. Sens. Stud. 28, 450–466.
HERN�ANDEZ, M.D, L�OPEZ, M.B., �ALVAREZ, A.,
FERRANDINI, E., GARC�IA GARC�IA, B. and GARRIDO, M.D.
2009. Sensory, physical, chemical and microbiological changes
in aquacultured meagre (Argyrosomus regius) fillets during ice
storage. Food Chem. 114, 237–245.
ISO. ISO Standard 8589:2007 Sensory analysis – General guidance
for the design of test rooms, 2007.
JACK, F. and PIGGOTT, JR. 1991. Free choice profiling in
consumer research. Food Qual Pref. 3, 129–134.
JOHNSON, J. 2010. Designing with the Mind in Mind Simple
Guide to Understanding User Interface Design Rules, Chap 9, pp.
109–117, 2nd Ed, Elsevier, Waltham, USA.
KIM, I., KIM, M., VAN DE VELDEN, M. and LEE, H. 2013.
Psychological positioning of bottled tea products: A
comparison between two kansei profiling techniques. Food Sci.
Biotechnol. 22, 257–268.
KRISHNAN, H.S. 1999. Memory measures for pretesting
advertisements: An integrative conceptual framework and a
diagnostic template. J Consum. Psychol. 8, 1–37.
LAWLESS, H.T. 1999. Descriptive analysis of complex odors:
reality, model or illusion? Food Qual. Pref. 10, 325–332.
LAWLESS, H.T. and HEYMANN, H. 2010. Sensory Evaluation of
Food, Chap. 10, pp. 240–246, 2nd Ed., Springer, New York, NY.
LEA, P., NÆS., T. and RODBOTTEN, M. 2001. Analysis of
Variance for Sensory Data. Wiley, New York.
LOS�O, V., GERE, A. GY€OREY, A., K�OKAI, Z. and SIPOS, L. 2012.
Comparison of the performance of a trained and an untrained
sensory panel on sweetcorn varieties with the PanelCheck
software. Applied Studies in Agribusiness and Commerce 1-2,
77–83.
MACFIE, H., BRATCHELL, N., GREENHOFF, K. and VALLIS,
L.V. 1989. Designs to balance the effect of order of presentation
and first-order carry-over effects in hall tests. J. Sens Stud. 4,
129–148.
MARTENS, H. and MARTENS, M. 2001. Multivariate Analysis of
Quality: An Introduction. Wiley, New York.
MEILGAARD, M.C., CIVILLE, G.V. and CARR, B.T. (1991).
Sensory Evaluation Techniques, 2nd Ed., CRC Press, Boca
Raton, FL.
MEULLENET, J.F., XIONG, R. and FINDLAY, C. 2008a.
Multivariate and Probabilistic Analyses of Sensory Science
Problems. p. 45. IFT press Blackwell publishing, Ames, Iowa.
MEULLENET, J. F., LEE, Y., and DOOLEY, L. 2008b. The
application of check-all-that-apply consumer profiling to
preference mapping of vanilla ice cream and its comparison to
classical external preference mapping. The 9th Sensometric
Meeting. The Sensometrics Society, St. Catherines, Canada.
MONTOUTO, M., FERN�ANDEZ F., V�AZQUEZ, M.L. and
ROMERO, M.A. 2002. Development of a sensory profile for
the specific denomination “Galician potato.” Food Qual. Pref.
13, 99–106.
MOSKOWITZ, H., MU~NOZ, A. and GACULA, M. 2003.
Viewpoints and Controversies in Sensory Science and Consumer
Product Testing. Chapter 18, pp 313. Food and Nutrition Press
Inc. Connecticut, USA.
O. LAZO, A. CLARET and L. GUERRERO CATA VS. FCP
Journal of Sensory Studies 31 (2016) 163–176 VC 2016 Wiley Periodicals, Inc. 175

MURRAY, J.M., DELAHUNTY C.M., and BAXTER, I.A.
2001.Descriptive sensory analysis: Past, present and future.
Food Res. Int. 34, 461–471.
NEVID, J. Psychology: Concepts and Applications. 2012. 4th Ed.,
Chapter 6, p. 236, Cengage Learning, Wadsworth, USA.
OLSSON, G., OLSEN, R., CARLEH€OGA, M. and OFSTAD, R.
2003. Seasonal variations in chemical and sensory
characteristics of farmed and wild Atlantic halibut
(Hippoglossus hippoglossus). Aquaculture 217, 191–205
O’MAHONY, M. 1986. Sensory Evaluation of Food: Statistical
Methods and Procedures. New York: Marcel Dekker, Inc.,
New York.
ORBAN, F., SINESIO, F. and PAOLETTI, F. 1997. The functional
properties of the proteins, texture and the sensory characteristics
of frozen sea bream fillets (Sparus aurata) from different farming
systems. LWT Food Sci. Tech. 30, 214–217.
PERRIN, L. and PAG�ES, J. 2009. Construction of a product space
from the ultra-flash profiling method: Application to 10 red
wines from the Loire Valley. J. Sens. Stud. 24, 372–395.
PIGGOTT, J.R. and WATSON, M.P. 1992. A comparison of free-
choice profiling and the Repertory Grid method in the flavor
profiling of cider. J. Sens Stud. 7, 133–145.
REINBACH, H., GIACALONE, D., MACHADO, L., BREDIE, W.
and BOM, M. 2014. Comparison of three sensory profiling
methods based on consumer USA perception: CATA, CATA
with intensity and Napping. Food Qual. Pref. 32, 160–166.
RØDBOTTEN, M., LEA, P. and UELAND, O. 2009. Quality of
raw salmon fillet as a predictor of cooked salmon quality. Food
Qual. Pref. 20, 13–23.
SIEFFERMANN, J.M. 2000. Le profil flash – Un outil rapide et
innovant d’�evaluation sensorielle descriptive. In AGORAL 2000,
XIIemes rencontres “L’innovation: de l’id�ee au success.”
pp. 335–340, Montpellier, France.
STAMPANONI, C. 1994. The use of standardized flavor languages
and quantitative flavor profiling techniques for flavored dairy
products J. Sens. Stud. 9, 383–400.
STAMPANONI, C., PICCINALI, P. and SIGRIST, S. 1996. The
influence of fat, sugar and non-fat milk solids on selected taste,
flavor and texture parameters of a vanilla ice-cream. Food
QualPref, 7, 69–79.
STEJSKAL, V., VEJSADA, P., CEPAK, M., �SPI�CKA, J., VACHA, F.,
KOURIL, J. and POLICAR, T. 2011. Sensory and textural
attributes and fatty acid profiles of fillets of extensively and
intensively farmed Eurasian perch (Perca fluviatilis L.) Food
Chem. 129, 1054–1059.
STOLZENBACH, S., BREDIE, W. and BYRNE, D. 2013.
Consumer concepts in new product development of local
foods: Traditional versus novel honeys. Food Res. Int. 52, 144–
152
STONE, H., SIDEL, J., OLIVER, S., WOOSLEY, A. and
SINGLETON, R. C. 1974. Sensory evaluation by descriptive
analysis. Food Tech. 28, 24–34.
STONE, H., BLEIBAUM, R. and THOMAS, H. 2012.
Sensory Evaluation Practices, 4th Ed., Academic Press, San
Diego, CA.
SVEINSDOTTIR, K., MARTINSD�OTTIR, E., GREEN-
PETERSEN, D., HYLDIG, G., SCHELVIS, R. and
DELAHUNTY, C. 2009. Sensory characteristics of different cod
products related to consumer preferences and attitudes. Food
Qual. Pref. 20, 120–132.
SVEINSDOTTIR, K., MARTINSDOTTIR, E., THORSDOTTIR,
F., SCHELVIS-SMIT, A.A.M., KOLE, A. and THORSDOTTIR,
I. 2010. Evaluation of farmed cod products by a trained sensory
panel and consumers in different test settings. J Sens. Stud. 25,
280–293.
TUORILA, H., MEISELMAN, H., CARDELLO, A. and LESHER,
L. 1998. Effect of expectations and the definition of product
category on the acceptance of unfamiliar foods Food Qual.
Pref. 9, 421–430.
VALENTIN, D., CHOLLET, S., LELI�EVRE, M. and ABDI, H.
2012. Quick and dirty but still pretty good: A review of new
descriptive methods in food science. Int J Food Sci. Tech. 47,
1563–1578.
VARELA, P. and ARES, G. 2012. Sensory profiling, the blurred
line between sensory and consumer science. A review of novel
methods for product characterization. Food Res. Int. 48, 893–
908.
VEINAND, B., GODEFROY, C., ADAM, C. and DELARUE, J.
2011. Highlight of important product characteristics for
consumers. Highlight of important product characteristics
for consumers. Comparison of three sensory descriptive
methods performed by consumers. Food Qual. Pref. 22, 474–
485.
VEISETH-KENT, E., HILDRUM, K., OFSTAD, R., RØRA, M.,
LEA, P. and RØDBOTTEN, M. 2010. The effect of postmortem
processing treatments on quality attributes of raw Atlantic
salmon (Salmo salar) measured by sensory and instrumental
methods. Food Chem. 121, 275–281.
WALKER, G. Sensory methods for food analysis. University of
Teeside. Retrieved from http://sst-web.tees.ac.uk/ (accessed
December 6, 2004).
WILLIAMS, A.A. and LANGRON, S.P. 1984. The use of Free-
choice Profiling for the Evaluation of Commercial Ports. J. Sci.
Food Agric. 35, 558–568.
CATA VS. FCP O. LAZO, A. CLARET and L. GUERRERO
176 Journal of Sensory Studies 31 (2016) 163–176 VC 2016 Wiley Periodicals, Inc.