
A comparison of galvanic skin conductance and skin ... · 1 Gerrett, N., Bernard Redortier, Thomas...
26
•
Transcript of A comparison of galvanic skin conductance and skin ... · 1 Gerrett, N., Bernard Redortier, Thomas...

Loughborough UniversityInstitutional Repository
A comparison of galvanicskin conductance and skinwettedness as indicators ofthermal discomfort during
moderate and high metabolicrates
This item was submitted to Loughborough University's Institutional Repositoryby the/an author.
Citation: GERRETT, N. ... et al, 2013. A comparison of galvanic skin conduc-tance and skin wettedness as indicators of thermal discomfort during moderateand high metabolic rates. Journal of Thermal Biology, 38 (8), pp. 530 - 538
Additional Information:
• This article was published in the serial, Journal of ThermalBiology [ c© Elsevier]. The definitive version is available at:http://dx.doi.org/10.1016/j.jtherbio.2013.09.003
Metadata Record: https://dspace.lboro.ac.uk/2134/13534
Version: Accepted for publication
Publisher: c© Elsevier
Please cite the published version.

This item was submitted to Loughborough’s Institutional Repository (https://dspace.lboro.ac.uk/) by the author and is made available under the
following Creative Commons Licence conditions.
For the full text of this licence, please go to: http://creativecommons.org/licenses/by-nc-nd/2.5/
1
Gerrett, N., Bernard Redortier, Thomas Voelcker, George Havenith, A comparison of galvanic skin
conductance and skin wettedness as indicators of thermal discomfort during moderate and high
metabolic rates, Journal of Thermal Biology, Volume 38, Issue 8, December 2013, Pages 530-538,
ISSN 0306-4565, http://dx.doi.org/10.1016/j.jtherbio.2013.09.003.
A comparison of galvanic skin conductance and skin wettedness as indicators of thermal discomfort during moderate and high metabolic rates
Nicola Gerrett1, 3, Bernard Redortier 2, Thomas Voelcker2, and George Havenith 1
1Environmental Ergonomics Research Centre, Design School, Loughborough University, Loughborough, Leicestershire, LE113TU, UK.
2Oxylane Research, Decathlon Campus, Villeneuve d’Ascq, Lille, France.
3 Institute of Sport and Exercise Science, University of Worcester, Henwick Grove, Worcester, WR26AJ
Address for correspondence George Havenith, Loughborough Design School, Environmental Ergonomics Research Centre, Loughborough University, Loughborough, Leicestershire, LE11 3TU. UK.
Phone: +44 (0)1509 223031
Fax: +44 (0)1509 223014
Email: [email protected]

2
Abstract: The relationship between local thermal comfort, local skin wettedness (wlocal) and local galvanic skin conductance (GSC) in 4 body segments during two different exercise intensities was compared in 10 males. In a balanced order, participants walked at 35% VO2max for 45 minutes (WALK) (29.0 ± 1.9°C, 29.8 ± 3.6% RH, no wind) in one test and in a separate test ran at 70% VO2max for 45 minutes (RUN) (26.2 ± 2.1°C, 31.1 ± 7.0% RH, no wind). During both tests, participants wore a loose fitting 100% polyester long sleeve top and trouser ensemble with a low resistance to heat and vapour transfer (total thermal resistance of 0.154 m2·K·W-1 and total water vapour resistance of 35.9 m2·Pa·W-1). wlocal, change from baseline in GSC (ΔGSC) and local thermal comfort were recorded every 5 minutes. The results suggest that both wlocal and ΔGSC are strong predictors of thermal comfort during the WALK when sweat production is low and thermal discomfort minimal (r2>0.78 and r2>0.71, respectively). Interestingly, during the RUN wlocal plateaued at ~0.6-0.8 due to the high sweat production, whilst ΔGSC gradually increased throughout the experiment. ΔGSC had a similar relationship with thermal comfort to wlocal during the RUN (r2>0.95 and r2>0.94, respectively). Despite the strength of these relationships, the ability of wlocal to predict local thermal comfort accurately dramatically reduces in the exponential part of the curve. In a situation of uncompensated heat stress such as high metabolic rate in hot climate, where sweat production is high, ΔGSC shows to be a better predictor of local thermal comfort than wlocal. The wlocal data shows regional differences in the threshold which triggers local discomfort during the
WALK than RUN; lower values are found for upper arms (0.22 ± 0.03 and 0.28 ±0.22) and upper legs (0.22 ±
0.11 and 0.22 ±0.10), higher values for upper back (0.30 ± 0.12and 0.36 ±0.10) and chest (0.27 ± 0.10and
0.39 ±0.32), respectively. However, no regional differences in the threshold of discomfort are found in the
∆GSC data. Instead, the data suggests that the degree of discomfort experienced appears to be related to the amount of sweat within and around the skin (as indirectly measured by ΔGSC) at each body site.
Key words: Regional, thermal discomfort, skin wettedness, galvanic skin conductance.
Abbreviations:
w; skin wettedness
wlocal; local skin wettedness
wbody; whole body skin wettedness
GSC; Galvanic skin conductance
∆GSC; change from baseline for galvanic skin conductance
1. Introduction
Skin wettedness (w) was first introduced by Gagge (1937) and is defined as the ratio between the
actual evaporative heat loss and the maximum possible evaporative heat loss for a given
environmental condition (Havenith et al. 2002). A closely linked definition is that it represents the
fraction of total body surface area covered with sweat. As a dimensionless (nd) variable, it is usually
expressed as a decimal fraction, with 1.00 representing the upper limit when sweat covers the entire
skin surface and 0.06 representing the minimal value due to insensible perspiration (Nishi and Gagge,
1977). Since its introduction many researchers have reported a strong influence of whole body skin
wettedness (wbody) on thermal comfort (Gagge et al. 1969; Nishi and Gagge, 1977; Winslow et al.
1939). More recently, research has investigated regional differences in sensitivity to local skin
wettedness (wlocal) using specialised clothing garments comprised of impermeable and permeable

3
material to manipulate wlocal (Fukazawa and Havenith, 2009; Umbach, 1982). Although this technique
is useful for determining regional sensitivity per se, in real conditions the natural distribution of sweat
production and skin temperature (Tsk) will be prevalent. Therefore to provide clothing manufacturers
information on regional sensitivity to w with ecological validity, it would be more appropriate to
assess the natural distribution of physiological and perceptual responses. Lee et al. (2011) recently
addressed this and developed a qualitative method based on subjective perceptions to predict locally
wet skin in uniform clothing. During a rest-exercise protocol, participants marked areas on a body
map that felt wet due to sweat. Areas initially marked were the ‘first perceived wetted region’ and the
most frequently marked regions were named the ‘most wetted region’. They found the chest, forehead
and upper back were most frequently reported as the first wetted region. These areas are known to
produce large volumes of sweat in comparison to other locations (Cotter et al. 1995; Kuno, 1956;
Smith and Havenith, 2011, 2012). This contrasts to Fukazawa and Havenith (2009), who through
manipulation of wlocal in individual body areas determined local humidity sensitivities and found the
extremities to have a lower wlocal threshold (i.e. more sensitive) than areas of the torso. The methods
used may explain the differences observed between the two studies but by combining the quantitative
methods of Fukazawa and Havenith (2009) and the ecologically valid methods used by Lee et al.
(2011) would be useful in order to determine regional differences in thermal comfort when
distribution of wlocal is natural.
Fukazawa and Havenith (2009) focused upon the transition from ‘comfortable’ to ‘uncomfortable’
and therefore the level of discomfort experienced at their threshold was minimal. Higher levels of
thermal discomfort have rarely been explored and neither has its relationship with wlocal. Doherty and
Arens, (1988) noted that the ability to predict w using either the Pierce two-node model or Fanger’s
comfort equation was significantly reduced at high exercise intensity in comparison to rest, low and
moderate exercise intensities. Errors in predicting w will result in inaccurate predictions of thermal
discomfort as exercise intensity increases. Interestingly, Lee et al. (2011) reported the diminishing
role of w during heavy sweating and claimed that perceived skin wettedness was valid for predicting
thermal discomfort during rest or light intensity exercise rather than conditions where sweat
production is high. In such conditions wlocal is likely to reach ceiling values (1.0). If thermal
discomfort worsens, whilst w plateaus, another factor must be influencing thermal discomfort or an
alternative measurement is required to aid its prediction.
It has previously been stated that the epidermis swells due to the presence of sweat, which may
stimulate the skins tactile mechanoreceptors and contribute towards discomfort (Berglund, 1995;
Berglund and Cunningham, 1986). A parameter which monitors the process of sweat production more
closely, such as sweat gland activity, skin hydration and surface sweat may have a stronger correlation
with perceptual responses than surface sweat measurements alone, as indicated wlocal. The

4
measurement chosen in the present study is galvanic skin conductance (GSC), which reflects the
ability of the skin to transmit an electrical current that is enhanced by the presence of sweat (Edelberg,
1972). GSC is associated with the autonomic nervous system due to the activity of sweat glands in
the response to emotional and thermoregulatory sweating (Tarchanoff, 1890). Darrow (1964) found
an increase in GSC before sweat was present on the skin surface thus reflecting pre-secretory sweat
gland activity. It has frequently been used to assess precursor sweat in response to various
psychological stimuli (Machado-Moreira et al. 2009) and thermal stimuli (Caldwell et al. 2011).
Additionally, Thomas and Korr (1957) found that GSC correlated linearly with increasing and
decreasing number of active sweat glands (r2=0.81). This was later supported by Fowles (1986) who
established that changes in GSC depend upon how much sweat is delivered to the duct and on the
number of sweat glands activated. These findings suggest that GSC reflects both intradermal sweat
and that on the skin surface in contrast to wlocal, which only reflects surface sweat. As a result it is
hypothesised that GSC may be a better predictor of thermal discomfort during high levels of sweat
production and when higher levels of discomfort exist. This is particularly relevant when exercising at
higher metabolic rates and/or when exercising in warm-hot conditions where sweat production will be
high.
Due to the uncertainties of wlocal to predict thermal discomfort at higher metabolic rates and in order to
gain a better understanding of the factors that drive thermal discomfort during such conditions, the
present study aims to compare the relation between thermal comfort and wlocal and GSC during two
different exercise intensities. Due to the reported regional differences in sweat production (Cotter et
al. 1995; Kuno, 1956; Smith and Havenith, 2011, 2012) and perceptual responses (Fukazawa and
Havenith, 2009; Lee et al. 2011) the regional differences in sensitivity to sweat will also be explored
using the two different variables.
2. Methods
2.1. Participants
Ten British males (height 182.1 ± 7.5cm, body mass 74.8 ± 8.5 kg, age 23.0 ± 2.8 yrs, VO2max 52.9 ±
5.2 ml·kg-1·min-1) were recruited from the staff and student population of Loughborough University.
The selection criteria included only Caucasian males, aged between 18-45 years to reduce any
systemic errors due to ethnic or age-related differences in thermoregulatory responses.
2.2. Experimental design
The aim of the investigation was to monitor the physiological responses including wlocal, skin
temperature (Tsk), core temperature (Tc), body temperature (Tb), GSC and perception of local and
whole body thermal comfort. The relationship between local thermal comfort, wlocal and GSC was

5
investigated during two different conditions specifically designed to produce two different levels of
sweat production (i.e. high and low) and discomfort levels. For this purpose, each participant
completed a pre-test session to assess fitness level and two main tests on separate days (with a
minimum of 1 day separating tests) in a balanced order. The experiment was treated as a repeated
measures design.
2.3. Experimental protocol
During the first visit, participants’ stature and body mass were recorded followed by a submaximal
fitness test based on the Åstrand-Rhyming method (ACSM, 2006). The test comprised of four
progressive exercise stages on a treadmill (h/p/cosmos mercury 4.0 h/p/cosmos sports and medical
gmbh, Nussdorf, Traunstein, Germany) each lasting 5 minutes. Heart rate (Polar Electro Oy, Kemple,
Finland) was recorded during the last minute of each stage. Estimation of VO2max was based upon the
linear relationship between heart rate and work rate based upon treadmill speed and angle (Epstein et
al. 1987) and data extrapolated to their age predicted heart rate max.
For the main tests, pre and post-test nude mass were recorded. Participants self-inserted a rectal
thermistor (Grant Instrument Ltd, Cambridge, UK) 10 cm beyond the anal sphincter. Eight skin
thermistors (Grant Instrument Ltd, Cambridge, UK) were attached to the skin using 3MTM
TransporeTM surgical tape, (3 MTM United Kingdom PLC). Eight humidity sensors (MSR electronics
GmbH, Switzerland) were fixed to a holder and glued to the skin using Collodion U.S.P (Mavidon
Medical Products, USA) to estimate wlocal. Sensors were located ~2mm from the skin at the following
locations; chest, abdomen, upper back, lower back, upper arm, lower arm, upper leg and lower leg.
Four pairs of pre-gelled electrodes were attached to the chest, upper back, upper arm and thigh for the
measurement of GSC using MP35 Biopac Systems (MP35 Biopac Systems, Goleta, California, USA),
set to record at 35 Hz. Once equipped participants dressed in a standard clothing ensemble consisting
of a 100% polyester long sleeve top and trouser ensemble with loose fit and a high permeability to
favour ventilation, resulting in low resistance to heat and vapour transfer (total thermal resistance of
0.154 m2·K·W-1 and total water vapour resistance of 35.9 m2·Pa·W-1) tested on a standing thermal
manikin (Newton, Measurement Technology Northwest, USA).
Once dressed and fully equipped the participant sat at rest in a thermoneutral environment (mean ±
SD; 19.8 ± 1.6°C, 40.6 ± 4.1% RH) for 15 minutes to allow physiological responses to stabilise.
During rest, participants were familiarised with the sensation scales and allowed to practice rating
their sensations (see below for details). Following the rest period, participants entered the
environmental chamber where they began exercising. For the WALK condition, participants walked
for 45 minutes at 35% VO2max in a chamber at 29.0 ± 1.9°C, 29.8 ± 3.6% RH, with no wind. During

6
the RUN, participants walked at 35% VO2max for 5 minutes, followed immediately by a run at 70%
VO2max for 40 minutes in a chamber at 26.2 ± 2.1°C, 31.1 ± 7.0% RH, with no wind. Participants
could drink ad libitum.
2.4. Measurement and Calculations
Body mass was measured at the beginning and end of each experimental session as well as fluid
intake to determine gross sweat loss (GSL) in grams (g) and grams per surface area (SA) per hour
(g·m2·h-1).
Mean skin temperature and wbody was calculated using the following equation based on eight
measurement sites (as used by Umbach, 1982):
Mean values = (chest*0.14) + (abdomen*0.08) + (upper back0.11) + (lower back*0.11) +
(thigh*0.2) + (calf*0.15) + (upper arm*0.12) + (forearm*0.09)
Local skin wettedness is defined as the ratio between the maximum evaporation and the actual
evaporation for a given environment (Havenith et al. 2002). It is measured and estimated using the
same techniques as described by Fukazawa and Havenith (2009). Local skin wettedness (wlocal) was
measured using humidity sensors as described earlier, which were located 2mm from the skin surface.
Local skin wettedness (wlocal) was calculated using the following equation:
,
( )
( ) sk a
localsk s a
P Pw
P P
Where Psk is the water vapour pressure at the skin measured using humidity sensors and was
calculated using the following equation:
,*100sk sk s
RHP P
Psk,s is the saturated water vapour pressure at the skin calculated from skin temperature using the
following equation:
4030.183
23.513235
,skT
sk sP e

7
Pa is the water vapour pressure of ambient air, which is calculated using the same equations above
with ambient values replacing skin values for RH and temperature. e refers to an exponential
function.
In order to reduce errors in the measurement of GSC and compare within and between individuals
during both conditions, GSC was standardised as a change from baseline (∆GSC) (Wilder, 1962). The
baseline value was defined as the lowest GSC value recorded during the 15 minute stabilisation period
in a thermoneutral environment. Data from pilot tests confirmed the reduced variation within and
between individuals over numerous tests by expressing it as ∆GSC. Mean ∆GSC was averaged over
the four sites (chest, upper back, upper arm and upper leg).
All physiological data was measured and recorded continuously (recorded at 10 seconds intervals)
during the test with 5-minute averages calculated.
2.5. Perceptual responses
Participants rated their thermal comfort on the following 6-point Likert scale with intermediary
values; 0 = comfortable, -2 = slightly uncomfortable, -4 = uncomfortable, -6 = very uncomfortable
(modified version based on Gagge et al. 1967). Participants were introduced to the scale and
instructed how to interpret and score them. They scored each sensation for their whole body and each
local body region (chest, upper back, upper arms, and upper legs) during the last 5 minutes of rest and
at 5 minute intervals during exercise. Regional sensitivity to wlocal and ΔGSC was defined by two
factors: the threshold of discomfort and the intensity of discomfort experienced. The threshold of
discomfort was defined as the wlocal and ΔGSC that corresponds with a comfort vote of -1. The
intensity of discomfort experienced was defined as the highest discomfort vote scored.
2.6. Data analysis
Statistical analysis was conducted using Statistical Package (SPSS) version 18.0. Analysis of the
main effect of condition, location and time were analysed using three-way repeated measures
ANOVA. Post hoc comparisons using Bonferroni correction were performed to analyse individual
differences. In some instances, differences between conditions were analysed using Paired samples t-
test and corrected for multiple comparisons. Pearson’s correlation analysis was performed to assess
the relationship between local thermal comfort and each physiological parameter (wlocal, ΔGSC, Tsk
and Tc). Where data were observed to have non-linear relations (scatterplots), they were first
transformed using appropriate transformations to produce an approximate linear relationship and
subsequently they were analysed with the standard linear Pearson correlation to assess the
relationship. Unless otherwise stated, all measurements are means with standard deviations (± S.D)
and significance is defined as p<0.05.

8
3. Results
3.1. Participants
Participant 7 was deemed as a ‘non responder’ as local and whole body thermal comfort was
maintained at the same value throughout each test and was subsequently removed from the analysis.
All data is expressed without participant 7.
3.2. Experimental design
No significant differences were found in Tc at rest between the WALK (37.0 ± 0.3°C) and RUN (37.1
± 0.3°C) (p>0.05). However, the increase in Tc from baseline to the end of the experiment was
significantly less for the WALK (37.2 ± 0.3°C) than the RUN (38.1 ± 0.4°C, p<0.001). Alongside
this, GSL was significantly higher at the end of RUN compared to the WALK (516.7 ± 132.8 and
271.5 ± 90.5 g·m-2·hr-1, respectively, p<0.001).
Table 1 lists the mean (±SD) values at the end of each condition (WALK and RUN) for wlocal, ∆GSC
and local Tsk. According to three way repeated measures ANOVA, there was a significant effect of
condition on wlocal and ∆GSC (p<0.05) but not for local Tsk as it was similar between conditions. A
significant effect of time was found on all three parameters as they increased from rest to the end of
exercise. No significant effect of location was observed for ∆GSC. A significant effect of location was
found for wlocal and pairwise comparison revealed that the upper back was significantly higher than all
other locations and the upper legs were significantly lower than all locations (p<0.05) The chest was
also significantly higher than the upper arms (p<0.05). A significant effect of location (p<0.001) was
observed for local Tsk and pairwise comparison revealed the upper legs were significantly cooler than
the chest and upper back (p<0.05).
3.3. The relationship between thermal comfort, wlocal and ΔGSC
Figure 1 and Figure 2 illustrate the relationships between local thermal comfort and wlocal and ΔGSC
(respectively) during both conditions. The strength of the relationships (r2) between thermal comfort
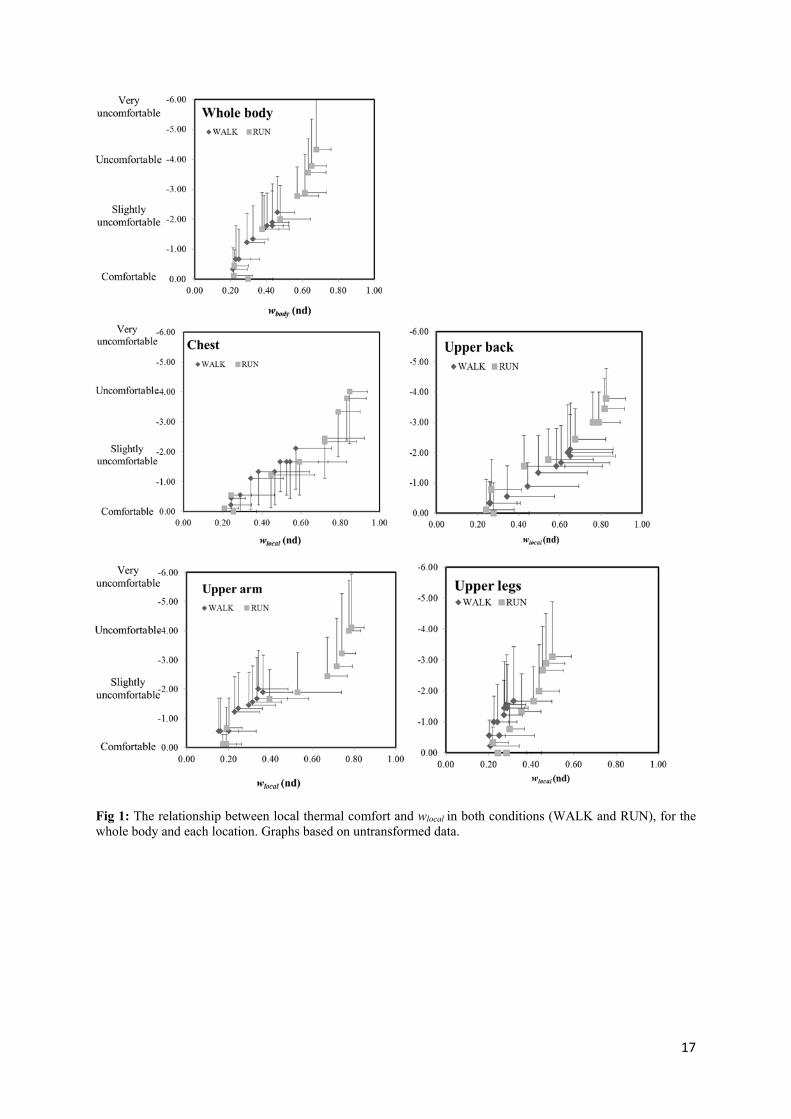
and each variable are displayed in Table 2. In Figure 1, during the WALK, a strong linear
relationship exists between local thermal comfort and wlocal (r2>0.78, p<0.001). However, during the
RUN, local thermal comfort has an exponential relationship with wlocal and therefore was transformed
(using an exponential function) for further analysis and the result indicated strong significant
relationships (r2>0.94, p<0.001). The relationship between thermal comfort and ∆GSC was curvilinear
for both conditions (Figure 2) and was transformed (square root) prior to analysis. The strength of
these relationships improves from the WALK (r2>0.71, p<0.001) to the RUN (r2>0.95, p<0.001) at
each location. Local thermal comfort did not consistently have good relationships with local Tsk and
where relationships did exist they were significant and linear (r2=0.37 to 0.96, p<0.05). Local thermal

9
comfort had a strong relationship with Tc which was strengthened during the RUN in comparison to
the WALK (r2=0.82 and r2=0.50, respectively, p<0.05).
3.4. Regional sensitivity to wlocal and ∆GSC.
Local and whole body threshold of discomfort according to wlocal and ∆GSC are displayed in Table 3.
The threshold of discomfort are defined as the point at which participants no longer feel comfortable
(-1 vote). The values in Table 3 are the mean of each individual’s wlocal and ∆GSC value at the
threshold. Two-way repeated measures ANOVA revealed no significant effect of condition for wlocal.
(p>0.05) ). A significant effect of location is observed for wlocal but not for ∆GSC. Pairwise
comparison with Bonferroni correction revealed no significant differences between locations for wlocal.
Without Bonferroni corrections the upper back was significantly less sensitive than all other locations
and the chest was significantly less sensitive than the upper legs. According to Table 3, threshold of
discomfort for wlocal indicate that the upper legs and upper arms are the most sensitive during the
WALK due to the lower wlocal values (0.22 ± 0.11 and 0.22 ± 0.03, respectively). The upper back is
classed as the least sensitive as it requires a higher wlocal values before participants no longer felt
comfortable (0.30 ± 0.12). During the RUN the threshold of discomfort for wlocal occur at higher
values than the WALK but suggest a similar order of sensitivity, with the extremities being more
sensitive than the torso areas. If the same principle is applied to ∆GSC then the upper back and upper
arm are the most sensitive and the upper legs the least sensitive.
The intensity of discomfort (i.e. the highest discomfort score reported) and the corresponding wlocal
reached varied between locations, these are listed in Table 4. Two-way repeated measures ANOVA
revealed a significant effect of condition for wlocal, ∆GSC and thermal comfort as all locations were
significantly higher during the RUN compared to the WALK (p<0.05). A significant effect of location
was observed for thermal comfort, with the whole body (3.3) and chest (3.1) scoring significantly
higher discomfort votes than the upper legs (2.4). A significant effect of location was observed for
wlocal and pairwise comparison showed significant differences between all locations except the whole
body and the upper arm, the chest and the upper back (p>0.05). No significant effect of location was
observed for ∆GSC.
During the WALK the chest and upper back scored the highest vote (>-2.0), followed closely by the
upper arm (-1.9 ± 1.3) whilst the upper legs scored the lowest discomfort score (-1.7 ± 1.1). The
discomfort scores appear to be relative to wlocal as the chest and upper back also had the highest wlocal
(0.57 ± 0.19 and 0.65 ± 0.21, respectively) and the upper legs have the lowest wlocal (0.32 ± 0.03).
However, the exception appears to be the upper arm which also had a high discomfort score, similar
to the lower back (-1.9) yet a low wlocal (0.37 ± 0.14). This response was mirrored by the ∆GSC data
as the highest discomfort scored corresponded with the highest ∆GSC values, except the arms. During
10
the RUN, a similar response to the WALK occurred, with the highest discomfort scores corresponding
with the highest wlocal and ∆GSC.
4. Discussion
4.1. A comparison of wlocal and ΔGSC in predicting thermal discomfort during different exercise intensities
Past research has established the relationship between whole body thermal comfort and wbody and 0.30
has been defined as the threshold of discomfort at rest (Gagge et al. 1969; Nishi and Gagge, 1977;
Winslow et al. 1939). Research has moved forward by identifying regional differences in thermal
comfort to wlocal (Fukazawa and Havenith, 2009; Umbach, 1982). However, the research has mainly
focused upon the threshold of discomfort for w and since its introduction by Gagge (1937) researchers
have confirmed the diminishing role of w during heavy sweating on the prediction of thermal
discomfort (Doherty and Arens, 1988; Lee, et al. 2011). As a result, this study aimed to address the
relationship between thermal discomfort and w and introduce ∆GSC that could improve and/or aid the
prediction of thermal discomfort during high levels of sweat production as found in exercise.
Table 2 indicates the strength of the relationship between thermal comfort and wlocal and ∆GSC,
respectively. The results indicated a strong linear relationship between local thermal comfort and wlocal
during the WALK at all locations (r2>0.78 to 0.98). During the RUN, wlocal increased and tended to
plateau at values >0.60, during which thermal discomfort however continued to increase. As such, an
exponential relationship is observed between the two variables. Using the data in the present study to
predict thermal discomfort at higher metabolic rates requires the data to be transformed, which is
useful in terms of analysis but poses several issues when interpreting the findings. During high sweat
production, wlocal will reach ceiling values and the sensitivity of wlocal to predict thermal comfort
beyond a moderately uncomfortable state diminishes. As a result the uncertainty in predicting thermal
discomfort will increase dramatically in the exponential part of the curve. Here, a small change in
wlocal leads to a big change in comfort. Any variations or uncertainty in wlocal will thus result in large
errors in the prediction of local thermal discomfort. Lee et al. (2011) claimed that predicting comfort
was more difficult at higher w, which is supported by the findings of this study.
The plateau in wlocal at values >0.60 and the concomitant increase in thermal discomfort suggests
either another factor must be driving discomfort or there are errors with the measurement. The
measurement of wlocal in the present study was achieved using humidity sensors located in the
microclimate, approximately 2 mm from the skin. Even though this is relatively close, the distance
between the humidity sensor and the skin may not be sufficient to provide a true representation of
surface wlocal at higher sweat rates. If the skin is fully saturated with sweat then it should have reached
11
a maximum value of 1.0, yet in some cases the skin visually appeared to be completely saturated, but
wlocal did not exceed 0.85 ± 0.09. It is plausible that a measurement artefact may contribute to the
underestimation of wlocal but the plateau is a true representation of the surface being saturated with
sweat, illustrating the issues associated with the measurement of wlocal as used in the present study and
by others (Fukazawa & Havenith, 2009; Umbach, 1982).
The classic work of Gagge et al. (1967) demonstrated the diminishing role of Tsk on thermal sensation
as it rises above 33°C. It is proposed that sweating maintains Tsk at a favourable level and thus thermal
sensation does not increase but discomfort will. This continual increase in thermal discomfort was
found to correlate with w. In the present study, Tsk demonstrated moderate-strong relationship with
thermal comfort, which actually improved from the WALK to the RUN despite a significantly higher
GSL. Although this does not support the findings of Gagge et al. (1967), Thermal comfort had a
stronger relationship with ΔGSC than Tsk.
Another factor that may contribute towards an increased thermal discomfort at high metabolic rates is
Tc. An increase in sweat production typical occurs concomitantly with an increase in Tc so with heat
exposure and/or with exercise higher thermal discomfort votes will likely be influenced by both.
Stronger relationships were observed between local thermal discomfort and ∆GSC (r2>0.71) than Tc
(r2>0.50). The relationship between thermal discomfort and ∆GSC strengthened as metabolic rate
increased (WALK; r2>0.71 and RUN; r2>0.95). GSC has been reported to represent pre secretory
sweat gland activity (Caldwell et al. 2011; Darrow, 1964; Machado-Moreira et al. 2009), the number
of active sweat glands (Thomas and Korr, 1957) and the amount of sweat produced (Fowles, 1986).
Therefore it indicates not only what is happening on the skin surface but also within the epidermis
where the receptors are located, which may explain why it is a good predictor of thermal comfort. .
However the number of potential measurement errors both systematic and unsystematic with GSC is
high. Considerable pilot testing took place to reduce possible errors during testing. Reliability was
assessed during pilot tests and whilst some variations did exist the response to a given condition was
similar. The large variation in individual sweat gland output may accounts for the variation seen in
GSC but also in that from other studies when measuring sweat (Smith & Havenith, 2011, 2012; Cotter
et al. 1995; Machado-Moreira et al. 2008). Standardising the value relative to a baseline value aimed
to reduce these errors but the high dispersion of values reduces the certainty of predicting thermal
discomfort using GSC as can be seen in Table 3 and 4. As a result more research is required to
understand the extent to which GSC is influenced by sweat gland activity, epidermal hydration and
surface sweat. However, the reduced strength of the relationship between thermal comfort and surface
sweat (as indicated by wlocal) and the increasing relationship between thermal comfort and ΔGSC at
higher sweat levels suggests that an internal component in the skin could be a strong contributing
driver for discomfort. Discomfort may be related to the accumulation of sweat in the skin, on the skin

12
and within the clothing layer next to the skin. During sweat production the skin swells, becomes soft
and enhances the sensitivity of receptors (Berglund and Cunningham, 1986). Gwosdow et al. (1986)
noted an increase in the friction between skin and clothing as well increased perceived fabric
coarseness with increasing moisture content in the skin. This aspect seems to be better represented by
∆GSC than by the surface skin wettedness (wlocal). The perception of thermal comfort may not be a
solely thermal response but multiple factors relating to the perception of temperature and moisture, in
which the skin-fabric interaction may play a large role. Potentially the hydration of the skin due to the
production of sweat has an influential role on perceptual responses but further research is required to
address this.
Collectively the comparative relationships between thermal comfort, ∆GSC and wlocal and the issues
surrounding the methods of measuring wlocal suggest it is not the sweating per se that cannot predict
thermal discomfort during high sweat rates but wlocal as a parameter on its own. Doherty and Arens
(1988) stated that models which use w to predict thermal discomfort become less accurate for high
intensity exercise than at rest or during low-moderate intensity exercise. This also conforms to the
findings from Lee et al. (2011).
4.2. Regional differences in local thermal discomfort sensitivity
To the authors knowledge only Fukazawa and Havenith (2009) and Umbach (1982) have investigated
regional sensitivity to thermal discomfort using wlocal as a predictor. The methods used to determine
sensitivity is based on the thresholds for discomfort or the transition away from comfortable and
noting the corresponding wlocal. The application of such methodologies will be discussed here.
In the present study, the threshold for discomfort was defined as the point at which the participants no
longer felt comfortable (-1 vote). These were determined for both wlocal and ∆GSC and values are
displayed in Table 3. During the WALK, local threshold for discomfort suggests that the upper arms
and upper legs are the most sensitive areas, due to the lower wlocal required to no longer feel
comfortable. The upper back was a significantly less sensitive area than all other location across the
body. The threshold for discomfort using ∆GSC provide less informative data due to the small
variations in values in comparison to the range of ∆GSC achieved and thus the significance of the
differences between the comfort limits are questionable. In addition, Figure 2 suggests the slope of the
line between local thermal comfort and local ∆GSC suggest that there is not much difference between
regions in intrinsic sensitivity to moisture. The intensity of discomfort experienced maybe a more
useful measurement as it may indicate the areas that are more sensitive to efferent inputs such as
sweat and drive thermal discomfort to higher levels. This is particularly true of the upper legs, which
according to wlocal are very sensitive areas due to a lower comfort limit and were significantly lower
than the chest and upper back, , yet the legs scored the lowest discomfort scores at the end of the RUN

13
(-3.1 ± 1.76). The chest and upper back had higher discomfort scores alongside higher wlocal and
∆GSC at the end of exercise. This supports findings from Lee et al. (2011) who noted that the areas
perceived as the wettest regions were the upper back, chest, front and back neck and forehead whilst
the palms, feet and dorsal hands were the least wet regions. These areas, according to Smith and
Havenith (2011, 2012) are areas of high and low sweat production, respectively. Perhaps areas which
score the highest discomfort votes can be deemed as critical areas, in the sense they are the most
exposed to discomfort as a combination of their intrinsic sensitivity to sweat and the sweat effectively
present (related to local sweat rate).
Past researchers have used w to predict the threshold of discomfort and therefore restricted the
methodology to low wlocal and discomfort scores (Fukazawa and Havenith, 2009; Umbach, 1982). To
the author’s knowledge this is the first experiment to compare thermal comfort over different exercise
intensities and the results suggest that higher discomfort scores are relative to the amount of sweat
produced and accumulated around the skin as indirectly measured by ∆GSC. In this case the areas of
the torso should be of primary concern when designing clothing to promote thermoregulation and
thermal comfort.
The present study aimed to investigate regional differences in thermal comfort sensitivity to the
presence of sweat using wlocal and GSC. Whilst application using the threshold of discomfort to
determine regional sensitivity have just been questioned an interesting issues arises when comparing
the findings between our study and that of Fukazawa and Havenith (2009) and Umbach (1982).
Though the pattern of sensitivity across the body appears to be similar between all threes studies, the
values for the thermal comfort limits were much lower in the present study. This is likely due to the
fact that in both studies they manipulated wlocal to increase independently of others zones. This
enabled them to identify the ‘true’ threshold of discomfort for individual body sites. Whilst
mechanistic research is informative it is not representative of real life situations whereby sweat will be
produced across the body at different rates (Smith and Havenith, 2011, 2012), therefore more
ecologically valid studies are required. Higher wlocal values for the thresholds of discomfort were
found by Fukazawa and Havenith (2009) and Umbach (1982), suggesting that more sweat is required
locally to influence thermal comfort when wlocal is not naturally distributed. In the present study all
physiological responses increased simultaneously and any changes in local thermal comfort may be
attributed to other local or whole body changes. The interaction between body segments and the
influence on local and whole body perceptual responses has been investigated by Arens and Zhang
(2006) and they found that the overall perceptions are dominated by the one or two most unfavourable
local perceptions. Their research focused upon regional differences in skin temperature in uniform
conditions. Further research is required to understand the interaction between local and whole body
sweat production on thermal comfort. The interactions between local and whole thermal comfort may
14
explain the lower thresholds for discomfort observed in the present study compared to Fukazawa and
Havenith (2009) and Umbach (1982) but this requires further comparative research using the same
perceptual scales.
5. Conclusions
The natural variation of physiological responses (∆GSC, wlocal and Tsk) and thermal comfort were
measured in male participants and the relationships analysed. The results revealed that during high
levels of sweat production w plateaued at approximately 0.60-0.85, depending on condition,
suggesting either a maximum value has been reached or a measurement artefact exists with wlocal. This
resulted in an exponential relationship between thermal comfort and wlocal which reduces the latter’s
ability to accurately predict the intensity of thermal discomfort experienced when sweat production is
high. The findings revealed that thermal comfort has a stronger relationship with ∆GSC, especially at
higher metabolic rates when sweat production is greater. This supports the hypothesis that thermal
discomfort may be more related to the amount of moisture present within the skin and on and around
the skin itself, as reflected by ∆GSC, rather than just a proportion of wetted area at skin surface as
indicated by wlocal.
Acknowledgements: The authors would like to acknowledge the continued support from Oxylane group during this study, with special thanks to Sophie Herpin.
Role of the funding body: The present research was done in the context of an industry- co-funded PhD. Bernard Redortier, member of the sponsoring industry (Oxylane Research), contributed to the conception and design of the experiment and contributed to the paper write-up.
References
American College of Sport Medicine. 2005. ACSM's guidelines for exercise testing and prescription. Seventh ed. Lippincott Williams & Wilkins.
Berglund, L.G. 1995. Comfort criteria - humidity and standards, Proceedings of the Pan Pacific symposium on Buildings and Urban Environmental Conditioning in Asia, p. 369.
Berglund, L.G., Cunningham, D.J. 1986. Parameters of Human Discomfort in Warm environments. ASHRAE Trans. 92.
Caldwell, J.N., Nykvist, A., Powers, N., Notley, S., Lee, D., Peoples, G. & Taylor, N. 2011. An investigation of forearm vasomotor and sudomotor thresholds during passive heating, following whole body cooling. XIV International Conferences of Environmental Ergonomics, Paschalidis Medical Publisher, Nafplio, p. 29.
Candas, V., Libert, J.P., Vogt, J.J., 1979a. Human skin wettedness and evaporative efficiency of sweating. Appl. Physiol. 46, 3, 522-528.
15
Candas, V., Libert, J.P., Vogt, J.J. 1979b. Influence of air velocity and heat acclimation on human skin wettedness and sweating efficiency. J. App. Physiol. 47, 6, 1194-1200.
Cotter, J.D., Patterson, M.J., Taylor, N.A.S., 1995. The topography of eccrine sweating in humans during exercise. Eur. J. App. Physiol. 71, 6, 549-554.
Darrow, C.W. 1964. The rationale for treating the change in galvanic skin response as a change in conductance. Psychophysiology, 1, 1, 31-38.
Doherty, T. J., and E. A. Arens, 1988. Evaluation of the physiological bases of thermal comfort models. ASHRAE Trans. 94, 1, 15.
Edelberg, R. 1972. Electrical activity of the skin: Its measurements and uses in psychophysiology. In: Greenfield, N.S. & Sternbach, R.A. (eds.) Handbook of Psychophysiology. New York, USA: Holt, Rinchart & Winston, pp. 367-418.
Epstein, Y., Stroschein, L., Pandolf, K. 1987. Predicting metabolic cost of running with and without backpack loads. Eur. J. Appl. Physiol. Occup. Physiol. 56, 5, 495-500.
Fowles, D.C. 1986. The eccrine system and electrodermal activity, in: Coles, M.G.H. Donchin, E., Porges, S.W. (Eds.), Psychophysiology. New York, USA: Guilford Press, pp. 51-96.
Fukazawa, T., Havenith, G. 2009. Differences in comfort perception in relation to local and whole body skin wettedness. Eur. J. App. Physiol. 106, 1, 15-24.
Gagge, A.P., Stolwijk, J.A., Nishi, T. 1969a. The prediction of thermal comfort when thermal equilibrium is maintained by sweating. ASHRAE Trans. 75, 2, 108-121.
Havenith, G., Holmér, I., Parsons, K. 2002. Personal factors in thermal comfort assessment: clothing properties and metabolic heat production. Energ. Buildings. 34, 6, 581-591.
ISO 7933 2004. Ergonomics of the thermal environment. Analytical determination and interpretation of heat stress using calculations of the predicted heat strain. ISO, Geneva.
Kuno, S. 1995. Comfort and Pleasantness. Nagoya, Japan: Pan-Pacific Symposium on Building and Urban Environmental Conditioning in Asia, pp. 383-392.
Lee, J.Y., Nakao, K., Tochihara, Y. 2011. Validity of perceived skin wettedness mapping to evaluate heat strain. Eur. J. App. Physiol. 111, 10, 2581-2591.
Machado-Moreira, C.A., Wilmink, F,, Meijer, A., Mekjavic, I.B., Taylor, N.A. 2008 Local differences in sweat secretion from the head during rest and exercise in the heat. Eur. J. App. Physiol, 104, 257–264.
Machado-Moreira, C.A., Edkins, E., Iabushita, A.S., Maruca, P., Taylor, N.A.S. 2009. Sweat gland recruitment following thermal and psychological stimuli. X111 International Conference of Environmental Ergonomics, Boston, p. 478
Nadel, E.R., Stolwijk, J.A. 1973. Effect of skin wettedness on sweat gland response. J. App. Physiol. 35, 5, 689-694.
16
Nadel, E.R., Bullard, R.W., Stolwijk, J.A. 1971. Importance of skin temperature in the regulation of sweating. J. App. Physiol. 31, 1, 80-87.
Nishi, Y., Gagge, A.P. 1977. Effective temperature scale useful for hypo- and hyperbaric environments. Aviat. Space Environ. Med. 48, 2, 97-107.
Smith, C.J., Havenith, G. 2011. Body mapping of sweating patterns in male athletes in mild exercise-induced hyperthermia. Eur. J. App. Physiol, 111, 7, 1391-1401.
Smith, C.J., Havenith, G. 2012. Body mapping of sweating patterns in athletes: A sex comparison. Med. Sci. Sports Exerc. 44, 12, 2350-2361.
Thomas, P.E., Korr, I.M. 1957. Relationship between sweat gland activity and electrical resistance of the skin. J. App. Physiol. 10, 3, 505-510.
Umbach, K.H. 1982. Effect if local heat and moisture build-up on wear comfort of clothing. Hohensteiner Forschungsbericht, Clothing Physiol. 1-10.
Wilder, J. 1962. Basimetric approach (law of initial value) to biological rhythms. Ann. NY Acad. Sci. 98, 4, 1211-1220.
Winslow, C.E.A., Herrington, L.P., Gagge, A.P. 1939. Physiological reactions and sensations of pleasantness under varying atmospheric conditions. ASHVE, 44, 179-194.
17
Fig 1: The relationship between local thermal comfort and wlocal in both conditions (WALK and RUN), for the whole body and each location. Graphs based on untransformed data.

18
Fig 2: The relationship between local thermal comfort and ΔGSC in both conditions (WALK and RUN), for the whole body and at each location. Graphs based on untransformed data.

19
Table 1: The mean values (±SD) of wlocal, ∆GSC and Tsk during the WALK and RUN. Significant differences between WALK and RUN during rest is denoted by * (p<0.05) and ** (p<0.001) (without corrections) and by $$ p<0.005 (with Bonferroni adjustments).
Walk RUN
wlocal (nd) ∆GSC
(µS)
Tsk (°C) wlocal (nd) ∆GSC (µS) Tsk (°C)
Whole body 0.46±0.09 4.4±3.4 33.4±0.37 0.68±0.08**$$ 15.6±9.5* 33.4±0.57**
Chest 0.57±0.18 5.6±6.0 33.7±0.72 0.85±0.09*$ 19.6±0.2* 35.2±1.4
Upper back 0.65±0.21 3.7±3.8 33.9±0.87 0.83±0.09*$ 18.2±14.0* 33.8±1.18
Upper arms 0.37±0.14 4.7±2.7 33.4±1.14 0.79±0.06**$$ 15.7±1.5* 34.5±1.49
Upper legs 0.32±0.03 3.8±4.5 33.3±0.89 0.50±0.09**$$ 11.8±4.7* 32.4±1.44

20
Table 2: Regression coefficients for the prediction of whole body and local thermal comfort. The strength of the relationship (r2) between thermal comfort and each predictor (*p<0.05, **p<0.001). † Indicates where data was transformed using exponential function (Y= a + b · ex)] to produce approximate linear relations prior to correlation
analysis, †† indicates where data was transformed using a square root function (Y= a + b·√X] to produce approximate linear relations prior to correlation analysis.
WALK RUN
Parameter a b r2 a b r2
Whole body wbody -6.5964 0.9011 0.96** -5.3683 6.585 0.95†**
∆GSC -1.9989 1.8099 0.92††** -0.984 -0.0079 0.97††**
Tsk -1.0151 32.022 0.75* -2.2029 69.823 0.94**
Tc -5.2145 191.88 0.56* -3.8561 142.3 0.89**
Chest wlocal -4.7525 0.7399 0.93** -3.2952 4.0198 0.96†**
∆GSC 0.9556 -0.1896 0.78††** -0.9051 0.0967 0.98††**
Tsk -0.982 31.823 0.37* -2.5048 84.332 0.96**
Tc -5.1596 189.99 0.55* -3.6915 136.34 0.92**
Upper back wlocal -4.3006 0.855 0.98** -3.1824 3.740 0.96†**
∆GSC -1.5898 0.9911 0.78††** -0.8035 -0.1734 0.97††**
Tsk -1.0847 35.283 0.50* -3.762 123.91 0.69*
Tc -6.1957 228.33 0.65* -3.2998 121.62 0.87*
Upper arm wlocal -6.8488 0.5382 0.92** -3.4114 3.7919 0.95†**
∆GSC -0.8114 0.0758 0.71††** -0.9148 -0.1811 0.95††**
Tsk -0.8686 27.362 0.75** -1.4516 45.931 0.93**
Tc -4.7437 174.51 0.60** -3.6463 134.49 0.90**
Upper leg wlocal -11.583 1.9072 0.78** -7.9312 10.021 0.94†**
∆GSC -3.061 4.227 0.91††** -0.8735 0.1871 0.97††**

21
Tsk -0.6533 20.21 0.88** -1.1586 35.52 0.78**
Tc -4.1404 152.37 0.58** -2.9783 110.09 0.94**

22
Table 3: The mean (±SD) thermal comfort limits for each location during WALK and RUN, which corresponds to when locations no longer felt comfortable. No significant differences between WALK and RUN were found.
WALK RUN
w ∆GSC w ∆GSC
Whole body 0.26 ± 0.11 2.4 ± 3.7 0.31 ±0.21 1.5 ± 3.7
Chest 0.27 ± 0.10 2.2 ± 5.9 0.39 ±0.32 2.6 ± 3.5
Upper back 0.30 ± 0.12 1.7 ± 3.6 0.36 ±0.10 1.6 ± 1.8
Upper arm 0.22± 0.11 2.3 ± 3.6 0.28 ±0.22 0.8 ± 0.7
Upper leg 0.22 ± 0.03 4.4 ± 4.1 0.22 ±0.10 2.0 ± 1.7
Table 4: The maximum discomfort score at the end of each test and the corresponding wlocal and ∆GSC values. Significant differences between WALK and RUN is donated by * (p<0.05) or ** (p<0.001).
WALK RUN
Discomfort
score w ∆GSC
Discomfort
score w ∆GSC
Whole
body -2.2 ± 1.2 0.46 ± 0.09 4.4 ± 3.4 -4.3 ± 1.7** 0.68 ± 0.08** 15.6 ± 9.5**
Chest -2.1 ±1.4 0.57 ± 0.19 5.6 ± 6.0 -4.0 ± 1.7** 0.85 ± 0.09** 19.6 ± 10.2**
Upper back -2.1 ± 1.5 0.65 ± 0.21 3.7 ± 3.8 -3.8 ± 1.9* 0.83 ± 0.09* 18.2 ± 14.0*

23
Upper arm -1.9 ± 1.3 0.37 ± 0.14 4.7 ± 2.7 -4.1 ± 1.8** 0.79 ± 0.06** 15.7 ± 11.5*
Upper leg -1.7 ± 1.1 0.32 ± 0.03 3.9 ± 4.5 -3.1 ± 1.8** 0.50 ± 0.09** 11.8 ± 4.7**

24