A comparative study of the thermo-mechanical properties of ...
41
HAL Id: hal-03412635 https://hal-agroparistech.archives-ouvertes.fr/hal-03412635 Submitted on 3 Nov 2021 HAL is a multi-disciplinary open access archive for the deposit and dissemination of sci- entific research documents, whether they are pub- lished or not. The documents may come from teaching and research institutions in France or abroad, or from public or private research centers. L’archive ouverte pluridisciplinaire HAL, est destinée au dépôt et à la diffusion de documents scientifiques de niveau recherche, publiés ou non, émanant des établissements d’enseignement et de recherche français ou étrangers, des laboratoires publics ou privés. A comparative study of the thermo-mechanical properties of polylactide/cellulose nanocrystal nanocomposites obtained by two surface compatibilization strategies Hajar Faraj, Cyrille Sollogoub, Alain Guinault, Matthieu Gervais, Julien Bras, Hanène Salmi-Mani, Philippe Roger, Manon Le Gars, Sandra Domenek To cite this version: Hajar Faraj, Cyrille Sollogoub, Alain Guinault, Matthieu Gervais, Julien Bras, et al.. A comparative study of the thermo-mechanical properties of polylactide/cellulose nanocrystal nanocomposites ob- tained by two surface compatibilization strategies. Materials Today Communications, Elsevier, 2021, 29, pp.102907. 10.1016/j.mtcomm.2021.102907. hal-03412635
Transcript of A comparative study of the thermo-mechanical properties of ...

HAL Id: hal-03412635https://hal-agroparistech.archives-ouvertes.fr/hal-03412635
Submitted on 3 Nov 2021
HAL is a multi-disciplinary open accessarchive for the deposit and dissemination of sci-entific research documents, whether they are pub-lished or not. The documents may come fromteaching and research institutions in France orabroad, or from public or private research centers.
L’archive ouverte pluridisciplinaire HAL, estdestinée au dépôt et à la diffusion de documentsscientifiques de niveau recherche, publiés ou non,émanant des établissements d’enseignement et derecherche français ou étrangers, des laboratoirespublics ou privés.
A comparative study of the thermo-mechanicalproperties of polylactide/cellulose nanocrystal
nanocomposites obtained by two surfacecompatibilization strategies
Hajar Faraj, Cyrille Sollogoub, Alain Guinault, Matthieu Gervais, Julien Bras,Hanène Salmi-Mani, Philippe Roger, Manon Le Gars, Sandra Domenek
To cite this version:Hajar Faraj, Cyrille Sollogoub, Alain Guinault, Matthieu Gervais, Julien Bras, et al.. A comparativestudy of the thermo-mechanical properties of polylactide/cellulose nanocrystal nanocomposites ob-tained by two surface compatibilization strategies. Materials Today Communications, Elsevier, 2021,29, pp.102907. �10.1016/j.mtcomm.2021.102907�. �hal-03412635�

1
A comparative study of the thermo-mechanical properties of polylactide/cellulose nanocrystal nanocomposites obtained by two surface compatibilization strategies Hajar Faraj1,2, Cyrille Sollogoub2, Alain Guinault2, Matthieu Gervais2, Julien Bras3, Hanène Salmi-Mani4, Philippe Roger4, Manon Le Gars3, Sandra Domenek1
1Université Paris-Saclay, INRAE, AgroParisTech, UMR SayFood, 91300, Massy, France 2Laboratoire PIMM, Arts et Metiers Instiute of Technology, CNRS, Cnam, Hesam Université, 151, Boulevard de l’Hôpital, F-75013 Paris Cedex, France 3Univ. Grenoble Alpes, CNRS, Grenoble INP, LGP2, F-38000 Grenoble, France 4Institut de Chimie Moléculaire et des Matériaux d’Orsay, Université Paris-Saclay, CNRS, 91405 Orsay, France Corresponding author: Sandra Domenek, UMR SayFood (Université Paris-Saclay, INRAE, AgroParisTech), 1 rue des Olympiades, 91300 Massy, France; [email protected] Keywords: PLA, nanocellulose, surface compatibilization, mechanical properties, surface
interaction, percolation
Abstract Nanocomposites of poly(lactide) (PLA) and cellulose nanocrystal (CNC) were fabricated using
two different types of covalently grafted surface compatibilizers, namely fatty acids (lauric or
stearic acid) and poly(glycidyl methacrylate) (PGMA) bearing reactive epoxy end-groups.
Temperature-Modulated DSC analysis informed on weak attractive interaction of PLA and
CNC-g-lauric acid and weak plasticizing of CNC-g-stearic acid. Despite that a homogenous
dispersion of up to 50 wt.% of CNC in PLA was obtained and the rubbery elastic moduli
increased 150-fold as compared to PLA. CNC-g-PGMA phase-separated in PLA but partially
to it at the interface. It yielded a 40-fold increase of rubbery plateau moduli. The data analysis
with the Ouali model for percolated systems and the Halpin-Tsai model for composites with
short fibres showed that CNC-g-lauric acid percolated in PLA. However the effective modulus

2
of the percolated network was smaller than that of unmodified CNC. Reactive compatibilization
of PLA with CNC-g-PGMA prevented percolation but lead to high filler/matrix coupling. In
that case, the modulus increase could be described using the Halpin-Tsai model. In conclusion,
surface compatibilizing even if developing only weak interactions with the polymer matrix
helps to obtain homogenous nanocomposites, but the strength of the percolated network is
lowered because it weakens also the CNC/CNC interactions. Reactive surface compatibilizing
using polymers can be an interesting alternative, but needs to be optimized to take advantage
of the high filler/matrix coupling and avoid phase separation.
3
1. Introduction
Cellulose nanocrystals (CNC) are cellulosic nanoparticles that are very attractive nanofillers
considering their renewability, abundance, biodegradability, and outstanding mechanical
properties (modulus and strength). The geometrical dimensions of rod-like CNC depend
strongly on the cellulose source, but typical values of length and aspect ratio are comprised
between 100 to 1000 nm and 5 to100, respectively [1, 2]. Obtained by acid hydrolysis of
cellulose fibers, CNC have high crystallinity and high elastic modulus reported to be between
100 and 150 GPa [3-5]. They are highly polar because of numerous hydroxyl groups (-OH) on
their surface which can reach concentrations of 7.2 groups/nm2 in cellulose nanocrystals. This
ensures good surface reactivity [6]. The formation of numerous hydrogen bonds can create a
3D rigid and tough percolated network. Favier et al. [7, 8] reported for the first time the
outstanding reinforcing effect of the percolating network on mechanical properties. an
improvement of more than 2 orders of magnitude in rubbery state was obtained at a
concentration 6 wt.% in the thermoset polymer (poly(S-co-BuA). The mechanical properties
were described by the percolation model developed by Ouali [9].
CNC have been incorporated in many polymer matrices (thermosets or thermoplastics) in order
to obtain nanocomposites with improved properties [10-12]. Among the different possible
matrices, biobased and biodegradable polymers are of special interest because the resulting
nanocomposite is fully biobased. Polylactide (PLA) is a promising commercially available
polyester. Despite its numerous advantages, PLA suffers for some drawbacks, such as moderate
stiffness and low heat deflexion temperature [13] and low elastic modulus in the rubbery state
[14]. This limits its use in applications, where the service temperature exceeds its glass
transition temperature, typically in packaging technologies using hot-filling or sterilization of
foodstuff inside the package. To overcome this drawback, semicrystalline PLA can be used, but
the crystallization kinetics of PLA are rather slow [15]. An alternative is the inclusion of charges
4
and, in particular of nanocharges. PLA/CNC nanocomposites were studied over the past few
decades [16]. The most important challenge to reach high performance of PLA/CNC
nanocomposites remains the dispersion of the CNC in the matrix. Due to the strong hydrogen
bonds between the nanoparticles, CNC easily form almost irreversible aggregates once dried
and are very difficult to disperse in non-polar polymer matrices such as PLA [4]. Taking
advantage of the reactivity of the hydroxyl groups on the CNC surface, chemical surface
modification is used to enhance the compatibility and dispersion in polymer matrices. Many
such strategies have been proposed: esterification [17-20], acetylation [21, 22], grafting of
polymer chains [20, 23-25], non-covalent surface modification [26-29].
However, as clearly pointed out by Miao & Hamad [10], uniform dispersion of CNC in the
polymer matrix is not the unique condition to reach high mechanical performance. Additionally,
the concentration of the nanocharge needs to be higher than the percolation threshold and the
modulus of the percolating network should be high. The contribution of the interaction between
polymer and CNC can only be neglected in case the modulus of the percolated network is much
higher than that of the polymer matrix. Both, percolation threshold and modulus will be
impacted by the surface grafting of CNC, though. Hydrophobic surface grafts hinder the
creation of hydrogen bonds between individual CNC and can potentially decrease the strength
of the percolated network and increase the percolation threshold. This phenomenon was shown
on the example of rubber nanocomposites using chemically modified chitosan nanocrystals [30].
The result could be extended to CNC, but it is not clearly discussed yet. Indeed, collecting the
data of more than 20 different studies, Vatansever et al. [16] showed that the actually observed
improvements in the elastic moduli of PLA/CNC nanocomposites were generally modest. Best
results were an increase of a factor 2 of the modulus in the glassy state [20] and around ten in
the rubbery state [20, 31].
To investigate in more detail and report on the impact of the CNC surface modification on the
mechanical strength of PLA/CNC nanocomposites, we build on recent results obtained by Le
5
Gars et al. [25, 32]. They developed a scalable CNC surface esterification method[32] based on
the SolReact procedure proposed by Espino et al. [17, 33] using fatty acids (lauric acid C12 and
stearic C18). Fatty acids are abundant and non-toxic molecules and were grafted using an in-
situ solvent exchange mechanism at atmospheric pressure and relatively low temperature
(110 °C). Furthermore, they presented a grafting-from method of growing poly(glycidyl
methacrylate) (PGMA) from the CNC surface via surface-initiated atom transfer radical
polymerization [25]. The specificity of this compatibilizer is that it bears reactive epoxy groups,
which are potentially able to crosslink among each other and with PLA. Both compatiblizers
were grafted to the same type of CNC, which allowed for direct the comparison of the
mechanical performance PLA/CNC nanocomposites based on a very different compatiblizing
mechanisms. To avoid interference in the interpretation caused by PLA crystallization, we used
a grade with high D-lactic acid content, unable to crystallize under common processing
conditions. Analysis of the relaxation properties of the nanocomposites and their elastic moduli
was performed using Temperature-Modulated Differential Scanning Calorimetry (TM-DSC)
and dynamic mechanical analysis (DMA). In the aim to evaluate the effect of CNC percolation
on the viscoelastic moduli, samples with a wide CNC concentration range (up to 50 wt.%) were
fabricated by solvent casting. The effects of CNC on the moduli were analyzed and quantified
with the help of mechanical modelling.
2. Experimental section
2.1. Materials
Polylactic acid (PLA) INGEO pellets “NatureWorks 4060D” were purchased from Resinex,
France. This amorphous grade has a D-lactic acid content of 11 ± 1 mol % according to
supplier’s specifications, which prevents crystallization under common laboratory conditions
due to extremely slow crystallization kinetics. The cellulose nanocrystals powder (CNC) was

6
supplied by CelluForce (Canada). The cellulose nanocrystals were extracted from wood fibers
and spray-dried by the supplier. Lauric acid (≥ 98%) and stearic acid (Reagent grade 95%) were
supplied by Sigma-Aldrich Chimie (France). Dichloromethane (CH2Cl2) was supplied from
Carlo Erba reagents (France), and used without further purification (purity over 99.8 %).
2.2. Preparation of surface modified CNC
2.2.1. SI-ATRP of Glycidyl methacrylate on pre-functionalized CNC
CNC were modified by a surface-initiated ATRP polymerization (SI-ATRP) of glycidyl
methacrylate (GMA), as described by Le Gars et al. (2020) [25]. Briefly, CNC were first
modified with α-bromoisobutyryl bromide reagent (BIB), in order to introduce brominated
initiator sites at their surface for further radical polymerization. Recovered CNC-Br were then
subjected to several freeze-thaw cycles to remove oxygen, followed by the SI-ATRP of GMA
for one hour involving GMA/EBIB/PMDETA/CuBr (ethyl α-bromoisobutyrate
(EBIB)/N,N,N’,N’’,N’’-pentamethyldiethylenetriamine (PMDETA)/Copper (I) bromide
(CuBr)) reagents system with 100:1:1:1 composition ratio. At the end of the reaction,
polymerized CNC-PGMA-Br were extensively washed by successive centrifugation cycles
(9000 rpm, 15 min, 5 °C) in dichloromethane to remove all unreacted reagents and
homopolymer PGMA polymerized from EBIB as sacrificial initiator. CNC-PGMA-Br were
stored in dichloromethane until further use and characterizations. Characterizations of surface
polymerized CNC-PGMA-Br were carried out by Le Gars et al. (2020) [25]. In short, after
having proved the efficiency of the polymerization of GMA from the surface of the CNC, the
degree of substitution of surface-polymerized CNC was calculated equal to 0.2. Theorical
degree of polymerization of GMA was chosen equal to 100. After taking in consideration the
conversion of 46 % after one hour of polymerization, the degree of polymerization of the
PGMA on the surface of the CNC was close to 46, with a proportion of around 50 % in mass
of polymer in the sample. By investigating the crystallinity of the CNC-PGMA-Br by XRD,
the spectra showed signals of both the crystalline cellulose Ib and amorphous PGMA.

7
Furthermore, dynamic light scattering analysis of CNC-PGMA-Br showed a mean diameter of
the particles equal to 164 nm, highlighting the presence of nanosized particles.
2.2.2. Surface esterification of CNC with lauric and stearic acid
The CNC esterification [32] procedure was adapted from the SolReact protocol [17] for non-
water soluble organic acids. The aqueous CNC suspension was solvent exchanged to acetone
by successive centrifugation cycles (10000 rpm, 5 °C, 15 min) in water, ethanol, and then
acetone. The acetone suspension (1 wt.%) was then introduced in a flask mounted with a
distillation system, and heated at 110 °C. A catalytic amount of sulfuric acid H2SO4, as well as
a large excess of lauric or stearic acid (weight ratio CNC: acid = 1: 100) were added to the
reaction media. After total acetone evaporation, CNC were dispersed in melted lauric or stearic
acid, which thus acted as the reaction solvent, and the system was let under stirring for 8 h. At
the end of the reaction, CNC were extensively washed with ethanol by successive centrifugation
cycles (10000 rpm, 25 °C, 15 min). The recovered modified CNC-g-lauric acid or CNC-g-
stearic acid in ethanol were then stored in a hermetically closed container until further use. The
chemical characterization of the surface grafted CNC was reported in Le Gars et al. (2020) [32].
The determined by XPS and solid-state 13C NMR the degree of surface substitution to equal to
0.14 for lauric acid and 0.35 for stearic acid. The surface esterification increased the of the
water contact angle to 80° ± 2 for lauric and 82° ± 4 for the stearic acid. The crystallinity index
was calculated from XRD analysis using the Segal height peak method [34] and was equal to
83 % for both acids, and the nanosized structure was confirmed by TEM analysis.
2.3. Nanocomposite preparation
PLA pellets and CNC powder were stored in a closed desiccator at room temperature containing
silica gel. Additionally, the CNC powder was vacuum-dried for 2 days at 80 °C prior to solution
preparation. The moisture content after drying was approximately 4 wt.% as determined by
thermogravimetric analysis.

8
A solution of 10 wt.% PLA was prepared by dissolution of the pellets in CH2Cl2 at room
temperature for 12 hours. Dry unmodified CNC were dispersed in CH2Cl2 and sonicated using
an ultrasound homogenization (Vibra-CellTM Ultrasonic liquid processor, Sonics & Materials,
USA) (10 kJ/g of CNC) [35], while surface-modified CNC were solvent exchanged and
suspended in CH2Cl2, followed by a sonication at the same energy. The suspension was kept in
an ice bath to avoid solvent evaporation. The dispersion of CNC was controlled before used
with the help of dynamic light scattering (DLS) instruments (Malvern Instruments, UK) to
ensure the nanometric character of the solution. PLA solution and CNC suspension were mixed
using a homogenizer (Ultra-Turrax, IKA) for approximately 5 min. The sonication was
performed to ensure the complete homogenization and to extract any air bubbles from the
mixture. The final mixture was then cast into Teflon Petri dishes and left under the laboratory
hood at room temperature for 48 h. The films were removed from the Petri dishes and put in a
vacuum oven at 60 °C for 24 h for further drying. PLA/CNC mixtures, PLA/CNC-g-stearic acid
or lauric acid containing 0, 5, 10, 30 and 50 wt.% of cellulose nanocrystals were prepared. The
CNC percentage is based on the total weight of dried materials (PLA/CNC), after solvent
evaporation. Since the proportion of the grafted polymer (PGMA) was estimated to 50 wt.%,
the used modified-CNC weight was based on the CNC weight-fraction alone, i.e., for 1 mg of
CNC, 2 mg of CNC-g-PGMA were used in the fabrication of nanocomposites.
A hot press (Gibitre Instruments, Italy) was used to prepare the final nanocomposites. The films
obtained from solvent casting were sandwiched between two Teflon sheets in a 100 µm mold.
The set up was then pressed at 180 °C and 150 bar for 3 min. After pressing, the samples were
cooled down to room temperature. The compressed PLA/CNC samples were denominated as
PLA/X%CNC, where X represents concentration of CNC, e.g. PLA/10% CNC indicated a film
containing 90 wt.% PLA and 10 wt.% CNC.
2.4. Nanocomposite characterization
2.4.1. Scanning Electron Microscopy (SEM)
9
The morphology evaluation of the cross-sections obtained by cryo-fracture was studied using
an EVO MA10 SEM from Zeiss with a tungsten electrode, under an acceleration voltage of 15
kV. Specimens were sputtered with a thin layer of gold. Image acquisition was performed using
SmartSEM User Interface software. All measurements from the images were recorded and
analyzed using the software ImageJ.
2.4.2. Transmission Electron Microscopy (TEM)
UltraThin PLA/CNC film sections (≈ 70 nm) were obtained by using a microtome (Leica EM
UC6) equipped with a DiATOME Diamond knife. The obtained sections were placed on TEM
Copper grids coated with amorphous carbon, after brief plasma treatment (glow discharge).
TEM images acquisition was performed on CERMAV’s Microscopy platform (NanoBio-
IMCG, Grenoble, France), by the means of the Transmission Electron Microscope FEI/Philips
CM200. The used acceleration voltage was 200 kV and the images were recorded thanks to a
TVIPS TemCam F216 digital camera.
2.4.3. Dynamic Light Scattering (DLS)
Dynamic light scattering measurements were performed using a MasterSizer 2000 (Malvern
Instruments, UK). Suspensions of modified and unmodified CNC were prepared and set at 10−2
wt.% concentration in the used dispersant. The size distribution of nanocellulose particles was
measured in different solvents as dispersants: water, ethanol, acetone, and CH2Cl2 (with a
respectively refractive index of 1.333, 1.361, 1.36, and 1.424 at 25.0 °C).
2.4.4. Modulated Temperature Differential Scanning Calorimetry (TM-DSC)
Thermal characterization was performed using temperature modulated differential scanning
calorimeter (TM-DSC Q100) from TA Instruments (France). The N2 flow was 50 mL min-1.
The apparatus was calibrated in temperature and energy using Indium. The specific heat
capacity (Cp) for each sample was calibrated using a sapphire reference. The modulation mode
was heat-only with an oscillation amplitude of 0.318 °C, a period of 60 s and a heating rate of
2 °C min-1. The samples (3 ± 1 mg) were placed in TZero aluminum pans. Before the

10
measurements, the dried films were stored in a desiccator at room temperature for at least one
week over silica gel. The measurements were duplicated to ensure repeatability.
2.4.5. Thermogravimetric Analysis (TGA)
Thermal degradation of PLA, CNC and PLA/CNC nanocomposites was determined by
thermogravimetric analysis using a TGA Q500 from TA Instruments. This instrument was
weight-calibrated with standards of 100 mg and 1 g. A temperature calibration was performed
at room temperature, using the Curie temperature of Nickel. Scanning conditions were set from
room temperature to 350 °C, using the High-Resolution (Hi-Res) mode with standard settings.
This method allows to separate closely occurring events and transitions thanks to a dynamic
heating rate. The equipment automatically reduces the heating rate near zero, when it detects a
weight change and accelerates again when the weight change is over. The evaporation of
molecules with one characteristic temperature happens therefore in nearly isothermal mode.
The used samples had a mass of 10 ± 2 mg and were tested under N2 flow. The determination
of modified CNC concentration in the dichloromethane solution after the solvent exchange was
determined by thermogravimetric analysis using a TGA Q500 from TA Instruments. Scanning
conditions were set from room temperature to 150 °C, using a Hi-Res mode, under N2 flow.
The samples were sealed in DSC capsules with a perforated lid and frozen using liquid nitrogen
before placed on the sample holder platform to avoid premature solvent evaporation. All
measurements were duplicated.
2.4.6. Dynamic Mechanical Analysis (DMA)
Thermomechanical properties of the samples were measured thanks to a DMA Q800 (TA
Instruments, France). The samples were conditioned in a desiccator at room temperature and
rejuvenated at 70 °C for 30 min prior to the tests. The dimensions of the tested samples varied
between 90 and 190 µm thickness, 5 ± 0.5 mm width and 13 ± 2 mm length. The operation
mode used was tensile at a frequency of 1 Hz, a heating ramp from 30 to 180 °C, using a heating
rate of 3 °C min-1. To guarantee that the mechanical response was within the linear viscoelastic
11
region, an amplitude sweep was carried out in the glassy (at 30 °C) and the rubbery state (at
65 °C) of PLA and the maximum strain amplitude of 0.1 % was selected.
3. Results and discussion
3.1. Thermo-degradation properties of PLA/CNC nanocomposites
Typical melt processing temperatures of PLA range between 150 and 180 °C [6], and our
sample preparation method involved heat-treatment at 180 °C. Therefore, we tested the thermal
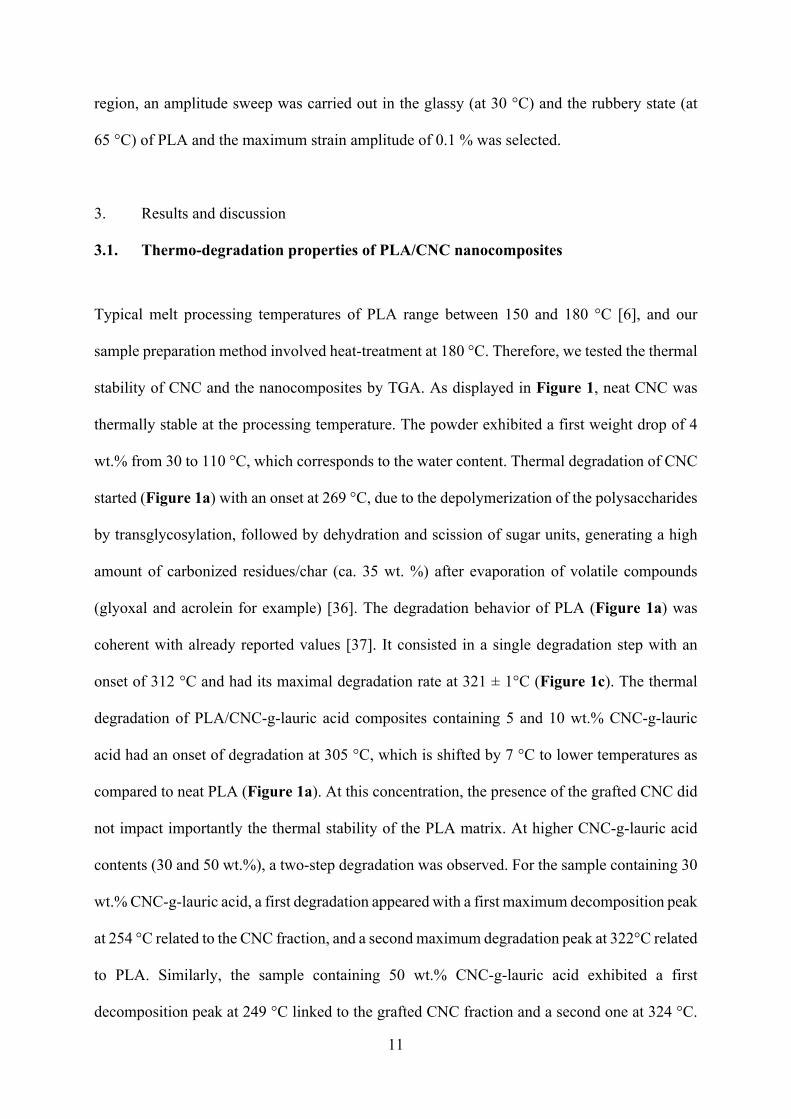
stability of CNC and the nanocomposites by TGA. As displayed in Figure 1, neat CNC was
thermally stable at the processing temperature. The powder exhibited a first weight drop of 4
wt.% from 30 to 110 °C, which corresponds to the water content. Thermal degradation of CNC
started (Figure 1a) with an onset at 269 °C, due to the depolymerization of the polysaccharides
by transglycosylation, followed by dehydration and scission of sugar units, generating a high
amount of carbonized residues/char (ca. 35 wt. %) after evaporation of volatile compounds
(glyoxal and acrolein for example) [36]. The degradation behavior of PLA (Figure 1a) was
coherent with already reported values [37]. It consisted in a single degradation step with an
onset of 312 °C and had its maximal degradation rate at 321 ± 1°C (Figure 1c). The thermal
degradation of PLA/CNC-g-lauric acid composites containing 5 and 10 wt.% CNC-g-lauric
acid had an onset of degradation at 305 °C, which is shifted by 7 °C to lower temperatures as
compared to neat PLA (Figure 1a). At this concentration, the presence of the grafted CNC did
not impact importantly the thermal stability of the PLA matrix. At higher CNC-g-lauric acid
contents (30 and 50 wt.%), a two-step degradation was observed. For the sample containing 30
wt.% CNC-g-lauric acid, a first degradation appeared with a first maximum decomposition peak
at 254 °C related to the CNC fraction, and a second maximum degradation peak at 322°C related
to PLA. Similarly, the sample containing 50 wt.% CNC-g-lauric acid exhibited a first
decomposition peak at 249 °C linked to the grafted CNC fraction and a second one at 324 °C.
12
Composites containing CNC-g-stearic acid showed two degradation steps. PLA/10%CNC-g-
stearic acid showed a first weight loss at 298 °C, followed by a second one at 309 °C, while the
sample containing 30 wt.% exhibited a first degradation peak at 282 °C then 318 °C. Similarly
to the lauric acid-modified CNC nanocomposites, the first drop was associated to the grafted
CNC fraction and the latter to the PLA fraction. The thermal stability of the grafted CNC is
lower compared to neat CNC, most probably because of the lower degradation temperature of
the fatty acids (see supplementary information). The degradation temperature was however still
higher than 180 °C, the processing temperature. With the help of the degradation data, we
calculated the effective weight percentage of grafted CNC, which amounted to the theoretical
weight percentage ± 3 wt.% (see supporting information for detailed table).
Figure 1. TGA and DTGA curves of PLA/CNC nanocomposites grafted with lauric or stearic acid (a, c) and PGMA (b, d).
13
Figure 1b shows the thermograms of PLA/CNC-g-PGMA nanocomposites. Similar to the
previous results, at small concentrations, no impact on the degradation temperature of PLA was
observed. The samples containing higher CNC contents exhibited degradations of at least two
steps: a continuous weight loss from 220 °C to 300 °C, and from 190 °C to 295 °C, respectively
for 10 and 30 wt. %, which can be associated to CNC-g-PGMA. In conclusion, TGA results
showed that the included CNC at high percentage decreased the thermal stability of PLA, but
the degradation onset temperatures were still higher than commonly used melt processing
temperatures and the thermal treatment temperature of the sample preparation method.
3.2. Morphological analysis of CNC and nanocomposites
Figure 2a shows the estimation of the size of CNC and grafted CNC by DLS in aqueous
suspension and acetone. DLS analysis overestimates the size of the modified CNC particles,
because the shape factor of the cylindrical particles cannot be accounted for. Therefore, DLS
was used only on a comparative basis between modified and unmodified CNCs. The
quantification of the data is reported in Table 1. The commercial CNC can be efficiently
dispersed in water and the size is consistent with literature data on CNC from wood and the
commercial data sheet [35, 38]. The casting procedure for the fabrication of the nanocomposites
needs a solvent exchange towards less polar media, because grafted CNC and PLA cannot be
dispersed in water. For that purpose, the choice of the proper solvent, here acetone, was done
using Hildebrand’s solubility parameters as proposed by Bruel et al. (2018) [39]. Water has a
high dispersion power for neat CNC because it can break efficiently hydrogen bonds and
stabilize negatively charged CNC particles. After compatibilization, most hydroxyl groups are
engaged in the ester bond with lauric or stearic acid, which decreased the dispersibility in water,
but increased it in organic solvents. When native CNC is solvent exchanged to acetone, which

14
is still a quite polar organic solvent, the average size increased due to slight aggregation.
Moreover, surface esterification of CNC increased the average size of CNC (Table 1).
Table 1. Morphological analysis of modified and unmodified CNC by DLS, TEM and SEM.
DLS TEM
Samples Degree of
substitution (DS)
Apparent CNC length
(nm)
Polydi-spersity index
CNC length (nm)
CNC diameter (nm)
Percolation threshold (Vol.%)
Percolation threshold
(wt.%)
Hydrated CNC CelluForce - 120 0.36 186 ± 42 8 ± 1 3.01 ± 35 % 3.85
CNC CelluForce in acetone (solvent-
exchanged) - 307 0.14 - - - -
CNC-g-lauric acid in acetone 0.14 [32] 386 0.25 309 ± 69 29 ± 15 6.57 ± 74 % 8.4
CNC-g-stearic acid in acetone 0.35 [32] 405 0.31 351 ± 73 31 ± 16 6.18 ± 71 % 7.9
CNC-g-PGMA in CH2Cl2 0.2 [25] 164 - - - -
For exacter analysis, TEM pictures of CNC and grafted CNC were taken (Figure 2b-d) and the
quantification of the sizes is given in Table 1. Figure 2b shows a majority of isolated CNC
particles with an average length of 186 nm and a diameter ranging from 6 to 10 nm. After
esterification, the isolated particles maintained a similar length, and formed only small
aggregates composed of less than 5 parallel rods. The modified CNC exhibited slight
agglomeration, the rod-like modified particles seemed to form small groups of CNC, organized
in parallel, which might be linked to the remaining hydroxyl groups on the CNC surface. We
took into consideration this agglomeration in the quantification for the size of the CNC particles
(Table 1). PGMA-grafted CNC could not be observed by TEM due to the immediate
agglomeration of the CNC on the TEM grids after solvent evaporation. Therefore, we used the
DLS measurements of Le Gars et al. (2020) [25] in order to compare the hydrodynamic
diameter of CNC before and after compatibilization. CNC-g-PGMA exhibited better dispersion
in acetone in comparison to the esterified CNCs.

15
Figure 2. (a) DLS curves of unmodified CNC in water and acetone, and modified CNC in acetone. TEM images of (b) unmodified CNC in water, (c) CNC-g-lauric acid in acetone, and (d) CNC-g-stearic acid in acetone. The aspect ratio [40], the nature of the bonds linking the particles [4], and the particles
orientation [41] are critical parameters determining the percolation threshold in the matrix.
Favier et al. (1997) [7] introduced the following relationship for the calculation of the
geometrical percolation threshold of CNC for random orientation:
𝑉!" =#.%& '(
, Equation (1)
where Vrc is the critical volume of percolation, and L and w the length and diameter of the CNC
(aspect ratio = L/w). Vrc and the corresponding theoretical mass percentage for geometric
percolation are presented in Table 1. The percolation threshold of the surface grafted CNC was
higher than that of the pristine CNC. The dispersion of neat and surface-grafted CNC particles
after their incorporation in the PLA matrix was analyzed by observation of the cryofracture

16
surfaces thanks to SEM measurements. Cross-sections are in Figure 3a. Neat PLA showed
typical a regular and uniform cross-section due to brittle fracture. Figure 3b shows the cross-
section of a sample containing 10 wt.% CNC. An increase of coarseness and aggregations can
be noticed due to low adhesion between CNC and PLA, as inferred from the cavities observed
at the interface. CNC aggregated and the size of the majority of the aggregates was around 4
µm.

17
Figure 3. SEM micrographs showing cryo-fractured cross-sections of PLA films containing (a) neat PLA, (b) 10 wt.% CNC, (c) 5 wt.% CNC-g-lauric acid, (d) 10 wt.% CNC-g-lauric acid, (e) 30 wt.% CNC-g-lauric acid, (f) 50 wt.% CNC-g-lauric acid, (g) 10 wt.% CNC-g-stearic acid, (h) 30 wt.% CNC-g-stearic acid. Scale bars represent 2 µm. In comparison to the PLA/CNC composites, optical inspection of nanocomposites containing
surface-modified CNC (see photos in supporting information) showed fully transparent and
shiny films, even at high inclusion concentration. Figures 3c-f show SEM micrographs of
PLA/CNC-g-lauric acid nanocomposites. No CNC-g-lauric acid aggregates were observed.
However, it can be noticed the presence of spherical particles when the CNC-g-lauric acid
contents increased. This aspect has been previously described as a sign of good dispersion of
CNC particles in a chemically compatible matrix [42]. The sample containing CNC-g-stearic
acid showed high similarities with CNC-g-lauric acid, as can be seen in Figures 3g-h.
Consequently, the length of the grafted chain (12 vs. 18-carbon atom chain for lauric and stearic
acid respectively) did not seem to influence the morphology nor the dispersion state of the CNC
particles within the PLA matrix.
Figure 4. SEM micrographs showing cryofractured cross-sections of PLA/CNC-g-PGMA films containing (a) 2 wt.% (b) 5 wt.% (c) 10 wt.% and (d) 30 wt.%. Scale bars represent 2 µm.

18
Figure 4 presents the cross-sections of the obtained nanocomposites containing CNC-g-PGMA.
SEM micrographs show small aggregates and a distinguishable network-shaped structure,
which became predominant as the filler amount increased. This architecture might be caused
by crosslinking, because PGMA carries highly reactive pendant epoxy functions. Crosslinking
could generate a 3-D network either between the CNC-g-PGMA particles [25], or between
PGMA and PLA because of a probable reaction between the PLA hydroxyl groups and the
PGMA epoxy groups. This type of reaction was already observed in similar systems [43]. The
morphology of CNC-g-PGMA was characterized by Le Gars et al. (2020) [25]. The samples
presented a homogenous dispersion of the CNC-PGMA structures and no signs of decohesion
at interfaces.
The resolution of the SEM experiment was not enough to observe nanometric particles;
therefore, TEM experiments were carried out. Because of the similarity of the morphology of
PLA/CNC-g-lauric acid and PLA/CNC-g-stearic acid, the TEM observations were only
conducted on the PLA/CNC-g-lauric acid and PLA/CNC-g-PGMA samples. The results are
presented in Figure 5. Figure 5a shows that neat CNC formed large aggregates (around 4 µm),
which is consistent with the SEM observations (Figure 3). In addition to these large aggregates,
small structures of approximately 1 µm length were observed, showing a certain efficiency of
dispersion of the casting procedure. Both CNC-g-PGMA (Figure 5b-c) and CNC-g-lauric acid
(Figure 5d-f) particles showed far better dispersion and distribution in the PLA matrix
compared to the reference (Figure 5a) and very homogeneous dispersion of CNC-g-lauric acid
even at very high concentration. The dark zones with a typical size between 0.5 and 3 µm in
the PLA/CNC-g-PGMA composites (Figure 5b-c) were attributed to crosslinked clusters of
CNC-g-PGMA and the contrast in properties between PLA and PGMA. The inclusion
concentration of the grafted particles was calculated with respect to the quantity of CNC.
Therefore the 30 wt.% CNC-g-PGMA samples contained 54 wt.% PLA, 23 wt.% CNC and 23
wt.% PGMA. Attentive observation of the PGMA phase showed that CNC were more
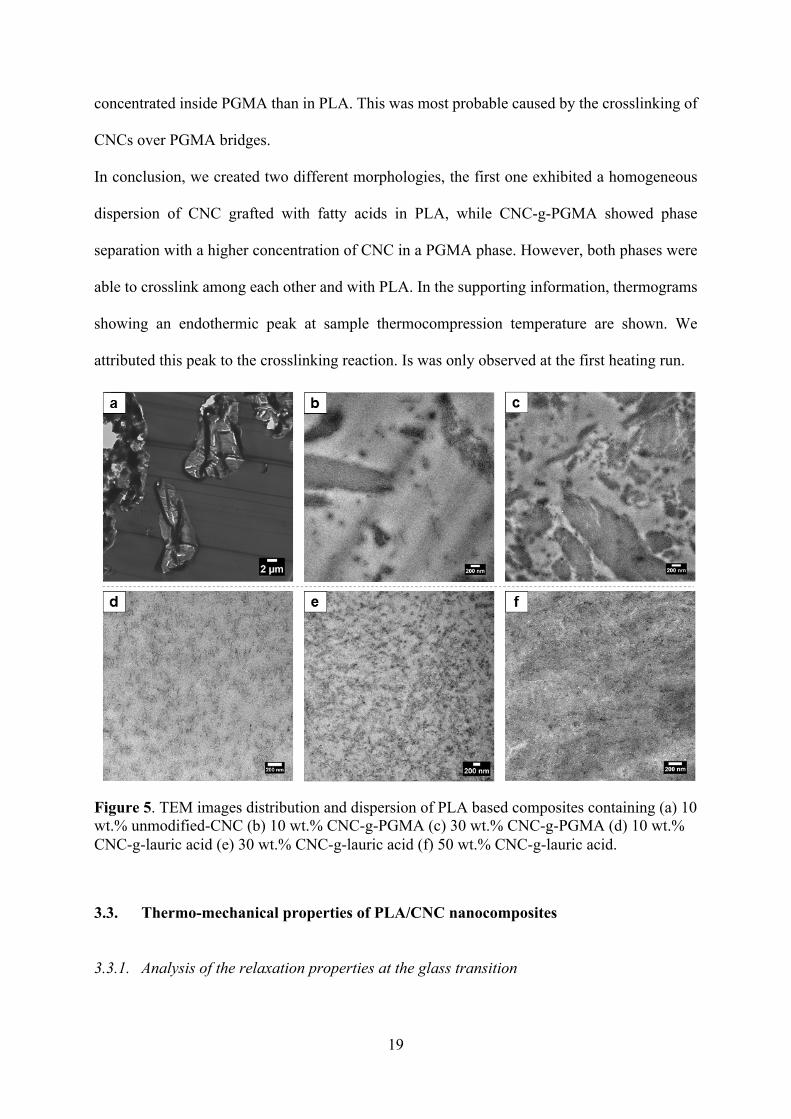
19
concentrated inside PGMA than in PLA. This was most probable caused by the crosslinking of
CNCs over PGMA bridges.
In conclusion, we created two different morphologies, the first one exhibited a homogeneous
dispersion of CNC grafted with fatty acids in PLA, while CNC-g-PGMA showed phase
separation with a higher concentration of CNC in a PGMA phase. However, both phases were
able to crosslink among each other and with PLA. In the supporting information, thermograms
showing an endothermic peak at sample thermocompression temperature are shown. We
attributed this peak to the crosslinking reaction. Is was only observed at the first heating run.
Figure 5. TEM images distribution and dispersion of PLA based composites containing (a) 10 wt.% unmodified-CNC (b) 10 wt.% CNC-g-PGMA (c) 30 wt.% CNC-g-PGMA (d) 10 wt.% CNC-g-lauric acid (e) 30 wt.% CNC-g-lauric acid (f) 50 wt.% CNC-g-lauric acid.
3.3. Thermo-mechanical properties of PLA/CNC nanocomposites
3.3.1. Analysis of the relaxation properties at the glass transition

20
The effect and properties of the interface between compatibilized nanoparticles and polymer
matrix is largely discussed in literature. The segmental relaxation of macromolecular chains
near the nanoparticle surfaces can be impacted and cause a behavior different from the bulk
properties. Because the nanoparticles develop an important surface, the result of these changes
can be observed at a macroscopic scale, for example by a shift of the glass transition temperature
[44-47]. A shift of Tg to higher temperatures can be attributed to the presence of wettable
surfaces, whereas the shift to lower temperatures would be characteristic of non-wetted
surfaces; no change can be expected for weak [44, 48]. We used TM-DSC as a dynamic analysis
method without load to characterize the glass transition and relaxation of PLA/CNC
nanocomposites with or without surface grafting.

21
Figure 6. TM-DSC curves displaying reversing and non-reversing normalized Cp in the glass transition region for PLA/CNC nanocomposites.
The TM-DSC curves, presented in Figure 6, show the glass transition region of PLA and its
nanocomposites, displaying the reversing and non-reversing heat capacity curves obtained
using Reading’s method [49]. A small overshoot is observed in some samples on the low
temperature side of the glass transition. This phenomenon can be explained by a kinetic
imbalance caused by very high samples cooling rates (quenching after heat treatment of the
films to room temperature) and slow heating rate during the analysis (2 °C min-1). The observed

22
values of the Tg measured at the half-height of the glass transition step in Figure 6 are given in
Table 2. TM-DSC is a dynamic measurement, therefore the dynamic glass transition
temperature (Ta) can be observed as the peak of the non-reversing Cp signal (Figure 6b,d,f). It
shifted a few degrees towards lower temperatures for the PLA/CNC-g-stearic acid
nanocomposites, which indicated weak interactions between PLA and the CNC surface
combined with plasticization of the PLA by stearic acid. There seems to be a phase separation
at 30 wt.% of CNC-g-stearic acid, where a peak in the non-reversing Cp is found at
approximately 48 °C and a second one at 53 °C, the latter corresponding to the Ta of the bulk
PLA. In the case of PLA/CNC-g-lauric acid nanocomposites, the position of Ta increased
slightly to higher temperatures. This would be still indicative of weak but wetting interactions
[44]. The width of the non-reversing Cp peaks increased, which could be also indicative of weak,
but existing interactions between CNC surfaces and PLA inducing higher heterogeneity of
relaxation times during the glass transition. The CNC-g-PGMA also caused a small reduction
of the Ta, which might be caused by the PGMA. The measurement of the Tg of PGMA
polymerized with the protocol applied for CNC grafting amounted to 56 °C (TM-DSC curves
are given in the supporting information). In this case, the width of the non-reversing Cp peaks
was constant, which would indicate that possible impacts of the PLA-PGMA crosslinking
cannot be observed by TM-DSC. This is coherent with the observation by TEM (Figure 5b,c)
showing that the CNC are more concentrated in the PGMA phase than in the PLA.
The heat capacity step ∆Cp was measured at the glass transition (Table 2). The value of the neat
PLA was very similar to the value reported in the literature for a completely amorphous PLA,
0.51 J/(g °C), although the authors used a different type of PLA [50, 51]. Within the limits of
uncertainties, no clear changes in ∆Cp could be observed, so we can conclude that all the
samples were amorphous.

23
Table 2. Glass transition Tg,mid (measured at mid-point), Tα (measured at the peak of the non-reversing signal), ∆Cp (heat capacity step), and normalized heat capacity step of PLA and PLA/CNC nanocomposites
CNC Content
(wt. %) Tg,mid (°C) Ta (°C) ∆Cp (J/(g.°C)) Normalized ∆Cp (J/(g.°C))
PLA/ C
NC
0 53 ± 1 52 0.464 ± 0.02 0.464
10 54 53 0.378 0.42 PLA/CN
C-g-lauric acid
5 53 51 0.434 0.457
10 53 52 0.422 0.467
30 54 53 0.334 0.476
50 53 53 0.279 0.558
PLA/CN
C-g-stearic
acid
5 52 51 0.517 0.544
10 52 51 0.446 0.496
30 52 48 0.329 0.469
PLA/CN
C-g-PG
MA
2 54 52 0.458 0.467
5 53 53 0.480 0.506
10 53 52 0.449 0.499
30 53 52 0.377 0.538
3.3.2. Analysis of the thermo-mechanical properties and CNC percolation
The relaxation properties of the nanocomposites under mechanical load were analyzed using
DMA. Because of the morphological similarity of CNC-g-stearic acid and CNC-g-lauric acid
and the small shift of Ta to higher temperatures, only the latter type of esterified CNC was
investigated in further detail and compared to the effects obtained by crosslinking of PLA and
CNC-g-PGMA. Figure 7 summarizes typical experimental curves for the storage modulus and
the dissipation factor (tan delta).

24
Figure 7. Storage modulus E’ and tan delta as a function of temperature for PLA/CNC-g-lauric acid (left) and PLA/CNC-g-PGMA (right) nanocomposites.
The DMA curves of PLA confirmed the amorphous character and the absence of crystallization
which would cause an increase in the storage modulus in the rubbery plateau. Loading PLA
with 10 wt.% of CNC had no observable impact on the storage moduli of the materials, while
loading with 30 wt.% CNC increased slightly the moduli (Figure 7a,c). The PLA/CNC-g-lauric
acid nanocomposites (Figure 7a,c) showed no differences in the behavior of the glass transition
compared to neat PLA, except for the CNC-g-lauric acid concentration of 30 wt.%. For this
content, the glass transition seemed to be composed of two steps: the first drop started at Tonset
= 63 °C, which is compatible with the dynamic glass transition of PLA, the second drop started
at Tonset = 76 °C. We suggest that this might be caused by two distinct phases where the first
step would concern bulk PLA and the second would be related to an amorphous phase which is
hindered in its relaxation by the presence of the nanoparticles with attractive, wetting surfaces

25
[44]. The result is coherent with the MT-DSC data (Figure 6b), which showed broadening of
the glass transition region at quantities of CNC higher than the geometric percolation threshold
(here 9 wt. %, Table 1). It was also observed by other authors, that the inclusion of CNC at
concentrations higher than the percolation threshold induces broadening of the glass transition
[33, 52, 53]. Figure 7b, d shows the DMA curves of the PLA/CNC-g-PGMA nanocomposites.
The onset of the glass transition decreased linearly with increasing concentration of the CNC-
g-PGMA (Figure 7b,d), but the effect was very small, as already observed in (Figure 6f). The
small shift of Tα could be indicative of a weak interaction between PGMA and PLA or of the
impact of PGMA to the overall behavior. Because of the overlap of the glass transition region
of PLA and PGMA, the individual Tα of each polymer could not be distinguished.
Figure 7 shows the increase of the elastic modulus of the PLA nanocomposites in the glassy
and in the rubbery plateau with increasing volume fraction of the compatibilized CNC. The
values for the glassy plateau were taken at 40 °C. Because PLA/CNC-g-lauric acid
nanocomposites flowed shortly after the glass transition, the values were taken in the range of
80 to 85 °C, which overestimated the effective modulus of the rubbery plateau. The inclusion
of 30 wt.% (27.6 vol.%) of CNC-g-lauric acid improved the glassy modulus of the materials by
a factor 2.4 and the rubbery modulus by a factor 150. Surface grafted CNC are therefore a
performing reinforcement of PLA. The inclusion of CNC-g-PGMA in PLA resulted in smaller,
but still important reinforcement factors. The glassy modulus increased by a factor 2.2 and the
rubbery modulus by a factor around 40. A comparative figure summarizing the results can be
found in the supporting information. Very encouraging results of PLA/CNC-g-PGMA
nanocomposites showed that a high rubbery storage modulus can be maintained up to 110 °C
which indicated an improvement of the heat deflexion stability of PLA. This behavior can be
attributed to the crosslinking of CNC-g-PGMA and PLA.
Although surface modification of CNC particles and its influence on the mechanical properties
of nanocomposites is a subject of great interest, the impact of the surface modification on the
26
reinforcing effect, stiffness and formation of a percolation network within a matrix is still
scarcely discussed. The elastic modulus can be predicted using different models, such as the
Halpin-Tsai model classically used for short-fiber composites [54] or the Ouali model for
percolating fillers [9]. In both models the modulus of the filler is assumed to be much higher
than the modulus of the matrix, i.e. Em << Ef. The Halpin-Tsai model is generally used to
describe the modulus of composites using short fibers without interaction and oriented parallel
to the tensile direction [54]. The polymer matrix is considered to be an elastic continuum, with
a known modulus (Em) and Poisson ratio (υm). This model applies for non-percolating
systems:[55]
𝐸" = 𝐸)*+,(.!/*)1"/3*+(.!/*)45#/5$678
*/1"/3*+(.!/*)45#/5$67, Equation (2)
with E being the elastic modulus, and the subscripts m, f and c referring to matrix, filler and
composite, respectively, vr the filler volume fraction, kE is the Einstein coefficient, given by the
equation 3:
𝑘5 =:²
*< =>(%&), Equation (3)
where ρ is the aspect ratio, determined to be 12 for modified CNC and 20 for unmodified CNC
(Table 1).
The Ouali model is based on the series-parallel model of Takayanagi et al. (1964) [56] and
includes percolation effects on the reinforcement of the matrix moduli. It takes into
consideration three phases, i.e. the matrix, the percolating network and the non-percolating filler
phase [9]. The elastic modulus of the composite (Ec) is obtained following the equation:
𝐸" =(*/?@+@1")5#5$+(*/1")@5$
&
(*/1")5$+(1"/@)5#, Equation (4)
where Ψ is an adjustable parameter that is associated to the percolated filler fraction, given by:
Ψ = 0for𝑣! < 𝑣!" , Equation (5)
and
Ψ =𝑣! -1"/1"'*/1"'
.Afor𝑣! > 𝑣!" , Equation (6)

27
where b is the critical percolation exponent, corresponding to the value of 0.4 for a 3-D network,
according to Stauffer & Aharony (1992) [57] and vrc is the percolation threshold.
Figure 8. Logarithm of storage modulus, for PLA and PLA/CNC-g-lauric acid and PLA/CNC-g-PGMA films, in the glassy (40 °C) and rubbery (80-85 °C) state. Comparisons between measured data (points) and data predicted by the Halpin Tsai model (dashed line) and the Ouali model (full line). Aspect ratio was taken equal to 11.6 for grafted CNC and 2.5 for pristine CNC. Light blue and red represent models with Ef =150 GPa and dark blue and red Ef = 7 GPa. The two calculations of the Halpin-Tsai model in the rubbery state superposed.
Figure 8 shows the fit of the Halpin-Tsai and the Ouali models to the experimental data in the
glassy (Figure 8a,c) and the rubbery region (Figure 8b,d) as a function of the CNC volume
fraction. The Ef value of the CNC and its network are difficult to determine, but different values

28
are given in the literature. We show here the computed model results assuming Ef = 150 GPa
[7]. This value was calculated from the C-bonds in the CNC particles [58]. Figure 8 presents
furthermore model calculations assuming Ef =7 GPa [59]. This value would correspond to the
modulus of a CNC sheet. Both moduli were set independent from temperature.
Assuming Ef =150 GPa [7], the Halpin-Tsai model described satisfyingly the evolution of E’ in
the glassy region of the PLA/CNC-g-lauric acid and PLA/CNC-g-PGMA nanocomposites
(Figure 8a,c). The addition of CNC at low concentrations (5 and 10 wt.%) had no significant
effect considering the uncertainties of the measurements (an error of 3 % on thickness results
in an error of 10 % on the modulus). Assuming Ef =7 GPa [59], the Halpin-Tsai model failed
to describe the evolution of the nanocomposites’ moduli with increasing volume fraction,
although the model was not very sensitive to the Ef value (calculations with different values are
shown in the supporting information). We concluded that this lack of sensitivity is caused by
the relatively small difference of E’ between PLA and CNC in the glassy plateau. In the rubbery
plateau (Figure 8b,d), the Halpin-Tsai model failed to describe the experimental data whatever
the assumed Ef value. There was a clear change of E’ between 8.51 and 27.6 vol% of grafted
CNC, which would be indicative of the percolation of the CNC network. Similar conclusions
were already drawn [8], when they noticed a higher reinforcement of the materials than
predicted. As discussed before in the morphology section, the percolation threshold of CNC-g-
lauric acid amounted to 6 vol. % and the one of neat CNC to 3.3 vol% (Table 1).
The Ouali model prediction was calculated in the glassy and the rubbery plateau using the Ef
value of CNC single particles and the one of CNC sheets (Figure 8b,d). Clearly, the Ouali
model failed to describe experimental data in the glassy plateau. We suppose that the small
differences in modulus between CNC and PLA are the reason of that. The Ouali percolation
model is indeed highly dependent on the Ef value, and a change in the aspect ratio has no impact
on modulus once percolation is reached (examples are shown in the supporting information).
In the rubbery plateau, the Ouali model using Ef = 7 GPa came closer to experimental values of

29
PLA/CNC-g-lauric acid and PLA/CNC-g-PGMA nanocomposites. In the percolation theory,
the filler-filler interactions are important. Dufresne (2012) [4] proposed, based on the work of
Favier et al. (1995) [8], that the percolation network of CNC is bridged by the strong
interactions between particles over hydrogen bonds. Modification of the hydroxyl groups on
the CNC surface would diminish the capability to form inter-particle hydrogen bonds and
therefore shift the percolation threshold towards higher contents [12]. A possible shift of the
percolation to higher values that the one predicted in Table 1 cannot be inferred due to the lack
of experimental data. The surface modification would also diminish the capacity to establish
H-bonds between single CNC and therefore weaken the percolated network. As a consequence,
the observed reinforcement effect is much lower than predicted. This would explain why the
hypothesis Ef = 7 GPa came closer to the experimental values, especially to those of the
PLA/CNC-g-lauric acid nanocomposites. At low CNC content, the Ouali model failed to predict
observed evolution, because the matrix-filler interactions, filler orientation and dispersion are
neglected in the calculation of the overall mechanical properties [10]. The rubbery modulus of
the PLA/CNC samples was lower than that of the PLA/CNC-g-lauric acid and PLA/CNC-g-
PGMA samples (Figure 8b), which shows the impact of the surface compatibilization on the
elastic modulus. The rubbery moduli of the compatibilized systems increased nearly linearly
with the filler volume fraction. We suggest that this is caused by the weak positive interaction
between CNC-g-lauric acid surfaces and PLA, which weakens the CNC/CNC percolating
network but gives rise to stress transfer. The PLA/CNC-g-PGMA samples had lower elastic
moduli compared to the PLA/CNC-g-lauric acid nanocomposites. In this case, CNC were
concentrated in the PGMA phase (Figure 5b,c), which could decrease further the strength or
even prevent the establishment of a percolated CNC network. However, stress transfer between
PGMA and CNC would be increased and the system might be better described by a blend
morphology of a reinforced PGMA and a PLA phase.

30
4. Conclusion
Homogeneously dispersed amorphous bio-nanocomposites of polylactide and surface-grafted
cellulose nanocrystals were successfully produced by casting and compression molding with
concentrations up to 50 wt. % CNC particles. Two types of surface compatibilizer (fatty acids
and PGMA with reactive end-groups) were compared and their performance investigated in
terms of type of interaction with the PLA matrix and viscoelastic moduli below and above glass
transition. The underlying mechanisms were analyzed using the Ouali model for percolated
systems and the Halpin-Tsai model for composites with short fibers. The epoxy groups of CNC-
g-PGMA reacted among themselves and with PLA, which formed a phase separated system.
This system did not percolate and its mechanical performance was governed by the covalent
filler/matrix coupling. The CNC surface compatibilizing with fatty acids, which are abundant,
non-toxic, biobased and biodegradable molecules generated only in weak CNC/PLA
interactions. Nevertheless, the fatty acids were efficient dispersants of CNC in the matrix and
the gain in the rubbery elastic modulus was very important. This could be ascribed to
percolation, although the strength of the percolated network was imparted by the surface
grafting because it hindered of the establishment of inter-CNC H-bonds. We conclude that for
efficient surface compatibilization of CNC, the establishment of only weak CNC/PLA
interactions can result in performing materials. In our case, the system using fatty acids and a
quite simple and scalable surface grafting method complying with several principles of green
chemistry was the most efficient. It matched best with the overall aim of developing materials
with decreased environmental impact.
Acknowledgments
The authors ackowledge financial support from the French National Research Agency (ANR) for the national research project ANR-16-CE08-0040 – GASP. Supporting Information Supporting Information is available from the Wiley Online Library or from the author.

31
References [1] T. Owoyokun, C.M.P. Berumen, A.M. Luevanos, L. Cantu, A.C.L. Ceniceros, Cellulose Nanocrystals: Obtaining and Sources of a Promising Bionanomaterial for Advanced Applications, Biointerface Res. Appl. Chem., 11 (2021) 11797-11816. 10.33263/briac114.1179711816. [2] K. Dhali, M. Ghasemlou, F. Daver, P. Cass, B. Adhikari, A review of nanocellulose as a new material towards environmental sustainability, Sci. Total Environ., 775 (2021) 24. 10.1016/j.scitotenv.2021.145871. [3] A. Šturcová, G.R. Davies, S.J. Eichhorn, Elastic modulus and stress-transfer properties of tunicate cellulose whiskers, Biomacromolecules, 6 (2005) 1055-1061. 10.1021/bm049291k. [4] A. Dufresne, Nanocellulose: from nature to high performance tailored materials, de Gruyter, Berlin/Boston, 2012. [5] R. Rusli, S.J. Eichhorn, Determination of the stiffness of cellulose nanowhiskers and the fiber-matrix interface in a nanocomposite using Raman spectroscopy, Appl. Phys. Lett., 93 (2008) 033111. https://doi.org/10.1063/1.2963491. [6] H. Kargarzadeh, M. Mariano, J. Huang, N. Lin, I. Ahmad, A. Dufresne, S. Thomas, Recent developments on nanocellulose reinforced polymer nanocomposites: A review, Polymer, 132 (2017) 368-393. https://doi.org/10.1016/j.polymer.2017.09.043. [7] V. Favier, G.R. Canova, S.C. Shrivastava, J.Y. Cavaille, Mechanical percolation in cellulose whisker nanocomposites, Polym. Eng. Sci., 37 (1997) 1732-1739. [8] V. Favier, H. Chanzy, J.Y. Cavaille, Polymer Nanocomposites Reinforced by Cellulose Whiskers, Macromolecules, 28 (1995) 6365-6367. 10.1021/ma00122a053. [9] N. Ouali, J. Cavaillé, J. Perez, Elastic, viscoelastic and plastic behavior of multiphase polymer blends, Plastics, Rubber and Composites Processing and Applications (UK), 16 (1991) 55-60. [10] C. Miao, W.Y. Hamad, Critical insights into the reinforcement potential of cellulose nanocrystals in polymer nanocomposites, Curr. Opin. Solid State Mater. Sci., 23 (2019) 100761. https://doi.org/10.1016/j.cossms.2019.06.005. [11] W. Abdallah, M.R. Kamal, Cellulose Nanocrystals: Particles and Polymer Nanocomposites, in: Processing of Polymer Nanocomposites, Hanser, 2019, pp. 395-434. [12] G. Siqueira, J. Bras, A. Dufresne, Cellulose whiskers versus microfibrils: influence of the nature of the nanoparticle and its surface functionalization on the thermal and mechanical properties of nanocomposites, Biomacromolecules, 10 (2009) 425-432. https://doi.org/10.1021/bm801193d. [13] V. Ducruet, S. Domenek, Characteristics and applications of poly(lactic acid) in: S. Kalia, L. Averous (Eds.) Biodegradable and Bio-based Polymers: Environmental and Biomedical Applications, Scrivener Publishing LLC, Beverly, MA 2015, pp. 171-224. [14] S. Domenek, S. Fernandes-Nassar, V. Ducruet, Rheology, Mechanical Properties, and Barrier Properties of Poly(lactic acid), in: M.L. Di Lorenzo, R. Androsch (Eds.) Synthesis, Structure and Properties of Poly(lactic acid), Springer International Publishing, Cham, 2018, pp. 303-341. [15] S. Saeidlou, M.A. Huneault, H. Li, C.B. Park, Poly(lactic acid) Crystallization, Prog. Polym. Sci., 37 (2012) 1657-1677. https://doi.org/10.1016/j.progpolymsci.2012.07.005. [16] E. Vatansever, D. Arslan, M. Nofar, Polylactide cellulose-based nanocomposites, Int. J. Biol. Macromol., 137 (2019) 912-938. 10.1016/j.ijbiomac.2019.06.205. [17] E. Espino-Perez, S. Domenek, N. Belgacem, C. Sillard, J. Bras, Green Process for Chemical Functionalization of Nanocellulose with Carboxylic Acids, Biomacromolecules, 15 (2014) 5441-4560. 10.1021/bm5013458.

32
[18] D. Rigotti, R. Checchetto, S. Tarter, D. Caretti, M. Rizzuto, L. Fambri, A. Pegoretti, Polylactic acid-lauryl functionalized nanocellulose nanocomposites: Microstructural, thermo-mechanical and gas transport properties, Express Polym. Let., 13 (2019). https://doi.org/10.3144/expresspolymlett.2019.75. [19] J. Shojaeiarani, D.S. Bajwa, K. Hartman, Esterified cellulose nanocrystals as reinforcement in poly (lactic acid) nanocomposites, Cellulose, 26 (2019) 2349-2362. [20] S. Spinella, C.d. Samuel, J.-M. Raquez, S.A. McCallum, R. Gross, P. Dubois, Green and efficient synthesis of dispersible cellulose nanocrystals in biobased polyesters for engineering applications, ACS Sustain. Chem. Eng., 4 (2016) 2517-2527. https://doi.org/10.1021/acssuschemeng.5b01611. [21] B. Braun, J.R. Dorgan, L.O. Hollingsworth, Supra-Molecular EcoBioNanocomposites Based on Polylactide and Cellulosic Nanowhiskers: Synthesis and Properties, Biomacromolecules, 13 (2012) 2013-2019. 10.1021/bm300149w. [22] G. Lo Re, S. Spinella, A. Boujemaoui, F. Vilaseca, P.T. Larsson, F. Adås, L.A. Berglund, Poly (ε-caprolactone) Biocomposites Based on Acetylated Cellulose Fibers and Wet Compounding for Improved Mechanical Performance, ACS Sustain. Chem. Eng., 6 (2018) 6753-6760. [23] Y. Habibi, S. Aouadi, J.M. Raquez, P. Dubois, Effects of interfacial stereocomplexation in cellulose nanocrystal-filled polylactide nanocomposites, Cellulose, 20 (2013) 2877-2885. 10.1007/s10570-013-0058-5. [24] H. Wu, S. Nagarajan, L. Zhou, Y. Duan, J. Zhang, Synthesis and characterization of cellulose nanocrystal-graft-poly (d-lactide) and its nanocomposite with poly (l-lactide), Polymer, 103 (2016) 365-375. https://doi.org/10.1016/j.polymer.2016.09.070. [25] M. Le Gars, J. Bras, H. Salmi-Mani, M. Ji, D. Dragoe, H. Faraj, S. Domenek, N. Belgacem, P. Roger, Polymerization of glycidyl methacrylate from the surface of cellulose nanocrystals for the elaboration of PLA-based nanocomposites, Carbohydr. Polym., 234 (2020) 115899. https://doi.org/10.1016/j.carbpol.2020.115899. [26] E. Fortunati, M. Peltzer, I. Armentano, L. Torre, A. Jiménez, J. Kenny, Effects of modified cellulose nanocrystals on the barrier and migration properties of PLA nano-biocomposites, Carbohydr. Polym., 90 (2012) 948-956. https://doi.org/10.1016/j.carbpol.2012.06.025. [27] L. Petersson, I. Kvien, K. Oksman, Structure and thermal properties of poly(lactic acid)/cellulose whiskers nanocomposite materials, Compos. Sci. Technol., 67 (2007) 2535-2544. 10.1016/j.compscitech.2006.12.012. [28] W. Meesorn, A. Shirole, D. Vanhecke, L.M. de Espinosa, C. Weder, A simple and versatile strategy to improve the mechanical properties of polymer nanocomposites with cellulose nanocrystals, Macromolecules, 50 (2017) 2364-2374. https://doi.org/10.1021/acs.macromol.6b02629. [29] M. Nagalakshmaiah, F. Pignon, N. El Kissi, A. Dufresne, Surface adsorption of triblock copolymer (PEO–PPO–PEO) on cellulose nanocrystals and their melt extrusion with polyethylene, RSC Advances, 6 (2016) 66224-66232. 10.1039/c6ra11139d. [30] K. Gopalan Nair, A. Dufresne, A. Gandini, M.N. Belgacem, Crab shell chitin whiskers reinforced natural rubber nanocomposites. 3. Effect of chemical modification of chitin whiskers, Biomacromolecules, 4 (2003) 1835-1842. 10.1021/bm030058g. [31] E. Robles, I. Urruzola, J. Labidi, L. Serrano, Surface-modified nano-cellulose as reinforcement in poly (lactic acid) to conform new composites, Ind. Crops Prod., 71 (2015) 44-53. https://doi.org/10.1016/j.indcrop.2015.03.075. [32] M. Le Gars, P. Roger, N. Belgacem, J. Bras, Role of solvent exchange in dispersion of cellulose nanocrystals and their esterification using fatty acids as solvents, Cellulose, 27 (2020) 4319-4336. 10.1007/s10570-020-03101-0.

33
[33] E. Espino-Pérez, J. Bras, G. Almeida, C. Plessis, N. Belgacem, P. Perré, S. Domenek, Designed cellulose nanocrystal surface properties for improving barrier properties in polylactide nanocomposites, Carbohydr. Polym., 183 (2018) 267-277. https://doi.org/10.1016/j.carbpol.2017.12.005. [34] L. Segal, J.J. Creely, A. Martin Jr, C. Conrad, An empirical method for estimating the degree of crystallinity of native cellulose using the X-ray diffractometer, Text. Res. J., 29 (1959) 786-794. [35] Q. Beuguel, J.R. Tavares, P.J. Carreau, M.-C. Heuzey, Ultrasonication of spray-and freeze-dried cellulose nanocrystals in water, J. Colloid Interface Sci., 516 (2018) 23-33. https://doi.org/10.1016/j.jcis.2018.01.035. [36] F. Shafizadeh, A. Bradbury, Thermal degradation of cellulose in air and nitrogen at low temperatures, J. Appl. Polym. Sci., 23 (1979) 1431-1442. [37] M. Kumar, S. Mohanty, S. Nayak, M.R. Parvaiz, Effect of glycidyl methacrylate (GMA) on the thermal, mechanical and morphological property of biodegradable PLA/PBAT blend and its nanocomposites, Bioresour. Technol., 101 (2010) 8406-8415. https://doi.org/10.1016/j.biortech.2010.05.075. [38] Q. Beuguel, J.R. Tavares, P.J. Carreau, M.-C. Heuzey, Rheological behavior of cellulose nanocrystal suspensions in polyethylene glycol, J. Rheol., 62 (2018) 607-618. https://doi.org/10.1122/1.5010789. [39] C. Bruel, Q. Beuguel, J.R. Tavares, P.J. Carreau, M.C. Heuzey, The apparent structural hydrophobicity of cellulose nanocrystals, J-For, 7 (2018) 13-23. https://publications.polymtl.ca/4126/ [40] P.-G. De Gennes, On a relation between percolation theory and the elasticity of gels, Journal de Physique Lettres, 37 (1976) 1-2. [41] I. Balberg, N. Binenbaum, N. Wagner, Percolation thresholds in the three-dimensional sticks system, Phys. Rev. Lett., 52 (1984) 1465. [42] S. Krishna, C.M. Patel, Computational and experimental study of mechanical properties of Nylon 6 nanocomposites reinforced with nanomilled cellulose, Mech. of Mater., 143 (2020) 103318. https://doi.org/10.1016/j.mechmat.2020.103318. [43] Z.Q. Li, X.D. Zhou, C.H. Pei, Synthesis of PLA-co-PGMA copolymer and its application in the surface modification of bacterial cellulose, Int. J. Polym. Mater., 59 (2010) 725-737. 10.1080/00914037.2010.483214. [44] J. Jancar, J.F. Douglas, F.W. Starr, S.K. Kumar, P. Cassagnau, A.J. Lesser, S.S. Sternstein, M.J. Buehler, Current issues in research on structure-property relationships in polymer nanocomposites, Polymer, 51 (2010) 3321-3343. 10.1016/j.polymer.2010.04.074. [45] Y. Lin, L. Liu, G. Xu, D. Zhang, A. Guan, G. Wu, Interfacial interactions and segmental dynamics of poly (vinyl acetate)/silica nanocomposites, J. Phys. Chem. C, 119 (2015) 12956-12966. 10.1021/acs.jpcc.5b01240. [46] P. Rittigstein, R.D. Priestley, L.J. Broadbelt, J.M. Torkelson, Model polymer nanocomposites provide an understanding of confinement effects in real nanocomposites, Nat. Mater., 6 (2007) 278-282. 10.1038/nmat1870. [47] O. Yousefzade, J. Jeddi, E. Vazirinasab, H. Garmabi, Poly(lactic acid) phase transitions in the presence of nano calcium carbonate: Opposing effect of nanofiller on static and dynamic measurements, J. Thermoplast. Compos. Mater., 32 (2019) 312-327. 10.1177/0892705718759386. [48] P. Rittigstein, J.M. Torkelson, Polymer-nanoparticle interfacial interactions in polymer nanocomposites: Confinement effects on glass transition temperature and suppression of physical aging, J. Polym. Sci. Pt. B-Polym. Phys., 44 (2006) 2935-2943. 10.1002/polb.20925. [49] A.A. Lacey, D.M. Price, M. Reading, Theory and practice of modulated temperature differential scanning calorimetry, in: Modulated Temperature Differential Scanning Calorimetry, Springer, 2006, pp. 1-81.

34
[50] X. Monnier, A. Saiter, E. Dargent, Physical aging in PLA through standard DSC and fast scanning calorimetry investigations, Thermochim. Acta, 648 (2017) 13-22. https://doi.org/10.1016/j.tca.2016.12.006. [51] X. Cao, A. Mohamed, S. Gordon, J. Willett, D. Sessa, DSC study of biodegradable poly (lactic acid) and poly (hydroxy ester ether) blends, Thermochim. Acta, 406 (2003) 115-127. https://doi.org/10.1016/S0040-6031(03)00252-1. [52] L. Wei, U.P. Agarwal, L. Matuana, R.C. Sabo, N.M. Stark, Performance of high lignin content cellulose nanocrystals in poly(lactic acid), Polymer, 135 (2018) 305-313. https://doi.org/10.1016/j.polymer.2017.12.039. [53] Y. Yin, L.A. Lucia, L. Pal, X. Jiang, M.A. Hubbe, Lipase-catalyzed laurate esterification of cellulose nanocrystals and their use as reinforcement in PLA composites, Cellulose, 27 (2020) 6263-6273. [54] J. Halpin, J. Kardos, Moduli of crystalline polymers employing composite theory, J. Appl. Phys., 43 (1972) 2235-2241. [55] A.P. Chatterjee, A model for the elastic moduli of three-dimensional fiber networks and nanocomposites, J. Appl. Phys., 100 (2006) 054302. https://doi.org/10.1063/1.2336088. [56] M. Takayanagi, S. Uemura, S. Minami, Application of equivalent model method to dynamic rheo-optical properties of crystalline polymer, J. Polym. Sci., Part C: Polym. Symp., 5 (1964) 113-122. https://doi.org/10.1002/polc.5070050111. [57] D. Stauffer, Introduction to percolation theory/Dietrich Stauffer and Amnon Aharony, in, Taylor and Francis, London, 2nd ed., 1992. [58] K. Tashiro, M. Kobayashi, Theoretical evaluation of three-dimensional elastic constants of native and regenerated celluloses: Role of hydrogen bonds, Polymer, 32 (1991) 1516-1526. https://doi.org/10.1016/0032-3861(91)90435-L. [59] E. Limousin, I. Rafaniello, T. Schafer, N. Ballard, J.M. Asua, Linking Film Structure and Mechanical Properties in Nanocomposite Films Formed from Dispersions of Cellulose Nanocrystals and Acrylic Latexes, Langmuir, 36 (2020) 2052-2062. 10.1021/acs.langmuir.9b03861.

35
Supporting Information
A comparative study of the thermo-mechanical properties of
polylactide/cellulose nanocrystal nanocomposites obtained by two surface
compatiblization strategies Faraj1,2, Cyrille Sollogoub2, Alain Guinault2, Mathieu Gervais2, Julien Bras3, Hanène Salmi4, Philippe Roger4, Manon Le Gars3, Sandra Domenek1 1Université Paris-Saclay, INRAE, AgroParisTech, UMR SayFood, 91300, Massy, France 2Laboratoire PIMM, Arts et Metiers Instiute of Technology, CNRS, Cnam, Hesam Université, 151, Boulevard de l’Hôpital, F-75013 Paris Cedex, France 3Univ. Grenoble Alpes, CNRS, Grenoble INP, LGP2, F-38000 Grenoble, France 4Institut De Chimie Moléculaire Et Des Matériaux d’Orsay, Université Paris-Saclay, CNRS, 91405 Orsay, France Corresponding author: Sandra Domenek, UMR SayFood (Université Paris-Saclay, INRAE, AgroParisTech), 1 rue des Olympiades, 91300 Massy, France; [email protected] Particle size distribution of CNC powders
Fig. S.1 Micrograph of commercially purchased CNC ( Celluforce) aggregated particles with an average interval size of [2.00- 4.00[, with a histogram of CNC particle size distribution based on SEM micrograph.

36
Fig. S.2. Photos of the produced PLA/CNC-g-laurci acid and PLA/CNC-g-PGMA films.
DSC scans of PLA and nanocomposites
Fig. S.3. Normalized heat capacity for PLA and PLA/CNC-g-PGMA nanocomposites. It shows the glass transition of PLA at 56 °C superposed with the enthalpy of relaxation peak and a peak starting at approximately 140 °C, only observed in the first heating run. We attributed this peak to the crosslinking reaction of PGMA and PLA.

37
Fig. S.4. MT-DSC curve (reversing signal) of the glass transition zone for CNC-g-PGMA dry powder, measured with a heating rate of 2 °C/min.
Improvement of elastic moduli of PLA by surface grafted CNC
Fig. S.5. Relative glassy and rubbery storage modulus for PLA/ CNC-g-lauric acid, PLA/CNC-g-PGMA, and unmodified CNC, for contents ranging from 2 to 30 wt. %.
38
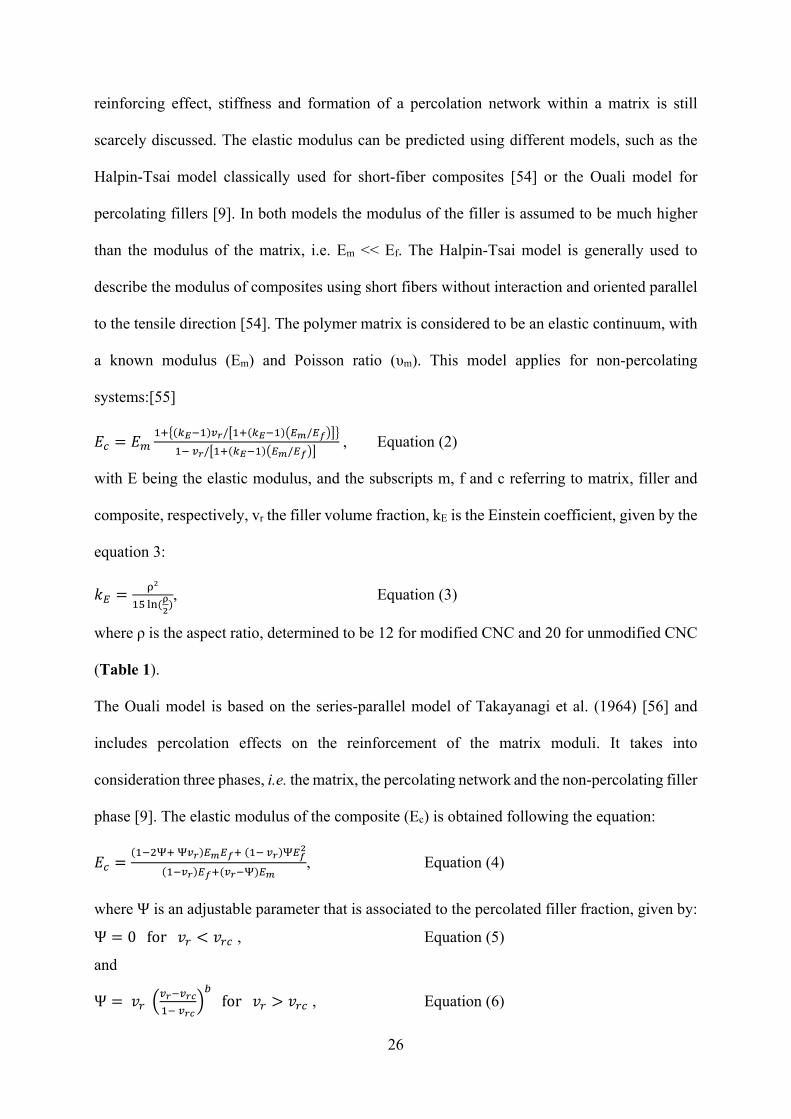
Halpin Tsai model: parameters screening
Fig. S.6. Impact of the fiber modulus Ef on the Halpin-Tsai model at the glassy and rubbery state (used aspect ratio was ρ=11)
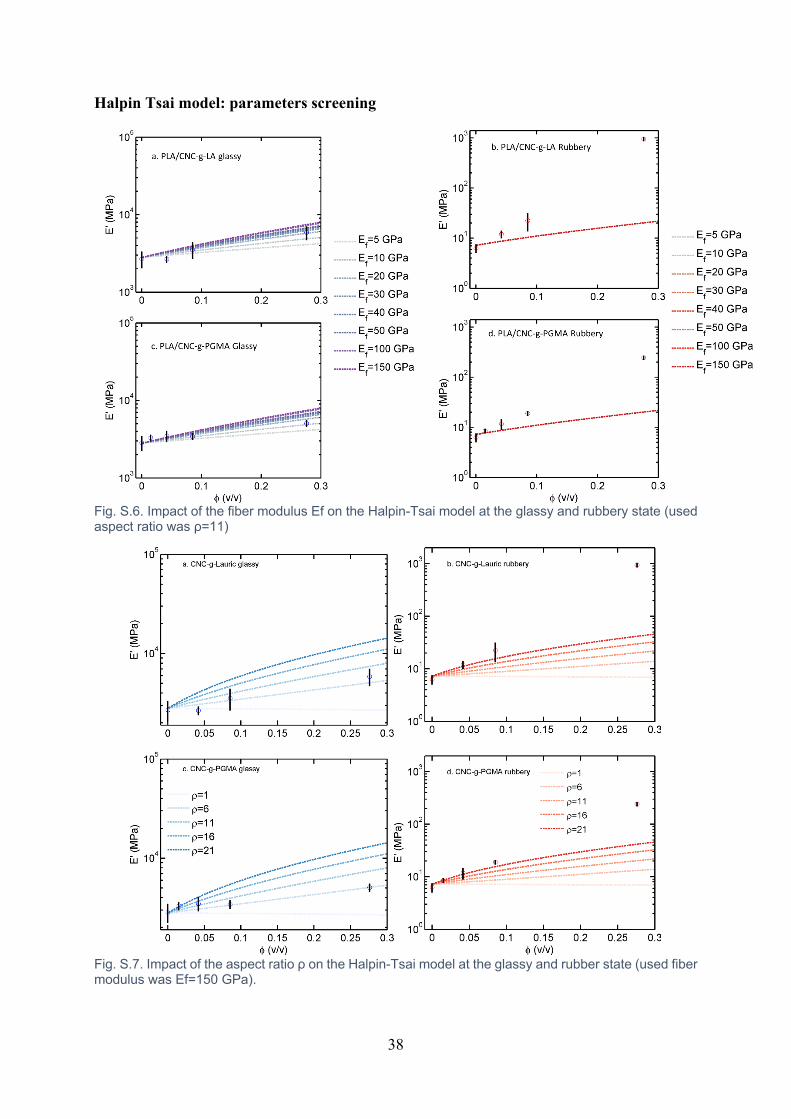
Fig. S.7. Impact of the aspect ratio ρ on the Halpin-Tsai model at the glassy and rubber state (used fiber modulus was Ef=150 GPa).

39
Ouali percolation model: parameters screening
Fig. S.8. Impact of the fiber modulus Ef on the Ouali model at the glassy and rubbery state (used aspect ratio was ρ=11)
Fig. S.9. Impact of the aspect ratio ρ on the Ouali model at the glassy and rubber state (used fiber modulus was Ef=150)

40