A Comparative Study of the Characteristics of High ...
192
Portland State University Portland State University PDXScholar PDXScholar Dissertations and Theses Dissertations and Theses 1988 A Comparative Study of the Characteristics of High A Comparative Study of the Characteristics of High Technology Start-Up Firms Technology Start-Up Firms Sandra J. Kiehl Portland State University Follow this and additional works at: https://pdxscholar.library.pdx.edu/open_access_etds Let us know how access to this document benefits you. Recommended Citation Recommended Citation Kiehl, Sandra J., "A Comparative Study of the Characteristics of High Technology Start-Up Firms" (1988). Dissertations and Theses. Paper 1247. https://doi.org/10.15760/etd.1246 This Dissertation is brought to you for free and open access. It has been accepted for inclusion in Dissertations and Theses by an authorized administrator of PDXScholar. Please contact us if we can make this document more accessible: [email protected].
Transcript of A Comparative Study of the Characteristics of High ...

Portland State University Portland State University
PDXScholar PDXScholar
Dissertations and Theses Dissertations and Theses
1988
A Comparative Study of the Characteristics of High A Comparative Study of the Characteristics of High
Technology Start-Up Firms Technology Start-Up Firms
Sandra J. Kiehl Portland State University
Follow this and additional works at: https://pdxscholar.library.pdx.edu/open_access_etds
Let us know how access to this document benefits you.
Recommended Citation Recommended Citation Kiehl, Sandra J., "A Comparative Study of the Characteristics of High Technology Start-Up Firms" (1988). Dissertations and Theses. Paper 1247. https://doi.org/10.15760/etd.1246
This Dissertation is brought to you for free and open access. It has been accepted for inclusion in Dissertations and Theses by an authorized administrator of PDXScholar. Please contact us if we can make this document more accessible: [email protected].

A COMPARATIVE STUDY OF THE CHARACTERISTICS OF
HIGH TECHNOLOGY START-UP FIRMS
by
SANDRA J. KIEHL
A dissertation submitted in partial fulfillment of the requirements for the degree of
DOCTOR OF PHILOSOPHY in
SYSTEMS SCIENCE
Portland State University
@1988

TO THE OFFICE OF GRADUATE STUDIES:
The members of the Committee approve the dissertation
of Sandra J. Kiehl presented November 4, 1988.
Settle
Bruce L. Stern
Dean E. Frost
APPROVED:
Martin Zwick, Coordinator, Systems Science
Bernard Ross, Vice Provost for Graduate Studies

AN ABSTRACT Of THE DISSERTATION OF Sandra J. Kiehl for the
Doctor of Philosophy in Systems Science presented November
4, 1988.
Title: A Comparative Study of the Characteristics of High
Technology Start-Up Firms.
APPROVED BY THE MEMBERS OF THE DISSERTATION COMMITTEE:
J~ w. Settle
Bruce L. Stern
Dean E. Frost
A sample of two hundred and twenty-five high
technology start-up firms located nationwide provided a base
for the analysis of characteristics of start-up success.
----_._--- -------------

The analysis provides insights into management capabilities
which may be generalized to a larger population.
For comparison purposes, the sample was divided into
two groups: (1) those firms which have not received a
venture capital infusion from a formal venture capital
company and (2) those firms which have received one or more
infusions of venture capital. Aspects of organizational
climate, top management team approach, marketing strategy
and focus, business planning and the intent to go public as
a means of addressing future financing needs were examined.
2
Hypothesis testing was accomplished through the
employment of ANOVA and Chi-Square. Based upon the results
of the testing of each of the hypotheses, the following
conclusions are drawn:
1. Based upon those aspects examined, both the
funded and unfunded firms embrace practices which strongly
manifest those of an organic organization. The strong
propensities toward both open communication channels and
participatory decision making are indicative of the lack of
formal structure present in these organizations. In
addition, creativity is strongly supported, as it should be,
by the notion that failure is viewed in a positive context
as a necessary component of both being creative and making
technological advancements.
2. The team approach to management is practiced by
both funded and unfunded firms, although the venture capital
funded firms have a higher quality top management team when
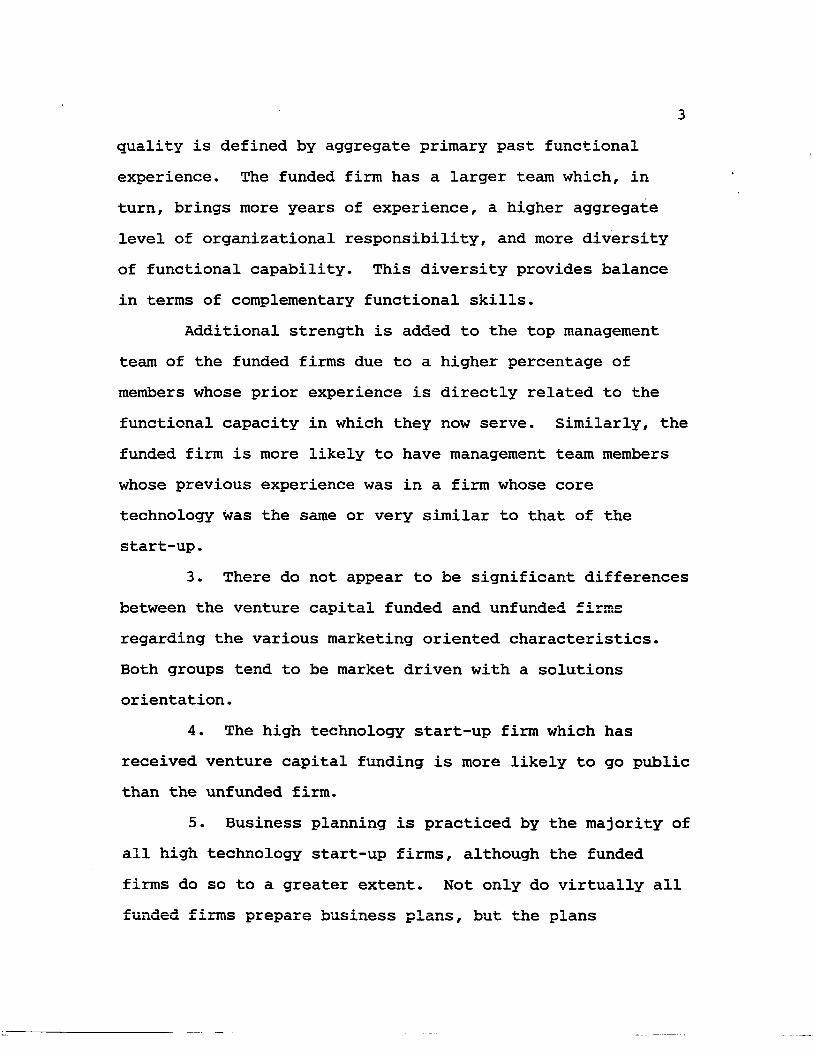
quality is defined by aggregate primary past functional
experience. The funded firm has a larger team which, in
turn, brings more years of experience, a higher aggregate
level of organizational responsibility, and more diversity
of functional capability. This diversity provides balance
in terms of complementary functional skills.
3
Additional strength is added to the top management
team of the funded firms due to a higher percentage of
members whose prior experience is directly related to the
functional capacity in which they now serve. Similarly, the
funded firm is more likely to have management team members
whose previous experience was in a firm whose core
technology was the same or very similar to that of the
start-up.
3. There do not appear to be significant differences
between the venture capital funded and unfunded firms
regarding the various marketing oriented characteristics.
Both groups tend to be market driven with a solutions
orientation.
4. The high technology start-up firm which has
received venture capital funding is more likely to go public
than the unfunded firm.
5. Business planning is practiced by the majority of
all high technology start-up firms, although the funded
firms do so to a greater extent. Not only do virtually all
funded firms prepare business plans, but the plans

4
themselves appear to be more extensive. Additionally; the
primary purpose for which the funded firm prepares the plan
is for venture capital acquisition. On the other hand, the
unfunded firms perform business plan preparation to a lesser
extent, but do so because of operating necessity.
The results of this study have implications for the
nascent entrepreneur in the high technology arena and
researchers alike toward the end of providing a more
complete understanding of some of the critical components
essential to the success of a start-up.

TABLE OF CONTENTS
Page
LIST OF TABLES.. • . . . • • • . . . . . . • • . . . . . . • • . • . . . • . . • • . • • . vi
CHAPTER
I INTRODUCTION. • • • • . • • • • • • • • • • • • • • • • . • • • • • • . . 1
High Technology - An Economic Strategy 1
Definition of Terms ••••••••••••••••••• 2
High Technology Start-Up venture Capital
Primary Firm Characteristics
Management Depth Marketing Expertise Financial Control
..........
Purpose of the Study .................. Delimitations of the Study ........... .
7
10
12
II REVIEW OF THE LITERATURE •••••.•.•.•••••..•• 14
Introduction .......................... 14
Importance of High Technology
Real Output Growth New Job Creation
.........
strategic Impact on the Economy
14
Characteristics of the Successful High Technology Start-up Firm •.••••••• 17
Management Depth Marketing Expertise Financial Control

iv
CHAPTER Page
Conclusion 48
Statements of the Hypotheses •••••••••• 49
III RESEARCH DESIGN AND METHODOLOGy............ 52
Research Design ••••••••••••••••••••••• 52
Population Definition Data Collection Method Sampling Method Sample Size
Measurement Scales •.•••••••••••••••••• 57
Independent Variable Dependent Variables
Operationalization of Variables
Hypothesis 1 Hypothesis 2 Hypothesis 3 Hypothesis 4 Hypothesis 5 Hypothesis 6 Hypothesis 7
Statistical Techniques
64
79
Hypothesis Testing ••••••••••••••••.••. 82
Notation Statistical Computations Hypothesis 1 Hypothesis 2 Hypothesis 3 Hypothesis 4 Hypothesis 5 Hypothesis 6 Hypothesis 7
SllIllmary ••••••••••••••••••••••••••••••• 92
IV ANALYSIS OF RESEARCH FINDINGS •••••••••••••• 93
Characteristics of the Sample ••••••••• 93
Characteristics of the Entire Sample Characteristics of the Unfunded Firms

CHAPTER
Characteristics of the Funded Fir.ms
Hypothesis Test Findings
Hypothesis 1 Hypothesis 2 Hypothesis 3 Hypothesis 4 Hypothesis 5 Hypothesis 6 Hypothesis 7
. . . . . . . . . . . . . .
Summary ••••••••••••••••••••••••••••
v SUMMARY, CONCLUSIONS AND PECOMMENDATIONS
Summary . . . . . . . . . . . . . .0. . . . . . . . . . . . Conclusions
Recommendations for Further Research
BIBLIOGRAPHY . . . . . . . . . . . . . . . . . . . . . . . . . . . . . . . . . . . . . . . . . APPENDICES . . . . . . . . . . . . . . . . . . . . . . . . . . . . . . . . . . . . . . . . .
Appendix A · .................................... . Appendix B · . . . . . . . . . . . . . . . . . . . . . . . . . . . . . . . . . . . . . Appendix C · . . . . . . . . . . . . . . . . . . . . . . . . . . . . . . . . . . . . . Appendix D · . . . . . . . . . . . . . . . . . . . . . . . . . . . . . . . . . . . . . Appendix E
Appendix F · . . . . . . . . . . . . . . . . . . . . . . . . . . . . . . . . . . . . . Appendix G · . . . . . . . . . . . . . . . . . . . . . . . . . . . . . . . . . . . . . Appendix H • • • • • • • • A • • • • • • • • • • • • • • • • • • • • • • • • • • • • •
Appendix I · . . . . . . . . . . . . . . . . . . . . . . . . . . . . . . . . . . . . . Appendix J · . . . . . . . . . . . . . . . . . . . . . . . . . . . . . . . . . . . . . Appendix K · . . . . . . . . . . . . . . . . . . . . . . . . . . . . . . . . . . . . .
v
Page
97
129
132
132
135
141
144
151
151
158
159
161
163
167
168
169
170
171
172

TABLE
LIST OF TABLES
Page
I Hypothesis I - Variable Definitions . . . . . . 66
II Hypothesis II - Variable Definitions · .... 68
III Hypothesis III - Variable Definitions .... 70
IV Hypothesis IV - Variable Definitions · .... 71
V Hypothesis V - Variable Definitions ...... 73
VI Hypothesis VI - Variable Definitions · .... 74
VII Hypothesis VII - Variable Definitions . . . . 78
HYPOTHESIS 1
VIII Component 1 - Open Communication Flow - Anova Results •••••••••••• 98
IX Component 2 - Decision Making Style - Anova Results ••••••••••. 99
X Component 3 - Tolerance of Failure -Anova Results ••••.•••••••••••••• 100
XI Component 4 - Policies Consistent With Corporate Goals - Anova Results ......................... 100
XII Component 5 - Integrity More Important Than Profit - Anova Results ••••• 101
VIII Organizational Climate Sum of Scores -Anova Results ••••.•••••••••••••• 101
HYPOTHESIS 2
XIV Variable 1 - Aggregate Years - Anova Results ......................... 103
xv Variable 2 - Aggregate Responsibility Level - Anova Results •....•••••. 103

TABLE
XVI Variable 3 - Aggregate Annual Sales Volume (Millions of Dollars)
vii
Page
- Anova Results ••••••••.•••••••• 104
XVII Variable 4 - Number of Top Management Team Members - Anova Results •••• 105
XVIII Variable 8 - Number of Different Prior Functional Areas - Anova Results 106
XIX Variable 5 - Members Serving in Same Functional Capacity - Anova Results ...........•...•......•.. 106
xx Variable 6 - Members Experienced With a Like Technology - Anova Results 107
HYPOTHESIS 3
XXI Component 1 - Product Will Not Sell Itself - Anova Results •••••••••• 109
XXII Component 2 - Knowledgeable About Competitors - Anova Results •••.• 110
XXIII Component 3 - Employees Very Customer Focused - Anova Results •••••.••• 110
XXIV Component 4 - Market Demand Primary To Technological Sophistication Anova Results •••••••••••••.••••• 111
xxv Strategy Sum of Scores -Anova Results 112
HYPOTHESIS 4
XXVI Component 1 - Customer Feedback Essential To New Product Development - Anova Results
XXVII Component 3 - Intimately Knowledgeable About Customers' Business - Anova
114
Results ......................... 115
XXVIII Component 4 - Focus on Sharp Unique Market Segmentation - Anova Results ......................... 115
XXIX Solutions Orientation Sum of Scores Anova Results .•••••••••....•.•.. 116

TABLE
HYPOTHESIS 5
xxx Component 1 - Do Not Compete With Very Large Companies - Anova
viii
Page
Results ......................... 117
XXXI Component 2 - Do Not Strive To Be Low Cost Producer - Anova Results 118
XXXII Component 3 - Unique Product Deters Entry - Anova Results ••••••••••• 119
XXXIII Component 4 - Product Does Not Appeal To a Broad Commodity Market -Anova Results ••••••••••••••••••• 120
XXXIV Component 6 - Market Differs From Larger Market As A Whole - Anova Results ••••••••••••••••• 120
xxxv Niche Focus Sum Of Scores - Anova Results ......................... 121
HYPOTHESIS 6
XXXVI Probability of Going Public in Two Years - Anova Results ••••••••••• 122
XXXVII Years Elapsed Between Founding & Going Public - Cross Tabulation Results ......................... 123
HYPOTHESIS 7
XXXVIII Number of Pages in Business Plan Anova Results •••.•.••.•••••••••• 124
XXXIX Business Plan Pages - Cross Tabulation Results ......................... 125
XXXX Most Important Business Plan Component - Cross Tabulation Results ......................... 126
XXXXI Least Important Business Plan Component - Cross Tabulation Results ......................... 127
XXXXII Business Plan Component Weightings -Anova Results •.•.••.•••••••••••• 128

ix
TABLE Page
XXXXIII Business Plan Preparation Purpose -Cross Tabulation Results •••••••• 129

CHAPTER I
INTRODUCTION
The goal of this research study is to examine high
technology start-up firm characteristics. For comparison
purposes, the firms in the study are divided into two
groups: (1) those firms which have not received a venture
capital infusion, and (2) those firms which have received
one or more infusions of venture capital.
The topics covered in Chapter I include: high
technology - an economic strategy, definition of terms,
primary firm characteristics, purpose of the study, and
delimitations of the study.
HIGH TECHNOLOGY - AN ECONOMIC STRATEGY
In recent years the economic development strategies of
state and local governments have become diversification
strategies. For example, the state of Massachusetts has
focused on the development of the high technology industry
to attenuate the economic ills caused by the decline in its
traditional heavy industrial base; and the state of Oregon
has encouraged growth in high technology in an effort to
expand an economic base which has been firmly grounded in
the lumber industry, which no longer employs as many people

as it once did. Additionally, Black asserts these economic
strategies are based on a shift from an industrial to an
information economy. Economic development strategies such
as these have moved away from the recruitment of the
smokestack manufacturing industries to the high technology
industries (Black, 1986: 9).
2
During the past decade, the literature has supported
the notion that high technology industries are and will
continue to be the engine that drives the economic growth of
the United States for the duration of this century (Miller
et aI, 1985: 114; Howell, 1985: 17; Krishna et aI, 1986:
47). Concomitantly, new business start-ups in the high
technology arena are more pervasive than at any previous
point in history.
DEFINITION OF TERMS
Before proceeding, it is important to understand the
meaning of the terms "high technology" "start-up", and
"venture capital".
High Technology
There is virtually little agreement on the explicit
definition of high technology. When most individuals refer
to high technology they generally mean micro-electronics.
While the computer and electronics segment of the industry
has provided
growth, high
the overwhelming por~i~jObS and
technology encompasses much ~?re. "
revenue

Biotechnology, chemicals and advanced materials such as
polymers, microwave communications and fiber optics
increasingly are part of the high technology mix.
Douglas Green, publisher and president of Mass High
Tech, a New England high technology industry journal,
defines high technology as any company in electronics,
semiconductors, software, chemicals, biotechnology,
photovoltaics or advanced communications that employs
engirieers in research and development (Radding, 1986: 4).
Zalud offers much the same breakdown, but with a refinement
in the biotechnology arena claiming that priority areas
involve applications in agriculture, livestock production,
medicine, chemistry and pharmaceuticals (Zalud, 1986: 90).
3
Webre and Bodde have been somewhat more precise by
defining a high technology industry as one with a ratio of
R&D that is one-third higher than the overall average of the
manufacturing industries, and with a ten-year growth in
employment that is higher than the manufacturing average.
These criteria, once again, produce a similar result
regarding industry types -- drugs, industrial organic
chemicals, office and computing machines, communications
equipment, electronic components, air craft missiles and
instrumentation (Webre et aI, 1986: 28).
It should be noted that according to a recent research
study by Gomez-Mejia & Balkin, the definition provided by
Webre & Bodde may be somewhat conservative in at least one

of its criteria. The research found that high technology
companies reinvest about four times more than traditional
companies (Gomez-Mejia et al, 1985: 31).
4
The Bureau of Labor and statistics has defined high
technology industries as those with R&D expenditures and
technical employees nearly twice as high as the total u.s.
manufacturing average. The BLS has a second category called
"high-tech intensive industries" defined as having R&D
spending and technical employment above the national
average.
The thread common to all of the stated firm types is
that they all operate close to the state of the art or the
frontier of technology (Bleicher et al, 1983: 70).
For the purposes of this research study, high
technology is defined as any firm in electronic hardware,
software, fiber optics, lasers, AI, robotics, biotechnology,
advanced materials, aerospace, chemicals, factory
automation, electronic subassemblies/components, test and
measurement, telecommunications, high technology services,
energy and medical instrumentation. These firm types were
chosen on a convenience basis relative to the availability
of the sampling frame used. Further discussion of the
sampling frame is found on pages fifty-two and fifty-three.
Start-Up
The term start-up also has a variety of definitions.
Cooper defines start-up as a stage of development during

which the strategic decision is made to found a firm and to
position it within a particular industry with a particular
competitive strategy (Schendel et aI, 1979: 317).
5
Kozmetsky defines the start-up as the company in the
organization phase or within the first year of business. At
this point in time, product development will still be in
process. Typically the management team will be in place,
some marketing research will have been done and the business
plan will have been prepared (Kozmetsky et aI, 1985: 9).
Stacey disagrees with the rather narrow scope of the
foregoing definitions. He bases his disagreement on the
premise that the committed entrepreneur does not necessarily
approach the financial institutions for a serious injection
of capital within the first two years of business. As a
result, the start-up would be any business up to three years
old. Additionally, he implies that the firm may also be
producing and marketing a particular product from the outset
(Stacey, 1986: 159).
Stacey's definition includes what the previous two
authors would consider to be the early growth stage, when
the firm is manufacturing and selling its product and when
it has growing accounts receivables and inventories. A key
point made by Kozmetsky is that the firm that can be
classified as profitable has passed the start-up stage
(Kozmetsky et aI, 1985: 9; Schendel et aI, 1979: 317).

6
For the purposes of this research study, a start-up is
defined as a firm which is one-to-five years old based on
the date of founding. This extension of the time frame, as
defined above, is based on personal knowledge of several
high technology entrepreneurs whose companies spent two to
three years in the product development stage. Those firms
include, for example, Lattice Semiconductor, Ateq
Corporation, Pacific Biotechnology Research, and Richware.
Venture Capital
Webster defines a venture as "an undertaking involving
chance, risk or danger, especially a speculative business
enterprise." It follows from this definition that venture
capital financing was originally regarded as early stage
financing of small but rapidly growing firms. Early stage
financing is that which takes place prior to actual
production and commercialization of the firm's product.
Since 1974, however, venture capital investments have
been made in all phases of business development, from the
point when the entrepreneur is attempting to prove a concept
to the point when the firm is preparing to go public (Pratt,
1982: 4). Liles offers four explanations of situations in
which venture capital financing is utilized. These
explanations illustrate the diversity of situations calling
for potential infusions of venture capital. They include:
"(1) providing capital for any high-risk financial venture,
(2) providing seed capital for a start-up situation,

7
(3) investing in a firm that is unable to raise capital from
conventional sources, and (4) investing in large publicly
traded corporations where the risk is significant" (Liles,
1974: 461).
Venture capital may be in the form of equity, debt or
convertible debt, although equity is the most common form.
Further, venture capital may be obtained from a variety of
sources. Those sources include, for example, private and
public investment firms, Small Business Investment
Corporations, institutions, banks and informal investors.
The private and public investment firms, also known as
professionally managed formal venture capital companies, are
the major source of venture capital (Walker et aI, 1986:
401).
It is convenient for the purposes of this study to
define venture capital as equity financing obtained from a
formal venture capital company, since they are easily
identified and meet the required conditions for this
examination.
PRIMARY FIRM CHARACTERISTICS
The aggregate of the current business literature on
high technology start-up firms indicates that in addition to
technological competency, there are three primary

characteristics which are vital for the success of the high
technology start-up:
o management depth,
o marketing expertise, and
o financial control.
Manaqement Depth
8
While management depth may not necessarily be required
initially to create a climate of innovation and creativity,
it is required to sustain that climate and add the cohesion
necessary to meet the goals of the start-up. Management is
responsible for providing leadership, instilling a sense of
commonality of purpose among all employees, building a. sense
of trust and respect, and ensuring the free flow of
communication and ideas. Success depends on the ability of
management to balance stability and conservatism,
represented by the value system of the corporate culture,
with continued innovation precipitated by the dynamic
environment of high technology (Stacey, 1986: 160; Schendel
et aI, 1979: 322; Stevenson et aI, 1986: 12; Maidique, 1984:
21).
Marketinq Expertise
Technologically advanced products are not an end in
themselves. The key point to be made here is that
technology does not drive the market. Rather, the best
market should be found and the product should be tailored to

9
it. The innovative product is not the "better mousetrap",
which can be defined as the best and most technologically
sophisticated product (Bellack, 1985: 80). It is different
in principle, and, more importantly, it provides a solution
addressing a current need. Drucker asserts that products
must have a market in the present; the firm should innovate
for an existing market not for a potential future market
(Rutigliano, 1986: 41). Grant Rollin, a partner in the High
Technology Group of Deloit, Haskins & Sells, also supports
this notion when he observes that the firms receiving
venture capital funding are those which are market-driven
rather than technology-driven. The most successful start
ups, from his perspective, are those which determine what
the market wants and then develop it (Schoch, 1985: 81).
The ability to provide solutions implies marketing
adeptness. The entrepreneur must ascertain market needs not
only at the outset, but on a continuing basis as the high
technology marketplace represents a constantly changing
environment.
Financial Control
Inadequate capital is one of the primary reasons for
the failure of a new venture. Undercapitalization
contributes to failure primarily due to the fact that the
entrepreneur must spend an inordinate amount of time seeking
capital infusions to relieve short-term cash flow problems.
As a result, two additional problems are created: would-be

10
investors are not as likely to invest if the firm is in
financial crisis; and the firm as a whole may lose its sense
of focus due to the 1055 of focus on the part of the driver
of the firm's culture (that is, in the general practices and
attitudes of the wider organization). To alleviate the
pressures of undercapitalization, sound financial control
should commence at the business planning stage and continue
for the life of the firm.
Bleicher has indicated that high technology businesses
require "instruments for management which do not rely as
heavily on traditional techniques of controlling, finance
and marketing as compared to more mature businesses"
(Bleicher et aI, 1983: 71). For example, the focus should
be on teamwork rather than hierarchy, problem solving rather
than routinization, and technological environmental
scanning (looking for substantial technological potential),
rather than marketing surveys.
PURPOSE OF THE STUDY
The purpose of this research study is to develop an
understanding of the characteristics of the successful high
technology start-up firm. There appears to be an absence of
systematic, formal, empirical research which gives
credibility to the notions presented in the current
literature. These notions include: the team approach, an
informal structure, and a solutions orientation as well as a
---------------- .-----.-----

11
variety of others which are discussed in Chapter II. The
wisdom behind these notions appears to be, for the most
part, very solid and based on experience, but the reader of
the current business literature must trust the authors of
that literature because there is, for the most part, no
explicit presentation of the results of a specific studies.
Hence, empirical research is needed to affirm or disprove
the tenets and prescriptions advanced in the current
business literature.
Answers to the pivotal questions require a
determination of those factors inherent in the high
technology start-up's structure, systems and strategies that
contribute to management depth, marketing skill and
financial control. Additionally, much of the current
literature seems to imply that the venture capital funded
start-up firm has a greater degree of management depth,
marketing expertise and financial control than does the
start-up which has not received any venture capital
infusions. The reasoning behind this implication appears to
be based on the additional accountability imposed by the
expectations of the venture capital firm. It is, therefore,
prudent to examine not only the high technology start-up
arena as a whole, but to contrast and compare venture
capital funded start-ups with unfunded start-ups (those
which have not received at least one venture capital
-------------

infusion) with respect to the aforementioned
characteristics.
DELIMITATIONS OF THE STUDY
1. The meanings of high technology, start-up and venture
capital are limited to the definitions provided for in
the Definition of Terms Section.
2. The subject is examined relative to the organization
which is created. This study does not address the
personal or psychological characteristics of the
individuals who found the start-up, nor does it
address the environment surrounding the start-up
venture.
12
3. The characteristics of the high technology start-up firm
are examined on both an aggregate and a comparative
basis. The criterion for comparison is whether or not
the high technology start-up firm has received at least
one round or infusion of venture capital financing as
defined in the Definition of Terms section. Those
start-ups which have received at least one round of
venture capital financing are referred to as funded
firms. Those start-ups which have not received any
venture capital financing are referred to as unfunded
firms.
4. While technological competency is considered quite
important to the success of the high technology start-up
-------- ------------

13
firm, this research study does not address it per see
Technological competency is addressed as it relates to
the quality of the top management team (see pages 60 and
61), and as it relates to the preparation of the
business plan (see page 46).

CHAPTER II
REVIEW OF THE LITERATURE
INTRODUCTION
The purpose of the literature review is to ascertain
ideas and theories applying to those factors inherent in the
success of high technology start-up firms. These ideas have
been applied to designing a research instrument for the
purpose of determining the relevancy of those notions
advanced in the literature. (see Appendix A.) The fields of
management, marketing and finance are the sources of
concepts relating to the factors of success in high
technology start-up firms.
This chapter discusses the following topics:
o Importance of High Technology, and
o Characteristics of the Successful High
Technology Start-Up Firm.
IMPORTANCE OF HIGH TECHNOLOGY
The high technology industry is critical to the
economy of the United States because of its:
o Real output Growth,
o New Job Creation, and
o Strategic Impact on the Economy.

15
Real Output Growth
The economy of the United States is currently being
characterized as a growth economy, with high technology
industries being widely regarded as the prime movers of this
growth. The rate of growth of real output in high
technology industries was more than double that of the total
u.s. industrial real output during the 1970-1980 period.
High techno~ogy industries also experienced growth in
average labor productivity which was six times faster than
that of total u.s. business (Krishna, 1986: 47). Firms in
the high technology industries now account for over one half
of all private R&D spending in the U.S., over one-third of
all u.s. exports and one-sixth of the country's
manufacturing exports (Webre et aI, 1986: 28).
New Job Creation
All of the employment growth in the United States
during the ten year period ending in 1985 had occurred in
small companies. The nation's largest 1000 companies have
eliminated one million jobs; however, smaller organizations
have added 20 million jobs (Farrell, 1986: 42). Over the
last twenty years, forty million jobs have been created, and
the high technology industries have specifically accounted
for five to six million of these jobs (Drucker, 1985: 3).
In addition, studies have shown that for every new
manufacturing job created in high technology two new service
jobs are created (Goldman, 1984: 6). Conservatively, one

16
can estimate that twenty-five percent of new job creation is
based, either directly or indirectly, on the high technology
industries.
Strategic Impact On The Economy
High technology industries are considered strategic
because they stimulate technological progress across a broad
range of industries. As a result, they contribute more to
general economic growth than is measured by the value of
their own output (Webre et aI, 1986: 28).
The success of high technology industries is
considered important to the nation for two reasons: (1) the
benefits of high technology research extend well beyond the
companies that sponsor it, and (2) high technology products
drive technological change in a variety of technical sectors
(Webre et aI, 1986: 28).
From a qualitative standpoint, high technology is
important in that it creates the news and excitement in what
is now characterized as the entrepreneurial economy. The
entrepreneur is commonly defined as one who starts his/her
own new small business. But not every small business owner
can be considered an entrepreneur. J.B. Say, the French
economist, said around 1800, "The entrepreneur shifts
economic resources from an area of lower and into an area of
higher productivity and greater yield".· In The Theory of
Economic Dynamics, Joseph Schumpeter refined Say's
definition by stating that dynamic disequilibrium is brought
-------- ----------- ---------

17
on by the innovating entrepreneur who sees change as the
norm and as healthy. While Say essentially said that the
entrepreneur is one who does something better, Schumpeter
focused on the notion that the entrepreneur does something
different. The entrepreneur always searches for change,
responds to it, and exploits it as an opportunity (Drucker,
1985: 28).
Currently we are in the third wave of entrepreneurship
and innovation in the history of the modern industrialized
world. The 1880's and 1920's also saw explosions of start
ups. The 1880's and '90's witnessed the second Industrial
Revolution, while the 1920's saw the emergence of the great
entrepreneurs of the auto industry, new technologies and new
products. Today's boom is substantially different because
of both its unprecedented size and scope and its global
impact. A 1985 study by Arthur Young & Company found that
in the high technologies, the small firms are outperforming
larger companies at a rate of 24 times as many innovations
per R&D dollar (Farrell, 1986: 42).
CHARACTERISTICS OF THE SUCCESSFUL HIGH TECHNOLOGY START-UP FIRM
The high technology venture has been characterized as
"risky business". The high-tech entrepreneurs are seen as
inventors bent on building a better mousetrap, as opposed to
entrepreneurs or innovators (Drucker, 1985: 13). What then
are the factors which distinguish the successful high

technology entrepreneurship from the highly risky
speculative venture?
18
The three primary factors which are vital for high
technology ventures are those that have been crucial to
large corporations over the decades: (1) management depth,
(2) innovative products coupled with marketing expertise,
and (3) adequate capital coupled with financial control
(Chemical Week, 1984: 44; Drucker, 1985: 189). Much of what
is presented in the current literature focuses on the
forging of new businesses built around fast-paced
innovation. However, would-be entrepreneurs oftentimes race
so hard to beat the competition and are so infatuated with
their own technology that they ignore the basic precepts of
management, marketing and financial control (Business Week,
1984: 78).
The ensuing discussion will address the successful
high technology start-up firm characteristics as they have
been defined either anecdotally or empirically in the
literature. These characteristics will be discussed within
the framework of:
o Management Depth
o Marketing Expertise, and
o Financial Control.
Management Depth
Management is seen as the most important of the three
factors. A bankroll and an innovative, high-tech idea are

19
necessary but not sufficient for success (Chemical Week,
1984: 44). Given the product and the capital, the main
obstacle to success has been the lack of a viable, organized
operating presence in which people know where they are
going, what they are supposed to do, and what the results
should be. This operating presence manifests itself in a
particular combination of characteristics inherent in the
start-up firm. These characteristics will be discussed in
terms of:
o Leadership Style / Culture,
o Team Approach,
o Informal Climate, and
o Organizational Structure.
Leadership Style / Culture. While all companies, in
fact, need leaders, leadership is particularly important
when the future is blurry and when change is occurring
rapidly. Equally important are those strategies and
management practices that can reinforce strong leadership
(Maidique et aI, 1984: 18).
The founder of the firm should exhibit strong
leadership manifested in a "hands-on" leadership style.
He/she serves as a role model for the organization, and
instills a sense of integrity whereby honesty, fairness and
openness are not sacrificed for short-term business
objectives. The founder/leader is seen to be the creator of
the culture (Maidique et aI, 1984: 25). Stacey observes

20
that an important feature of successful start-ups is the way
in which the founder's dedication pervades the whole
workforce; the employees in turn become totally enthusiastic
about the business. The drive of all the employees of this
type of company is to promote their organization and service
its interests as best as they can (Stacey, 1986: 160).
Small size allows the entire organization to focus on
opportunities. The culture of the start-up, with its shared
sense of the need to survive, can create a cost
consciousness and dedication which are difficult to achieve
in the large organization where each employee knows that
his/her contributions are but a small part of the whole
(Schendel et aI, 1979: 322).
The founder as an entrepreneur is a person who
perceives opportunity, finds the pursuit of the opportunity
desirable and believes that success is possible. The
entrepreneur's belief in success is founded on the
uniqueness of the idea, the strength of the product and a
combination of other factors known mainly to the
entrepreneur. These factors may include a special knowledge
of the market or the ability to work hard and quickly.
These same beliefs must be built into the organization if
the entrepreneurial success of the founder is to be
continued. The key to accomplishing this perpetuation is
the building of an adaptive organization (Stevenson et aI,
1986: 12).

21
Team Approach. Most successful entrepreneurs have
not only technical skills, but are competent in a variety of
business functions or seek out complementary skills (Vesper,
1980: 37). The team approach is the means by which the high
technology start-up firm builds the aggregate of necessary
functional skills. Much of the current literature leads one
to believe that the importance of having the management team
in place at the outset has only surfaced since the
electronics industry wavered in the mid-1980's. However, as
early as 1982, when venture capital funds were in abundance,
venture capital companies were looking for not only product
but management as well. According to a member of the Rain
Tree Group, a Massachusetts venture capital firm, "There is
certainly enough money around for good deals, but the
difficulty is finding the right package, or combination of
management talent and product" (Johnson, 1982: 78).
The right people are well-rounded entrepreneurs who,
as a team, have business skills which include marketing,
finance, planning and operating expertise. In addition to
these business skills, the team members should exhibit
personal strengths such as integrity, enthusiasm, a will to
win and persistance (Moser, 1984: 20). Whether the
experience is gained in large or small companies is not as
critical as variety (Bruno et aI, 1985: 62). Additionally,
the business skill package found to be the most desirable by
the venture capitalist industry is one which is based upon
-~------------

22
previous experience in the particular field which the start
up intends to enter (Vesper, 1980: 37).
Looking back a century, the importance of quality
management to investors is demonstrated by the cases of
Thomas Edison and Alexander Graham Bell. In 1881, Edison
was seeking funds to build a manufacturing facility. While
Edison was considered to be a great creative force, he was
also considered to be an eccentric with unorthodox business
methods. As a result, investors were unwilling to risk
funds for capital acquisition in spite of the fact that they
eagerly bought his patents (Josephson, 1959:247).
During the same time period, the Bell Telephone
company was formed. Once again the inventor's business
acumen was questioned. As a result, the two principle
investors became partners with Bell and formed the firm.
While both had high regard for Bell and faith in the future
of his creations, their intent was to maximize return for
dollars invested. These men, in addition to two others
which they hired, handled the business while Bell remained
the creative force (Bruce, 1973: 258).
According to Alfred D. Chandler, straus professor of
business history at the Harvard Business School, "the key
entrepreneurial act has been creating an organization"
(Inc., 1985: 53). Exploiting the technology is a necessary
but insufficient condition for being a successful
-------- --------

entrepreneur. You must create an organization - not a
bureaucracy, but a team.
23
Levy observed that if the high technology start-up is
to be successful in the face of intense international
competition, it will need more than scientific creativity in
its markets. It will need "crack" management who are as
comfortable with organization, finance, long-range planning
and decision making as they are with technology (Levy, 1982:
47). Research hy Roberts, Cooper and Bruno suggests that
the successful new high technology firms are started by
multiple founders (Schendel et aI, 1979: 321); however,
regardless of the number of founders, the successful high
technology venture typically has a top management team in
place before start-up. If the founders of the firm do not
have all of the expertise required for this team and are
seeking venture capital, the venture capitalist will require
that the expertise be obtained and will provide the
necessary recruiting services for the start-up (Chemical
Week, 1984: 46).
It has been suggested by Schilit that the expertise of
the management team can be enhanced by choosing members for
the Board of Directors who possess expertise that the
management team may lack. Outside directors with
backgrounds in finance, banking, marketing and international
business can be particularly helpful in monitoring the
environment and planning for growth (Schilit, 1986: 45).

24
A directly opposing view is held by Marshall and
Forbes of Royal Bank Venture Capital Limited, who propose
that the single key success factor is management. They
assert that poor management cannot be compensated for
through the use of any external means. They claim that this
approach will exacerbate rather than attenuate any
management problems (Marshall et aI, 1983: 107).
The members of the management team, while having
diverse backgrounds, should embrace a common value system.
This value system should be congruent with the previously
stated value system of the founder/so Charles Schwab,
founder and CEO of the "high-tech" brokerage firm Charles
Schwab & Co., affirmed this notion when he stated in a
recent interview, "When I bring new people on board, I try
to get them to be in concert with my thinking, •••• " (Willis,
1986: 19).
The effective use of management teams is becoming very
apparent in high technology companies. Companies such as
Compaq Computer, AST Research and Quantum Corporation have
avoided the "one-man show" syndrome by assembling top
management teams that look beyond the narrow boundaries of
specific functional areas to the global concerns of the
company as a whole (Schlitit, 1986: 44). Referencing Peters
and Waterman's In Search of Excellence, Henz asserts that by
nature of the circumstances, the high technology venture
which advances from a pioneering stage to a rapid growth
----- --------- -------

25
stage in the business life cycle does, in fact, exhibit the
hands-on, value-driven attribute. Establishing a corporate
culture requires a hands-on attitude on the part of the
entire management team, which is seen as a close knit group
generally possessing a camaraderie and consensus on goals
(Henz, 1986: 30).
The team should show a cohesion around its focus, with
each member having a defined role and the experience and
personality to fill it. Experience has shown that
successful start-ups, having been correctly assembled at the
outset usually by one highly committed individual who has
intimate knowledge of the strengths, weaknesses and
capabilities of each member, are those where the management
team stays together (stacey, 1986: 158).
From the venture capitalists' point of view, there are
a variety of sound reasons supporting the team concept.
They include, for example: (1) more balance regarding
functional capability, (2) a larger manpower effort, (3)
ability to grow larger without expending limited management
talent seeking out additional key talent, (4) ability to
absorb the loss of a given member without drastically
affecting the performance of the firm, and (5) an indication
of the ability to attract and manage people (Vesper, 1980:
41). Research has indicated that high technology ventures
are more likely to have teams, and those ventures requiring

26
more start-up capital are more likely to have teams in place
at start-up (Cooper, 1970: 70).
Informal Climate. Many founders of high
technology start-ups have scientific and engineering
backgrounds, and are not necessarily practical business
people. The informal atmosphere and management climate that
encourage active participation throughout the entire
organization have been directly attributed to these
backgrounds (Howell, 1985: 21). Lipton has observed that
relatively few have Ivy League MBA's, and many have spent
their entire lives avoiding wearing a tie (Lipton, 1982:
34) •
Because high technology start-ups are on the cutting
edge of new technologies, scientists and engineers, in
general, are as important as key executives in the more
traditional firms. A large percentage of the scientists and
engineers come into high technology from the academic ranks,
further contributing to the relaxed work environment. For
example, at Tandem Computers Inc., CEO James Treybrig
attributes their rapid success to the creation of an
unstructured environment where people can enjoy working. A
Friday afternoon "beer bust" is a custom. All employees
from the president to assemblers drink beer and talk
informally. The underlying motivation for the beer bust and
the lack of time clocks, badges, and organizational charts

27
is the promotion of both communication and equity across all
levels of the company (Gomez-Mejia et aI, 1985: 32).
Creativity is considered the lifeblood of any high
technology business. To foster creative solutions there
should be no hierarchy to problem solving. Solutions may
come from anyone, anywhere in the organization. A strong
spirit of cohesion must exist where individuals are willing
to share experienced and points of view, and to criticize
and approve (Bleicher et aI, 1983: 76).
Organizational Structure. In the case of the start-up
firm, organizational structure, systems and procedures are
usually informal or nonexistent; therefore, implementation
of strategy is normally accomplished through specific
individual task assignments, and the leadership style of the
entrepreneur (Schendel et aI, 1979: 308).
To succeed, the energy and creativity of the entire
organization must be drawn upon. Anything that restricts
the flow of ideas, or undermines the trust, respect and
sense of commonality of purpose is a potential danger. High
technology start-ups, therefore, pay little attention to
seniority, rank and functional specialization (Maidique,
1984: 21).
The chain of command in the high technology start-up
is short and decision methods are informal and intuitive.
According to William G. McGowan, founder and CEO of the
highly successful MCI Communications, the structure and

28
style of the high technology organizational must allow for
the speed and dexterity to change directions quickly (Levy,
1982: 48). While decisions may not be carefully documented,
they are timely. Management generally has a first-hand feel
for the realities of both customers and operations. Day-to
day contact is the basis for decision rather than the
abstractions of reports. The ability to change directions
quickly is manifested in the informal decision processes in
which relatively few executives must be convinced and in the
start-up venture's lack of commitment to the status quo
(Schendel et aI, 1979: 324).
The structure of the high technology start-up firm can
be described as organic as opposed to mechanistic. Burns
and Stalker define these two types of organizations or
systems in the following fashion:
A mechanistic system is appropriate to stable conditions. It is characterized by: (1) the pursuit of technical improvement of means, rather than the accomplishment of the ends of the concern, (2) the precise definition of rights and obligations and technical methods attached to each functional role, (3) hierarchic structure of control, authority and communication, (4) a reinforcement of the hierarchic structure by the location of knowledge actualities exclusively at the top of the hierarchy, where the final reconciliation of distinct tasks and assessment of relevance is made, (5) a tendency for interaction between members of the concern to be vertical, i.e. between superior and subordinate, and (6) a tendency for operations and working behavior to be governed by the instructions and decisions issued by superiors.

The organic organization is appropriate to a dynamic environment which constantly gives rise to new problems and unforseen events. It is characterized by: (1) the contributive nature of special knowledge and experience to the common task of the concern, (2) the realistic nature of the individual task, which is seen as set by the total situation of the concern, ••• (3) the spread of commitment to the concern beyond any technical definition, (4) the shedding of responsibility as a limited field of rights, obligations and methods ••••• , (5) a network structure of control, authority and communication. The sanctions which apply to the individual's conduct in his/her working role derive more from presumed community of interest with the rest of the working organization in the survival and growth of the firm, and less from a contractual relationship between himself and a non-personal corporation •••••• , (6) •••. knowledge about the technical or commercial nature of the here and now task may be located anywhere in the network; •••••• , and (7) a lateral rather than a vertical direction of communication through the organization ••• (Burns et aI, 1980: 127).
29
In the organic organization institutionalized shared
common beliefs about values replace rigid rules. The
culture of the institutionalized beliefs becomes the way of
"how we do things"; thus the formal and informal
organizations become indistinguishable from one another.
Summary. This section has focused on the management
characteristics of the successful high technology start-up
firm. Those characteristics include: strong leadership, a
hands-on leadership style, a value-driven corporate culture,
a functionally well-rounded management team, an informal

environment, participatory decision making, and open
communication channels.
Marketing Expertise
30
The primary notion set forth in the literature is that
the high technology start-up firm should have the following
market orientations:
o Market Driven Innovative Products,
o Solutions - Not Wizardry,
o Narrow FOcus, and
o First-Hand Customer Knowledge.
Market Driven Innovative Products. While many may
debate over whether the high technology start-up should be
driven strategically by product or by market, Farrell
concludes that the theory underlying the debate is too
sophisticated for the entrepreneur. He characterizes the
entrepreneur as one with both a high customer focus and a
high market focus. A customer without a product is not a
customer, and a product without a customer is not a product.
What counts, he says, is the entrepreneur's vision of the
connection between the two. The entrepreneur must have a
clear picture of a specific set of customers who need and
will pay for a specific set of products and/or services
(Farrell, 1986: 48).
Drucker supports the customer/product balance when he
states, "Unless the results of innovation can have a payoff
and market in the present, don't innovate. You don't

31
innovate for something you'll have only in the future.
There must be receptivity and a current need" (Rutigliano,
1986: 41). The downfall of many new high technology start
up firms can be traced to their managements' assumption that
creating a useful new product will automatically bring into
being a market for that product (Chemical Week, 1984: 45).
Maintaining a strong marketing orientation is a
prevalent theme throughout the current literature (Schlitit,
1986: 46; Maidique et aI, 1984: 19; Yeskey, 1986: 20). The
start-up venture should be founded on a perceived customer
need and catering to that need should be uppermost in the
founders' minds (Henz, 1986: 30). A successful product must
have a clearly discernible unique selling quality. This
quality of differentiation must manifest itself in the
product price, quality, design, after sales support or even
its image. It must be a quality for which the customer is
willing to pay (Pearsen, 1986: 110).
The high technology start-up must constantly consider
its market and have the flexibility to adapt to new
opportunities as the market changes. To be successful, the
management team must always be planning on a contingency
basis for the effects of competition, new technology,
changing work practices and a variety of other issues which
require a continuous review of company objectives (Stacey,
1986: 159).
---~--------

32
Solutions - Not Wizardry. According to Aggarwal,
technology-based products must serve basic customer needs to
be successful. The successes of the past, including
electricity, photocopying, computers and penicillin have
satisfied customer needs at low costs and may have helped
reduce human drudgery. The high technology failures of the
last decade did not satisfy basic needs at low cost; rather,
they tried to satisfy some artificial or marginal needs at a
high expense (Aggarwal et al, 1984: 48).
Taking this one step further, high technology
oftentimes serves basic customer needs in a rather indirect
way by providing practical solutions to business
productivity problems. The "better mousetrap" new
technology is no longer sought after unless it provides a
solution to the potential customer. New technology should
be used to extend human capability rather than to create
devices that will simply imitate human skills as in the case
of the talking dashboard (Horton, 1985: 3). What customers
do not want is more technology.
According to John Gingerich, executive VP of
Measurex Corporation, the natural tendency of a high
technology company is to step into a product-driven mode of
operation. The trick is to make the transition from a
product-driven to a solutions-driven orientation very early
in the life of the company (Yeager, 1984: 64).

33
Ken Ostrow, president and founder of Impact Systems
Inc., claims that his firm did not start with a
predetermined technology. This firm started by first
targeting a solution and then choosing a technology that got
the market interested. The technology was definitely
secondary to the promised economic return (Yeager, 1984:
68) •
The solutions-oriented approach also has advantages
when considering the product life cycle. Most high
technology products have life cycles of only two or three
years. The reason for these short product life cycles is
that the competition is robust. If a company wants to
compete successfully, products must constantly be improved
or replaced with new products (Gomez-Mejia et aI, 1985: 32).
The solutions approach tends to lengthen product life
cycles. Users are reluctant to change to a new technology
unless there is significant evidence that the new solution
is superior to the existing one. In addition, solutions
oriented products tend to penetrate the mainstream of a
customer's business, thereby increasing the risk of changing
vendors or technology. The benefits to the producing
company are twofold: (1) more time to enjoy the fruits of
the product, and (2) more time to make new product decisions
(Yeager, 1985: 69).
Narrow Focus. Research has indicated that narrow
specialization or focus leads to greater growth (Vesper,
------- -------- -----------

34
1980: 174). It then follows, as many writers advise, that
the start-up should choose a niche and generally avoid
competing with the large corporation. Direct competition is
possible only where the small firm has a definite
competitive advantage or where the large firm is doing a
poor job or is complacent (Schendel et aI, 1979: 323; Moser,
1984: 19; Dewar, 1982: 76,77).
Henz suggests that the successful start-up is one
which "sticks to the knitting". It is one which
concentrates on a single product or service (Henz, 1986:
30). If a product does change, it will be the result of a
clearer understanding of what the customer wants (Drucker,
1985: 189).
Niche marketing does put a premium on real "new
generation" products that meet a defined need. Innovation
is in demand because customers are disenchanted with mere
product line extensions. An additional problem with line
extensions is that competitors are able to match them too
easily. This type of an environment demands breakthrough
products that can be customized for market niches. They
must be different in principle - not packaging (Yeskey,
1986: 24).
The best opportunities are "off the beaten path".
The me-too marketers with the look-alike products think that
the market is so large that a small piece of it is all that
is needed for success. What they have found is the customer

35
needing a better reason than product availability to make a
purchase decision. Following the leader is not a good basis
to compete. You have to be better than the leader and you
have to be there first. According to Mitch Kapor, chairman
and CEO of Lotus, companies need to invent new marketplaces
because they will not survive by trying to take sales away
from their competitors (Bellack, 1985: 79).
The personal investment policy of Bill Davidow, a
successful venture capitalist whose start-up company
investments include Tandem Computers Inc., Businessland
Inc., and Valid Logic Systems Inc., reflects an opinion held
by many in the venture capital arena: seek companies highly
focused on making unique contributions to markets they can
control. Having invested in a few failures, Davidow
attributes these failures to the inability of the start-up's
management to focus narrowly (Morris, 1986: 30).
In his recent book, Marketing High Technology, Davidow
cites the conclusions of the Boston Consulting Group's work
on business strategies. The conclusion of the Boston
Consulting Group was that one of the most successful
competitive strategies is to divide the market into a
"sufficiently isolated segment which can be dominated".
Davidow adds that the company need not be large to be
profitable, but it must be large in its own protected market
segment. The market segment must be isolated from

competitors by barriers to entry or by complacency of the
competition (Davidow, 1986: 15).
36
The research of Maidique and Hayes supports the notion
that the most successful high technology firms are highly
focused. These firms realize the great bulk of their sales
either from a single product or from a closely related set
of products (Maidique et aI, 1984: 19). Vesper is also
very supportive of the highly focused niche market
orientation. He asserts that specialized technology and/or
the discovery of a market vacuum will produce a better than
average payoff (Vesper, 1980: 32). Part of this higher
payoff is the result of reduced costs. According to
Davidow, competing in a broad market requires a broad
product line. A tighter focus decreases costs as a result
of a narrow product line and reduced R&D expenditures
(Davidow, 1986: 21).
First-Hand Customer Knowledge. "What is our business
is not determined by the producer but by the customer.
Management must make a conscious effort to get honest
answers from the consumer himself rather than attempt to
read his mind" (Drucker, 1985: 193).
According to Jerry Wasserman, VP of Arthur D. Little
Inc., too many of the high technology start-ups are created
on a bright idea by a bright engineer who develops a good
product for a limited application. A problem arises because
the engineer thinks that he knows his markets (Industry

37
Week, 1985: 53). In all likelihood, market research was not
done, and the entrepreneur probably does not understand the
market or know what is needed to solve its problems
(Bellack, 1985: 80).
A good example of the misinformed entrepreneur is
Allen H. Michels, founder and president of Convergent
Technologies. Convergent had a very successful first
product offering, went public two years after founding, and
was seemingly successful. The following year the firm lost
$30 million on their lap-top computer product line. No
marketing research had been done, and when the firm
attempted to introduce three more products, the market did
not respond as had been expected. After the fact, Michels
continued to maintain that good products will sell
themselves (Business Week, 1984: 83).
Bleicher maintains that high technology firms do not
rely as heavily on traditional techniques of marketing as do
the more mature businesses. Most high technology firms pay
little attention to market research. The president and CEO
of one of the leaders in the word-processing industry has
been quoted as saying that if he had paid attention to the
marketing surveys, he would not have founded his business in
the first place (Bleicher et aI, 1983: 71).
Yeskey alleges that American industrials, in general,
are not strategic marketing organizations. Coopers &
Lybrand's Management consulting Services Division, with whom
-------.--------

38
Yeskey is a director, has found that research sophistication
is still in a formative stage among industrials which still
rely on plant capacities and sales goals rather than studies
of the marketplace. The challenge for industrials and
start-ups alike appears to be the same - listen to the
marketplace and plan products accordingly (Yeskey, 1986:
24) •
In general, the current literature indicates that
marketing research should be done by the high technology
start-up; however, it is also suggested that market research
involving a truly innovative product is difficult to perform
(Bleicher et aI, 1983: 71). The problem with the
literature's suggestions is that arguments on both sides of
the market research issue are based primarily on anecdotes
rather than empirical evidence.
Summary. The successful high technology start-up firm
will have both an innovative product and an intense market
focus. The product must possess a factor of differentiation
for which the customer is willing to pay. The successful
start-up firm must identify a unique market niche and
provide a product which offers a solution rather than merely
a newer technology. First-hand customer knowledge is a
prerequisite for this solutions-orientation.
Financial Control
While a preponderance of the literature addresses
management depth and marketing expertise as those

characteristics which venture capitalists deem to be the
necessary prerequisites for venture capital infusions, a
review of the current literature has yielded little
regarding the practice of sound financial control in the
successful high technology start-up. The existing
literature does focus on the following:
o Sources of Capital,
o Undercapitalization, and
o Planning.
39
Sources of Capital. The bulk of the capital for
start-up creation comes from the savings of the
entrepreneur, his family or friends or from personal bank
loans. These sources account for sixty to ninety percent of
the initial financing for the new start-up firms in the
United States. The remaining ten to forty percent of the
financing needs comes primarily form SBle's, various federal
agencies, venture capital firms, and banks. Informal risk
capital investors, known as "business angels" also provide
start-up capital. These wealthy individuals generally
provide funds in the $50,000 range (Greene, 1985: 57;
Shapero, 1982: 18).
Banks and venture capital firms, however, generally
balk at providing funds unless they see that the
entrepreneur's commitment includes investment of his own
savings (Schilit, 1986: 45). Banks, for example, also want
to see more than two years of operating history. They are

40
interested in companies with products rather than concepts.
Hence, they are almost impossible to deal with as a
potential source for initial funding (Mark, 1983: 86;
Jui1lard, 1986: 90).
The standards for obtaining venture capital are very
high. It is estimated that of every 200 firms that solicit
venture capital funding only three or four are successful in
receiving it. Of those firms that did not receive funds in
1983, sixty-nine percent were high technology oriented.
Greene estimates that less than five hundred firms a year
receive funding from venture capitalists. Historically one
third of these investments have been made in start-up firms
(Greene, 1985: 57; Moser, 1984: 18). However, in 1985 only
fourteen percent of the venture capital investments were
considered to be "seed money" for start-up creation (Bryant,
1986: 38). The primary reason for the limited venture
capital funding at the creation stage is the undefined
nature of the product and its potential. Venture capital
financing does, however, become significant as the product
approaches commercialization (Marshall et aI, 1983: 106).
The other attributes possessed by those high
technology firms which have received funding from venture
capitalists include: a revenue potential of $50 to $100
million annually; the ability to generate about $20 million
in profits, with a seven percent after-tax margin within
five years; and a rate of return on the investment that will

41
be at least twenty percent greater than would be realized
through other risk-free alternatives. In addition, the
entrepreneur/s should demonstrate a willingness to take the
start-up public in the future (Moser, 1984: 19). The lofty
prerequisites of the venture capitalist explain the fact
that only two percent of those seeking venture capital funds
are successful in obtaining them.
Undercapitalization. Research has indicated that the
larger the amount of start-up capital and the larger the
founding team, the greater the likelihood of success
(Roberts, 1970: 25). Undercapitalization, whether the
result of inadequate start-up capital or inadequate cash
flow projections, is the basis of failure for many start-up
firms with outstanding products or services (Hartman, 1983:
43).
The undercapitalized start-up firm is in a state of
continual crisis (Schilit, 1986: 45). This crisis mode
dictates that the entrepreneur spend twenty to thirty
percent of his time searching for funds needed to alleviate
these short-term cash flow problems. While the
entrepreneur's attention is diverted by the search for
funds, the start-up firm as a whole can loose sight of its
chief objectives (Andrews, 1986: 32). In order to avert
failure due to undercapitalization, the current literature
prescribes sound planning and financial control (Andrews,
1986: 34; Schilit, 1986: 45; Stacey 1986: 158).

Planning. A principal distinction made by the
strategic management paradigm is between the day-to-day
management of operations and the management of strategy.
42
The entrepreneur in the start-up venture clearly performs
both of these functions. However, due to time pressures and
limited resources, he is usually so heavily involved with
operating management tasks that he spends little time with
strategic management tasks.
The demands of day-to-day operations put pressure on
management to set aside blocks of time for strategic
planning. Unlike large organizations, the emphasis is not
upon deciding how to allocate resources or upon planning as
a communication mechanism. The principal focus is on
mechanisms for problem identification and for assessment of
current strategy. (Schendel et aI, 1979: 323).
There has not been much explicit research on the
process of establishing a competitively viable business.
For the larger start-up venture, particularly those seeking
venture capital funds, there is usually a new business plan
describing the way in which the firm is to compete. For the
larger group of new ventures, those start-ups without the
discipline of seeking outside capital, the process of
deciding upon a basis of competition seems to be informal
and intuitive. It is oftentimes based on the entrepreneur's
personal "feel" for the market (Schendel et aI, 1979: 321).

43
According to Vesper, the influence of planning on
success has been uncertain. Typically the firm which is
seeking external funding has been forced into developing
detailed plans which include not only the detailed steps to
be taken but also forecasts of future events. On the other
hand, those firms not seeking outside funds generally go
into action and plan as needed from step to step (Vesper,
1980: 51).
Good financial planning commences with the preparation
of the business plan (Stacey, 1986: 159). According to
~immons, "an effective business plan will convince the
investor that you have defined a high-growth opportunity,
that you have the entrepreneurial and management talent to
exploit the opportunity, and that you have a rational,
coherent and believable program for doing so" (Timmons,
1980: 28).
Philip Thurston of the Harvard Business School
suggests that planning does not come easily for many
entrepreneurs (Thurston, 1983: 168). Yet, as other authors
point out, a major cause of failure for the start-up firm is
lack of planning (Mancuso, 1983: 2). Development of a plan
and follow through on that plan are seen as the best means
of enhancing the start-up's success.
Technical and scientific entrepreneurs tend to
downgrade the business plan based on several invalid
reasons. Those reasons include, for example, placing

44
unwarranted faith in the technologically advanced product
without considering marketability and marketing know-how,
viewing the business plan as a negotiating and selling tool
for raising money and not considering it relevant beyond
that, and believing that the most important task for the
start-up is to raise money as an indication of the viability
of their idea. In their enthusiasm for seeking out potential
investors, little time is spent preparing the business plan
and the net result is a deficient plan and no capital; and
the entrepreneurs do not consider possible fatal flaws in
their plans and do not think to seek expert outside review
toward the end of identifying those possible flaws (Timmons,
1980: 30).
As was previously mentioned, the business plan is
defined by many to be a document developed to demonstrate
that the future prospects for a business are good enough to
convince a venture capitalist to back the business with
equity dollars. While this appears to be a commonly held
notion, the business plan serves three main purposes for the
start-up firm: (1) it is, in fact, a sales tool used to sell
the start-up firm, its management and its product to venture
capitalists, (2) from the venture capitalist's perspective,
the business plan plays an important role in the assessment
of risk and return associated with the new venture, and (3)
most importantly, the business plan and its preparation
imposes a discipline on the start-up's management to
-------------------

consider the entire undertaking in a structured manner and
consider the financial implications of proposed actions.
45
The emphasis is on completely understanding the business, as
the business plan is a synthesis of what is likely and what
is possible in marketing, manufacturing, engineering and
finance. The building of the plan and the thought processes
that precede the writing force the entrepreneur to take an
objective and critical look at his/her firm (Seddon, 1984:
5; Larson, 1987: 64; Thurston, 1983: 174; Mancuso, 1983: 3).
Assuming the undertaking is viable, the plan then serves as
a dynamic working document for management (Moser, 1984: 20).
The primary planning error in high technology start-up
companies is failing to precisely define the market which
they are going to target. The problems inherent in this
failure are two-fold: (1) if you cannot precisely define the
customer, you cannot develop a product that meets his needs,
and (2) if you cannot define the market, you cannot define
the barriers to entry and subsequently cannot determine the
cost of entry (Davidow, 1986: 138).
Regardless of the reason for business plan
development, the current literature suggests the following
as essential components of the plan:
(1) statement of corporate goals and objectives,
(2) description of the product including proprietary
position, competitor's product comparison and
regulatory agency requirements,

(3) description of product R&D which includes plans
for new product design, engineering and
technological improvements,
(4) management plan which delineates the management
team members and their associated roles and
responsibilities in addition to descriptions of
expertise and experience offered by each member,
(5) description of technological competencies
relative to the proposed product technology
46
- it is desirable to demonstrate that members of
the top management team have served in the same or
similar functional capacities within firms
producing or utilizing the same or similar
technologies,
(6) market analysis which includes identification and
analysis of customers and competition,
(7) market size and share descriptions which include,
for example, trends, segment descriptions and
estimated market share based on sales projections,
(8) marketing strategy description which includes
detail on pricing, promotion, distribution,
service and warranty policies,
(9) financial projections regarding both profit and
cashflow, and
(10) manufacturing process description, if applicable,
which includes materials requirements, the
-------- - --------- ---------------

47
make/buy decisions, labor requirements, quality
control issues, and production methods (Thurston,
1983: 188; Rich et al, 1985: 62; Schoch, 1985:
80-81; Timmons, 1980: 34; Mancuso, 1983: 30-37).
From the venture capitalist's perspective, the first
real screen of the business plan is the management team's
resumes, which ideally reflect profit and loss experience
and evidence of success. Detail of past experience is most
desirable. Secondly, the market opportunity should be
clearly identified with hard analysis and well-referenced
data. The potential investor needs to believe that the
start-up has targeted an attractive market and developed a
plan to capture an unfair share of it. Financial
projections tend to be lower on the scale of importance.
Oftentimes they are discounted by fifty percent because
there is no adequate explanation as to how the projections
are going to be met (Schoch, 1985: 82).
Summary. While a variety of capital sources exist,
the high technology entrepreneur faces considerable problems
when trying to access these sources. These problems
subsequently tend to increase the likelihood of
undercapitalization. The solution prescribed by the
literature is sound business planning, not only for the
possible acquisition of venture capital, but as the first
and ongoing exercise of sound management practice.

48
CONCLUSION
The current literature on the characteristics of the
successful high technology start-up firm indicates that the
management practices are not necessarily traditional, the
marketing orientation is very focused, and the financial
control mechanisms emulate those of the typical successful
firm.
The key factors associated with the successful high
technology start-up firm include:
1. An organizational climate and culture that
recognize and support creativity,
2. Management practices that promote open
communication channels and participatory decision
making,
3. Policies that motivate the achievement oriented
engineer/scientist to focus on corporate goals,
4. A top management team that collectively has
functional experience in management, marketing and
finance in addition to technological competence,
5. Strategies that are market-driven rather than
technology-driven, and
6. Sound financial planning and control practices
focusing on both the long and short terms, and
including a written plan (Vesper, 1980: 37;
Johnson, 1982: 78; Bleicher et al 1983: 76;
Maidique et aI, 1984: 19; Stacey, 1986: 159).

49
The current business literature oftentimes implies, in
the perception of this researcher, that the venture capital
funded firm possesses certain qualities to which success is
attributed. It appears to be further implied that some
firms do not receive venture capital funding due to the
relative lack of these qualities. Given that the venture
capitalist is interested in investing in successful or
potentially successful firms, the funded firm is used as a
proxy for success.
STATEMENTS OF THE HYPOTHESES
Based upon the preceding review of the literature, the
following seven hypotheses regarding management depth,
marketing skill, and financial control are proposed. (It
should be noted that the terms organic, quality, market
driven, solution, and market niche, as used in the following
hypotheses, are concepts which are operationally defined in
Chapter III.)
Management Depth
HI: The high technology start-up firm which has
acquired venture capital funding maintains an
organizational climate which is more organic than
does the high technology start-up firm which has
not acquired venture capital funding.
H2: The top management team of the high technology
start-up firm which has acquired venture capital

50
funding has a higher quality top management team
than does the high technology start-up firm which
has not acquired venture capital funding.
Marketing Skill
H3: The strategy of the high technology start-up firm
which has acquired venture capital funding will
tend to be more market driven than will the high
technology start-up firm which has not acquired
venture capital funding.
H4: The high technology start-up firm which has
acquired venture capital funding is more likely
to create products which provide solutions to new
problems or superior solutions to existing
problems rather than products which are either
"better mousetraps" or look-alike technology than
is the high technology start-up firm which has
not acquired venture capital funding.
H5: The high technology start-up firm which has
acquired venture capital funding focuses more
narrowly on a market niche which it can control
than does the high technology start-up firm
which has not acquired venture capital funding.

51
Financial Control
H6: The high technology start-up firm which has
acquired venture capital funding is more likely
to plan on going public than the high technology
start-up firm which has not acquired venture
capital funding.
H7: The high technology start-up firm which has
acquired venture capital funding is more likely
to have prepared a formal business plan than
those high technology start-up firms which have
not acquired venture capital funding.

CHAPTER III
RESEARCH DESIGN AND METHODOLOGY
The purpose of this chapter is to discuss the research
design, variable measurement scales, operationalization of
variables, statistical techniques, and hypothesis testing
procedures.
RESEARCH DESIGN
Population Definition
The population selected for the purposes of carrying
out this research study is defined as: the founders of u.S.
based, privately held high technology start-up firms
established during the five-year period of 1983-1987.
The sampling frame used in this endeavor is the
Corporate Technology Directory (CTD) published by Corporate
Technology Information Services, Inc. (Corp Tech) in
Wellesley Hills, Massachusetts. This sampling frame
represents a population of approximately 3,400 high
technology start-up firms.
The Corporate Technology Directory is produced from
information maintained in a computerized data base. While
the directory itself is published yearly, the data base is
continually updated by Corp Tech. By virtue of the fact

53
that the data base represents the most current information,
the sampling frame was selected directly from the
computerized data base in March, 1988.
The sampling frame was provided in zip code order and
contained: CEO/President name, firm name, and firm address.
The sector ID's used by Corp Tech differentiate among
several segments of the high technology arena. Those
segments include: hardware, software, fiber optics, lasers,
AI, robotics, biotechnology, advanced materials, aerospace,
chemicals, factory automation, subassemblies/components,
test and measurement, telecommunications, high technology
services, energy and medical.
The directory does not explicitly state the name/s of
the founder/s of the individual firms. Accordingly, the
name of the CEO/President was used as the sampling unit.
This procedure is justified based upon a previous study
(Goslin & Kiehl, 1988) of seventy-six high technology start
up firms located in the Pacific Northwest in which 97.4
percent of the respondent CEO/Presidents were, in fact, also
founders of their respective firms. In those cases where
the CEO/President was not one of the original founders,
he/she was asked to either respond to the best of his/her
ability or forward the measurement instrument to one of the
founders.

54
Data Collection Method
Due to the fact that secondary data sources relevant
to this research topic do not appear to exist, primary data
collection was undertaken. Data was collected through the
use of a mail survey. A mail survey was selected for data
collection because a nationwide sample was desired, and it
was felt that the cost per response would be the most
reasonable for this type of interrogation method vis a vis
telephone or personal interviewing. The survey instrument
is included in Appendix A. This instrument is intended to
measure both demographic characteristics and attributes of
firm behavior in an effort to assess the differences between
venture capital funded and unfunded high technology start-up
firms regarding the characteristics of management, marketing
and finance which have been identified in the hypotheses.
Sampling Method
A probability sample of 1350 founders of high
technology start-up firms was drawn from the previously
defined sampling frame through the use of a systematic
random sampling design. Given the expectation of a response
rate of approximately twenty percent, the large sample size
insured the attainment of an adequate final sample size
necessary to properly test the hypotheses. It should be
noted that the status of the firms regarding venture capital
funding was not known prior to the mailing. It was felt
that a twenty percent response rate would result in a
-------- --------

55
sufficient number of firms in each group (venture capital
funded and unfunded). The responses associated with the
previously mentioned Goslin and Kiehl study resulted in
sixty-four percent of the study firms being funded with the
remainder being unfunded (Goslin and Kiehl, 1988).
Sample Size
For the purposes of this research study, the key
variable concerns the presence or absence of venture capital
financing. Based on this dichotomy, all hypotheses are
tested to demonstrate that a greater proportion of the
venture capital funded high technology start-up firms
possessed a particular hypothesized attribute to a greater
degree than the unfunded firms. As a result, the
proportional formula for determining sample size was used to
determine the maximum sampling error. The exact formula
used was [(Z2) * P(l-P)] / (E2), where the Z-value
represents the level of confidence, P(l-P) represents the
variance and E represents the maximum allowable sampling
error (Tull et aI, 1984: 415) •
When measuring proportional attributes of a
population, the population variance is P(l-P). Given that
the population variance is unknown, as it is was at the
commencement of this research study, it is suggested as
being prudent to use a P-value of .5 (Emory, 1980: 164).
This will result in the use of a variance of .25, which is
the maximum value that the variance formula will allow;

therefore, it is deemed to be the most conservative
subjective estimate.
56
A decision was made to use a confidence level of
ninety percent. The ninety percent confidence level implies
that the probability is ten percent or less that the maximum
allowable sampling error, as defined in the ensuing
discussion will be exceeded.
Based on a sample size of 226 and the use of the
proportional formula for determining sample size, the
maximum allowable sampling error is 5.5 percent, which is an
acceptable midrange sampling error for descriptive studies.
In order to achieve the desired response rate, two
mailings were done. The first mailing was sent to the 1350
high technology start-up firms which were included in the
sampling frame provided by Corp Tech. Each potential
respondent was sent a packet which included a cover letter
explaining the nature of the study and requesting his/her
participation, a copy of the survey instrument, and a
"Results Request" form to be completed given that the
respondent desired a summary of the research results.
As a result of the first mailing, 261 questionnaires
were returned by the US Postal Service as being
nondeliverable. The primary reasons given for the returned
mail were "no forwarding address" and "addressee unknown".
One can only assume that the firms involved in these returns
have become defunct.

57
Given the nondeliverable rate of nineteen percent, the
resulting response rate for the first mailing was
approximately sixteen percent, resulting in 177 completed
questionnaires. Because the desired response rate was not
achieved, a second mailing was undertaken exactly one month
after the initial mailing. Each packet contained a follow
up letter, a fresh copy of the questionnaire and an
additional "Results Request" form. The second mailing went
to the remaining 911 potential respondents.
A response rate of five percent was achieved for the
second mailing. This resulted in an aggregate response rate
for the two mailings of twenty-one percent. Consequently no
additional mailings were done, as the desired response rate
had been attained. The final sample size was then 226 with
sixty-three percent of the firms being funded and the
remainder being unfunded.
MEASUREMENT SCALES
Independent Variable
The independent variable is the basis for comparison
of attributes of the high technology start-up firms. As
previously discussed, the independent variable in this
research study is venture capital funding. Venture capital
funding is measured by a ratio scale, which indicates the
actual number of rounds of venture capital which the firm
has received. The hypotheses specify comparisons between
-------- ---------- ----

funded and unfunded high technology start-up firms. As
such, it is necessary to measure venture capital funding
through the use of a dichotomous measure by defining an
unfunded firm as one having (0) rounds of funding and a
funded firm as one having (1-4) rounds of funding.
58
Two additional ratio scale measurements are utilized
for those firms which have received at least one round of
venture capital financing. The first measurement indicates
the dollars received per round and the second measurement
indicates the related equity cost for each round of venture
capital financing to a maximum of four rounds. These latter
two measurements are used to calculate a ratio, equity cost
/ dollars received, indicating the percent of equity given
up for each dollar of venture capital financing received.
While the "equity cost / dollars received" ratio can provide
additional information about the funded firms, not all firms
are willing to disclose this information. Measurement of
the number of rounds of venture capital funding is,
therefore, the major means of acquiring the appropriate data
for the purposes of hypotheses testing.
Dependent Variables
The dependent variables necessary to test the
hypotheses are defined by the current business literature
as:
1. organizational climate,
2. quality of the top management team,

59
3. strategy,
4. solutions orientation,
5. market niche strategy,
6. plan to go public, and
7. business plan.
The selection of the dependent variables and the
subsequent selection of the means of operationalizing the
dependent variables are based on this researcher's
perception of importance as indicated by the prevalence of
these notions in the current business literature. In those
cases where a dependent variable or concept is defined by
multiple operational measures no attempt is made to give
each component measure other than an equal weighting. (See
HYPOTHESIS TESTING section.) The rational for this approach
is based on the fact that any weighting scheme is purely
subjective at this point - that is, no theoretical or
empirical basis for weighting exists. Equal weighting is,
therefore, deemed to be the most reasonable approach.
Organizational climate is measured by Likert scales
which indicate the degrees to which the firm possesses the
following attributes:
o vertical and horizontal communication flow,
o firm policies (e.g. ethics, profit sharing,
integrity) which are very consistent with corporate
goals,
o informal participatory decision making,

60
o tolerance of failure, and
o a value system whereby integrity is more important
than profit.
Quality of the top management team is measured by the
respondent's assessment of the prior functional experience
of each member of the top management team. The variables
used to measure quality include: prior, primary functional
experience, size of the organization where the experience
was gained, years of experience, and level of organizational
responsibility.
The selection categories for the primary functional
experience include management, marketing/sales,
finance/accounting, engineering/science,
manufacturing/operations (if applicable), R&D (if
applicable), and an "Other" category to capture all other
possible functional experiences. A nominal scale is used to
measure these categories.
A ratio scale is used to measure the size of the
organization worked for in terms of incremental steps of $1
million dollars of annual sales revenues. Years of
experience is measured via a ratio scale, and level of
organizational responsibility is defined by a seven-point
interval scale reflecting a range of responsibility levels.
As a guideline, the following is suggested to the
respondents (see Appendix A): CEO = "1", vice president of a

61
functional area = "3", departmental manager = "5", and group
supervisor = "7".
Two additional nominal scale measurements are used to
specify whether or not each individual team member: (1) has
served in the same or similar functional capacity as that in
which he/she now serves, and (2) has had his/her primary
past experience in a firm which utilized or produced the
same or a similar technology.
Strategy is measured by Likert scales which indicate
the degrees to which the respondent possesses the following
opinions about the firm:
o our product is so good that it will sell itself,
o we are knowledgeable about competitor activities,
o our employees are very customer focused, and
o we believe that market demand is primary to
technological sophistication.
Likert scales are used to measure perceptions
regarding strategy as well as the majority of the following
dependent variables because it is relatively easy for the
subjects to respond. They are merely asked to express
relative aggreement or disagreement with respect
to a given statement. It should be noted that a single
subject's Likert scale score is meaningless if it stands
alone. However, in studies such as the present one, the
scores gain meaning by virtue of the use of comparison
groups.

62
While the Likert scale is both easy to construct and
easy to use, it has been found that the results obtained are
comparable to those obtained, for example, by an anchored
semantic differential scale (Tull et aI, 1976: 359; Schoner
et aI, 1975: 271).
Solutions orientation is also measured by Likert
scales which indicate the degrees to which the respondent
has the following beliefs about the firm:
o customer feedback is essential to product
development,
o our employees are very customer focused,
o we are intimately knowledgeable about our
customers' business, and
o we maintain sharp vertical market segmentation.
Market niche strategy is measured by Likert scales
which indicate the following respondent perceptions about
the firm:
o our intent is to avoid direct competition with
larger companies,
o our firm strives to be low cost producer,
o uniqueness of our product deters entry by others,
o our product appeals to a broad market, and
o we have identified customer needs or
characteristics that differ from the larger market
as a whole.

63
Plan to go public is commonly known as the intent to
make a public stock offering. It is measured by the use of
a Likert scale which indicates the probability of the firm
going public within the next two years. A two year time
frame is used in an effort to elicit a more concrete
response. An additional ratio scale measurement is used to
determine the time frame, relative to the year of founding,
within which the firm may go public. A maximum time period
of five years is used.
Formal business plan represents the firm's strategic
plan, and is also used as a selling document in the search
for funding. The development of a formal business plan is
measured in several ways. A ratio scale is used to
determine the number of pages there are in the respondent's
business plan. Additionally, a nominal scale is used to
determine the primary purpose of developing the business
plan. The nominal scale categories include: operating
necessity, venture capital requirement, market strategy and
definition, and "other "
To increase the amount of information regarding
business plan preparation, a ten-point rating scale is used
to measure the respondent's perceptions of the three most
important business plan components specified in the
following list:
o product definition,
o management team,

64
0 product R&D,
0 market analysis,
0 marketing strategy,
0 profit and cashflow projections,
0 manufacturing (if applicable),
0 market size / share, and
0 technological competency.
In addition, two nominal scale measures are used to
ascertain the respondent's perceptions regarding both the
most important component and least important component
relative to those specified above.
OPERATIONALIZATION OF VARIABLES
Hypothesis 1
The high technology start-up firm which has acquired venture capital funding maintains an organizational climate which is more organic than does the high technology start-up firm which has not acquired venture capital funding.
Five statements are posed to respondents in order to
ascertain their perceptions of the organizational climate of
their respective firms. The respondents are asked to
indicate the extent to which they agree or disagree with the
statements using the following Likert scale:
1. Strongly disagree
2. Somewhat disagree
3. Neither
4. Somewhat agree

5. Strongly agree
The five statements, as they are posed in the survey
instrument, defining organizational climate include:
H1.1. Open communication flow, both horizontal and
vertical, is never encouraged.
H1.2. Our decision making style is very
participatory.
65
H1.3. Our culture does not include a tolerance of
failure as a part of learning.
H1.4. Our policies (e.g. ethics, profit sharing,
integrity) are very consistent with corporate
goals.
H1.5. Profit is much more important than integrity.
Based on the preceding questions, the organic
organizational climate is strongly characterized by
responses of 1, 5, 1, 5, and 5 respectively. On the other
hand, the mechanistic organizational climate is strongly
characterized by responses of 5, 1, 5, 1, and 1 to the same
five statements.
In order to test hypothesis 1, the responses to the
aforementioned statements are coded to insure consistency
between extremes on the Likert scale, as defined above, and
definitions of organic and mechanistic organizational
climates. The actual coding scheme is as follows:
1. The organic organizational climate is represented
by a "5" on the Likert scale.

66
2. The mechanistic organizational climate is
represented by a "1" on the Likert scale.
3. statements H1.1 and H1.3, as stated above, are
reverse coded, i.e. "1" becomes "5", "2" becomes
"4" and so on.
4. Questions H1.2, H1.4, and H1.s are coded exactly
as they have been answered.
Table I summarizes the variables necessary to test
hypothesis 1.
TABLE I
HYPOTHESIS 1 - VARIABLE DEFINITIONS
Variable
v1.1 v1.2 v1.3 v1.4 v1.s
HyPothesis 2
Description
Open communication flow Participatory decision making Tolerance of failure Policies consistent with corporate goals Integrity more important than profit
The top management team of the high technology startup firm which has acquired venture capital funding has a higher quality top management team than does the high technology start-up firm which has not acquired venture capital funding.
A matrix, as is illustrated in Appendix A, is used to
acquire the bulk of the necessary data regarding the prior,
primary functional experience of the top management team.
For each team member, designated as CEO, B, C and D, the
respondent is asked to provide the number of years
experience, the level of organizational responsibility and
-------- ------------

67
the annual sales volume of the firm in which the experience
was gained. These three items of data are to be within one
of the seven aforementioned functional areas for each team
member specified. Appendix A contains an example of this
response scheme on page 150.
For the purposes of data analysis, four variables are
assigned to each team member, based upon the specified
functional area and three items of data within that area.
These variables are summarized in Table II.
Two additional ratio scale variables are generated
from the data provided in the matrix. They are: number of
top management team members and number of functional areas
represented by the team's prior experience.
Two supplementary questions are also posed in order to
determine whether or not the prior experience of each team
member, as defined by the matrix: (1) is directly related to
the functional capacity in which he/she now serves, and (2)
was gained in a firm which utilized or produced a like
technology. The two questions posed to garner this
information are:
- -------------
H2.1. Please specify those members of your top
management team who now serve in the same or a
similar functional capacity as that specified
above.
members. )
CEO
'~ase circle the appropriate team
B C D

H2.2. Please specify those members of your top
management team whose previous experience (as
defined in the matrix above) was in a firm
utilizing or producing the technology that
supports your product. (please circle the
appropriate team members.)
CEO B C D
68
The resulting variables are also summarized in Table II.
Each of these variables is coded utilizing a '0' if the team
member is not circled, and a '1' if the team member is
circled.
TABLE II
HYPOTHESIS 2 - VARIABLE DEFINITIONS
Variable
v2.1A v2.2A v2.3A v2.4A v2.SA v2.6A v2.1B - v2.6B v2.1C - v2.6C v2.1D - v2.6D v2.7 v2.8
Hypothesis 3
Description
CEO Function CEO Years CEO Level of Responsibility CEO Annual Sales Volume CEO Same Functional capacity CEO Same or Similar Technology Team Member B Team Member C Team Member D Number of team members Number of functional areas represented by prior experience
The strategy of the high technology start-up firm which has acquired venture capital funding will tend to be more market driven than will the high technology start-up firm which has not acquired venture capital funding.
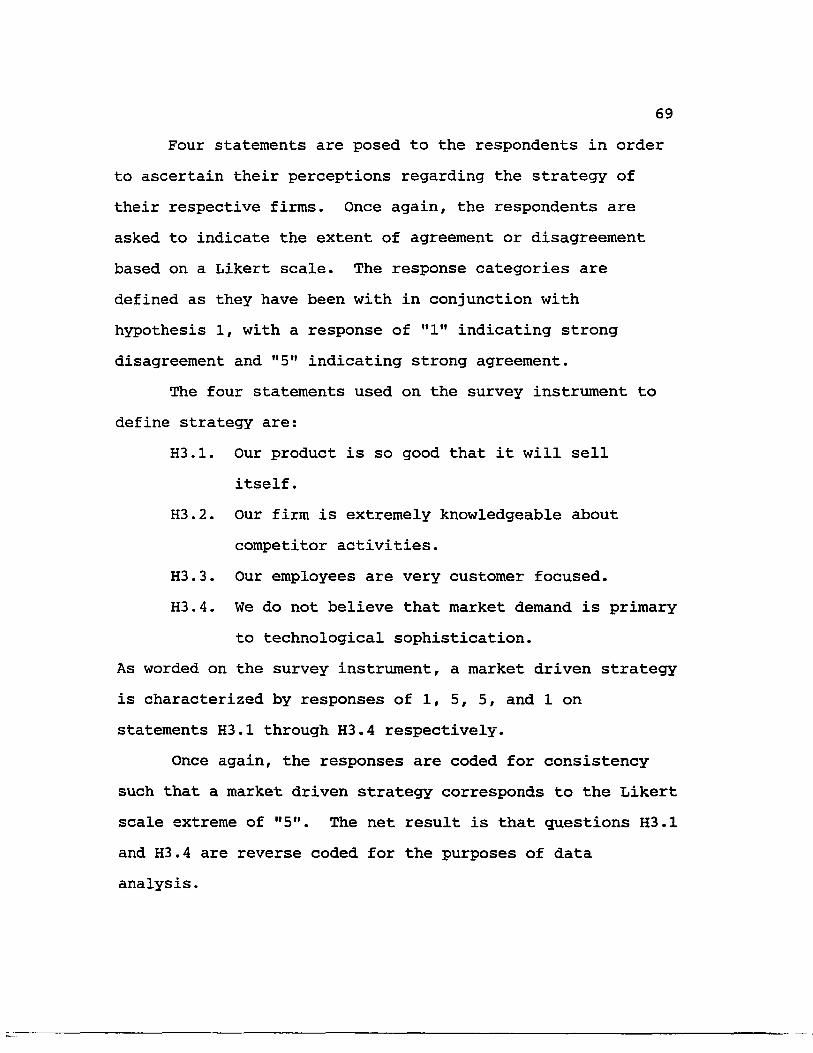
69
Four statements are posed to the respondents in order
to ascertain their perceptions regarding the strategy of
their respective firms. Once again, the respondents are
asked to indicate the extent of agreement or disagreement
based on a Likert scale. The response categories are
defined as they have been with in conjunction with
hypothesis 1, with a response of "1" indicating strong
disagreement and "5" indicating strong agreement.
The four statements used on the survey instrument to
define strategy are:
H3.1. Our product is so good that it will sell
itself.
H3.2. Our firm is extremely knowledgeable about
competitor activities.
H3.3. Our employees are very customer focused.
H3.4. We do not believe that market demand is primary
to technological sophistication.
As worded on the survey instrument, a market driven strategy
is characterized by responses of 1, 5, 5, and 1 on
statements H3.1 through H3.4 respectively.
Once again, the responses are coded for consistency
such that a market driven strategy corresponds to the Likert
scale extreme of "5". The net result is that questions H3.1
and H3.4 are reverse coded for the purposes of data
analysis.

Table III summarizes the variables necessary to test
hypothesis 3.
TABLE III
HYPOTHESIS 3 - VARIABLE DEFINITIONS
Variable
v3.l v3.2 v3.3 v3.4
HyPothesis 4
Description
Product does not sell itself Knowledgeable about competitor activities Employees are customer focused Market demand is primary to technological sophistication
70
The high technology start-up firm which has acquired venture capital funding is more likely to create products which provide solutions to new problems or superior solutions to existing problems rather than products which are either "better mousetraps" or lookalike technology than is the high technology start-up firm which has not acquired venture capital funding.
Four statement are posed in order to test respondent
perceptions regarding the presence or absence of a solutions
orientation. Once again, Likert scales are used with "1"
indicating strong disagreement and "5" indicating strong
agreement. The statements as they appear on the survey
instrument include:
H4.l. Customer feedback is not essential to our
product development.
H4.2. Our employees are very customer focused.
H4.3. Our firm is intimately knowledgeable about our
customers' business.

71
H4.4. Our firm's focus is on sharp unique market
segmentation.
It should be noted that questions H4.2 and H3.3 are one in
the same, as a customer focus is a necessary component of
both a market driven strategy and a solutions orientation.
As worded on the survey instrument, a solutions
orientation is strongly characterized by responses of 1, 5,
5, and 5 on statements H4.1 through H4.4 respectively. The
"better mousetrap" or technological sophistication
orientation is characterized by a reversal of the responses,
i.e. 5, 1, 1, and 1, to these statements.
Here again, the responses are reverse coded where
necessary for consistency. In this case, a solutions
orientation is represented by a "5" on the Likert scale, and
the technological sophistication orientation is represented
by a "1". Table IV sununarizes the variables necessary to
test hypothesis 4.
TABLE IV
HYPOTHESIS 4 - VARIABLE DEFINITIONS
Variable
v4.1
v4.2 v4.3
v4.4
Description
Customer feedback essential to product development = v3.3 = Employees customer focused Intimately knowledgeable about customers' business Focus on sharp unique market segmentation

Hypothesis 5
The high technology start-up firm which has acquired venture capital funding focuses more narrowly on a market niche which it can control than does the high technology start-up firm which has not acquired venture capital funding.
Six statements are posed to the respondents in order
to determine the respondents' perceptions of the market
focus of their respective firms. Once again, the same
Likert scale, with "1" representing strongly disagree and
72
"5" representing strongly agree, as delineated previously is
used. The six statements as they appear on the survey
instrument are:
Hs.l. We compete directly with very large companies.
Hs.2. We strive to be low cost producer.
Hs.3. Uniqueness of our product deters entry by
others.
Hs.4. Our product appeals to a broad commodity
market.
Hs.s. Our firm's focus is on sharp unique market
segmentation.
Hs.6. our market has needs or characteristics that
differ from the larger market as a whole.
A narrow focus on a market niche is strongly
represented by responses of 1, 1, 5, 1, 5, and 5 on
statements Hs.l through Hs.6 respectively. Reverse coding
of statements Hs.l, Hs.2 and Hs.4 results in a Likert scale
value of "5" defining a narrow focus on a market niche.

Table V summarizes the variables necessary to test
hypothesis 5.
TABLE V
HYPOTHESIS 5 - VARIABLE DEFINITIONS
Variable
v5.l
v5.2 v5.3 v5.4
v5.5
vS.6
Hypothesis 6
Description
Do not compete directly with very large companies Do not strive to be low cost producer Uniqueness of product deters entry Product does not appeal to a broad commodity market = v4.4 = Focus on sharp unique market segmentation Our market differs from the larger market as a whole
73
The high technology start-up firm which has acquired venture capital funding is more likely to plan on going public than the high technology start-up firm which has not acquired venture capital funding.
Plan on going public is measured in two fashions. The
first method is by means of a Likert scale, and the second
is through the use of a ratio scale. The questions posed
for the purpose of testing hypothesis 6 are:
H6.l. What is the probability of your firm going
public in the next two years ?
1. Definitely will not
2. Probably will not
3. Not sure
4. Probably will
5. Definitely will

74
H6.2. We expect to go public within ____ years of
founding.
1 2 3 4 5 N/A
The assumption that is made regarding the wording
of both questions is that the fewer the number of
years specified, the more likely it is that the event
of going public will actually occur. The variables
necessary to test hypothesis 6 are summarized below.
TABLE VI
HYPOTHESIS 6 - VARIABLE DEFINITIONS
Variable Description
v6.1 Probability of going public in two years or less
v6.2 Years elapsed between founding and going public
Hypothesis 7
The high technology start-up firm which has acquired venture capital funding is more likely to have prepared a formal business plan than those high technology start-up firms which have not acquired venture capital funding.
Five questions are posed to examine business planning
in the high technology start-up firm. The first of the five
questions is the only one necessary to test hypothesis 7.
That question, as it appears on the survey instrument, is:
H7.1. How many 8 1/2 x 11 pages are there in your
business plan ?

75
The basic information needed is whether or not the
respondent firm has prepared a business plan, which requires
either a "yes" or "no" response. Since the question as
posed on the survey instrument collects ratio scale data,
for the purposes of testing the hypothesis a "0" response
corresponds to a "no" and any response greater than "0"
corresponds to a "yes".
Further comparisons of the firms are made on the
following interval cuts of the data:
1. 10 or fewer pages,
2. 11 - 25 pages,
3. 26 - 50 pages, and
4. 51 or more pages.
Questions H7.2 through H7.4 collect additional
exploratory data regarding business plan preparation. The
current business literature is unclear as to which
components are the most important. There appear to be two
opposing viewpoints: On one hand, it is said that every
component is of equal importance. On the other hand, it is
said that the management and marketing components are the
most important, from the venture capitalist's point of view.
The intent here is to determine, from the respondent's point
of view, both the most important and least important
components. Additionally, the findings are compared to
determine differences, if any, between venture capital

funded and unfunded high technology start-up firms. The
three questions posed to collect this data are:
H7.2. Which component of your business plan do you
consider to be the most important ?
1. Product definition
2. Market analysis ( customers and
competition)
3. Marketing strategy (pricing, promotion,
distribution, etc.)
4. Product R&D
5. Manufacturing (if applicable)
6. Profit and cashflow projections
7. Management team
8. Market size / share
9. Technological competency
H7.3. Which component of your business plan do you
consider to be the least important ?
1. Product definition
2. Market analysis ( customers and
competition)
3. Marketing strategy (pricing, promotion,
distribution, etc.)
4 • Product R&D
5. Manufacturing (if applicable)
6. Profit and cashflow projections
7. Management team
--------
76

8. Market size / share
9. Technological competency
H7.4. Please divide 10 points among three of the
business plan components listed below so that
the division will reflect the three most
important to you.
Product definition
Management team
Product R&D
Market analysis
Marketing strategy
Profit and cashflow projections
Manufacturing (if applicable)
Market size / share
Technological competency
77
Nominal scale data, indicating both the most and least
important business plan components are elicited by questions
H7.2 and H7.3. Question H7.4 collects interval scale data
which reflects not only a rank ordering of the three most
important components, from the respondent's point of view,
but also weights those choices such that, for example, one
particular component can be said to be two or three times as
important as another.
An attempt is being made to ascertain those components
of the business plan on which the most resources are
expended during preparation and correspondingly which

components comprise the bulk of the final plan. An
assumption is made here that resources and final business
plan emphasis is based on the respondent's perceptions of
the importance of the various components.
The fifth question regarding business planning is
posed in order to determine the purpose for which the
78
business plan, if any, was prepared. Nominal scale data is
collected by means of the following question:
H7.S. For what primary purpose did you develop your
business plan ?
1. Operating necessity
2. Venture capital requirement
3. Market strategy and definition
4. Other (please specify)
TABLE VII
HYPOTHESES 7 - VARIABLE DEFINITIONS
Variable
v7.1 v7.2 v7.3 v7.4.1 v7.4.2 v7.4.3 v7.4.4 v7.4.S v7.4.6
v7.4.7 v7.4.8 v7.4.9 v7.S
Description
Number of pages in business plan Most important business plan component Least important business plan component Product definition weighting Management team weighting Product R&D weighting Market analysis weighting Marketing strategy weighting Profit and cashflow projections weighting Manufacturing weighting Market size / share weighting Technological competency weighting Purpose of business plan development

79
The variables necessary to test hypothesis 7 and its related
questions are detailed in Table VII.
STATISTICAL TECHNIQUES
The statistical techniques used in this research study
include ANOVA, Chi-square and Pearson Correlation. Each
technique is discussed in a general fashion, followed by a
detailed discussion of application to the individual
statements of the hypotheses.
For those hypothesis tests involving Likert scale
variables, testing takes place on two levels. First, the
individual Likert scales used to measure an attribute are
examined to determine differences at a component level.
Secondly, a sum of scores for each attribute is developed
and tested to determine the attribute at the holistic level.
Once again, close examination of the individual Likert
scales indicates, at first blush, that not all scoring is in
one direction. This is contrary to the logic underlying the
use of a sum of scores, but necessary for the continuity of
the survey presentation. All scoring is standardized as to
the direction before analysis is undertaken.
In order to make inferences about the differences
between population means, the null hypothesis of no
difference between means is assumed. The ANOVA statistical
technique is used to determine the probability that the
means of the interval and ratio scale variables for venture

capital funded firms and unfunded firms deviate from one
another due to the effects of the presence or absence of
venture capital infusions rather than sampling variation.
In other words, can the observed differences be reasonably
attributed to chance or is there reason to suspect true
differences between the two groups? (Tull et aI, 1984:
471).
80
When utilizing univariate ANOVA, the variability in
the sample is divided into two parts - variability of
observations within a group and variability between the two
groups. If the variability within groups is minimal and the
group means vary a great deal, than the means are probably
not equal.
The observed F-value is developed based on the ratio
of the variability between groups / the variability within
groups. Additionally, a critical F-value is determined
based on the degrees of freedom and the chosen level of
significance. The degrees of freedom depend upon both the
number of groups and the number of cases in the sample. If
the observed F-value is greater than the critical F-value at
the chosen level of significance, it would indicate that
there is a difference between the groups and the null
hypothesis should be rejected.
In addition, Pearson correlation coefficients are
calculated for all pair combinations of independent
variables utilized to measure each particular attribute in

question. The intent here is to determine the extent to
which autocorrelation is present.
81
For those hypothesis tests utilizing nominal scale
variables, the Chi-square statistic is employed. Chi-square
is used in this case to determine if venture capital funded
and unfunded high technology start-up firms differ in the
way that they are distributed into the discrete nominal
categories used in each particular hypothesis test. Chi
square is a test of independence, and is used in conjunction
with crosstabulation or contingency tables. Two variables
are independent if the probability that a case falls into a
particular cell is the product of the marginal probabilities
of the categories defining that particular cell.
To construct a Chi-square test of independence the
following general procedure is used:
1. For each cell of the contingency table, the
probability of a case falling into a cellij of the
table is estimated by Pij (row = i and column = j)
= (count in row if N) * (count in column j f N ).
2. The null hypothesis is a test of independence
between venture capital funding and the particular
variable associated with the hypothesis being
tested.
3. Determine the expected number of cases in each
cellij using the formula Eij = N(Pij) = [(count in

82
row i) *(count in column j)] / N, where N = total
sample size.
4. Calculate X2 = [E-E- (0- - - E- _)2] / E- - where ~ J ~J ~J ~J'
0ij = the actual number of cases or observations
in cellij.
5. Determine the degrees of freedom based upon the
number of rows (R) and columns (C) in the
contingency table. For an R x C table, the
degrees of freedom are (R-l)*(C-l).
6. The probability of obtaining the calculated X2
value given the associated degrees of freedom is
then determined. If the probability is small
enough, the null hypothesis is rejected (Tull et
aI, 1984: 483).
HYPOTHESIS TESTING
The intent of this research study is to draw
inferences to the ,population of high technology start-up
firms. The general question to be answered by the tests of
the hypotheses is not whether the sample measures of central
tendency for the various attributes are, in fact, different,
but whether the two population measures of central tendency
are different in each case.
Notation
To ease the task of representing the hypothesis tests
in an operational form, the following notation is used. The

hypotheses themselves are denoted, as previously, by Hi,
where i equals the hypothesis number as it appears in the
Statements of the Hypotheses section in Chapter II. The
variables used in testing each hypothesis are denoted
83
slightly differently than they are in Tables I through VII.
For the purposes of the ensuing discussion, variables
are denoted by vai.j, where a equals either venture capital
funded (F) or unfunded (U), i equals the hypothesis being
tested, and j equals a unique variable number as defined in
the aforementioned tables. When the mean value for a
particular variable is discussed, it is denoted by an upper
"V" V . . case , e.g. a~.J.
Statistical Computations
All descriptive statistical calculations and
hypothesis testing are accomplished through the employment
of the Statistical Package for the Social Sciences (SPSSX).
The IBM 4381 mainframe computer at Portland State University
is used to execute SPSSx.
HyPothesis 1
Hl is tested through the use of ANOVA. As was
previously mentioned, testing takes place on two levels.
The individual Likert scale means for variables vFl.l
through vFl.S and vUl.l through vUl.S are compared
respectively to determine whether true differences exist
between the venture capital funded and unfunded groups of

84
firms. Secondly, the sum of scores means for vF1.j and
vu1.j, where j varies from 1 to 5, are calculated and
compared. The SPSSx procedure, ANOVA, actually develops the
means and performs the necessary statistical calculations.
H1 hypothesizes that the venture capital funded firm
has an organizational climate which is more organic than
that of the unfunded firm. It is expected that descriptive
statistics will indicate mean values of VF1.j and VU1.j
which are not equal, and will also indicate that both are
closer to a Likert scale value of "5", representing an
organic organizational climate, rather than a "1",
representing a mechanistic organizational climate.
For the purposes of testing H1, it is operationalized
as follows: H1: VF1 > VU1. The null hypothesis is then the
hypothesis of no difference, HO: VF1 = VU1. It is expected
that the observed F-value developed by the ANOVA statistical
procedure is less than or equal to the critical F-value at
the .10 level of significance. The null hypothesis should
not be rejected indicating that there is no significant
difference between the groups' perceptions regarding their
organizational climate. The expected result of no
significant difference is based on previous research by
Goslin and Kiehl (Goslin and Kiehl, 1988). (See Appendix B
for a summary of expected results of all hypothesis tests.)

85
Hypothesis 2
H2 is also tested through the use of ANOVA. Multiple
tests are performed to ascertain differences, if any,
between funded and unfunded firms regarding years of
experience, responsibility levels and annual sales volumes
on an aggregate team basis.
For each team, the following aggregates are
calculated:
1. Total years experience = TY = v2.1A + v2.1B +
v2.1C + v2.1D.
2. Total responsibility levels = TL = v2.2A + v2.2B +
v2.2C + v2.2D.
3. Total sales volume = TS = v2.3A + v2.3B + v2.3C +
v2.3D.
The initial assessment of top management team quality is
equated to aggregate analysis of these team totals, i.e. the
greater the TY and the TL and the TL, the higher the
quality.
In terms of the mean TY, TL and TS, it is expected
that (TYF > TYu) and (TLF > TLu) and (TSF > TSu). It should
be pointed out that v2.2A, v2.2B, v2.2C and v2.2D are
recoded with 1 = 7, 2 = 6, 3 = 5 and so forth to provide
continuity regarding the direction of the hypothesized
relationship.
The null hypcthesis in the case of each measure is

86
that of no difference, and it is expected to be rejected at
the .10 level of significance.
The second aspect of quality to be tested regards the
number of members on the top management team, v2.7. The
mean size of the top management team of the funded firm is
expected to be larger than that of the unfunded firm. The
null hypothesis, HO: VF2.7 = VU2.7, is one of no difference.
It is expected that this null hypothesis will be rejected at
the .10 level of significance, and these results will
support hypothesis 2.
The third aspect of quality to be examined is the
number of functional areas represented by the prior
experience, v2.8. Once again, the mean number of areas for
funded firms, VF2.8 is expected to be larger than the mean
for unfunded firms, VU2.8. The null hypothesis of no
difference is expected to be rejected at the .10 level of
significance.
The fourth aspect of quality to be tested is whether
or not each of the team members serves in a similar capacity
as in his/her prior experience. While nominal scale data
was collected, it is used to build a ratio scale measure
reflecting the total number of team members for whom the
response to v2.S was "1". The team total is represented by
TF = v2.SA + v2.SB + v2.SC + v2.SD. The null hypothesis is
that of no difference, HO: TFF = TFU. It is expected to be
rejected at the .10 level of significance.

87
A similar technique is used to test the final aspect
of quality regarding the total number of team members whose
prior experience was in a firm utilizing or producing a like
technology. This team total = TT = v2.6A + v2.6B + v2.6C +
v2.6D. Here again, the null hypothesis, HO: TTF = TTU' is
expected to be rejected at the .10 level of significance.
Given that all of the hypothesis tests have the
expected results, as delineated above, hypothesis 2 is
expected to be accepted, as it will be shown that the funded
firms do have a higher quality top management team.
Hypothesis 3
H3 is also tested through the use of ANOVA. As with
hypothesis 1, the Likert scale means for vF3.1 through vU3.6
and the sum of scores means for vF3.j and vU3.j are
developed. Descriptive statistics are expected to indicate
that VF3.j > Vu3.j for all individual Likert scales and the
sum of scores.
To test hypothesis 3, once again the null hypothesis
is one of no difference, HO: VF3 = VU3. It is expected that
the observed F-value will be greater than the critical F
value at the .10 level of significance. The null hypothesis
is to be rejected thereby indicating that there are
significant differences between the venture capital funded
and unfunded high technology start-up firms. The funded
firms tend to be more market driven than the unfunded firms.

88
Hypothesis 4
H4 is also tested through the use of ANOVA. As with
previous hypotheses, the Likert scale means and the sum of
score means for vF4.1 through vU4.4 are calculated. It is
expected that VF4 > VU4 for all individual Likert scales and
the sum of scores.
The higher VF4 indicates that the funded firms have
more of a solutions orientation based on the previously
discussed notion that a "5" on the Likert scale represents a
solutions orientation, whereas a "1" represents a
technological orientation.
To test hypothesis 4, the null hypothesis is one of no
difference, HO: VF4 = VU4. It is expected that the observed
F-value developed by ANOVA is greater than the critical F
value at the .10 level of significance. The null hypothesis
is to be rejected indicating, once again, that there are
significant differences between the venture capital funded
firms and the unfunded firms. In this case, the funded
firms are expected to be more likely to have a solutions
orientation than are the unfunded firm.
Hypothesis 5
ANOVA is utilized to test the Likert scale means and
the sum of scores means of vF5.1 through vU5.4. Here again,
it is expected that VF5 > VU5 for both the individual Likert
scales and the sum of scores. The null hypothe~is of no
difference, HO: VF5 = Vu5, is expected to be rejected at the

89
.10 level of significance as the observed F-value is greater
than the critical F-value.
Based upon these expectations and the premise that a
"5" on the Likert scale corresponds to a niche focus, the
venture capital funded start-up firm does focus more
narrowly on a market niche than does the unfunded firm.
Hypothesis 6
H6 is tested through the use of ANOVA. The
probability of a start-up firm going public within the next
two years is expected to be greater for those high
technology start-up firms which have received venture
capital funding than for the unfunded-firms. In other
words, the mean probability value of VF6.1 is expected to be
greater than that of VU6.1.
The null hypothesis, HO: VF6.1 = VU6.1, is that of no
difference. Based upon the expectation that the observed F
value will be greater than the critical F-value at the .10
level of significance, the null hypothesis will be rejected.
The notion that the venture capital funded firm is more
likely to go public than the unfunded firm will then be
accepted.
Hypothesis 6 is also tested through the use of Chi
square. Utilizing v6.2, years elapsed between founding and
going public, it is expected to be shown that a greater
proportion of the funded firms expect to go public within
five years of founding. In this case, the null hypothesis

is that of independence, i.e. there is no relationship
between venture capital funding and v6.2.
90
It is expected that the calculated Chi-square, based
on five degrees of freedom (2 rows and 6 columns in the
contingency table) will have a level of significance which
is less than .10. Given this result, the null hypothesis of
independence will be rejected, and it is shown that there is
a relationship between venture capital funding and v6.2,
years elapsed between founding and going public.
Additionally, the contingency table will indicate that a
greater percentage of venture capital funded firms expect to
go public within the five year time frame.
Hypothesis 7
H7 is tested through the use of ANOVA and Chi-square.
Utilizing ANOVA, it is expected to be shown that the VF7.1 >
VU7.1 for those firms in both groups which have, in fact,
developed business plans. The null hypothesis in this case
is that of no difference, HO: VF7.1 = Vu7.1. Once again it
is expected that the observed F-value will be greater than
the critical F-value at the .10 level of significance. The
null hypothesis will then be rejected. At this particular
point, it will be known that the venture capital funded
firms have larger business plans than the unfunded start-up
firms.
Utilizing Chi-square along with its associated
contingency table, it is expected to be shown that there is

91
a relationship between venture capital funding and v7.1. In
order to test the null hypothesis of independence, v7.1 is
recoded in the following fashion: a value of (0) pages
corresponds to the absence of a business plan, and a value
of (1+) pages corresponds to the presence of a business
plan.
It is expected that the calculated Chi-square, based
on one degree of freedom (two rows and two columns in the
contingency table), will have a probability or level of
significance which is less than .10. Based upon this
finding, the null hypothesis of independence is rejected and
hypothesis 7 is accepted.
Chi-square is also used to examine the exploratory
questions regarding the most and least important components,
from the respondents' perception, of the business plan. The
intent is to determine not only the most and least important
components, but also whether these perceptions are, in any
way, related to the presence or absence of venture capital
funding.
In the case of each of these variables, v7.2 and v7.3,
a contingency table is produced based on eight degrees of
freedom (two rows corresponding to funded and unfunded and
ten columns corresponding to the nine business plan
components as delineated on page 74, plus an "all important"
category) •
=:----------_ .. _----

92
ANOVA is used to examine v7.4.1 through v7.4.9, which
represent the weightings assigned to the various business
plan components according to perceived importance. The null
hypothesis is one of no difference, HO: VF7.4.j = VF7.4.j,
where j equals 1 to 10. The intent here is to determine
whether or not there are differences in perceived importance
among components between the funded and unfunded groups of
firms.
Chi-square is used to examine the purpose for which
the business plan was developed. Once again, the null
hypothesis is that of independence. The calculated Chi
square, based on three degrees of freedom, is expected to
have a level of significance which is less than or equal to
.10. As a result, the null hypothesis is to be rejected,
and it is shown that the purpose for developing a business
plan is markedly different based on the presence or absence
of venture capital financing. Further it is expected that
the venture capital funded firms will indicate a venture
capital requirement as the primary purpose, and the unfunded
start-up firms will indicate operating necessity as that
purpose.
SUMMARY
To test the hypotheses, a sampling frame of 1350
CEO/Presidents of high technology start-up firms was used.

A systematic random sampling design was utilized to select
the firms from the Corp Tech data base.
93
Data collection was accomplished through the use of a
mail survey_ Two mailings were undertaken to achieve a
final sample size of 226 respondents.
Hypothesis testing includes the use of ANOVA to test
for differences between venture capital funded and unfunded
firms with regard to the hypothesized characteristics.
Additionally, the Chi-square statistic is utilized in those
cases where nominal scale data have been collected to
measure association between variables.

CHAPTER IV
ANALYSIS OF RESEARCH FINDINGS
The purpose of this chapter is to discuss the results
of the statistical analysis of the data. General
characteristics of the sample are first discussed to provide
a context within which the individual hypotheses are to be
addressed. The individual statistical test results
regarding each of the seven hypotheses are then discussed.
CHARACTERISTICS OF THE SAMPLE
The primary demographic characteristics collected
include: the state in which the respondent firm is located,
the age of the firm, and whether or not the firm has
received at least one infusion of venture capital financing.
Additional measures of dollars received and percent of
equity given up for each of the first three rounds of
venture capital financing were also collected for those
firms which have, in fact, been venture capital financed.
Characteristics of the Entire Sample
Examination of the entire sample indicates two major
geographic pockets of respondent firms. One pocket exists
on the west coast and includes the states of"California,
Oregon and Washington. This pocket accounts for

94
approximately forty percent of the entire sample. The
second geographic pocket of respondent firms includes those
states on the east coast, specifically the north eastern
states. Included in this group are: Connecticut,
Massachusetts, Maryland, New Hampshire, New Jersey, New
York, Pennsylvania, Rhode Island and Vermont. This pocket
comprises about thirty percent of the sample. (Further
discussion of geographic pockets can be found in the
Recommendations for Further Research section of Chapter V.)
The remaining thirty percent of the sample includes
firms in the south, southeast, southwest and midwest. A
total of thirty-two states are represented in the sample.
Regarding age, the majority of the sample, sixty
percent, falls into the four to five years old category.
One the other hand, slightly less than ten percent of the
firms are 1 year old, with the remaining firms being two to
three years old. The mean age of the respondent firms is
3.6 years.
The sample reflects an uneven split between venture
capital funded firms and unfunded firms. The funded firms
represent approximately one-third of the sample, with the
unfunded firms representing the remaining two-thirds.
Appendix C contains the supporting detailed demographic
breakdown of the sample as a whole.

Characteristics of the Unfunded Firms
Here again, the same two geographic pockets exist,
with the states of California, Oregon and Washington
representing slightly more than forty percent of the
respondent unfunded firms. The east coast pocket of
Connecticut, Massachusetts, Maryland, New Hampshire, New
Jersey, New York, Pennsylvania, Rhode Island and Vermont
accounts for twenty-five percent of the unfunded
respondents. The respondents in this group represent
thirty-one of the thirty-two state sample total. See
Appendix D for a state by state breakdown of the unfunded
firms.
95
The mean age of the unfunded firms is 3.5 years. The
majority of these firms, about seventy percent, fall into
the four to five years old category. Eleven percent of this
group is in the one year old category, with the remaining
nineteen percent being three to four years old. The details
of these breakdowns can be found in Appendix D.
Characteristics of the Funded Firms
The same two pockets of geographic concentration exist
for the funded firm group. The west coast pocket represents
forty-three percent of this group, while the east coast
pocket represents thirty-seven percent. This group has
respondents in only twenty of the thirty-two states
represented in the total sample. Appendix E details the
complete geographic breakdown of funded firms.
-----~-------

96
Here again, the majority of the funded firms, sixty
percent, are four to five years old, with only six percent
being in the one year old category. The mean age of the
funded firms is 3.7 years. See Appendix E for the detailed
breakdown.
An examination of dollars received and equity given up
for each of the first three rounds of venture capital yields
the following findings. The number of rounds of venture
capital financing ranged from one to seven, with two being
the median number. Eighty-eight percent of these firms
received one to three rounds. Appendix E summarizes the
complete funding findings.
First Round Financing. Three-fourths of the funded
firms received less than $ 3 million in first round
financing. Thirty-six percent of the group received less
than $ 1 million, and twenty-five percent received $ 1 -
1.99 million. The maximum dollars obtained in this round
were 25 million. The mean number of dollars obtained was $
2.4 million, while the median was $ 1.1 million.
The mean and median percent of equity given up for
this first round was forty percent. Thirty percent of the
group gave up twenty-five percent or less, and forty-six
percent gave up twenty-six to fifty percent.
Second Round Financing. The mean second round dollars
received was three million, while the median was $ 2
million. In this round, thirty-two percent of the firms

97
received $ 1 million or less, forty percent received $ 1 to
3 million, with the remaining twenty-eight percent receiving
up to $ 21 million.
The mean equity cost of second round financing was
thirty percent and the median cost was twenty-one percent.
Sixty-eight percent of the firms paid eleven to thirty
percent of equity for this second round financing.
Third Round Financing. Sixty percent of those firms
receiving a third round of financing obtained $ 1 to 3
million. The maximum dollars received were 18.23 million
resulting in a mean of $ 3.7 million, while the median was
only $ 2.6 million.
The equity given up was twenty percent or less for
eighty-one percent of the firms. The mean equity cost was
nineteen percent, but the large concentration of respondents
in the aforementioned narrow range resulted in the median
being slightly lower at fifteen percent. Details of
financing dollars and equity are found in Appendix E.
HYPOTHESIS TEST FINDINGS
HyPothesis 1
The high technology start-up firm which has acquired venture capital funding maintains an organizational climate which is more organic than does the high technology start-up firm which has not acquired venture capital funding.
It was expected that the research hypothesis would be
rejected and the null hypothesis accepted, i.e. there would
be no difference between venture capital funded firms and

98
unfunded firms regarding their organizational climates.
concomitantly, it was expected that both firms groups,
funded and unfunded, would tend to perceive their firms as
more organic than mechanistic.
The profiles contained in Appendix F appear to confirm
the expectations regarding hypothesis 1. The Likert scale
means for each component measure and the sum of scores are
within a percentage of a point of each other. Additionally,
all are greater than four on a Likert scale where five
represents the extreme "organic" end of the continuum.
Six tests were performed to validate the expectations.
Table VIII contains the detailed findings when this
hypothesis was tested based on only component one, open
communication flow.
TABLE VIII
HYPOTHESIS 1 - COMPONENT 1 OPEN COMMUNICATION FLOW - ANOVA RESULTS
Sum of Mean F F Source D.F. Squares Squares Ratio Probe
Between Groups 1 .062 .062 .068 .794
Within Groups 219 199.512 .911
Total 220 199.574
Unfunded: Mean = 4.6159 Standard Deviation = 1.0204
Funded: Mean = 4.6506 Standard Deviation = .8328

--- ---~~
99
As can be seen from the table, the mean Likert scale
values are very close to the "organic" end of the continuum.
In addition, the F probability or observed significance
level of .794 indicates that the results are not
statistically significant at the .10 level. As such, the
null hypothesis that all population means are equal must be
accepted, and the research hypothesis is rejected.
The testing of component two, decision making style,
yielded similar results. Table IX summarizes the results of
the statistical analysis.
Source
Between
Within
Total
TABLE IX
HYPOTHESIS 1 - COMPONENT 2 DECISION MAKING STYLE - ANOVA RESULTS
Sum of Mean F D.F. Squares Sguares Ratio
Groups 1 1.889 1.889 2.123
Groups 219 194.916 .890
220 196.805
Unfunded: Mean = 4.2391 Standard Deviation
Funded: Mean = 4.0482 Standard Deviation
F Prob.
.146
= .9783
= .9434
While the mean scores for the two firm groups do differ, the
results are not statistically significant at the .10 level.
The null hypothesis of no difference is, therefore,
accepted. The research hypothesis is not supported, as
there is no significant difference between the means. Here

100
again, the means are closer to the "organic" end of the
scale.
Components three through five all yielded similar
results. The detailed findings of each test of hypothesis 1
are found in Tables X through XII.
Source
Between
TABLE X
HYPOTHESIS 1 - COMPONENT 3 TOLERANCE OF FAILURE - ANOVA RESULTS
Sum of Mean F D.F. Sguares Sguares Ratio
Groups 1 .003 .003 .002
Within Groups 220 280.633 1. 276
Total
Unfunded:
Funded:
Source
221 280.636
Mean = 4.0432 Standard Deviation
Mean = 4.0361 Standard Deviation
TABLE XI
HYPOTHESIS 1 - COMPONENT 4 POLICIES CONSISTENT WITH CORPORATE
GOALS - ANOVA RESULTS
Sum of Mean D.F. Squares Sguares
F Ratio
Between Groups 1 .591 .591 .722
Within Groups 219 179.120 .8179
Total 220 179.711
Unfunded: Mean = 4.3116 Standard Deviation
Funded: Mean = 4.2048 Standard Deviation
F Probe
.964
= 1.1602
= 1.0757
F Probe
.396
= .8944
= .9208

101
The final test of hypothesis 1 is that involving the
sum of scores means. Given the preceding results for the
five components, it is no surprise that the results of this
primary test of hypothesis 1 do, in fact, support the
Source
Between Groups
Within Groups
Total
TABLE XII
HYPOTHESIS 1 - COMPONENT 5 INTEGRITY MORE IMPORTANT THAN
PROFIT - ANOVA RESULTS
D.F.
1
219
220
Sum of Mean Squares Squares
.195 .195
169.335
169.530
.773
F Ratio
.252
F Probe
.616
Unfunded: Mean = 4.4348 Standard Deviation = .8625
Funded: Mean = 4.3735 Standard Deviation = .9068
Source
Between
Within
Total
TABLE XIII
ORGANIZATIONAL CLIMATE SUM OF SCORES ANOVA RESULTS
Sum of Mean F D.F. Squares Squares Ratio
Groups 1 .454 .454 1.360
Groups 215 71.703 .334
216 72.157
Unfunded: Mean = 4.3567 Standard Deviation
Funded: Mean = 4.2627 Standard Deviation
F Probe
.245
= .5381
= .6362

102
expectation of no statistically significant difference
between the two firm groups. Table XIII summarizes the
results of this final test of the hypothesis.
Here again, the means tend toward the "organic" end of
the scale. The F probability of .245 indicates that the
results are not statistically significant. The null
hypothesis is accepted, and the research hypothesis is, as
expected, not supported.
Hypothesis 2
The top management team of the high technology startup firm which has acquired venture capital funding has a higher quality top management team than does the high technology start-up firm which has not acquired venture capital funding.
The expected result of the funded firms having a
higher quality top management team did, for the most part,
receive sound support throughout all of the hypothesis
tests. The only test which did not, necessarily support the
hypothesized relationship is that concerning the aggregate
number of years of prior primary experience. Examination of
total years yielded results which did support the direction
of the hypothesized relationship. The funded firms possess
a mean total of 36.5 while the unfunded firms have a mean of
31.1 years. These results were, however, not statistically
significant at the .10 level, as the F probability was .13.
As such, there is no significant difference between the firm
groups regarding longevity of prior primary experience.
Table XIV details the results of this test.
-~----------------------------------------------------------------------..... --------~-

103
The aggregate level of responsibility yielded test
results which supported the hypothesized relationship. The
aggregate mean for the funded firms is 21.6, while the mean
for the unfunded firms is 15.5. As the results in Table XV
indicate, the difference between these means is
Source
Between Groups
within Groups
Total
Unfunded:
Funded:
Source
TABLE XIV
HYPOTHESIS 2 - VARIABLE 1 AGGREGATE YEARS - ANOVA RESULTS
Sum of Mean D.F. Squares Sguares
1 1003.57 1003.57
145 63923.10 440.85
146 64926.67
F Ratio
2.276
Mean = 31.111 Standard Deviation
Mean = 36.474 Standard Deviation
TABLE XV
HYPOTHESIS 2 - VARIABLE 2 AGGREGATE RESPONSIBILITY LEVEL
ANOVA RESULTS
D.F. Sum of Squares
Mean F Squares Ratio
= =
F Probe
.134
21.880
19.510
F Probe
Between Groups 1
145
146
1333.90
8439.38
9773.28
1333.90 22.918
58.20
.000
Within Groups
Total
Unfunded: Mean = 15.467 Standard Deviation = 8.116
Funded: Mean = 21.649 Standard Deviation = 6.784

statistically significant at the .10 level. The null
hypothesis of no difference is rejected, and the
hypothesized relationship is supported.
104
Testing based on the aggregate annual sales volume of
the team also produced results in support of hypothesis 2.
There is a dramatic difference in the aggregates with the
funded firms having a mean aggregate of $ 2882 million and
the unfunded firms having a mean only one-third as large at
$ 922 million. As shown in Table XVI, the difference is
statistically significant, and the null hypothesis of no
difference must be rejected. Here again, hypothesis 2 is
supported as expected.
TABLE XVI
HYPOTHESIS 2 - VARIABLE 3 AGGREGATE ANNUAL SALES VOLUME (MILLIONS OF DOLLARS)
ANOVA RESULTS
Sum of Mean F F Source D.F. Sguares SS[!!ares Ratio Probe
Between Groups 1 134097K 134097K 4.673 .032
Within Groups 145 4161056K 28696K
Total 146 4295053K t " ,
Unfunded: Mean = 922.24 Standard Deviation = 2411.79
Funded: Mean = 2882.49 Standard Deviation = 8065.99
The mean number of members on the top management team
is approximately one-third greater for the funded firms at
3.6. The unfunded firms have a mean of 2.8 members on their

a;--.. -
105
top management teams. These results, as detailed in Table
XVII, are also statistically significant at the .10 level.
The null hypothesis of no difference is rejected, and
hypothesis 2 is generally supported.
Source
Between
Within
Total
TABLE XVII
HYPOTHESIS 2 - VARIABLE 4 NUMBER OF TOP MANAGEMENT TEAM MEMBERS
ANOVA RESULTS
Sum of Mean F D.F. Squares Squares Ratio
Groups 1 23.760 23.760 22.893
Groups 145 150.498 1.038
146 174.268
Unfunded: Mean = 2.7889 Standard Deviation
Funded: Mean = 3.1088 Standard Deviation
F Probe
.000
= 1.1465
= .7735
In addition to having a larger top management team,
the findings also indicate that there is more functional
diversity on the team of the funded firm. The top
management team of the funded firm has aggregate prior
experience representing a mean of 3.1 different functional
areas. The unfunded firm's aggregate experience is in 2.4
functional areas. These findings, shown in Table XVIII, are
statistically significant at the .10 level. Support is,
therefore, given to the hypothesized relationship.
The fourth aspect of quality examined regards whether
or not the team members serve in the same or a similar

106
capacity as that of their prior experience. The findings do
support the hypothesized relationship. The funded firms
have a mean number of 2.5 members and the unfunded firms
have a mean of 1.9 top management team members who have had
Source
Between
Within
Total
TABLE XVIII
HYPOTHESIS 2 - VARIABLE 8 NUMBER OF DIFFERENT PRIOR FUNCTIONAL AREAS
ANOVA RESULTS
Sum of Mean F D.F. Sguares Sguares Ratio
Groups 1 16.901 16.901 16.436
Groups 145 149.100 1.028
146 166.001
Unfunded: Mean = 2.4444 Standard Deviation = Funded:
Source
Between
Within
Total
Mean = 3.1404 Standard Deviation =
TABLE XIX
HYPOTHESIS 2 - VARIABLE 5 MEMBERS SERVING IN SAME FUNCTIONAL CAPACITY
ANOVA RESULTS
Sum of Mean F D.F. Sguares Sguares Ratio
Groups 1 13.972 13.972 7.870
Groups 145 257.429 1.775
146 271.401
Unfunded: Mean = 1. 9111 Standard Deviation = Funded: Mean = 2.5439 Standard Deviation =
F Probe
.000
1. 0612
.9342
F Probe
.006
1.3294
1.3372

107
primary experience directly related to their current
functional capacity. The detail in Table XIX indicates that
these results are statistically significant at the .10
level. The null hypothesis of no difference is, once again,
rejected.
The final aspect of quality, the number of team
members having prior experience in a firm utilizing or
producing a like technology, also yielded statistic~lly
significant results in support of the hypothesized
relationship. As shown in Table XX, the funded firms have a
Source
Between
Within
Total
TABLE XX
HYPOTHESIS 2 - VARIABLE 6 MEMBERS EXPERIENCED WITH A LIKE TECHNOLOGY
ANOVA RESULTS
Sum of Mean F D.F. Sguares Sguares Ratio
Groups 1 9.796 9.796 4.944
Groups 145 287.319 1.982
146 297.115
Unfunded: Mean = 1.4000 Standard Deviation
Funded: Mean = 1.9298 Standard Deviation
F Probe
.028
= 1.4206
= 1.3869
mean number of 1.9 members who have had their prior primary
experience in a firm dealing with a like technology. The
unfunded firms have a mean of 1.4 members having this type
of experience.
_.,-. --------- ----- -------

108
Considering all of the aspects of quality, strong
support is given to the hypothesized relationship. While it
is true that the difference in aggregate years experience is
not statistically significant at the chosen level, it is not
felt that the results are strongly contrary to the
expectations. Taken on an aggregate basis, the null
hypothesis of no difference must be rejected, and hypothesis
2 must be accepted.
Hypothesis 3
The strategy of the high technology start-up firm which has acquired venture capital funding will tend to be more market driven than will the high technology start-up firm which has not acquired venture capital funding.
It was expected that the venture capital funded firms
tend to be more market driven than the unfunded firms.
Examination of the strategy profiles in Appendix G indicate
that the results are somewhat mixed regarding the
expectations. On an overall basis, the funded firms do
appear to be more market driven than the unfunded firms as
indicated by the sum of scores means of 3.9 and 395
respectively.
Additionally, the funded firms reflect higher Likert
scale means for components one, product will not sell
itself, and four, market demand is primary to technological
sophistication. Contrary to expectations, components two,
knowledgeable about competitor activities, and three,
-------------

109
employees very customer focused, indicate results in the
opposite than expected direction.
Testing hypothesis 3 by examining only component one
resulted in the funded firms having a larger Likert scale
mean. Table XXI summarizes the ANOVA results. In addition
to the relationship being in the desired direction, the
findings are statistically significant at the .10 level. As
such, the null hypothesis of no difference is rejected.
Source
Between Groups
Within Groups
Total
Unfunded:
Funded:
TABLE XXI
HYPOTHESIS 3 - COMPONENT 1 PRODUCT WILL NOT SELL ITSELF
ANOVA RESULTS
D.F.
1
218
219
Sum of Squares
8.558
306.801
315.359
Mean Squares
8.558
1.407
F Ratio
6.081
F Probe
.014
Mean = 3.5328 Standard Deviation = 1.2664
Mean = 3.9400 Standard Deviation = 1.0400
Testing hypothesis 3 while utilizing components two
and three on an individual basis yield relationships which
are contrary to expectations. Considering only component
two, the test yielded Likert scale means of 4.0 for both
funded and unfunded firms, while testing with component

110
three resulted in mean scores of 3.6 for unfunded firms and
3.5 for funded firms.
Source
Between Groups
Within Groups
Total
Unfunded:
Funded:
Source
TABLE XXII
HYPOTHESIS 3 - COMPONENT 2 KNOWLEDGEABLE ABOUT COMPETITORS
ANOVA RESULTS
Sum of Mean D.F. Squares Squares
1 .728 .728
218 210.231 .964
219 210.959
F Ratio
.755
Mean = 3.5558 Standard Deviation
Mean = 3.4390 Standard Deviation
TABLE XXIII
HYPOTHESIS 3 - COMPONENT 3 EMPLOYEES VERY CUSTOMER FOCUSED
ANOVA RESULTS
Sum of Mean F D.F. Squares Squares Ratio
Between Groups 1 .514 .514 .659
Within Groups 217 168.445 .780
Total 218 168.959
Unfunded: Mean = 4.0515 Standard Deviation
Funded: Mean = 3.9512 Standard Deviation
F Probe
.386
= .9203
= 1. 0784
F Probe
.418
= .9134
= .8300

111
In each case, however, the results are not
statistically significant based upon the F probabilities of
.39 and .42 respectively. Tables XXII and XXIII summarize
the results of these tests. In both of these cases, the
null hypothesis of no difference is accepted.
Testing hypothesis 3 while utilizing only component
four yielded results which do support the hypothesized
relationship.
As is illustrated in Table XXIV, the Likert scale mean
of 3.8 for the funded firms is, indeed, higher than the mean
of 3.5 for the unfunded firms. Here again, the findings are
statistically significant at the .10 level. In this case,
the null hypothesis of no difference is rejected.
TABLE XXIV
HYPOTHESIS 3 - COMPONENT 4 MARKET DEMAND PRIMARY TO TECHNOLOGICAL SOPHISTICATION
ANOVA RESULTS
Sum of Mean F F Source D.F. sguares SS[1!ares Ratio Prob.
Between Groups 1 4.570 4.570 2.978 .086
Within Groups 206 316.180 1.535
Total 207 320.750
Unfunded: Mean = 3.5078 Standard Deviation = 1.2792
Funded: Mean = 3.8125 Standard Deviation = 1.1702

112
The final test of hypothesis 3 is at the aggregate
level, utilizing the component sum of scores. Table XXV
shows that the relationship is in the desired direction with
the funded firms having a mean score closer to the "market
demand" end of the scale. Here again, the results are not
statistically significant at the .10 level, and the null
hypothesis of no difference must be accepted.
On an overall basis, the null hypothesis must be
accepted and the research hypothesis must be rejected based
on the results of both the primary hypothesis test and two
of the four component tests, which are not statistically
significant.
TABLE XXV
STRATEGY SUM OF SCORES ANOVA RESULTS
Sum of Mean F F Source D.F. Squares Squares Ratio Frob.
Between Groups 1 .773 .773 2.247 .136
Within Groups 204 70.202 .344
Total 205 70.975
Unfunded: Mean = 3.6806 Standard Deviation = .5741
Funded: Mean = 3.8062 Standard Deviation = .6058
Additionally, while the primary test did yield results in
the desired direction, two of the four component tests did
not.

113
Hypothesis 4
The high technology start-up firm which has acquired venture capital funding is more likely to create products which provide solutions to new problems or superior solutions to existing problems rather than products which are either "better mousetraps" or lookalike technology than is the high technology start-up firm which has not acquired venture capital funding.
It was expected that the venture capital funded firm
would have more of a solutions orientation than the unfunded
firm. The profiles depicted in Appendix H illustrate that,
for the most part, the exact opposite relationship holds.
In all cases, except the perception of sharp vertical market
segmentation, the Likert scale means for the unfunded firms
indicate a greater tendency toward a solutions orientation.
Testing hypothesis 4 while utilizing only component
one, customer feedback essential to new product development,
resulted in the unfunded firms having a Likert scale mean of
4.7, and the funded firms having a mean of 4.6. Not only is
the relationship in the opposite than expected direction,
but the findings are also not statistically significant at
the .10 level. The null hypothesis of no difference is
accepted based on these results. Table XXVI details the
findings of this test of hypothesis 4.
Tests utilizing components two, employees very
customer focused, and three, intimately knowledgeable about
customers' business, yielded similar results. As was
previously detailed in Table XXIII, component two yielded
Likert scale means which were only slightly unequal, and the
----------------

114
difference was not statistically significant based upon an F
probability of .42.
Source
Between
Within
Total
TABLE XXVI
HYPOTHESIS 4 - COMPONENT 1 CUSTOMER FEEDBACK ESSENTIAL TO NEW PRODUCT
DEVELOPMENT - ANOVA RESULTS
Sum of Mean F D.F. Sguares Sguares Ratio
Groups 1 .796 .796 1.117
Groups 218 155.404 .713
219 156.200
Unfunded: Mean = 4.7464 Standard Deviation
Funded: Mean = 4.6220 Standard Deviation
F Probe
.292
= .7742
= .9512
The test involving only component three resulted in
Likert scale means of 3.6 and 3.5 respectively for unfunded
and funded firms. Here again, the findings are not
statistically significant based on the resulting F
probability of .52, and the null hypothesis must be
accepted. Table XXVII details the examination of component
three.
Testing hypothesis 4 while utilizing only component
four, focus on sharp unique market segmentation, yielded
results in the desired direction. The funded firms' Likert
scale mean of 3.73 was greater than the unfunded firms' mean
of 3.66. However, these results are deemed not
statistically significant at the .10 level, as is evidenced

115
by the detail of Table XXVIII. The null hypothesis of no
difference must be accepted in this case.
Source
Between
TABLE XXVII
HYPOTHESIS 4 - COMPONENT 3 INTIMATELY KNOWLEDGEABLE ABOUT CUSTOMERS'
BUSINESS - ANOVA RESULTS
Sum of Mean F D.F. sg:uares Sg:uares Ratio
Groups 1 .449 .449 .4204
Within Groups 217 231. 779 1. 0681
Total
Unfunded:
Funded:
218 232.228
Mean = 3.6423 Standard
Mean = 3.5488 Standard
TABLE XXVIII
HYPOTHESIS 4 - COMPONENT 4
Deviation
Deviation
FOCUS ON SHARP UNIQUE MARKET SEGMENTATION ANOVA RESULTS
Sum of Mean F Source D.F. Sg:uares Sg:uares Ratio
Between Groups 1 .234 .234 .1793
Within Groups 217 282.652 1.3025
Total 218 282.886
Unfunded: Mean = 3.6642 Standard Deviation
Funded: Mean = 3.7317 Standard Deviation
F Probe
.517
= .0913
= .1072
F Probe
.672
= 1.1712
= 1.0892
Examination of the sum of scores, which reflects the
aggregate perceptions regarding a solutions orientation,

116
yielded differences in an opposite than expected direction.
In addition, the findings, detailed in Table XXIX, are not
statistically significant at the .10 level.
Based on all five tests of hypothesis 4, the null
hypothesis of no difference must be accepted. While small
differences regarding the perception of having a solutions
orientation appear to exist between the funded and unfunded
firms, the firms have like propensities toward a solutions
orientation.
Source
TABLE XXIX
SOLUTIONS ORIENTATION SUM OF SCORES ANOVA RESULTS
Sum of Mean F D.F. Sguares Squares Ratio
F Probe
Between Groups 1 .199 .199 .561 .455
Within Groups 216 76.550 .354
Total 217 169.530
Unfunded: Mean = 4.0257 Standard Deviation = .6111
Funded: Mean = 3.9634 Standard Deviation = .5681
HyPothesis 5
The high technology start-up firm which has acquired venture capital funding focuses more narrowly on a market niche which it can control than does the high technology start-up firm which has not acquired venture capital funding.
The comparison of funded and unfunded firms with
respect to a market niche strategy yielded mixed results,

117
which are illustrated by the profiles in Appendix I. The
hypothesis test based on component one, do not compete with
very large companies, produced unfavorable results with
respect to expectations. The funded group did have a higher
Likert scale mean of 2.4 compared to the mean of 2.3 for the
unfunded firms; however, these low mean scores indicate that
both groups tend to compete with very large companies. Once
again, the results, shown in Table XXX, are not
statistically significant at the .10 level, and the null
hypothesis of no difference is accepted.
Source
Between
Within
Total
TABLE XXX
HYPOTHESIS 5 - COMPONENT 1 DO NOT COMPETE WITH VERY LARGE COMPANIES
ANOVA RESULTS
Sum of Mean F D.F. Squares Squares Ratio
Groups 1 .230 .230 .125
Groups 218 401.207 1.840
219 401.437
Unfunded: Mean = 2.3478 Standard Deviation
Funded: Mean = 2.4146 Standard Deviation
F Prob.
.724
= 1. 3436
= 1.3784
Testing based upon component two, do not strive to be
low cost producer, resulted in findings which also do not
support the hypothesized relationship. In this case, as
shown in Table XXXI, the unfunded firms have a higher Likert

118
scale mean of 3.2 compared to the mean of 3.0 for the funded
firms.
Source
Between
Within
Total
TABLE XXXI
HYPOTHESIS 5 - COMPONENT 2 DO NOT STRIVE TO BE LOW COST PRODUCER
ANOVA RESULTS
Sum of Mean F D.F. Squares Squares Ratio
Groups 1 .728 .728 .480
Groups 217 328.944 1.516
218 329.672
Unfunded: Mean = 3.1679 Standard Deviation
Funded: Mean = 3.0488 Standard Deviation
= =
These means indicate an almost neutral position
F Probe
.489
1. 2460
1. 2060
regarding a propensity toward being the low cost producer.
Additionally, the results are not statistically significant
at the .10 level. The null hypothesis of no difference
must, therefore, be accepted in this case.
Component three, unique product deters entry by
others, also yielded unexpected results. The funded firms
appear to be more likely to produce a unique product \-1hich
deters entry by others than the unfunded firms based upon
Likert scale means of 3.2 and 3.0 respectively. Table XXXII
details these results. These means, once again, fallon the
scale neutral point, and the slight difference is not

119
statistically significant at the .10 level. As such, the
findings offer no support for research hypothesis 5.
Source
Between Groups
Within Groups
Total
Unfunded:
Funded:
TABLE XXXII
HYPOTHESIS 5 - COMPONENT 3 UNIQUE PRODUCT DETERS ENTRY
ANOVA RESULTS
Sum of Mean D.F. SSI.1!ares Sguares
1 .924 .924
217 332.427 1.532
218 333.351
F Ratio
.603
Mean = 3.0365 Standard Deviation
Mean = 3.1707 Standard Deviation
F Probe
.438
= 1. 2742
= 1.1738
Components four, product does not appeal to a broad
commodity market, and five, focus on sharp unique market
segmentation, both appear to support the hypothesis in the
desired direction. The Likert scale means, as shown in
Tables XXXIII and XXVIII, are r.igher for the funded firms,
but the difference is not statistically significant at the
.10 level. The null hypothesis of no difference must be
accepted.
Hypothesis testing based on component six, market
differs from larger market as a whole, yields results which
are also contrary to expectations. As Table XXXIV shows,
the Likert scale mean of 3.5 for the funded firms is,
indeed, lower than the 3.7 for the unfunded firms. Despite

120
the difference, the null hypothesis of no difference is
accepted as these findings are not statistically significant
at the .10 level.
TABLE XXXIII
HYPOTHESIS 5 - COMPONENT 4 PRODUCT DOES NOT APPEAL TO A BROAD COMMODITY
MARKET - ANOVA RESULTS
Sum of Mean F Source D.F. Sggares Sguares Ratio
Between Groups 1 1.348 1.348 .712
Within Groups 216 408.946 1.893
Total 217 410.294
Unfunded: Mean = 3.7279 Standard Deviation
Funded: Mean = 3.8902 Standard Deviation
TABLE XXXIV
HYPOTHESIS 5 - COMPONENT 6 MARKET DIFFERS FROM LARGER MARKET AS
A WHOLE - ANOVA RESULTS
Sum of Mean F Source D.F. Squares Sguares Ratio
Between Groups 1 2.328 2.328 1.879
Within Groups 217 268.860 1.239
Total 218 410.294
Unfunded: Mean = 3.6642 Standard Deviation
Funded: Mean = 3.4512 Standard Deviation
F Probe
.399
= 1.4219
= 1.2958
F Probe
.172
= 1.0591
= 1.1983

121
Testing hypothesis 5 at the aggregate level, using the
sum of scores, weakly supports the hypothesized direction of
the relationship, but the difference is not statistically
significant at the .10 level. Table XXXV summarizes these
findings.
Based upon the complete findings, both the funded and
unfunded firms are likely to somewhat niche focused;
however, no evidence of support for the hypothesized
difference exists. Hypothesis 5 is, therefore, rejected.
Source
Between Groups
Within Groups
Total
Unfunded:
Funded:
Hypothesis 6
TABLE XXXV
NICHE FOCUS SUM OF SCORES ANOVA RESULTS
Sum of Mean F D.F. Sguares Sguares Ratio
1 .005 .005 .013
216 89.057 .412
217 89.062
Mean = 3.2745 Standard Deviation
Mean = 3.2846 Standard Deviation
F Probe
.911
= 6436
= .5396
The high technology start-up firm which has acquired venture capital funding is more likely to plan on going public than the high technology start-up firm which has not acquired venture capital funding.
The expected result of the funded firms being more
likely to go public than the unfunded firms received solid
support through hypothesis testing.

122
Examination of the probability of going public within
the next two years yielded findings in the desired
direction. As shown in Table XXXVI, the funded firms, with
a Likert scale mean of 2.5, appear to be more likely to go
public than the unfunded firms, which have a mean of 2.0.
The F probability of .02 indicates that the results are
statistically significant. The null hypothesis of no
difference is rejected and the research hypothesis is
supported based on these findings.
Source
Between
Within
Total
TABLE XXXVI
PROBABILITY OF GOING PUBLIC IN TWO YEARS ANOVA RESULTS
Sum of Mean F D.F. Squares Squares Ratio
Groups 1 6.086 6.086 5.746
Groups 165 174.741 1.059
166 180.827
Unfunded: Mean = 2.0000 Standard Deviation
Funded: Mean = 2.5185 Standard Deviation
= =
F Probe
.018
1.0249
1.0514
Utilizing the Chi-square statistic to examine the
number of years elapsed, to a maximum of five, between
founding and the intended year to go public also
substantiated the expected results of hypothesis 6. Cross
tabulation of venture capital funding and the number of
years elapsed indicates that thirty-two percent of the

123
funded firms expect to go public within four to five years
of founding, while sixteen percent of the unfunded firms
have this expectation. As Table XXXVII indicates, the
findings were statistically significant at the .10 level,
indicating that there is a relationship between funding and
going public.
Based upon the results of these two tests, the null
hypotheses are rejected, and it is shown that the venture
capital funded firm is more likely to go public than the
unfunded firm.
Years
1 2 3 4 5
N/A
TABLE XXXVII
YEARS ELAPSED BETWEEN FOUNDING & GOING PUBLIC CROSS TABULATION RESULTS
Funded Unfunded
0 ( 0.0%) 0 ( 0.0%) 1 ( 1. 3) 0 ( 0.0) 1 ( 1. 3) 2 ( 1. 7) 5 ( 5.3) 6 ( 4.2)
22 (26.7) 18 (12.5) 55 (65.3) 116 (81. 7)
Chi-square = 8.56348 Significance = .0730
Hypothesis 7
The high technology start-up firm which has acquired venture capital funding is more likely to have prepared a formal business plan than those high technology start-up firms which have not acquired venture capital funding.
The results of ANOVA indicate that there is a
statistically significant difference in the length of the

124
business plan of the funded firm compared to the unfunded
firm. The findings, as detailed in Table XXXVIII, show that
the funded firm develops a business plan of forty-two pages,
while the unfunded firm prepares one of only twenty-seven
pages. These statistically significant results at the .10
level result in the rejection of the null hypothesis of no
difference in the size of the business plan regardless of
the presence or absence of venture capital funding.
Hypothesis 7 was also tested utilizing the Chi-square
statistic. Two different cross tabulations were done toward
this end. In the first case, the number of business plan
Source
Between
Within
Total
TABLE XXXVIII
NUMBER OF PAGES IN BUSINESS PLAN ANOVA RESULTS
Sum of Mean D.F. Squares Squares
Groups 1 11589.5 11589.5
Groups 217 178452.8 822.4
218 190042.3
F Ratio
14.093
Unfunded: Mean = 26.70 Standard Deviation
Funded: Mean = 41.73 Standard Deviation
F Probe
.000
= 29.154
= 27.857
pages was recoded to reflect a breakdown into the following
mutually exclusive categories: (0) no business plan, (1) 1-
10 pages, (2) 11-24 pages, (3) 25-49 pages, and (4) 50 pages
or more. The findings, as shown in Table XXXIX, indicate

125
that there is a relationship between the size of the
business plan and venture capital funding. The cross
tabulation resulted in approximately eighty percent of the
funded firms having business plans in excess of twenty-five
pages, whereas only forty-five percent of the unfunded firms
had business plans which exceeded twenty-five pages. These
results are significant at the .00 level.
When the number of pages was recoded to reflect the
presence or absence of a business plan, it was found that
ninety-eight percent of the funded firms did, in fact,
prepare a plan compared to eighty percent of the unfunded
Pages
o 1-10
11-24 25-49 50+
TABLE XXXIX
BUSINESS PLAN PAGES CROSS TABULATION RESULTS
Funded
2 ( 2.4%) 8 ( 9.8) 7 ( 8.5)
39 (46.3) 28 (32.9)
Chi-square = 24.9556 Significance = .0000
Unfunded
19 (13.8%) 34 (23.9) 24 (16.7) 37 (26.1) 28 (19.6)
firms. These findings were significant at the .01 level.
As a result of the findings of both of these tests, the null
hypothesis of independence must be rejected.
Based upon all three of the hypothesis tests regarding
business planning, the hypothesized difference between
funded and unfunded firms is accepted as expected. Not only
-.: - .. - .. -------

126
are the funded firms more likely to prepare a business plan,
but the plans which they develop are larger than those of
the unfunded firms.
In conjunction with hypothesis 7, four other business
plan factors were examined: the perceived most important
component, the perceived least important component, a
weighted comparison of the components, and the purpose of
plan preparation. Chi-square was utilized to determine
whether or not there is a relationship between venture
capital funding and the perceptions of the most and least
important business plan components. Tables XXXX and XXXXI
give complete breakdowns of the findings.
TABLE XXXX
MOST IMPORTANT BUSINESS PLAN COMPONENT CROSS TABULATION RESULTS
Component Funded
Product Definition 7 ( 8.6%) Management Team 10 (12.3) Product R&D 4 ( 4.9) Market Analysis 17 (21. 0) Marketing Strategy & Definition 17 (21.0) Profit & Cash flow Projections 13 (16.0) Manufacturing (if appl.) 1 ( 1. 2) Market Size / Share 1 ( 1. 2) Technological Competency 9 (11.1) All Important 2 ( 2.5)
Chi-square = 9.65846 Significance = .3788
Unfunded
11 ( 8.7%) 8 ( 6.3) 7 ( 5.5)
28 (22.0) 30 (23.6) 29 (22.8)
4 ( 3.1) 3 ( 2.4) 7 ( 5.5) 0 ( 0.0)
Regarding the perceived most important component, the
three highest ranking components were: market strategy and
definition, market analysis, and profit and cash flow

127
projections. Additionally, the results were not
statistically significant at the .10 level indicating that
the perception of "most important" is dependent of venture
capital funding.
Examination of the perceived least important component
indicated that the prevalent choice was manufacturing
followed by market size / share and product definition.
Table XXXII summarizes the results of this cross tabulation.
Here again, the results were not statistically significant
at the .10 level. The null hypothesis of independence,
therefore must be accepted.
TABLE XXXXI
LEAST IMPORTANT BUSINESS PLAN COMPONENT CROSS TABULATION RESULTS
Component Funded
Product Definition 16 (19.8%) Management Team 4 ( 4.9) Product R&D 6 ( 7.4) Market Analysis 1 ( 1. 2) Marketing Strategy & Definition 0 ( 0.0) Profit & Cash flow Projections 4 ( 4.9) Manufacturing (if appl.) 28 (34.6) Market Size / Share 11 (13.6) Technological Competency 9 (11.1) All Important 2 ( 2.5)
Chi-square = 11.79021 Significance = .2254
Unfunded
16 (12.9%) 10 ( 8.1)
9 ( 7.3) 5 ( 4.0) 4 ( 3.2)
11 ( 8.9) 27 (21. 8) 26 (21. 0) 14 (11. 3)
2 ( 1.6)
Utilizing ANOVA, the weightings assigned to the various
business plan components were examined. As Table XXXXII
indicates, the only components for which a significant
difference exists are management team and technological
---------

128
competency. All other tests yielded results which were not
statistically significant at the .10 level. Appendix J
profiles the business plan component weightings.
The results of the cross tabulation involving venture
capital funding and the purpose for which the business plan
was prepared ran somewhat contrary to expected results. As
Table XXXXIII illustrates, the greatest percentage of the
unfunded firms did, in fact, prepare their business plans
for the expected reason, operating necessity. The funded
TABLE XXXXII
BUSINESS PLAN COMPONENT WEIGHTINGS ANOVA RESULTS
Funded Unfunded Component Mean Mean
Product Definition 1.1481 .8800 Management Team 1.9259 1. 0720 Product R&D .5556 .6480 Market Analysis 1.4444 1. 5120 Marketing Strategy & Def. 2.0617 2.0242 Profit & Cash flow Proj. 1. 3704 1.6800 Manufacturing (if appl.) .1852 .3520 Market Size / Share .3333 .4240 Technological Competency .9383 1.3810
Sig.
.2098
.0004
.6245
.7896
.8891
.2406
.2557
.5201
.0657
firms indicated, in fifty-six percent of the cases, that the
primary purpose for plan preparation was due to a venture
capital requirement. The calculated Chi-square was
statistically significant at the .10 level, resulting in the
rejection of the null hypothesis of independence, and it is
shown that there is a relationship between venture capital

129
funding and the purpose for which a business plan is
prepared.
TABLE XXXXIII
BUSINESS PLAN PREPARATION PURPOSE CROSS TABULATION RESULTS
Purpose
Operating Necessity Venture Capital Requirement Market Strategy & Definition All of the Above Other
Funded
15 (18.5%) 45 (55.6) 12 (14.8)
8 (9.9) 1 (1.2)
Unfunded
48 (40.0%) 29 (24.2) 39 (32.5)
1 (0.8) 3 (2.5)
Chi-square = 35.24338 significance = .0000
SUMMARY
Of the seven hypotheses advanced in Chapter II,
four were supported by statistically significant evidence in
the desired direction and three were not. The four which
were supported in the expected manner yielded the following
results.
1. There is no significant difference between the
organizational climates of the venture capital funded and
unfunded firms.
2. The top management team of the funded firm is of a
higher quality, with respect to the aggregate prior
functional experience, than that of the unfunded firm.
3. The venture capital funded start-up firm is more
apt to prepare a formal business plan, and this plan, in

130
general, is more comprehensive for the funded firm than for
its unfunded counterpart.
4. The funded high technology start-up firm is more
likely to go public than the unfunded firm.
Three hypotheses were not supported in the expected
manner. Due to findings which are not statistically
significant, the following generalizations are made.
1. No significant difference exists regarding the
respondents' perception of strategy. All firms perceived
themselves to be equally market driven as opposed to
technology driven.
2. All firms, regardless of funding, perceived
themselves to be solutions oriented with a strong customer
focused commitment.
3. All firms perceived themselves to be in a neutral
position regarding market niche focus. No significant
differences between the firm groups were found, and both
groups perceived themselves to be at the midpoint between
focusing on a niche and focusing on a broader market.
It should also be noted that the significance of all of
these findings is enhanced by the fact that in those cases
where a firm attribute is measured by multiple components,
each component represents a unique dimension of the
attribute in question. This is evidenced by the fact that
autocorrelation effects among each particular attribute's
component measures are weak. Appendix K contains the

correlation matrices associated with each of the research
hypotheses.
131

CHAPTER V
SUMMARY, CONCLUSIONS AND RECOMMENDATIONS
This chapter is intended to summarize the whole of
this research study, present conclusions based on the
findings, and make recommendations for future research
regarding the high technology start-up firm.
SUMMARY
Characteristics of the successful high technology
start-up firm have received much attention in the current
business literature. Most of the discussion is based on
personal experience and observation, and it tends to be
discursive and anecdotal rather than being substantiated by
the conciseness of structured empirical research.
The thesis of much of the literature is that the
venture capital funded firm exemplifies the practices of the
successful firm regarding management style, the team
approach to management, the structure of the firm, market
definition, strategy, financial control and planning. The
questions that arise include: (1) Do the funded firms
exhibit the qualities of a successful start-up as a result
of the requirements and rigor of venture capital
acquisition, or are the qualities inherent in the viable

133
high technology start-up firm regardless of funding? and (2)
Are the characteristics and practices of the successful
start-up firm, as defined by the current business
literature, embraced by the start-up firm as "the way we do
business", or do these notions exist only in the theoretical
context of "the best way to do business"?
The intent of this study was to shed light on both of
these questions by contrasting and comparing the venture
capital funded firm high technology start-up firm and the
unfunded firm regarding several of the aforementioned
characteristics. Aspects of organizational climate, top
management team approach, marketing strategy and focus,
business planning and the intent to go public as a means of
addressing future financing needs were addressed.
The current business literature served as the source
of the characteristics to be examined, the hypothesized
differences between venture capital funded and unfunded
firms, and the subsequent expectations regarding those
differences.
In order to test the hypotheses, a nationwide survey
was performed. Based on a sampling frame of 1350 high
technology start-up firms, a final sample of 226 respondent
firms was obtained. The respondents represented thirty-two
states, and the sample was unevenly split regarding the
acquisition of venture capital financing, with 142 firms
being unfunded and 84 firms being funded. Data collection

was accomplished through the use of a mail survey. Two
mailings were undertaken to achieve a twenty-one percent
response rate.
134
Hypothesis testing was accomplished, for the most
part, through the employment of ANOVA. Most hypotheses were
tested to determine if significant differences occurred
between variable means for the venture capital funded and
unfunded firms. In those cases involving nominal scale
variables, the Chi-square statistic was utilized to test for
independence between funding and the variable under
question. In all cases, a significance level of .10 was
selected as the criterion for acceptance or rejection of the
null hypothesis.
The results of hypothesis testing did not necessarily
support all expectations regarding differences between the
firm groups. The discrepancies exist primarily with regard
to perceptions of marketing traits. While the sample as a
whole perceives itself as market driven and solutions
oriented, some differences occurred between the groups, but
they were not statistically significant. Examination of the
attributes of a market niche focus also resulted in
differences which were not statistically significant, in
addition to the fact that neither group exemplifies a focus
on a narrow market niche.
----- - - ----- -------

135
CONCLUSIONS
Based upon the results of the testing of each of the
seven hypotheses, the following conclusions are drawn.
1. There appears to be no question regarding the
organizational climate of the high technology start-up firm.
Based upon those aspects examined, both the funded and
unfunded firms embrace practices which strongly manifest
those of an organic organization. The strong propensities
toward both open communication channels and participatory
decision making are indicative of the lack of formal
structure present in these organizations. Structure is,
instead, imposed by the value system of the start-up, and
that value system provides a context of integrity and
equality within which all employees focus on the common goal
of the firm. In addition, creativity is strongly supported,
as it should be, by the notion that failure is viewed in a
positive context as a necessary component of both being
creative and making technological advancements.
These findings have implications for the nascent high
technology entrepreneur to the extent that one must examine
his/her management style to assess whether or not he/she can
take a leadership role in creating the culture that is
necessary to operate within the dynamic high technology
arena.
2. The team approach to management is practiced by
both funded and unfunded firms, although the venture capital

136
funded firms have a higher quality top management team when
quality is defined by aggregate primary past functional
experience. The funded firm has a larger team which, in
turn, brings more years of experience, a higher aggregate
level of organizational responsibility, and more diversity
of functional capability. This diversity provides balance
in terms of complementary functional skills.
Additional strength is added to the top management
team of the funded firms due to a higher percentage of
members whose prior experience is directly related to the
functional capacity in which they now serve. ~imilarly, the
funded firm is more likely to have management team members
whose previous experience was in a firm whose core
technology was the same or very similar to that of the
start-up.
Examination of the data beyond hypothesis testing
substantiated the notion that the higher quality exhibited
by the funded firms is a function of viewing the team as a
whole, rather than assessing quality based on the average
team member. When the notion of quality was assessed by
comparing the average team member, it was found that: (1)
regarding years of experience, the average funded firm team
member has ten percent less than his/her counterpart; (2)
regarding level of organizational responsibility, the funded
firm team member worked at only a slightly higher level than
the unfunded counterpart; and (3) regarding annual sales

volume, the average team member in the funded firm had
his/her previous experience in a firm which was twice as
large as the unfunded team member. On this individual
basis, only the difference in annual sales volume is
statistically significant at the .10 level. For the most
part, then, the individual team members "look" the same.
137
As was discussed in the review of the literature, size
of the firm in which previous experience was gained tends to
be of lesser importance than the notions of diversity,
compatible or like technologies, and sameness regarding
functional capacities served in. It can be concluded that
since the attributes regarding prior experience tend to
exhibit equality when examined relative to the individual
team member, the quality of the top management team is
enhanced by the team concept.
These findings have implications particularly for
those firms that intend to seek venture capital financing.
The findings of this study support the notions presented in
the current literature regarding the composition of the top
management teams of the firms which do, in fact, receive
funding. Assuming that the present study provides an
accurate picture of the management teams of both the funded
and unfunded firms, it appears that the unfunded firm
attempting to acquire venture capital would have to make a
concerted effort to shore up their management teams through
the addition of members who would add functional diversity
-----.-- ---------------------------------~

138
coupled with experience in a firm in the same technological
arena as the start-up.
3. There do not appear to be significant differences
between the venture capital funded and unfunded firms
regarding the various marketing oriented characteristics.
Both groups tend to be market driven with a solutions
orientation. These two characteristics are in strong
support of the literature.
The finding which may have implications for both the
funded and the unfunded firms is that regarding a narrow
focus on a market niche. Both groups strongly agree that
their products do not have broad commodity market appeal,
and their markets have unique characteristics which
differentiate them from the larger market as a whole. On
the other hand, both groups indicate that they tend to
compete with larger firms based on a product that is not
necessarily unique enough to create a barrier to entry.
Additionally, they take a neutral stance regarding the use
of low cost as a basis of competitive strategy.
It is these last three findings that raise some issues
for both groups of firms. If the current business
literature is correct regarding a narrow focus on a market
niche, then the high technology start-up firms should
reexamine their current strategies. If their product is not
necessarily unique, what are the barriers to entry into
their market? Are they in a defensible position in their
-- ---- ~---

"-
139
market or are they attempting to follow the leader hoping to
gain market share through a low cost strategy? Are they
competing in a market which they can control? The most
defensible position for the high technology start-up is to
be the leader in a sufficiently narrow market with a unique
product that is not easily copiable.
4. The high technology start-up firm which has
received venture capital funding is more likely to go public
than the unfunded firm. This particular finding
substantiates earlier research by Goslin and Kiehl (Goslin
and Kiehl, 1988). Based on those earlier results and these
current findings, one can conclude that the unfunded firm
does not make a public stock offering for much the same
reason that it does not seek venture capital financing -
independence. Management wants to maintain control of the
firm. Public stock offerings, like venture capital
infusions, result in the entrepreneur having "a smaller
piece of a larger pie". However, with the potential of
greater gain comes the loss of control and independence.
5. Business planning is practiced by the majority of
all high technology start-up firms, although the funded
firms do so to a greater extent. Not only do virtually all
funded firms prepare business plans, but the plans
themselves appear to be more extensive. Additionally, the
primary purpose for which the funded firm prepares the plan
is for venture capital acquisition. It is unknown if the

business plan also serves as a working document for the
management of the firm.
140
On the other hand, the unfunded firms perform business
plan preparation to a lesser extent, but do so because of
operating necessity. In this latter case, it can be
concluded that the business plan is used in an ongoing
fashion for the management of the firm.
These findings have implications particularly for the
unfunded firm which may seek venture capital funding in the
future - a comprehensive business plan is a must.
6. Evaluation of the perceptions regarding the
importance of the various business plan components
substantiates the aforementioned findings regarding a market
driven strategy. Market analysis, strategy and definition
are perceived as the most important business plan
components. These components are also perceived as 2 1/2
times as important as product definition and approximately
four times as important as product R&D. It follows that
the high technology start-up firms, as a group, also
perceive themselves as more market driven than technology
driven.
Additionally the findings regarding quality of the top
management team appear to relate to the perceptions of the
importance of the management team and technological
competency components. The funded firms, with the higher
quality top management teams perceive these two business

plan components to be twice as important as the former's
unfunded counterpart.
RECOMMENDATIONS FOR FURTHER RESEARCH
141
The review of the literature revealed a scarcity of
empirical studies in this particular area. It is this
researcher's hope that this study will be a step toward more
research on the topic of high technology start-up firms.
There are several additional studies that need to be
conducted, and they include the following:
1. The present study should be replicated using an
index of annual sales growth as a means to measure the
success of the firm. Utilizing this measure would give
additional insight into the impact of the practices of both
the funded and unfunded firms to the extent that comparisons
could then be tied to a tangible index of success.
2. The present study should be replicated using a
variable to ascertain whether or not the unfunded firm had
ever sought venture capital funding and was subsequently
refused. The findings of such a study, particularly where
significant differences occurred, would provide useful,
empirically based insights to the "refused funding" firms
regarding how they differ from their funded counterparts.
3. Additional research should be conducted into the
definition of the high technology start-up's market. The
present study may not have used an adequate number of

142
descriptors when trying to ascertain whether or not the
start-up focuses narrowly on a niche. As such, the present
study could not necessarily substantiate or vigorously
refute the niche focus proposed in the current business
literature. Additional descriptors should be used to the
extent that a more exact description of how the firm
competes can be determined.
4. The present study should be replicated using a
variable to define the particular industry segment within
which the high technology firms compete. Findings could
then be compared across industry segments. Given
statistically significant differences between segments,
attributes of the start-up firm could be effectively
differentiated based on segment. Given statistically
insignificant differences, support would be given to the
generalizability of the findings of the present study.
5. Additional research into the organizational
climate of the high technology firm should be undertaken.
The population in this endeavor would include a wider range
regarding age. The intent would be to ascertain how the
organizational climate might change and what that change is
related to.
6. Additional research into geographic clustering
should be undertaken. While the present study is limited to
factors which are internal to the firm, the findings do
indicate significant geographic clustering. The current

143
business literature lends a great deal of support to the
notion that geographic clustering does contribute to the
success of the high technology start-up firm. Future
research regarding the external factors which contribute to
the success of the start-up would have value toward the end
of building a more complete profile of the significant
components in the formula for success.
In singular or together, these results provide a
better picture of success and a clearer understanding of
what factors generally support its achievement. The results
have implications for the nascent entrepreneur in the high
technology arena toward the end of contributing to a more
complete understanding of some of the critical components
essential to the success of a start-up. Understanding the
characteristics of the successful start-up firm is
fundamental to the successful founding and management of a
high technology start-up.

REFERENCES
Aggarwal, Vimla and Sumer C. Aggarwal. 1984. "High Technology: Economic Hope or Hoax?" Business Horizons, Vol 27, No 1, 47-51.
Allaby, Ian. 1984. "The Not So Hallowed Halls of Higher Learning," Canadian Business, Vol 57, No 9, 85-89.
Anderson, Michael A. "Portland Software Firms Face Long Odds," The Business Journal, 14 October, 1985: 13-18.
Andrews, Edmund L. 1986. "Running Out Of Money," Venture, Vol 8, No 1, 32-35.
Bellack, Dan. 1985. "Shattering The Marketing Myths of Silicon Valley Start-Ups," Business Marketing, Vol 70, No 11, 78-84.
Black, Pamela. 1985. "How To Make Them Sit Up and Notice," Venture, Vol 7, No 9, 52-54.
Black, Sena H. 1986. "Different Strokes," Business and Economic Review, Vol 32, No 4, 9-12.
Bleicher, Knut, Frank Bleicher and Herbert Paul. 1983. "Managerial Frameworks for Innovative Responses in High-Tech Organizations," Business Horizons, Vol 26, No 6, 69-78.
Boland, John C. 1985. "Staking Out the High-Tech Winners," Financial World, Vol 54, No 16, 90-93.
Bott, Robert. 1985. "High-Tech Scramble: Calgary Entrepreneurs Make a Play in the US Telephone Industry," Vol 58, No 3, 27-28.
Bruce, Robert V. 1973. Bell. Boston: Little Brown & Co.
Burns, Tom and G. M. Stalker. 1980. "Mechanistic and Organic Systems," in Organizations: Structure and Behavior, New York: John Wiley & Sons.
Burstein, Daniel. 1983. "The Creative Chaos of Tomorrow's World," International Management, Vol 38, No 9, 77-81.

145
Davidow, William H. 1986. Marketing High Technology, New York: The Free Press.
Dewar, Stephen. 1982. "High Tech's Brightest Hopes," Canadian Business, Vol 55, No 4, 76-87.
Drucker, Peter F. 1985. Innovation & Entrepreneurship, New York: Harper & Row.
Emory, C. William. 1980. Business Research Methods, Homewood: Richard D. Irwin.
Farrell, Larry. 1986. "Building Entrepreneurship: A Global Perspective," Training, Vol 23, No 7, 42-50.
Gartner, William B. 1985. "A Conceptual Framework for Describing The Phenomenon of New Venture C1'eation," Academy of Management Review, Vol 10, No 4, 696-707.
Geneen, Harold. 1985. "Why Intrapreneurship Doesn't Work," Venture, Vol 7, No 1, 46-52.
Gephardt, Richard A. 1985. "Congress is Committed to High Technology," Management Review, Vol 74, No 5, 15-16.
Goldman, Marshal I., Howard A Stafford, and Mark Templer. 1984. "The Business of Attracting Industry," Technology Review, Vol 87, No 4, 6-10, 74.
Gomez-Mejia, Luis R. and David B. Balkin. 1985. "Managing a High-Tech Venture," Personnel, Vol 62, No 12, 31-36.
Gordon, Mitchell. 1983. "Tomorrow's Hot Issues: Brentwood Associates Has an Eye for High-Tech Winners," Barron's, Vol 63, No 1, 13, 21-22.
Goslin, L.N. and Kiehl, S.J. (in press) "Characteristics Influencing High Technology Start-Up Success," Frontiers of Entrepreneurship Research.
Greene, Michael. 1985. "A Profile of Seed Capital Funds," Business, Vol 35, No 4, 57-58.
Haavind, Robert. 1986. "Hong Kong: The Chinese Connection," High Technology, Vol 6, No 11, 28-31-
Hartman, Curtis. 1983. "Who's Running Ameri=ca' s Fastest Growing Companies?" Inc., Vol 5, No 8, 41-47.
Henz, Donald J. 1986. "In Search of Excellence - The Lesson for Small Businesses," SAM Advanced Management Journal, Vol 51, No 3, 29-35.

Horton, Thomas R. 1985. "The Challenge of High Technology," Management Review, Vol 74, No 5, 3-4.
146
Howell, James M. 1982. "High-Tech and Risk-Taking Are Bringing the Northeast Back," ABA Banking, Vol 74, No 12, 60-71.
Howell, James M. 1985. "Formula for Growth: The New England Experience," Business and Economic Review, Vol 31, No 2, 17-24.
Johnson, Bob. 1982. "Capital Abounds for 'Right' Projects: Survey," Computerworld, Vol 16, No 32, 78.
Joseph, Johnathan. 1985. "Cracking the Japanese Market From the Inside," Business Week, No 2896, 138-142.
Josephson, Matthew. 1959. Edison, New York: McGraw-Hill.
Juillard, Marie-Jeanne. 1986. "I Get an Equity Kicker Out of You," Venture, Vol 8, No 8, 90-92.
Kane, Sid. 1985. "Your Company or Yourself," Venture, Vol 7, No 6, 98-100.
Kozmetsky, George, Michael D. Gill Jr. and Raymond W. Smilor. 1985. Financing and Managing Fast-Growth Companies, Lexington: Lexington Books.
Krishna, E.M. and C.P. Rao. 1986. "Is US High Technology High Enough?" Columbia Journal of World Business, Vol 21, No 2, 47-54.
Larson, Erik. 1987. "The Best-Laid Plans," Inc., Vol 9, No 2, 60-64.
Levy, Robert, Niles Howard and Thomas J. Murray. 1982. "The High Priests of Hi Tech," Dun's Business Month, Vol 119, No 3, 47-57.
Liles, Patrick R. 1974. "Venture Capital: What It Is and How To Raise It," in New Business Ventures and The Entrepreneur, Homewood: Richard D. Irwin.
Lipton, Susan Lytle. 1982. "High Technology Acquisitions / Venture Capital in High Tech Acquisitions," Mergers & Acquisitions, Vol 17, No 3, 30-40.
Logan, William Bryant. 1986. "Finding Your Angel," Venture, Vol 8, No 3, 38-44.

147
Lorriman, John. 1983. "There's an Urgent Need for 'High Tech Humanism'," Canadian Insurance, Vol 88, No 10, 8-9.
Madlin, Nancy. 1985. "Probing the Entrepreneurial Psyche," Venture, Vol 7, No 5, 24.
Maidique, Modesto A. and Robert H. Hayes. 1984. "Models for Management: Following the Leaders," Computerworld, Vol 18, No 22, 49-63.
Maidique, Modesto A. and Robert H. Hayes. 1984. "The Art of High-Technology Management," Sloan Management Review, Vol 25, No 2, 17-31.
"Making New Ventures Go: A Bankroll and a High-Tech Idea Aren't Enough." 1984. Chemical Week, Vol 134, No 15, 44-48.
Mancuso, Joseph. 1983. How To Prepare and Present a Business Plan, Englewood Cliffs: Prentice-Hall.
Mark, Ken. 1983. "The Entrepreneurial Explosion," Canadian Business, Vol 56, No 11, 86-93.
Marshall, Brian and Robert Forbes. 1983. "Venture Capital Financing of New Technologies," Business Quarterly, Vol 48, No 4, 105-109.
McGuire, Maureen. 1986. "Route 128's Outspoken Man: Napa Valley's Baron of Bubbly," Management Review, Vol 75, No 8, 116-18.
McKenna, Regis. 1985. "Market Positioning in High Technology," California Management Review, Vol 27, No 3, 82-108.
McQueen, Rod. 1984. "The Glory That Could Be Crowntek," Canadian Business, Vol 57, No 9, 108-112.
Michaels, Julie. 1986. "New England: Region Stages an Economic Revival," Advertising Age, Vol 57, No 32, 51-53.
Miller, Roger and Marcel Cote. 1985. "Growing the Next Silicon Valley," Harvard Business Review, Vol 63, No 4, 114-123.
Morris, Gay. 1986. "Going Beyond the Product," Venture, Vol 8, No 7, 28-30.
------ --- -------------

Moser, Thomas S. 1984. "The Great High-Tech Treasure Hunt," Management Focus, Vol 31, No 5, 16-21.
"Part 2: The Valley." 1985. Inc., Vol 7, No 7, 53-58.
Patterson, William Pat. 1983. "Paying Those High-Tech Dues," Industry Week, Vol 219, No 5, 61-62.
Patterson, William Pat. 1985. "High-Tech 'Chess' ," Industry Week, Vol 225, No 2, 50-53.
148
Pearsen, Gordon. 1986. "Business Strategy Should Not Be Bureaucratic," Accountancy, Vol 97, No 1112, 109-111.
Petre, Peter. 1986. "America's Most Successful Entrepreneur," Fortune, Vol 114, No 9, 24-32.
Pratt, Stanley. 1982. How To Raise Venture Capital, New York: Charles Scribner & Sons.
Radding, Alan. 1986. "High-Tech Industry Harvests Area's Resources," Advertising Age, Vol 57, No 32, 84.
Rich, Stanley R. and David E. Gumpert. 1985. "Business Plans That Win $$$: Lessons From The MIT Enterprise Forum," Venture, Vol 7, No 6, 61-74.
Rosenfeld, Stuart A. 1986. "Let the Chips Fall Where They May," Business and Economic Review, Vol 32, No 4, 3-8.
Rozen, Miriam. 1985. "State Programs Lure High Tech Companies," Dun's Business Month, Vol 125, No 3, 93.
Rubinger v Bruce F. 1986. "Windows on Japan," High Technology, Vol 6 No 8, 12-13.
Rutigliano, Anthony J. 1986. "Managing the New," Management Review, Vol 75, No 1, 38-41.
Sabin, Russell. 1984. "Being Your OWn Boss in America," Venture, Vol 6, No 5, 40-52.
Sabin, Russell. 1984. "Private Placements - How Much Are You Willing To Give Up?" Venture, Vol 6, No 7, 106.
Schendel, Dan and Charles Hofer. 1979. Strategic Management: A New View of Business Policy and Planning, Boston: Little Brown & Company.
Schlitit, W. Keith. 1986. "Guidelines for Entrepreneurial Success," SAM Advanced Management Journal, Vol 51, No 3, 44-48.

149
Schoch, Susan. 1985. "The Rarified Path of a Successful Business Plan: Marketing the Business Plan Through the Venture Capital In-Crowd," Venture, Vol 7, No 6, 78-83. .
Schoner, Bertram and Kenneth P. Uhl. 1975. Marketing Research, New York: John Wiley & Sons.
Seddon, Norman. 1984. "Raising Venture Capital: The AllImportant Business Plan," The Accountant, "01 191, No 5700, 3-5.
Shapero, Albert. 1982. "Developing a High-Tech Complex Through Small Business Formations," Survey of Business, Vol 18, No 1, 16-20.
Stacey, Tony. 1986. "How to Succeed With a Start-Up," Accountancy, Vol 97, No 1114, 158-160.
Stevenson, Howard H. and Jose Carlos Jarrillo-Mossi. 1986. "Preserving Entrepreneurship as Companies Grow," The Journal of Business Strategy, Vol 7, No 1, 10-23. ---
Thurston, Philip H. 1983. "Should Smaller Companies Make Formal Plans?" Harvard Business Review, Vol 61, No 5, 162-188.
"Two Lessons in Failure from Silicon Valley." 1984. Business Week, No 2859, 78-83.
Tull, Donald S. and Del I. Hawkins. 1984. Marketing Research: Measurement and Method, New York: Macmillan.
Vesper, Karl H. 1980. New Venture Strategies, Englewood Cliffs: Prentice Hall.
Von Furstenburg, George M. 1986. "High-Tech Industries and Economic Growth," Business Economics, Vol 21, No 3, 43-45.
Walker, Ernset W. and J. William Petty II. 1986. Financial Management of the Small Firm, Englewood Cliffs: Pentice-Hall.
Wartik, Nancy. 1984. "When It Pays To Go It Alone," Venture, Vol 6, No 6, 154-156.
Webre, Philip and David Bodde. 1986. "High Technology's Stake In Tax Reform," Technology Review, Vol 89, No 5, 26-34.
;:::c----------~~-----~

Williams, Bob. 1986. "Try to Understand the Forces of Motivation," Accountancy, Vol 97, No 1113, 90-91.
150
Willis, Rod. 1986. "Mavericks in Brokerage and Insurance," Management Review, Vol 75, No 9, 17-20.
Yeager, Robert L. 1985. "Engineering the Customer-Oriented Marketing Strategy," Business Marketing, Vol 70, No 11, 60-76.
Yeskey, Dennis. 1986. "Strategic Marketing: Industrial Companies Face a Critical Challenge," Management Review, Vol 75, No 4, 20-24.
Zachary, G. Pascal. 1985. "High Tech's New Reality," Willamette Week, Vol 11, No 50, 1-12.
Zalud, Bill. 1985. "High Tech In The Heartland," Datamation, Vol 31, No 13, 90-96.

APPENDIX A
QUESTIONNAIRE
TOP MANAGEMENT TEAM
This section on management team experience deals with understanding the previous primary experience (strongest experience) of each of your principal top management team members. For you as CEO and for the other members of your team, indicated as B, C, and D, please provide:
o his/her prior primary Experience,
o Years of experience
o Level of organizational responsibility (as an example, CEO = "1", VP of a functional area = "3", Departmental manager = "5", and Group Supervisor = "7".
o Sales volume (in millions of dollars) of firm in which experience was gained.
The following EXAMPLE provides some guideline.
CEO o--John Doe, CEO has had 5 years of experience in marketing.
o Place a "5" in the "Y" column under the "CEO" in the "Marketing/Sales" row.
o John's level of organizational responsibility was vice president of marketing.
o Place a "3" in the "L" column under the "CEO" in the "Marketing/Sales" row.
o The annual sales volume at the firm where John gained the experience was $4.3 million.
o Place a "4.3" in the "s" column under the "CEO" in the "Marketing/Sales" row.
TEAM MEMBER B o Pat May, team member B, has had 7 years experience in
finance. o Place a "7" in the "Y" column under the "B" in the
"Finance/Accounting" row.

152
o Pat's level of organizational responsibility was department manager.
o Place a "5" in the "L" column under the "B" in the "Finance/Accounting" row.
o The annual sales volume at the firm where Pat gained the experience was $50 million.
o Place a "50" in the "s" column under the "B" in the "Finance/Accounting" row.
Management
Mktg/Sales
Fin./Acct.
****** EXAMPLE MATRIX ****** -----______ 1 ______ ----- -----------1
CEO B C D 1 I
--~~~~~- -~~~~~~ ~~~~~~- -~~~~--_I _Y_I_L_I_S_ Y _L_!_S_ Y L S _Y_I_L __ S_!
I I I I __ 1_- __ 5 3 4.3 ----I
I I 7 __ 1_- 5 50 ----
Eng/Science __ __1_-Mfg./Opr.
R&D
Other __ _ I I I __1_-
*** PLEASE FILL IN THE MATRIX BELOW FOR YOUR FIRM ***
-----------1-----------1-----------1-----------CEO 1 B 1 C I D
I I I ~~~=_~~-I I I~~~=_~~-Y I LIS I Y I LIS I Y I LIS I.y I LIS - _1- _1 __ 1 __ 1 __ 1 __ 1 __ 1 __ 1 __ 1 __ 1 __ 1 __
I I I I I I I I I I I I I I I I I I
Management I I I 1 I I 1 I I __ 1 __ 1 __ 1_- ___ 1 ____ 1 __ 1 __ 1 __ 1 __ 1 __ I I I I I I I I I I I I I I I I I I
Mktg/salesl_-I_-I_-I_- __ 1 ____ 1 __ : __ 1 __ 1 __ 1 __ I I I I I
Fin./Acct·I __ I __ I __ I _____ I __ I I I I I I
Eng/Science __ I__ __I __
Mfg./Opr.
R&D
Other __ _
I I I
--I--I I __ I_-I
I I I I
__1 __ 1_-
I I I __ I_-I I I __ 1_-
I I I __ I_-I I I __ 1_-

153
1. Please specify those members of your top management team who now serve in the same or a similar functional capacity as that specified above. (please circle the appropriate team member/s.)
CEO B c D
2. Please specify those members of your top management team whose previous experience (as defined in the matrix above) was in a firm utilizing or producing the technology that supports your product. (please circle the appropriate team member/s.)
CEO B C D
FINANCE
3. How many years has it been since your firm was founded?
YEARS
4. How many rounds of venture capital (equity from a formal venture capital company) has your firm had ? (please circle the appropriate number.)
o 1 2 3 4 5
5. What percent of your business (percent of equity) did you have to give up to get each round of venture funding ?
ROUND
1.
2.
3.
NOT APPLICABLE
DOLLARS OBTAINED % GIVEN UP

154
6. What is the probability of your firm going public in the next two years: (please circle the appropriate choice. )
1 Definitely
Will Not
2 Probably Will Not
3 Not
Sure
4 Probably
Will
5 Definitely
Will
7. We expect to go public within years of founding. (please circle the appropriate number.)
1 2 3 4 5 N/A
BUSINESS PLANNING
8. How many 8 1/2 x 11 pages are there in your business plan :
___ PAGES
9. For what primary purpose did you develop your business plan: (please circle the number to the left of the purpose.)
1. Operating necessity 2. Venture capital requirement 3. Market strategy and definition 4. Other (please specify)
10. Which component of your business plan do you consider to be the most important: (please circle the number to the left of the "most important".)
1. Product definition 2. Market analysis (customers and competiticn) 3. Marketing strategy (pricing, promotion,
distribution, etc.) 4. Product R&D 5. Manufacturing (if applicable) 6. Profit and cashflow projections 7. Management team 8. Market size / share 9. Technological competency
''I"

155
11. Which component of your business plan do you consider to be the least important? (please circle the number to the left of the "least important".)
1. Product definition 2. Market analysis (customers and competition) 3. Marketing strategy (pricing, promotion,
distribution, etc.) 4. Product R&D 5. Manufacturing (if applicable) 6. Profit and cashflow projections 7. Management team 8. Market size / share 9. Technological competency
12. Please divide 10 points among three of the business plan components listed below so that the division will reflect the three most important to you. (Assign the most points to the most important and the fewest points to the third most important.)
10
Product definition Management Team Product R&D Market analysis Marketing strategy Profit & cashflow projections Manufacturing (if applicable) Market size / share Technological Competency Total
EXAMPLE
3 2
5 10 Total
***** Please indicate the extent to which you agree ***** with the following statements about your firm.
Management Style
Strongly Neither Strongly Disagree Agree
1 2 ____ 3 4 5 __
13. Open communication flow, both horizontal and vertical, is never encouraged. 1 2 3 4 5
14. Our decision making style is very participatory. 1 2 3 4 5

156
strongly Neither Strongly Disagree Agree
1 2 ____ 3 4 5
15. Our culture does not include a tolerance of failure as a part of learning. 1
16. Our policies (e.g. ethics, profit sharing, integrity) are very consistent with corporate goals. 1
17. Profit is much more important than integrity. 1
MARKETING
18. Our product is so good that it will sell itself. 1
19. Customer feedback is not essential to our product development. 1
20. Our firm is extremely knowledgeable about competitor activities. 1
21. We compete directly with very large companies. 1
22. Our employees are very customer focused. 1
23. We do not believe that market demand is primary to technological sophistication.
24. Our firm is intimately knowledgeable about our customers' business.
25. We strive to be low cost producer in our market.
26. Uniqueness of our product deters entry by others.
1
1
1
1
2
2
2
2
2
2
2
2
2
2
2
2
3 4 5
3 4 5
3 4 5
3 4 5
3 4 5
3 4 5
3 4 5
3 4 5
3 4 5
3 4 5
3 4 5
3 4 5

157
Strongly Neither Strongly Disagree Agree
1 2 3 4 5 -27. Our product appeals to a
broad commodity market. 1 2 3 4 5
28. Our firm's focus is on sharp unique market segmentation. 1 2 3 4 5
29. Our market has needs or characteristics that differ from the larger market as a whole. 1 2 3 4 5

APPENDIX B
HYPOTHESIS TEST RESULTS EXPECTED VERSUS ACTUAL
Expected
Management Depth
HI: Funded firm's organizational climate more organic
H2: Funded firm's top management team higher quality
Marketing Skill
+
H3: Funded firm more market driven +
H4: Funded firm more solutions oriented +
H5: Funded, firm focuses more narrowly on a niche +
Financial Control
H6: Funded firm more likely to go public
H7: Funded firm more likely to have prepared a formal business plan
+
+
158
Actual
+
+
+

APPENDIX C
DEMOGRAPHICS - ENTIRE SAMPLE
Variable
Location of Firm: AL AZ CA CO CT FL GA IL KS KY MA MD MI MN MO NC NH NJ NM NY OH OR PA RI SC TN TX VA VT WA WI WV
Number of Responses
1 4
56 3 7 7 4 5 1 1
25 7 3 8 1 2 2 6 1 4 2
24 11
1 2 2
12 5 4
10 4 1
159
Percentage of Total Responses
.4 1.8
24.8 1.3 3.1 3.1 1.8 2.2
.4
.4 11.1
3.1 1.3 3.5
.4
.9
.9 2.7
.4 1.8
.9 10.6
4.9 .4 .9 .9
5.3 2.2 1.8 4.4 1.8
.4

Variable
Firm Age: 1 year 2 years 3 years 4 years 5 years
Venture capital Funding: Unfunded Funded
Number of Responses
21 30 41 66 68
142 84
160
Percentage of Total Responses
9.3 13.3 18.1 29.2 30.0
63.1 36.9

APPENDIX D
DEMOGRAPHICS - UNFUNDED FIRMS
Variable
Location of Firm: AL AZ CA CO CT FL GA IL KY KS MA MD MI MN MO NC NH NJ NM NY OH OR PA RI SC TN TX VA VT WA WI WV
Number of Responses
1 4
34 3 4 5 4 3 1 o
12 3 2 5 1 2 2 2 1 1 1
16 8 1 2 1 5 3 2 9 3 1
161
Percentage of Total Responses
.7 2.8
23.9 2.1 2.8 3.5 2.8 2.1
.7
.0 8.5 2.1 1.4 3.5
.7 1.4 1.4 1.4
.7
.7
.7 11.3 5.6
.7 1.4
.7 3.5 2.1 1.4 6.3 2.1
.7

Variable
Firm Age: 1 year 2 years 3 years 4 years 5 years
Number of Responses
16 20 23 39 44
162
Percentage of Total Responses
11.3 14.1
·16.2 27.4 40.0

APPENDIX E
DEMOGRAPHICS - FUNDED FIRMS
Variable
Location of Firm: AL AZ CA CO CT FL GA IL KS KY MA MD MI MN MO NC NH NJ NM NY OH OR PA RI SC TN TX VA VT WA WI WV
Number of Responses
o o
22 o 3 2 o 2 1 o
13 4 1 3 o o o 3 o 3 1 8 3 o o 1 7 2 2 1 1 o
163
Percentage of Total Responses
.0
.0 26.5
.0 3.6 2.4
.0 2.4 1.2
.0 15.7
4.8 1.2 3.6
.0
.0
.0 3.6
.0 3.6 1.2 9.6 3.6
.0
.0 1.2 8.4 2.4 2.4 1.2 1.2
.0
---- - - -------------------------------

Variable
Firm Age= 1 year 2 years 3 years 4 years 5 years
Rounds of Venture Capital: 1 2 3 4 5 7
Round 1 Dollars: < 1 million 1 - 1.99 million 2 - 2.99 million 3 - 3.99 million 4 - 4.99 million 5 5.99 million 6 - 6.99 million 7 - 7.99 million 9 - 9.99 million
10 million 25 million
Round 1 Equity % Given Up: o - 10
11 - 20 21 - 30 31 - 40 41 - 50 51 - 60 61 - 70 75 80 90
Number of Responses
5 10 18 26 24
27 26 20
6 3 1
26 18 11
3 3 4 2 2 1 1 1
7 7
14 10 16
8 2 3 2 2
~----------~--------
164
Percentage of Total Responses
6.0 12.0 21.7 31.3 28.9
32.5 31.3 24.1 7.2 3.6 1.2
36.1 25.0 15.3
4.2 4.2 5.6 2.8 2.8 1.4 1.4 1.4
9.9 9.9
19.7 14.1 22.6 11.2
2.8 4.2 2.8 2.8

165
Number of Percentage of variable Responses Total Responses
Round 2 Dollars: < 1 million 11 25.0 1 - 1.99 million 7 15.9 2 - 2.99 million 11 20.5 3 - 3.99 million 7 15.9 4 - 4.99 million 1 2.3 5 - 5.99 million 4 4.8 6 - 6.99 million 1 2.3 7 - 7.99 million 1 2.3 8 - 8.88 million 1 2.3
12 million 1 2.3 21 million 1 2.3
Round 2 Equity % Given up: 0 - 10 6 13.3
11 - 20 16 35.6 21 - 30 14 32.2 31 - 40 2 4.4 41 - 50 4 8.8 51 - 60 1 2.2 61 - 70 2 4.4 75 2 4.4 80 1 2.2 83 1 2.2
Round 3 Dollars: < 1 million 1 5.0 1 - 1. 99 million 5 25.0 2 - 2.99 million 5 25.0 3 - 3.99 million 4 20.0 4 - 4.99 million 0 .0 5 - 5.99 million 3 15.0 6 - 6.99 million 0 .0 7 - 7.99 million 0 .0 8 - 8.88 million 0 .0 9 million 1 5.0
18.2 million 1 5.0

Variable
Round 3 Equity % Given Up: o - 10
11 - 20 21 - 30 31 - 40 41 - 50 51 - 60 61 - 70 75 80 83
Equity Cost / $ 1 million 1st Round 2nd Round 3rd Round
Number of Responses
9 8 1 1 1 o o o 1 1
36.4 % 10.5
5.8
166
Percentage of Total Responses
42.9 38.1 4.8 4.8 4.8
.0
.0
.0 4.8 2.2

APPENDIX F
ORGANIZATIONAL CLIMATE PROFILES
Dependent Variables
Open communication
Participatory decision making
Tolerance of failure as a part of learning
Policies consistent with corporate goals
Integrity more important than profit
Sum of Scores
Strongly <--Disagree 1 2
------ Mean Venture Capital Funded Rating
Mean Unfunded Rating
3
167
Strongly Agree-->
4 5
--------- -----------------------------------

APPENDIX G
STRATEGY PROFILES
Dependent Variables
Product does not sell itself
Knowledgeable about competitor activities
Employees very customer focused
Strongly <--Disagree 1 2
Market demand is primary to technology
Sum of Scores
Mean Venture Capital Funded Rating
Mean Unfunded Rating
3
168
Strongly Agree-->
4 5
f , ,
'" /

APPENDIX H
SOLUTIONS ORIENTATION PROFILES
Dependent Variables
Customer feedback essential to product development
Employees very customer focused
Intimately knowledgeable about customers' business
Strongly <--Disagree 1 2
Focus on sharp unique market segmentation
Sum of Scores
Mean Venture Capital Funded Rating
Mean Unfunded Rating
3
169
Strongly Agree-->
4 5
\
\

APPENDIX I
MARKET NICHE STRATEGY PROFILES
Dependent Variables Strongly <--Disagree 1 2
Do not compete directly with very large companies
Do not strive to be low cost producer
Uniqueness of product deters entry
Product does not appeal to broad commodity market
Focus on sharp unique market segmentation
Market differs from larger market as a whole
Sum of Scores
------ Mean Venture Capital Funded Rating
Mean Unfunded Rating
3
I
I
I
170
Strongly Agree-->
4 5
I I I
f •
.~.

171
APPENDIX J
BUSINESS PLAN COMPONENT WEIGHTING PROFILES
Component
Product Definition
Management Team
Product R&D
Market Analysis
Mktg. Strategy
Profit & Cashflow
Mfg. (if appl.)
Market Size / Share
Technological Compo
Least <--Important 012
\ \ , . \
<:
'\ , , '\ .
Mean Venture Capital Funded Rating
Mean Unfunded Rating
=---------- - ---
3
Most Important-->
4 5
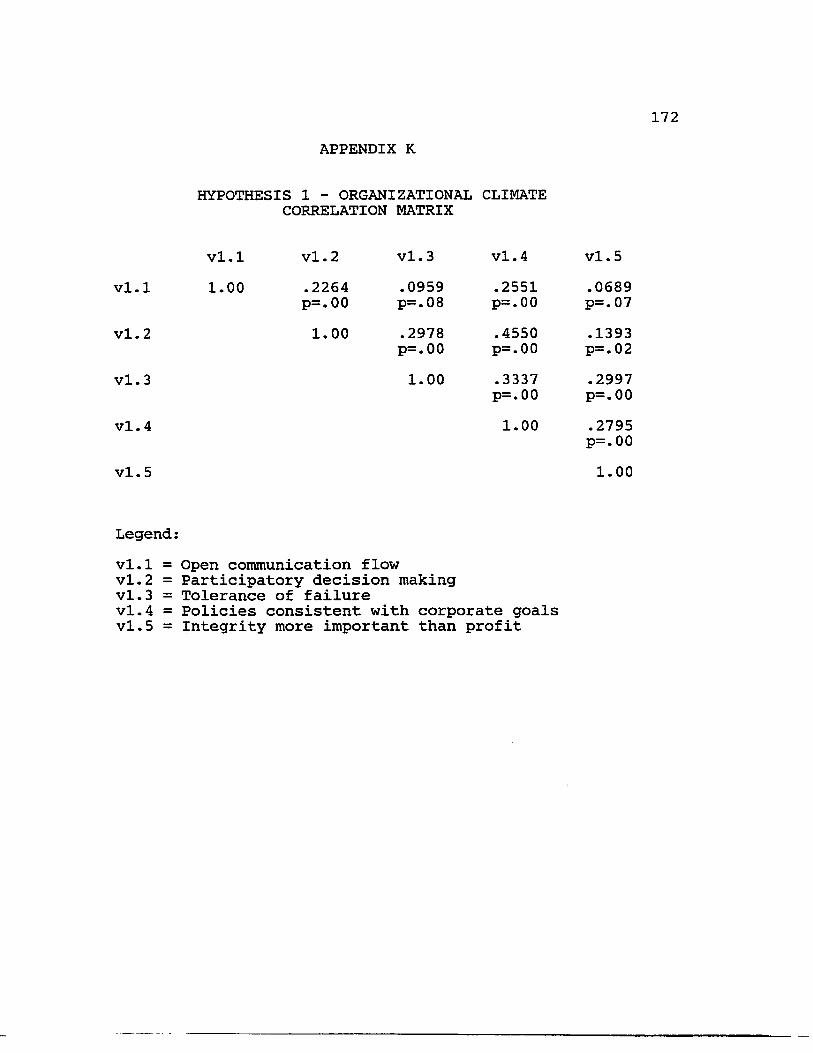
APPENDIX K
HYPOTHESIS 1 - ORGANIZATIONAL CLIMATE CORRELATION MATRIX
v1.1 v1.2 v1.3
v1.1 1.00 .2264 .0959 p=.OO p=.08
v1.2 1.00 .2978 p=.OO
v1.3 1.00
v1.4
v1.5
Legend:
v1.1 = Open communication flow v1.2 = Participatory decision making v1.3 = Tolerance of failure
v1.4
.2551 p=.OO
.4550 p=.OO
.3337 p=.OO
1.00
vl.4 = Policies consistent with corporate goals v1.5 = Integrity more important than profit
172
v1.5
.0689 p=.07
.1393 p=.02
.2997 p=.OO
.2795 p=.OO
1.00

HYPOTHESIS 2 - TOP MANAGEMENT TEAM QUALITY CORRELATION MATRIX
v2.2 v2.3 v2.4 v2.5 v2.6
v2.2 1.00 .5070 .1779 .4366 .2972 p=.OO p=.OO p=.OO p=.OO
v2.3 1.00 .2624 .3377 .3397 p=.OO p=.OO p=.OO
v2.4 1.00 .0188 -.0092 p=.39 p=.45
v2.5 1.00 .4570 p=.OO
v2.6 1.00
v2.7
v2.8
Legend:
v2.2 = Aggregate years v2.3 = Aggregate level of responsibility v2.4 = Aggregate annual sales volume
v2.7
.4695 p=.OO
.4261 p=.OO
.1815 p=.OO
.5525 p=.OO
.4335 p=.OO
1.00
v2.8
.5190 p=.OO
.5484 p=.OO
.0734 p=.14
.3858 p=.OO
.1725 p=.Ol
.5141 p=.OO
1.00
v2.5 = Members serving in same functional capacity v2.6 = Members having experience with same technology v2.7 = Number of team members v2.8 = Number of functional areas represented by prior
experience
173

v3.1
v3.2
v3.3
v3.4
Legend:
HYPOTHESIS 3 - MARKET DRIVEN STRATEGY CORRELATION MATRIX
v3.1 v3.2 v3.3 v3.4
1.00 -.0430 -.1169 .1819 p=.26 p=.04 p=.OO
1.00 .1806 .0717 p=.OO p=.15
1.00 .0435 p=.27
1.00
v3.1 = Product does not sell itself v3.2 = Knowledgeable about competitor activities v3.3 = Employees are customer focused v3.4 = Market demand is primary to technological
sophistication
174

v4.1
v4.2
v4.3
v4.4
Legend:
HYPOTHESIS 4 - SOLUTIONS ORIENTATION CORRELATION MATRIX
v4.1 v4.2 v4.3
1.00 .1663 .0903 p=.OO p=.09
1.00 .3064 p=.OO
1.00
175
v4.4
.1019 p=.07
.1492 p=.Ol
.0679 p=.16
1.00
v4.1 = Customer feedback essential to new product development
v4.2 = Employees customer focused v4.3 = Intimately knowledgeable about customers' business v4.4 = Focus on sharp unique market segmentation

v5.1
v5.2
v5.3
v5.4
v5.5
v5.6
Legend:
v5.1 = v5.2 = v5.3 = v5.4 = v5.5 = v5.6 =
176
HYPOTHESIS 5 - FOCUS ON MARKET NICHE CORRELATION MATRIX
v5.1 v5.2 v5.3 v5.4 v5.5 v5.6
1.00 .2048 .1318 .0267 .0080 -.0559 p=.OO p=.03 p=.35 p=.45 p=.21
1.00 .0250 .1819 .0679 -.0338 p=.36 p=.OO p=.16 p=.31
1.00 .0272 .0824 .1412 p=.35 p=.11 p=.02
1.00 .3195 .3304 p=.OO p=.OO
1.00 .3016 p=.OO
1.00
Do not compete directly with very large companies Do not strive to be low cost producer Uniqueness of product deters entry Product does not appeal to broad commodity market Focus on sharp unique market segmentation Our market differs from the larger market as a whole

v6.1
v6.2
Legend:
HYPOTHESIS 6 - PLAN ON GOING PUBLIC CORRELATION MATRIX
v6.1 v6.2
1.00 .1068 p=.07
1.00
v6.1 = Probability of going public in two years or less v6.2 = Years elapsed between founding and going public
177
<.