A Comparative Study of Student Performance, Attendance ...
243
University of Central Florida University of Central Florida STARS STARS Electronic Theses and Dissertations, 2004-2019 2017 A Comparative Study of Student Performance, Attendance, and A Comparative Study of Student Performance, Attendance, and Discipline in a Community School in a Large Urban School District Discipline in a Community School in a Large Urban School District in the Southern United States in the Southern United States Juanita Morrow University of Central Florida Part of the Educational Leadership Commons Find similar works at: https://stars.library.ucf.edu/etd University of Central Florida Libraries http://library.ucf.edu This Doctoral Dissertation (Open Access) is brought to you for free and open access by STARS. It has been accepted for inclusion in Electronic Theses and Dissertations, 2004-2019 by an authorized administrator of STARS. For more information, please contact [email protected]. STARS Citation STARS Citation Morrow, Juanita, "A Comparative Study of Student Performance, Attendance, and Discipline in a Community School in a Large Urban School District in the Southern United States" (2017). Electronic Theses and Dissertations, 2004-2019. 5524. https://stars.library.ucf.edu/etd/5524
Transcript of A Comparative Study of Student Performance, Attendance ...
University of Central Florida University of Central Florida
STARS STARS
Electronic Theses and Dissertations, 2004-2019
2017
A Comparative Study of Student Performance, Attendance, and A Comparative Study of Student Performance, Attendance, and
Discipline in a Community School in a Large Urban School District Discipline in a Community School in a Large Urban School District
in the Southern United States in the Southern United States
Juanita Morrow University of Central Florida
Part of the Educational Leadership Commons
Find similar works at: https://stars.library.ucf.edu/etd
University of Central Florida Libraries http://library.ucf.edu
This Doctoral Dissertation (Open Access) is brought to you for free and open access by STARS. It has been accepted
for inclusion in Electronic Theses and Dissertations, 2004-2019 by an authorized administrator of STARS. For more
information, please contact [email protected].
STARS Citation STARS Citation Morrow, Juanita, "A Comparative Study of Student Performance, Attendance, and Discipline in a Community School in a Large Urban School District in the Southern United States" (2017). Electronic Theses and Dissertations, 2004-2019. 5524. https://stars.library.ucf.edu/etd/5524
A COMPARATIVE STUDY OF STUDENT PERFORMANCE, ATTENDANCE,
AND DISCIPLINE IN A COMMUNITY SCHOOL IN A LARGE URBAN SCHOOL
DISTRICT IN THE SOUTHERN UNITED STATES
by
JUANITA L. MORROW
B.S. University of Central Florida, 2010
M.S. Kansas State University, 2012
A dissertation submitted in partial fulfillment of the requirements
for the degree of Doctor of Education
in the School of Teaching, Learning, and Leadership
in the College of Education and Human Performance
at the University of Central Florida
Orlando, FL
Summer Term 2017
Major Professor: Barbara A. Murray, Ph.D.

ii
© 2017 Juanita L. Morrow
iii
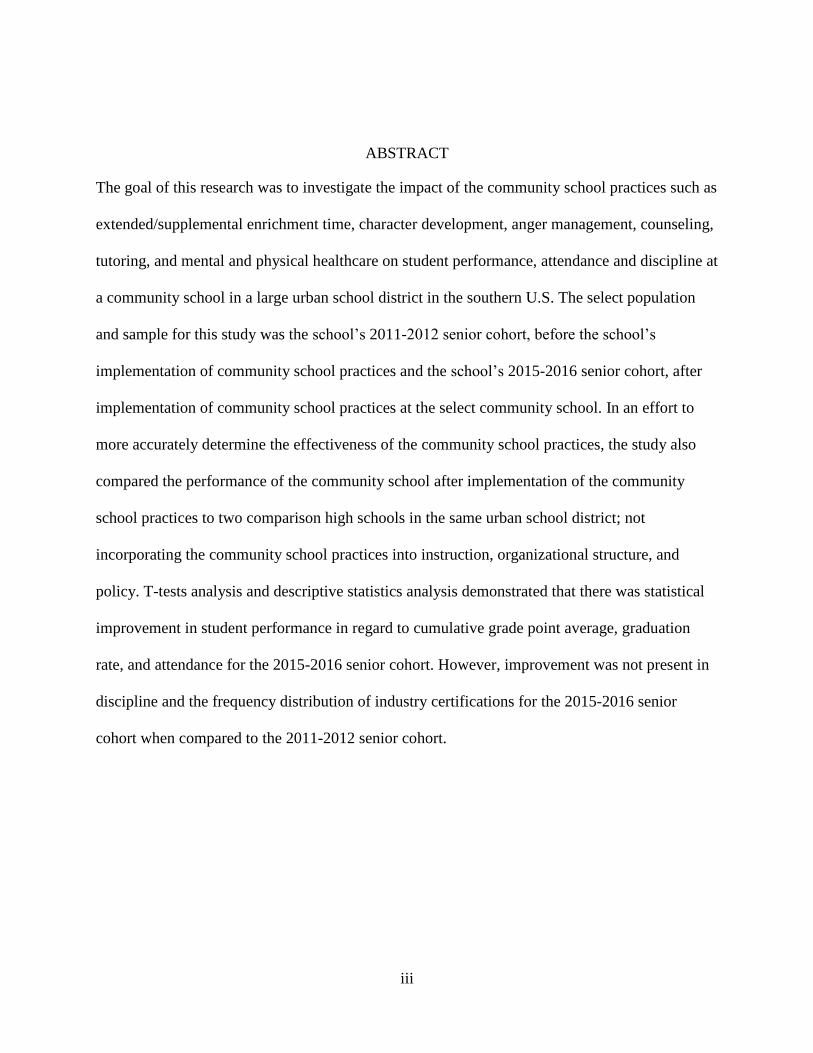
ABSTRACT
The goal of this research was to investigate the impact of the community school practices such as
extended/supplemental enrichment time, character development, anger management, counseling,
tutoring, and mental and physical healthcare on student performance, attendance and discipline at
a community school in a large urban school district in the southern U.S. The select population
and sample for this study was the school’s 2011-2012 senior cohort, before the school’s
implementation of community school practices and the school’s 2015-2016 senior cohort, after
implementation of community school practices at the select community school. In an effort to
more accurately determine the effectiveness of the community school practices, the study also
compared the performance of the community school after implementation of the community
school practices to two comparison high schools in the same urban school district; not
incorporating the community school practices into instruction, organizational structure, and
policy. T-tests analysis and descriptive statistics analysis demonstrated that there was statistical
improvement in student performance in regard to cumulative grade point average, graduation
rate, and attendance for the 2015-2016 senior cohort. However, improvement was not present in
discipline and the frequency distribution of industry certifications for the 2015-2016 senior
cohort when compared to the 2011-2012 senior cohort.
iv
To my grandparents, Annie and Gladston, I am grateful for you!
Grandmother, my entire life you have always made me feel so loved, special, and assured me
that I can accomplish anything that I set my mind to. Your smile warms my heart and makes me
feel renewed. Our interactions always leave me feeling inspired and motivated!
Grandfather, your character is so amazing. You came to the Florida from the Bahamas with very
little but was able to give so much. You are extremely selfless and humble! You worked so hard
and never once complained. You are my hero and a true example of hard-work and dedication to
family.
Two amazing individuals whom I love dearly. I dedicate this dissertation to you!

v
ACKNOWLEDGMENTS
“I’ve learned that people will forget what you said, people will forget what you did, but
people will never forget how you made them feel.” ~ Maya Angelou
Various life experiences have allowed me to build a strong sense of resiliency and
a strong faith. Yet, no matter how strong a person is, everyone needs a strong support
system to lean on in their time of need and to cheer them on. My support system of
family, friends, mentors, cohort members, and committee members is indescribable. To
say that I am forever grateful to you all would be an understatement. I am forever
indebted to you. My repayment to you is to continue the cycle by helping others the same
way that each of you have for me, all while displaying class and grace. Each of you have
forced me to step outside of my comfort zone and push myself closer towards the
greatness that I strive for. For this, among so many other things, I say thank you!
~To my parents, Dessarine and Isaiah, thank you for always doing the best that you could
with what was given and helping me become so resilient and passionate about education.
I hope that I have made you proud.
~ To my siblings, Shaketia and Demetrice, the beautiful and unique thing about siblings
is that God gives each of us different qualities, all while making us comparable because
the purpose is for us to be one. Together, we are stronger. I hope that I have made you
proud to call me your sister.
~ To Paula, my first role model, I will never be able to put into words just how much you
truly mean to me! I have looked up to you my entire life and strived to be just like you in
so many ways. Your heart, selflessness, and drive are admirable! Thank you for always
vi
being there. Your presence in my life has truly helped me become the woman that I am
today.
~To Kari, Marcus II, Kailani, William II, Jaylin, and Kammoni, everything that I do is
for you. I promise to always be supportive and loving to each of you. I want each of you
to always remember that you can do anything that you set your mind to and never let
anyone convince you otherwise. I hope that I have been a good role model for each of
you. Always remember to follow your dreams, stay humble, and work hard.
~To Brent, thank you for always being so positive, loving, and uplifting. Your positive
spirit has helped me through some tough times during this process. I am forever grateful
for your constant reassurance and support. Your love and support keeps me going. Thank
you for keeping a smile on my face at all times!
~To my best friends, Shavondalyn and Candace, both of you are so loyal, supportive, and
caring. In each chapter of my life and throughout all of life’s ups and downs I know that I
can always count on both of you. Shavondalyn, you are by far one of the most genuine
and caring individuals that I’ve ever met! Candace, I admire your drive, work ethic and
honesty. I am happy to call each of you my best friends.
~To my dear friends, MeKeisha, Brittany, Brittney, Stephanie, and Alexandria, I am so
grateful for your friendship. Thank you for a listening ear, a loving spirit, encouraging
words, and good laughs. Each of you are such strong, beautiful, and intelligent women. I
cherish our friendship.
vii
~To my cohort members and friends, Adrienne, Pamela, Karena, and Leah, each of you
have made this process less stressful so many times. Thank you all for the constant circle
of support and much needed laughs. There were so many phone calls, text messages, and
gatherings that provided me with just the right amount of motivation to keep going
strong. I wish you all the best with your future endeavors.
~ To my mentor, Dr. Karemah Manselle, thank you for being such a great example of a
strong, intelligent, and hard-working woman. I appreciate your encouraging words,
wisdom and your indirect and direct motivation. You have been with me during some
really tough times and have proven yourself to be a true cheerleader for my success. You
are appreciated!
~ To my mentor and committee member, Dr. Synthia Doaks, you are truly a lifesaver and
you are Heaven sent! Thank you for your friendship and for coaching me through this
process. Your passion for community service and overall uplifting the community is so
refreshing and encouraging. I am forever grateful for you.
~To my dissertation chair, Dr. Barbara A. Murray, thank you for your guidance and
wisdom. I appreciate your perfect combination of “tough love” and compassion. Each
time you and I had a conversation I was filled with new ideas of how I can be more
impactful in the field of education. Thank you for always pushing me to go one step
further.
~ To my dissertation committee members, Dr. Lee Baldwin, Dr. Walter Doherty, and Dr.
Valerie A. Storey, thank you for your patience, expertise, and guidance.
viii
TABLE OF CONTENTS
LIST OF FIGURES ........................................................................................................................ x
LIST OF TABLES ......................................................................................................................... xi
CHAPTER 1 INTRODUCTION .................................................................................................... 1 Background of Study .......................................................................................................... 1 Statement of Problem .......................................................................................................... 5 Purpose of Study ................................................................................................................. 6
Research Questions and Hypotheses .................................................................................. 6
Limitations .......................................................................................................................... 9 Delimitations ..................................................................................................................... 10
Definition of Terms........................................................................................................... 11
Theoretical Framework ..................................................................................................... 14 Overview of Methodology ................................................................................................ 17
Research Design.................................................................................................... 17
Population and Sample ......................................................................................... 18 Data Collection and Analysis................................................................................ 18
Organization of the Study ................................................................................................. 20
CHAPTER 2 REVIEW OF LITERATURE ................................................................................. 21 Introduction ....................................................................................................................... 21
Community Schools and Environmental & Organizational Structure Within Urban
Education .......................................................................................................................... 22 Ecological Systems Theory................................................................................... 22 Community Schools as Open-Systems ................................................................. 24
Racial Integration and Student Achievement ....................................................... 26 School Zoning, School Choice, and Student Achievement .................................. 29 Poverty and Urban Education ............................................................................... 32
Student Performance in Urban Schools ................................................................ 34 Teaching in Urban Schools ................................................................................... 36 Discipline and Urban Education ........................................................................... 45
Community Schools and Relationship Building ............................................................... 50 School-Community Relationship .......................................................................... 50
Parent-School Relationship ................................................................................... 56
Parent-Child Relationship ..................................................................................... 59
Community Schools and Student Self-Improvement ....................................................... 64 Maslow’s Hierarchy of Needs .............................................................................. 64 Student Mental, Emotional, and Physical Health ................................................. 68
Summary ........................................................................................................................... 73
CHAPTER 3 METHODOLOGY ................................................................................................. 75 Introduction ....................................................................................................................... 75 Purpose of Study ............................................................................................................... 75
ix
Research Questions and Hypotheses ................................................................................ 76 Profile of the LUS School District .................................................................................... 79
The LUS Community School Model ................................................................................ 80 Selection of Participants ................................................................................................... 90 Study Approval ................................................................................................................. 91 Data Collection ................................................................................................................. 92 Data Analysis .................................................................................................................... 93
Summary ........................................................................................................................... 97
CHAPTER 4 DATA ANALYSIS .............................................................................................. 102 Introduction ..................................................................................................................... 102
Descriptive Statistics ....................................................................................................... 103 Population and Sample ....................................................................................... 103
Stability Rate ................................................................................................................... 104 Cohort Analysis .............................................................................................................. 105
Research Question 1 ........................................................................................... 110 Research Question 2 ........................................................................................... 117
Research Question 3 ........................................................................................... 133 Research Question 4 ........................................................................................... 144 Research Question 5 ........................................................................................... 150
Summary ......................................................................................................................... 166
CHAPTER 5 SUMMARY, DISCUSSION, AND RECOMMENDATIONS ............................ 171
Introduction ..................................................................................................................... 171 Purpose and Problem ...................................................................................................... 172
Research Questions and Hypotheses .............................................................................. 173 Summary of the Findings ................................................................................................ 175
Implications for Policy and Practice ............................................................................... 179 Continuous Effort to Narrow the Achievement Gap for Hispanic Students ................... 187 Continuous Efforts for School Turnaround and School Transformation........................ 189
Recommendations for Future Studies ............................................................................. 193 Summary ......................................................................................................................... 195
APPENDIX A PERMISSION TO REPRODUCE FIGURE................................................... 198
APPENDIX B INSTITUTIONAL REVIEW BOARD APPROVAL ..................................... 200
REFERENCES ........................................................................................................................... 202
x
LIST OF FIGURES
Figure 1. LUS School District: Community School Organization Structure................................ 85
xi
LIST OF TABLES
Table 1 LUS School District: Community School Staff Roles, Responsibilities, and Funding
Sources .......................................................................................................................................... 86
Table 2 LUS School District: Community School Councils and Meeting Structure ................ 88
Table 3 Sample Size: LUS Community School and Comparison High Schools ........................ 91
Table 4 Demographics: LUS School District Community School and Comparison High Schools
....................................................................................................................................................... 91
Table 5 Course Count: LUS Community School and Comparison High Schools ..................... 94
Table 6 Research Questions, Research Method, Variables, Data Sources, and Data Analysis .. 99
Table 7 Cohort Completion: LUS Community and Comparison High Schools ....................... 105
Table 8 Sample by Race: LUS Community and Comparison High Schools ........................... 108
Table 9 Sample by Gender: LUS Community and Comparison High Schools ....................... 109
Table 10 LUS Community School Cumulative GPA Means Comparison, 2011-2012 and 2015-
2016............................................................................................................................................. 110
Table 11 LUS Community School GPA t-test Results ............................................................. 112
Table 12 LUS Community School and High School A GPA Means Comparison, 2011-2012 113
Table 13 LUS Community School and High School A GPA t-test Results, 2011-2012 .......... 113
Table 14 LUS Community School Cumulative and High School B GPA Means Comparison,
2011-2012 ................................................................................................................................... 114
Table 15 LUS Community School and High School B GPA t-test Results, 2011-2012 .......... 114
Table 16 LUS Community School Cumulative GPA and High School A GPA Means
Comparison, 2015-2016 .............................................................................................................. 115
Table 17 LUS Community School and High School A GPA t-test Results, 2015-2016 .......... 115
Table 18 LUS Community School Cumulative and High School B GPA Means Comparison,
2015-2016 ................................................................................................................................... 116
Table 19 LUS Community School and High School B GPA t-test Results, 2015-2016 .......... 117
Table 20 LUS Community School Percentage Attended, 2011-2012 and 2015-2016 ............. 119
Table 21 LUS School Percentage Attended t-test Results ........................................................ 119
Table 22 LUS Community School and High School A Percentage Attended Comparison, 2011-
2012............................................................................................................................................. 120
Table 23 LUS Community School and High School A Percentage Attended t-test Results .... 121
Table 24 LUS Community School and High School B Percentage Attended Comparison, 2011-
2012............................................................................................................................................. 122
xii
Table 25 LUS Community School and High School B Percentage Attended t-test Results, 2011-
2012............................................................................................................................................. 122
Table 26 LUS Community School and High School A Percentage Attended Comparison, 2015-
2016............................................................................................................................................. 123
Table 27 LUS Community School and High School A Percentage Attended t-test Results, 2015-
2016............................................................................................................................................. 123
Table 28 LUS Community School and High School B Percentage Attended Comparison, 2015-
2016............................................................................................................................................. 124
Table 29 LUS Community School and High School B Percentage Attended t-test Results, 2015-
2016............................................................................................................................................. 125
Table 30 Attendance Rating Scale ............................................................................................ 125
Table 31 LUS Community School Days Absent Comparison, 2011-2012 and 2015-2016 ..... 127
Table 32 LUS Community School & High School A: Days Absent Comparison, 2011-2012 128
Table 33 LUS Community School & High School B: Days Absent Comparison, 2011-2012 129
Table 34 LUS Community School & High School A Days Absent Comparison, 2015-2016 . 131
Table 35 LUS Community School & High School B Days Absent Comparison, 2015-2016 .. 132
Table 36 LUS Community School Mean Suspensions Comparison, 2011-2012 and 2015-2016
..................................................................................................................................................... 134
Table 37 LUS Community School Mean Suspensions t-test Results, 2011-2012 and 2015-2016
..................................................................................................................................................... 134
Table 38 LUS Community School and High School A Mean Suspensions Comparison, 2011-
2012............................................................................................................................................. 135
Table 39 LUS Community School and High School A: t-test Results for Mean Suspensions,
2011-2012 ................................................................................................................................... 136
Table 40 LUS Community School and High School B: Mean Suspensions Comparison, 2015-
2016............................................................................................................................................. 137
Table 41 LUS Community School and High School B: t-test Results for Mean Suspensions,
2015-2016 ................................................................................................................................... 137
Table 42 LUS Community School Length of Suspensions Comparison, 2011-2012 and 2015-
2016............................................................................................................................................. 138
Table 43 LUS Community School and High School A: Length of Suspensions Comparison,
2011-2012 ................................................................................................................................... 139
Table 44 LUS Community School and High School B: Length of Suspension Comparison,
2011-2012 ................................................................................................................................... 141
xiii
Table 45 LUS Community School and High School A: Length of Suspensions Comparison,
2015-2016 ................................................................................................................................... 142
Table 46 LUS Community School and High School B: Length of Suspensions Comparison,
2015-2016 ................................................................................................................................... 143
Table 47 LUS Community School Graduation Rate Comparison, 2011-2012 and 2015-2016
Cohorts ........................................................................................................................................ 145
Table 48 LUS Community School Cohort: Five Year Graduation Rate, 2011-2016 ............... 146
Table 49 LUS Community School and High School A: Graduation Rate Comparison, 2011-12
and 2015-2016 ............................................................................................................................ 147
Table 50 LUS Community School and High School A: Graduation Rate Five-year Comparison
..................................................................................................................................................... 148
Table 51 LUS School and High School B Graduation Rate Comparison, 2011-12 and 2015-
2016............................................................................................................................................. 149
Table 52 LUS Community School and High School B Graduation Rate Five-year Comparison
..................................................................................................................................................... 150
Table 53 Industry Certifications: LUS Community School 2011-2012 and 2015-2016
Comparison ................................................................................................................................. 152
Table 54 Industry Certifications: LUS Community School, 2011-2012 .................................. 155
Table 55 Industry Certifications: LUS Community School, 2015-2016 .................................. 157
Table 56 Industry Certifications: High School A, 2011-2012 and 2015-2016 Comparison .... 158
Table 57 Industry Certifications: High School A, 2011-2012 .................................................. 159
Table 58 Industry Certifications: High School A, 2015-2016 .................................................. 160
Table 59 Industry Certifications: LUS Community School and High School A Comparison,
2011-2012 ................................................................................................................................... 163
Table 60 Industry Certifications: LUS Community School and High School A Comparison,
2015-2016 ................................................................................................................................... 167
Table 61 Research Questions, Research Method, Variables, Data Sources, Data Analysis,
Hypotheses, and Action Taken ................................................................................................... 168
Table 62 Hispanic Student Graduation Percentages 2011-2016: LUS Community School, High
School A, and High School B ..................................................................................................... 188
1
CHAPTER 1
INTRODUCTION
Background of Study
The concept of community schools, which includes the idea of collaboration and
community orientation, dates back over a 100 years ago to the works of John Dewey and Jane
Addams (Dryfoos, 2002; Luna 2011; Griswold, 2014; Jacobson, 2015). In 1889, Jane Addams
established Hull House in Chicago; and in 1920, James Dewey, the founder of the community
school model, adapted the social change philosophy of settlement houses to schools (Benson,
Harkavy, Johanek, & Puckett, 2009; Luna, 2011; Nicely, 2016; Griswold, 2014). The mission of
both Dewy and Addams was to bridge the gap between the community and education. Dewey
believed that the child should be holistically educated and that the school should be a place for
training, education and access to assistance for both adults and children (Dryfoos, 2002).
Community schools and federal regulations supporting community schools have
developed over time and adapted to the social and current events across the United States
(Dryfoos & Maguire, 2002). During the Great Depression, schools acknowledged America’s
social issues and set out to create curricula that would address these issues. This supported the
community schools emphasis on using real-world curriculum (Misner, 1938). With the passing
of the Economic Opportunity Act and the Elementary and Secondary Schools Act of 1965,
community schools were able to assist those living in poverty and provide services to improve
overall living conditions (Rogers, 1998). In an effort to amend the Elementary and Secondary
Education Act of 1965, Congress passed the Community Schools and Comprehensive
Community Education Act of 1978 to develop and support community schools and community
education programs (www.govtrack.us., H.R. 12650, 2015). In the 2011 budget and outline for
2
reauthorization of the Elementary and Secondary Education Act, “President Obama proposed to
use the 21st Century Community Learning Centers program to support community schools and
extended school day initiatives” (Phillips, 2010, p. 33).
Each year students enter school with various challenges; and despite enormous
investment in education reform, the achievement gap between poor children and their higher
income peers persists, threatening the success of the nation’s most vulnerable youth (Center,
Rassen, & Gunderson, n.d., Luna 2011). With an increased emphasis on accountability, schools
have been forced to focus more on standardized testing and less on the holistic approach to
education (Horn, Freeland, & Butler, 2015). Illness, poverty, nutritional shortcomings, and
family dynamics all have the potential to hinder the benefits of schooling and learning (Owens,
2010). Due to a limited amount of resources within the traditional brick and mortar school, many
students are often not provided the assistance needed to eliminate these challenges. Dryfoos and
Maguire (2002) suggested that life for children and families in the 21st century is more complex
than ever and that the role of schools must shift to meet the changing and unique needs.
Community schools represent this change.
Each generation of students have faced unique challenges to which community schools
have adapted to address strengthening students’ mental, physical, and academic capacity
(Dryfoos & Maguire, 2002). Through no fault of their own, some children face nonacademic
barriers to learning and success. Additionally, many students in 21st century K-12 classrooms
have parents who must deal with their own struggles, such as a lack of professional training, low
socioeconomic status, single parenting, language barriers, and lack of education. These struggles
not only impact the family’s overall structure but also the child’s ability to focus and make
3
academic gains (Dryfoos, 2005). A community school is not just another program being
imposed on a school (Dryfoos, 2005). It is a way of thinking and working together for the
common good of all parties involved, and the children are at the center of all decisions (Harkavy
& Blank, 2002).
The school-community divide has been most severe in low-income and/or ethnic
minority communities, where trust-building and communication processes are often
compromised by social class and cultural differences (Abrams & Gibbs, 2000). In an effort to
ensure the success of students, it is imperative that schools and parents have a clear and
transparent line of communication; working together to educate the whole child both during and
after school hours. Researchers and educators have come to realize that the influence of the home
and community extends throughout their years of formal schooling and has an impact on their
learning and later life (Cairney, 2000). Community schools aim to not only improve academics
and heath, but to also strengthen the bond between the school and the community through the use
of strategic progamming. In addition to building relationships and partnerships, community
schools address severe issues, such as poverty. Community schools confront poverty and
education together by working in partnership with the community to bring critical resources into
the school in an integrated educational experience (Center et al., n.d.).
Community schools have taken various forms and depend greatly on the need of the
families and the community. There is no “right way” for community schools to look (Federation
of Community Schools, 2015). The most common form of a community school has been a public
school with a community school “hub,” providing various services for families and students
(Federation of Community Schools, 2015). Services include but are not limited: to medical,
4
dental, vision, before and after school tutoring, parenting classes, and financial literacy.
Although the model has varied from community to community, there are specific commonalities
among all community schools (Federation of Community Schools, 2015). Community schools
have a driving vision that all children should have equal access to a high quality education that
supports their academic, physical, social, and emotional development. This comes from an
alignment of strong schools working in partnership with community agencies that provide school
programming (Federation of Community Schools, 2015).
Urban school districts across the country have been committed to closing the
achievement gap among minorities and non-minority students and to improve student
achievement. The southern Education Foundation indicated that the state of the target district’s
student poverty rate was among the highest in the nation, represented by more than 60% of
PreK-12 public education students who are eligible for the federal free and reduced lunch
program (X Education Association [XEA], 2016). In 2012, a large urban school district in the
southern United States (henceforth referred to as LUS School District and LUS Community
School, to preserve anonymity) adopted the community school model in hopes of meeting state
standards, improving reading and mathematics scores, attendance, teacher retention, closing the
achievement gap, and strengthening the family unit while enriching the community (Santich &
Postal, 2011). Modeled after prestigious community schools in New York, the state’s school
financial stability plan included financial assistance of grant funding awarded by JP Morgan
Chase (Center for Community Schools and Child Welfare Innovation, 2016).
The first in the state, the community school in the LUS School District included services
such as extended hours, character development, parenting workshops, financial literacy
5
workshops, anger management, counseling, tutoring, and mental and physical healthcare
(Santich & Postal, 2011). It followed the state’s standards and has operated with highly effective,
certified teachers who have high expectations for their students (XEA, 2016). Since the
implementation of the community school practices in 2012, the community school’s overall
school grade has remained either at a B or a C (State Department of Education [SDOE], 2016).
Owens (2010) wrote that to ensure the success of all students and help build resilience in both
the parents and students, more school districts and stakeholders should strongly consider
adopting the community school model, as it is proven to be effective.
Statement of Problem
To date, no extensive research has been conducted that explores the effectiveness of the
community school practices and services used in a large urban school district in the southern
United States. In addition, there has been no extensive research conducted to examine the
effectiveness of the community school practices in a community school in a large urban school
district in comparison to high schools not using the community school practices in the same large
urban school district. These practices include medical, dental, and vision health care, before and
after school tutoring, mentoring, anger management, character development, counseling, job
coaching, and financial literacy. Local initiatives have used findings on community school
practices from various models around the nation as a blueprint for high performance.
Implementation grants have been awarded to start community school operations in several of the
state’s counties (XEA, 2016). Emerging community schools across the state include schools in
seven additional counties (Center for Community Schools and Child Welfare Innovation, 2016).
6
Through the data collection and analysis conducted in this study, strengths or deficiencies,
particularly in the category of student performance, were identified.
Purpose of Study
The purpose of this study was to investigate the impact of the community school
practices such as extended enrichment hours, character development, anger management,
counseling, tutoring and mental and physical healthcare on student performance at a community
school in a large urban school district in the southern United States. The researcher examined the
community school practices and services as they related to the effectiveness and impact on
student performance outcomes, in the categories of cumulative grade period average (GPA),
attendance, discipline, graduation rate, and industry certifications. Finally, the study was
intended to provide beneficial information for schools and stakeholders in similar southern
settings as they consider adopting community school practices.
Research Questions and Hypotheses
The following five questions were developed to guide this study:
1. What is the difference in cumulative grade point average (GPA) of the 2011-2012
senior cohort compared to the 2015-2016 senior cohort after the school’s transition to
a community school in a large urban school district in the southern United States?
H0: There is no significant difference in cumulative grade point average of the 2011-
2012 senior cohort as compared to the 2015-2016 senior cohort after the school’s
transition to a community school in a large urban school district in the southern
United States.
7
The dependent variable for this question was cumulative grade point average (GPA).
The independent variables for this question were traditional school and community
school.
The statistical tool for this question was an independent samples t test to test
statistical differences between the means of two groups.
2. What is the difference in attendance of the 2011-2012 senior cohort compared to the
2015-2016 senior cohort after the school’s transition to a community school in a large
urban school district in the southern United States and compared to similar high
schools in the same school district?
H0: There is no significant difference in attendance of the 2011-2012 senior cohort
compared to the 2015-2016 senior cohort after the school’s transition to a community
school in a large urban school district in the southern United States and compared to
similar high schools in the same school district and compared to similar high schools
in the same school district.
The dependent variable for this question was attendance. The independent variables
for this question were traditional school and community school.
The statistical tool for this question was an independent samples t test to test
statistical differences between the means of two groups.
3. What is the difference in the number of suspensions and length of suspensions of the
2011-2012 senior cohort compared to the 2015-2016 senior cohort after the school’s
transition to a community school in a large urban school district in the southern
United States and compared to similar high schools in the same school district?
8
H0: There is no significant in the number of suspensions and length of suspensions of
the 2011-2012 senior cohort compared to the 2015-2016 senior cohort after the
school’s transition to a community school in a large urban school district in the
southern United States and compared to similar high schools in the same school
district.
The dependent variable for this question was discipline. The independent variables
for this question were traditional school and community school.
The statistical tool for this question was an independent samples t test to test
statistical differences between the means of two groups.
4. What is the difference in the 2011-2012 graduation rate compared to the 2015-2016
graduation rate after the school’s transition to a community school in a large urban
school district in the southern United States and compared to similar high schools in
the same school district?
The dependent variable for this question was graduation rate. The independent
variables for this question were traditional school and community school.
Descriptive analysis was used to identity differences between the two groups.
5. What is the frequency distribution, by categories, of the 2011-2012 industry
certifications compared to the frequency distribution, by categories, of the 2015-2016
industry certifications after the school’s transition to a community school in a large
urban school district in the southern United States and compared to similar high
schools in the same school district?
9
The dependent variable for this question was industry certification. The independent
variables for this question were traditional school and community school.
Descriptive analysis was used to identity differences between the two groups.
Limitations
1. Students changing schools and/or transferring during the school year may have
impacted the collection and analysis of accurate student mobility data.
2. Split years of operation for the 2012-2013 and 2014-2015 school years were the result
of a community school opening in October, 2012 and a wellness cottage opening in
January, 2015. These split years may have served as a limitation in analyzing the
data.
3. Not all schools offer the same programs of study to students, (i.e. industry
certification programs and categories vary from school-to-school; High School B did
not offer industry certifications in 2011-2012).
4. The ability to compare data in the analysis was limited by conditions beyond the
researcher’s control, (e.g., split years, differing programs in schools, and reliability of
data provided by the LUS School District).
5. Between 2011 and 2016 there were changes in school leadership and school
personnel.
6. There was no access to discipline referral data at the school-level.
7. It was assumed that the data were accurately recorded and entered by school
attendance clerks.
10
8. The researcher was unable to cross-reference data received from the State Department
of Education and the LUS School District for compatibility and accuracy.
9. It was assumed that the data were accurately recorded and collected by the researcher.
Delimitations
The study was delimited to the graduating classes of 2012 and 2016 at a community
school in a large urban school district in the southern United States. The graduating class of 2012
were students at a school in the large urban school district prior to the full implementation of the
community school practices during their ninth, tenth, eleventh, and twelfth grades during the
school years of 2008-2009, 2009-2010, 2010-2011, 2011-2012. The graduating class of 2016
attended a community school in a large urban school district in the southern United States for
their ninth, tenth, eleventh, and twelfth grades during the school years of 2012-2013, 2013-2014,
and 2015-2016. The researcher delimited attendance to include the number of unexcused
absences for the graduating classes of 2012 and 2016.
For this study, discipline was delimited to the number of suspensions and length of
suspensions overall. The study was also delimited to the graduation rate for a community school
in a large urban school district pre-implementation of the community school practices for the
2011-2012 school year and post-implementation of the community school practices during the
2015-2016 school year. The researcher delimited the qualifying comparison schools to the
categories of school population, such as demographics, percentage of minority students, and
percentage of Limited English Proficiency/English Language Learners students; free and reduced
lunch rate, and Title I classification, which have been identified as High School A and High
School B. The comparison population and sample were delimited to the graduating class of 2012
11
and 2016 at qualifying comparison schools, which have been identified as Group 1 and Group 2.
The study was also delimited to the industry certification program(s) completion scores in
various categories for the graduating classes of 2012 and 2016.
Definition of Terms
For the purpose of this study, the following terms are defined:
Academic curriculum. For the purpose of this study, these services refer to extended-day
tutoring, postsecondary preparation, and financial literacy.
Adult services. For the purpose of this study these services refer to adult education,
English language education, financial literacy, parenting education, and real estate workshops.
Attendance. For the purpose of this study attendance is defined as the amount of days a
student is physically present in school out of 180 student days within the course of a given
school year.
Cohort graduation rate. “The percentage of students who graduated with a standard
diploma within four years of their initial enrollment in ninth grade in the district. Incoming
transfer students are included in the appropriate cohort based on their grade level and year of
entry. Deceased students and students who withdrew to attend school in another school system
that will culminate with a standard diploma are removed from the cohort” (SDOE, 2015, p.2).
Community school. “A community school is both a place and a set of partnerships
between the school and other community resources, which an integrated focus on academics,
health and social services, youth and community development and community engagement
aimed to improved student learning, stronger families and healthier communities” (Coalition for
Community Schools, 2016; Nicely, 2016).
12
Cumulative grade point average (GPA). A grading scale “used to determine if a student
has met the state high school graduation requirements of a minimum of 24 credits and a 2.0 GPA
based on a 4.0 scale. This grade point average is calculated as specified in Section 232.2463,
F.S., by assigned quality points of A= 4, B= 3, C= 2, D= 1, F= 0, Incomplete= 0 to the letter
grades displayed on the automated permanent record” (SDOE, 1992).
Full-Service Community School (FSCS). Federal program that “encourages coordination
of academic, social, and health service through partnerships among (1) public elementary and
secondary schools; (2) the schools’ local educational agencies (LEA); and (3) community-based
organizations, nonprofit organizations, and other public or private entities. FSCS provide
comprehensive academic, social, and health services for students, their family members, and
community members that will result in improved educational outcomes for children” (U.S.
Department of Education [USDOE], 2015).
Graduation rate. Federal regulations require each state to calculate a four-year adjusted
cohort graduation rate, which includes standard diplomas but excludes GEDs, both regular and
adult, and special diplomas. The target state’s graduation rate is a cohort graduation rate (SDOE,
2013).
Hub. - A place located centrally in a neighborhood or school which connects residents,
students, and their families to multiple services and resources and support within their
neighborhood (Federation of Community Schools, 2015).
Industry certification. - “A voluntary process through which students are accessed by an
independent, third-party certifying entity using predetermine standards for knowledge, skills, and
competencies, resulting in the award of a credential that is nationally recognized and must be at
13
least one of the following: a) within an industry that address a critical local or statewide
economic need; b) linked to an occupation that is included in the workforce system’s targeted
occupation list; or c) linked to an occupation that is identified as emerging (SDOE, 2015, para.
1).
Population. For the purpose of this study, the population refers to seniors attending a
community school in a large urban school district in the southern United States for the 2011-
2012 and 2015-2016 academic years.
Health services. For the purpose of this study, health services refers to medical, dental
and behavioral health services provided on-site for students attending a community school in a
large urban school district in the southern United States, which includes a clinic.
Social and emotional curriculum. For the purpose of this study, social and emotional
curriculum refers to character development, individual counseling, family counseling, financial
counseling and anger/stress management.
Socioeconomic status. “Socioeconomic status is commonly conceptualized as the social
standing or class of an individual or group” (American Psychological Association, 2014,
Socioeconomic Status section, para. 1). Socioeconomic status within a school system is typically
determined by the eligibility of the student to receive a free or reduced-price for lunch.”
Technical curriculum. For the purpose of this study, technical curriculum refers to job
coaching, professional development, and career readiness.
Whole-child approach. “This approach to education emphasizes the proposition that
education must move beyond preparing children to become “well-educated” citizens who are
productive participants in the economic system and society in general. This approach aims to
14
inspire children’s creativity, imagination, compassion, self-knowledge, social skills, and
emotional and physical health” (Kochhar-Bryant, 2010).
Wraparound services. – “Student and family supports integrated with and often delivered
directly within schools. Wraparound services help schools address social and non-academic
barriers to student learning” (Jones, n.d.).
Theoretical Framework
The theoretical framework supporting this research was the progressive education
movement with emphasis on the educational perspective of John Dewey. Dewey, a leader of the
progressive education movement in the U.S. has often been referred to as the “Father of
Progressive Education.” Educational reformers believed that education should reflect a child’s
living experience and that education should encompass more than academia (Rugg, Broudy, &
Broachers, 1960). Dewey promoted a balance of concern for the community and education, not
as two separate areas but as one unified entity (Luna, 2011; Nicely, 2016). Additionally, he
promoted purposeful connections between educational experiences and social life of the
community with an intense focus on a child-centered approach to education. This approach was
at the core of the Progressive Movement. Dewey (1897, 1900, 1902, 1916, 1920, 1938)
presented his theories on educational practices in a series of landmark texts focusing on
philosophy, experience, society, democracy and curriculum as they related to educating children.
Throughout his publications, there was a common theme of connections, partnerships and
providing holistic education opportunities to meet the needs of children in hopes of allowing
them to reach their fullest potential. In 1897, he defined his pedagogy, outlining his educational
beliefs:
15
I believe that much of present education fails because it neglects this fundamental
principle of the school as a form of community life. It conceives the school as a place
where certain information is to be given, where certain lessons are to be learned, or where
certain habits are to be formed. The value of these is conceived as lying largely in the
remote future; the child must do these things for the sake of something else he is to do;
they are mere preparation. As a result they do not become a part of the life experience of
the child and so are not truly educative (pp. 77-80).
Dewey outlined the concept of student-curriculum integration to promote “growth”
through the interconnectedness of all life’s activities (Dewey, 1920; Luna, 2011). This concept of
growth includes providing students with a rich educational experience that leaves them with the
capacity for even richer, larger, and deeper experiences (Dewey, 1938). Community schools
strive to promote Dewey’s vision of growth by providing students with a variety of academic and
non-academic resources. They have an integrated focus on academics, health, social services,
youth and community development and community engagement, all of which lead to improved
student learning, stronger families, and healthier communities (Coalition for Community
Schools, 2015). Additionally, community schools aim to create a personalized curriculum which
emphasizes real-world learning and community problem-solving (Nicely, 2016). Constructing an
array of services, community schools are able to support Dewey’s concept of a deeper
educational experience.
In discussing democracy and education in 1916, Dewey wrote “Education is the
formation of mind by setting up certain associations or connections of content by means of a
subject matter presented from without” (p. 69). Dewey explained that isolation and exclusiveness
16
brings an antisocial spirit into relief when one group fails to establish relationships with the
wider community. He believed that this form of isolation is found when schools are separated
from the interest of the home and the community (Dewey, 1902, 1916). Community schools
strive to bridge the gap between the home and the school while incorporating community
organizations. Like schools and classrooms, families can be understood as cultures in which
participants (family members) construct particular ways of acting, believing, and valuing through
the interactions among family members (Cairney, 2000). Community schools aim to explore all
cultures and service all aspects of the family, not just the student, in an effort to eliminate
isolation and promote inclusion through partnerships. Services such as adult education, first time
home buyer assistance, and food pantries are provided to assist the parents and family unit as a
whole. The resources provided at a community school depend greatly on the need of the parties
involved. Thus, supporting Dewey’s perspective of establishing connections of subject content
through the use internal subject matter”.
In his work, The School and Society, Dewey referenced the “ideal school” and the “ideal
home” and the importance of children having additional adult help beyond the household. He
wrote “The child must be brought in contact with more grown people and children in order that
they may be the freest and richest social life” (p. 52). In order to address this identified need one
popular strategy offered at most community schools is mentoring. In addition to more contact
with adults, the community school model provides more contact between children outside of the
classroom in an effort to equip them with the necessary skills that will transcend into adulthood.
Anger management, conflict resolution, and character development programs have been offered
at select community schools throughout the U.S. This emphasis on character development and
17
rational decision making has supported Dewey’s rationale in stressing the importance of more
interaction between children in order for them to be productive in society. In The School and
Society, Dewey also wrote:
A society is a number of people held together because they are working along common
lines in a common spirit, and with reference to common aims. The radical reason that the
present school cannot organize itself as a natural social unit is because just this element
of common and productive active (pp. 27-28).
With the driving characteristic of collaboration, community schools are able to address
Dewey’s concerns of commonality and organization as a social unit. Community schools of
various models have shared four overarching characteristics. According to the National Center
for Community Schools (2015), they are: (a) comprehensive, (b) collaborative, (c) coherent, and
(d) committed. Through the use of strategic planning, effective communication and
collaboration, community schools are able to expand upon the philosophy of John Dewey in the
21st Century.
Overview of Methodology
Research Design
To answer Research Questions 1-5, a quantitative research study design was used. A
quantitative research design was selected because it aims to determine the impact of an
intervention or program on a specific, targeted non-random population. For the purpose of this
study, the intervention was the community school practices. The comparison groups were
selected based on similarity in percentage of minority students, free and reduced lunch rate, and
Title I classification.
18
Population and Sample
The population and sample for this study consisted of 405 students classified as seniors
for the 2011-2012 academic year and 515 students classified as seniors for the 2015-2016
academic year attending a community school in a large urban school district in the southern
United States, referred to as the LUS School District. The comparative population and sample
groups, Group 1 and Group 2, for this study consisted of all students classified as seniors for the
2011-2012 and 2015-2016 academic years attending like high schools, High School A and High
School B, in the LUS School District. The sample for High School A/Group 1 consisted of 369
students classified as seniors for the 2011-2012 academic year and 541 students classified as
seniors for the 2015-2016 academic year. The sample for High School B/Group 2 consisted of
143 students classified as seniors for the 2011-2012 academic year and 148 students classified as
seniors for the 2015-2016 school year. Comparison schools were selected by the researcher as
like high schools according to similarity in school population, (i.e., demographics, percentage of
minority students, and percentage of Limited English Proficiency/English Language Learners
students; free and reduced lunch rate, and Title I classification).
Data Collection and Analysis
Data were obtained from the LUS School District and the State Department of Education
to identify students classified as seniors for the 2011-2012 and 2015-2016 academic years. Data
were also obtained to determine students from like high schools classified as seniors for the
2011-2012 and 2015-2016 academic school years. The student information service database from
the LUS School District provided data pertaining to these students regarding cumulative grade
point average (GPA), attendance, and suspensions. The researcher used the State Department of
19
Education’s information service database to compile and analyze graduation rates of the
community school in the LUS School District and like high schools for the following years:
2011-2012 and 2015-2016.
An independent samples t test was a part of the research design, as it was the statistical
test used to determine whether there was: (a) a significant difference in cumulative grade point
average (GPA) of the 2011-2012 senior cohort at a traditional high school compared to the 2015-
2016 senior cohort after the school’s transition to a community school in the LUS School District
and compared to similar high schools the same school district, (b) a significant difference in
attendance of the 2011-2012 senior cohort compared to 2015-2016 senior cohort at community
school in the LUS School District and compared to similar high schools the same school district,
and (c) a significant difference in the number of suspensions and length of suspensions of the
2011-2012 senior cohort compared to the 2015-2016 senior cohort at a community school in the
LUS School District and compared to similar high schools the same school district. Analysis of
descriptive statistics was used to determine whether there was: (d) a significant difference in the
2011-2012 graduation rate compared to the 2015-2016 graduation rate after the school’s
transition to a community school in the LUS School District compared to similar high schools in
the district, and (e) a significant different in the frequency distribution by categories of the 2011-
2012 industry certification compared to the frequency distribution by categories of the 2015-
2016 industry certification after the school’s transition to a community school in the LUS School
District and compared to similar high schools in the same school district.
20
Organization of the Study
The report of the present research has been organized into five chapters. Chapter 1
provides a brief overview of the goal and practices of community schools, purpose of study,
statement of problem, research questions, limitations, delimitations, definition of terms,
theoretical framework, and overview of methodology. Chapter 2 provides an overview of urban
education, relationships within community schools, and student self-improvement within
community schools. Chapter 3 contains a description of the sample, the methodology, and the
analytical approach used to conduct this study. The research findings obtained from data analysis
in response to the research questions constructed to guide this study are presented in Chapter 4.
Finally, the findings of the research are discussed in Chapter 5 along with implications of the
research and recommendations for future research.
21
CHAPTER 2
REVIEW OF LITERATURE
Introduction
In this review of the literature, the researcher sought to provide a holistic perspective
encompassing the many dimensions that must be considered by community schools as they
implement their policies and practices in urban settings. The literature reviewed necessarily
focused on a number of variables that must be considered by community schools, and much of
the available research on community schools was provided through publications, presentations
and program evaluation reports from organizations associated with the development and
operation of community schools in urban settings.
To provide a more holistic perspective, the review of the literature has been organized to
address initially the environmental and organizational structure of community schools. This
initial major section is comprised of eight distinct sub-sections and begins with a brief overview
of ecological systems theory and community schools as open systems. Racial integration and
student achievement along with school zoning, school choice and student achievement are also
discussed as they relate to the goals of community schools. A review of literature related to
student performance, teaching, and discipline, specifically in urban schools, served to narrow the
focus in discussing the environment and organizational structure of community schools.
A second major section of the literature review was concentrated on relationships that are
essential to successful community schools. These include school-community relationships,
parent-school relationships, and parent-child relationships.
The final major section of the literature review includes a discussion of the impact that
community schools can have on students’ overall development. Maslow’s hierarchy of needs is
22
considered in examining students’ development in terms of their mental, emotional, and physical
health self-improvement. The articles reviewed and information presented provided effective
strategies for improving urban school districts through the implementation of community school
practices/programs.
Community Schools and Environmental & Organizational Structure Within Urban Education
Ecological Systems Theory
There are many different interpretations of the word “urban.” Some may view it as a
culture as it relates to Hip Hop and/or fashion, although many view it to be synonymous with the
African American race. Others may view it as an overall lifestyle. However, in regard to
education, urban is more expansive, often being used to describe schools with a high minority
student population from less affluent backgrounds and/or students who live in inner-city
impoverished neighborhoods (Noguera, 2003). Additionally, Gallagher, Goodyear, Brewer and
Rueda (2012), explained that in an educational context, urban usually refers to areas that are
“perceived as the site of social problems” (p. 271). To understand the impact that urban
education has on student success, it is important to understand that there are several factors that
impact a child’s education outside of the classroom. The human ecology theory, also known as
ecological systems theory, was developed by Bronfenbrenner (1979). It describes how various
layers of the environment interact and how the interactive relationship between individuals and
their social environment impact a child’s success (Santiago, Ferrara, & Quinn, 2012). Resources
and services offered at a community school are greatly influenced by the environment, and the
environment impacts a child’s ability to succeed. The ecological perspective and model provides
23
a solid framework for understanding the inputs and characteristics that influence student
outcomes.
A microsystem is a pattern of activities, social roles, and settings that have immediate
impact on a child (Brofenbenner, 1979). This system includes the family, classroom, or peer
group (Santiago et al., 2012). The mesosystem consists of connections and processes taking
place between two or more settings containing the child, (e.g., the relationship between home-
school and family-neighborhood (Brofenbenner, 1979). The exosystem consists of connections
and processes, the settings of power taking place between two or more settings, at least one of
which does not contain the child, but in which events occur that indirectly influence processes
within the immediate setting of the child’s life (Brofenbenner, 1979). Settings of power are those
in which the participants control the allocation of resources and make decisions affecting what
happens in other settings (Brofenbenner, 1979, p. 255). The exosystem includes the school
district and state education departments (Santiago et al., 2012). The outermost layer, the
macrosystem, is the overarching pattern of micro-, meso-, and the exosystems characteristics of a
given culture or subculture with particular reference to the belief systems, bodies of knowledge,
material resources, customs, lifestyles, opportunity structures, hazards that impacts a child’s
development (Brofenbenner, 1979).
Taking into account the many layers that impact a child’s development as outlined by
Brofenbenner (1979), educating a child and planning for a child’s full development extends
beyond the classroom. “The underlying assumptions of an ‘education ecosystem’ is that any of
these environmental layers will positively or adversely impact the child’s growth, and
development as they directly or indirectly interact with one another” (Santiago et al., 2012, p. 3).
24
Urban schools must do a better job of educating inner-city children and explore all aspects of the
child’s life (Warren, 2005). While various educational reform movements and efforts have been
made to address issues such as poverty, community schools have emerged as a promising reform
effort to tackle these issues at the core (Santiago et al., 2012).
Community Schools as Open-Systems
Open systems theory deals with the impact and influence that a given environment has on
an organization. According to the open systems theory, systems can be divided into two main
classes: open systems, which interact with their environments, and closed systems, which do not
interact with their environments (Owens & Valesky, 2015, p.100). In all aspects, community
schools are open systems and rely a great deal on the services and partnerships of community
organizations and agencies. Open-systems contain five basic elements: inputs, transformation
process, outputs, feedback, and the environment (Lunenburg, 2010).
The community school model relies heavily on inputs in the form of partnerships. Inputs
include but are not limited to: physical, medical, dental health care providers, counseling, and
family and community engagement activities. Each community school has a lead agency as a
partner which contributes to the inputs (Federation of Community Schools, 2015). The inputs are
the core of the community school model, practices, and results. The transformation process
includes the internal operation of the organization and its systems of operational management
(Lunenburg, 2010). The community school coordinator and community school director are a
critical part of the transformation process. The community school coordinator is responsible for
creating, strengthening, and maintaining the bridge between the school and the community
(Coalition for Community Schools, 2015).
25
In an effort to uphold the vision and mission of community schools, it is imperative that
all parties involved keep a clear line of communication. In social systems, outputs are the
attainment of goals and objectives of the school and are represented by the products, results,
outcomes, or accomplishments of the system (Lunenburg, 2010). Outputs vary from school to
school and depend greatly on the demographics and needs of the students, families, and
communities being served. The U.S. is considered to be a “melting pot”, which impacts the
nation’s school systems by enrolling immigrant students speaking various languages and
practicing various customs. Although outputs depend greatly on the specific needs of the families
and communities being served, these outputs have been proven effective. Axelroth (2009) noted
that community schools across the nation were making great strides to increase student success,
community resources, and family engagement (Griswold, 2014). Additionally, research
conducted by the Coalition of Community Schools (2015) showed that community schools
across the nation have made tremendous student performance gains in reading, mathematics, and
adequate yearly progress (AYP).
Hattie (2009) observed that the most powerful single influence enhancing achievement
was feedback. Feedback is a critical part of the success of the community school operation.
Though the needs of students are significant, community schools also value feedback regarding
the needs of parents as well. The steady rise in single-parent households leaves many families
too overwhelmed to participate fully in their children’s learning and development (Children’s
Home Society, n.d.). Though the inputs are the core of the community school model, the
environment greatly impacts the inputs to be implemented. The community school framework
uses real-world learning and specialized curriculum to prepare students to be productive citizens
26
in their environment (Coalition of Community Schools, 2015). Children cannot learn well if they
lack adequate housing, health care, nutrition, and safe and secure environments or if their parents
are experiencing stress because of their low wages and insecure employment (Warren, 2005).
According to Owens and Valesky (2015), organizations that deal successfully with uncertain
environments have tended to differentiate internally more than less successful organizations, yet
they have been able to maintain high levels of integration between the various units.
Racial Integration and Student Achievement
In regard to education, the human ecology theory deals with the various layers of a
student’s life that impacts his/her success, particularly the environment that the student resides
in. Students living in poverty stricken environments may not have access to support services,
safe environments, high performing schools, and exposure to diversity. This lack of access and
exposure creates segregation of this select population of students. The concept of racial
integration is one that is not new to the U.S. and over the course of more than 100 years has
impacted the nation’s public schools drastically. Through various events, federal regulations, and
passionate protestors, public schools have made great strides in racial integration. As one views
public schools across the U.S., it is possible to look through the window of a classroom and see
White and Black students learning together, Asian and Hispanic students playing on the
playground together. This “melting pot” fosters a very rich diversity and vital exposure for
students. What is seen in schools in today parallels what Dr. Martin Luther King Jr. visualized in
his 1968 “I Have A Dream” speech. Dr. King visualized a world where little black boys and
black girls would be able to join hands with little white boys and white girls as sisters and
brothers (King, 1963). Though it appears that schools have substantially moved toward racial
27
integration, it is important to retrace the journey of racial integration over the course of the last
100 years as a foundational understanding and background of things that impact urban education,
such as inequitable funding policies and high-minority rate schools.
At the start of the 20th century, there was an emergence of Black intellectuals such as
William Edward Burghardt DuBois, Booker T. Washington, and Zora Neale Hurston (Doaks,
2014). Though so much emphasis was being placed on the socioeconomic and achievement gap
between Whites and Blacks, these intellectuals shed light on the misinterpretation and the true
intelligence of Black people. In The Talented Tenth, DuBois prescribed that:
The Negro race, like all races, is going to be saved by its exceptional men. The problem
of education, then, among Negroes must first of all deal with the Talented Tenth: it is the
problem of developing the Best of this race that they may guide the mass away from the
contamination and death of the Worst, in their own and other races (DuBois, par. 1).
DuBois’s essay would passionately lay out what he perceived to be the problems of the Negro
and his firm and detailed suggestions for how to solve them, education being the key component
of that solution (King, 2013).
Arguably, the Supreme Court’s most important case involving K-12 education, Brown v.
Board of Education, Topeka I (Brown I) ruled that separate but equal public schools were
unconstitutional (Russo, 2004; Doaks, 2014; Momeni, 2015). This case challenged racial
segregation in K-12 schools and the outcome was a victory in the battle of equal education for all
students (Russo, 2004). This case laid the foundation for public schools across the U.S. moving
toward racial integration. When discussing racial integration, it is important to understand the
significance of this case. Following the Brown v. Board of Education Topeka, Title VI of the
28
Civil Rights Act of 1964 established protection of people from discrimination based on race,
color, or national origin in programs or activities that receive federal financial assistance (Russo,
2004). Throughout the U.S., many school districts and non-minority families were not satisfied
with the desegregation regulations and met them with great resistance. In an effort to ensure the
proper methods to end desegregation, Brown v. Board of Education, Topeka II (Brown II),
directed school officials to act “with all deliberate speed” in implementing its mandate to provide
equal educational opportunities for all children regardless of race (Russo, 2004).
Beginning in the 1980s, one southern state took legal action to ensure that racial
integration was effectively implemented throughout its school districts. Each school district has
been required to comply with the State Educational Equity Act to ensure equality for all students.
The State Educational Equity Act (XEEA) prohibited:
. . . Discrimination on the basis of race, ethnicity, national origin, gender, disability, or
marital status against a student or an employee in the state system of public K-20
education is prohibited. No person in this state shall, on the basis of race, ethnicity,
national origin, gender, disability, or marital status, be excluded from participation in, be
denied the benefits of, or be subjected to discrimination under any public K-20 education
program or activity, or in any employment conditions or practices, conducted by a public
educational institution that receives or benefits from federal or state financial assistance
(State Statute, 2015).
Although the southern state has implemented federal legislation such as the XEEA to
eliminate discrimination, there was, at the time of this study, legislation pending that could
possibly move public schools in the southern state away from racial integration. The proposed
29
legislation, the controlled open enrollment plan, would allow school districts to make student
school assignments using parents’ indicated preferential school choice as a significant factor
(XDOE, 2016). The State Department of Education indicated that controlled open enrollment
emphasizes the value of opportunities for families to choose among existing public schools instead of
being assigned, based on attendance zones, to a public school by a school district. Though this piece
of legislation would present parents with more flexibility and options, it is important to explore the
terms of the legislation. In one example, if a school has not reached capacity, a student would be able
to attend a specific school regardless of zoning and physical living address. This option does not take
into consideration low-income students living in poverty. To take advantage of this option students
would need to independently access transportation. For students living in poverty, whose parents may
be single parents and not have the financial means to provide transportation for them to attend school
across town, this new option is really not an option for them at all.
School Zoning, School Choice, and Student Achievement
Some have questioned the reality of racial integration. One of the skeptics, Clotfelter
(2004), expressed the view that zoning, school choice, and school classification may be moving
public schools away from racial integration. Rothstein (2013) wrote that segregation was locked
in place by exclusionary zoning laws in suburbs where black families once could have afforded
to move in the absence of official segregation but can afford to do so no longer, given
appreciated property values. Schools receive funding from property taxes, and there is a large
disparity in the amount of revenue generated from low-income and more affluent areas. This
diminishes the quality of education available to children living in low income communities.
30
Fully integrated public schools, according to Rothstein (2013), require housing desegregation, as
students are required to attend schools for which they are zoned.
Additionally, many of the schools in low-income areas with a large population of
minority students have been classified as Title I schools, and funding has often been limited at
Title I schools, ultimately impacting the rigor of academics. Research conducted by the USDOE
revealed that more than 40% of schools receiving federal Title I money to serve disadvantaged
students spent less state and local money on teachers and other personnel than schools that did
not receive Title I money at the same grade level in the same district (USDOE, 2011). Rothstein
(2013) observed that because of limited funds and ineffective personnel, students attending these
schools have been deprived of an adequate education, thus, moving schools further away from
racial integration. When a school has a large proportion of students at risk of failure, the
consequences of disadvantage are exacerbated. Remediation becomes the norm, and teachers
have little time to challenge students to overcome personal, family, and community hardships
that typically interfere with learning (Rothstein, 2013). Prior to the ruling of Brown v. Board of
Education, minority students were isolated to particular schools and White students attended
another school with more resources and a better quality of education. With zoning regulations
and the demographics of Title I schools, the lack of funding and resources available for these
schools, one may argue that there is retrogression to the pre Brown v. Board of Education era.
Presently, students and parents have a wide variety of choice in regard to academic
attainment due to the increase in voucher programs, charter schools, and magnet programs.
Voucher programs provide students who are financially disadvantaged with the opportunity to
attend a private school, but they are not designed to promote school diversity by race, SES, or
31
ability (McKnight, 2011). Most school vouchers are targeted at low-income students in urban
schools, those attending failing schools, or students with disabilities (Mickelson, Bottia, &
Southworth, 2008). In one southern state, the percentage of Black voucher recipients was much
higher than the percentage of Blacks in the overall state population (Mickelson et al., 2008).
Though state legislators may believe that this creates racial integration in schools, it has the
potential to put students receiving vouchers at a disadvantage. In research conducted by the
National Center for Education Statistics [NCES] (2006), it was outlined that “In 2003, Black
students were more likely to be enrolled in chosen public schools, and non-poor students were
more likely than poor or near-poor students to be enrolled in non-church-related private schools
(p. iv). Students who receive vouchers to attend private schools may be placed at a
disadvantaged and not be able to keep up with the academics. As a result, voucher students could
be at a greater disadvantage in the new school setting, allowing the opportunity for isolation to
occur through the use of labeling and achievement level (McKnight, 2011).
In addition to voucher programs, there has been a rise in the number of charter schools
across the U.S. According to NCES (2014), between 2004 and 2014, the percentage of public
school students attending public charter school increased from 2% to 5%. Charter schools
provide the opportunity for schools to operate independently but still receive public funding and
operate under the public school umbrella. Charter schools in most states enroll disproportionately
high percentages of minority students (Mickelson et al., 2008), and this does not create an
environment that fully promotes racial integration. Additionally, research conducted by NICHE
(2017), displayed that, when compared to non-charter public schools, charter schools had the
highest percentage of students eligible for free and reduced lunch.
32
Magnet schools are another increasingly common choice option for students. Magnet
programs provide students the opportunity to engage in intensive study in specific areas. The
designs of magnet schools are central to whether they promote diversity or continue to
resegregate by race and SES. Many magnet schools were designed to voluntarily desegregate
schools through “controlled choice” (Mickelson et al., 2008, p. 4). Though the goal of many
magnet programs is to voluntarily desegregate schools, the placement of many magnet programs
moves public schools away from racial integration. For example, an urban high school located in
one southern state has one of the top medical magnet programs in the state. The program has
special partnerships with the University of Central Florida’s Health Leaders Program, FSU
SSTRIDE Program, and Orlando Tech Dual Enrollment (LUS School District, 2016). However,
the urban high school has a 99% minority rate, Title I classification with 82% of the student
population classified as economically disadvantaged, receiving free and reduced lunch (SDOE,
2015). Due to the negative stereotypes of high minority schools and myths regarding poverty and
culture, this may negatively impact the appeal of the magnet program to non-minority, more
affluent parents and students (Gorski, 2008). Community schools aim to make schools serving
the most vulnerable population appealing to all.
Poverty and Urban Education
Urban schools are most likely to have students living in poverty and a high number of
students receiving free and reduced lunch (Lipman, Burns, & McArthur, 1996). The impact that
poverty has on a student’s educational attainment and success has been significant (Greever,
2014). Arguably, the strongest links to student performance are poverty and socioeconomic
status (SES). Children from low-income environments are at risk of reading difficulties, acquire
33
language skills more slowly, and exhibit delayed letter recognition and phonological awareness
(Aiken & Barbarin, 2008). Ravitch (2013) explained that for students living in poverty the
achievement gap begins to widen on the first day of kindergarten. “Black and Hispanic students
who attend high-poverty, racially isolated schools have serious problems” (Ravitch, 2013, p. 81).
Community schools throughout the U.S. have recognized the impact that poverty has on a
student’s ability to succeed and have taken great measures to address this problem at its core.
Children of color and their families have long been disproportionately represented in
urban areas with less resources, high unemployment rates, crime, violence which isolates certain
families and makes it very hard for them to escape poverty (A Broader, Bolder Approach, n.d.).
Typically, an urban school is located in a community where support and resources are needed
and where school employees and personnel rarely know neighborhood residents (Smiley, Drake,
& Sheehy, 2010), thereby making the stressors that these students face difficult for outside
influences to understand. A child’s motivation and learning increases when a child spends time
in a safe environment with structured enrichment opportunities (Blank & Berg, 2006). Compared
to more affluent suburban areas, urban areas and urban schools are typically underfunded, and
this greatly impacts students (Warren, 2005). Students from low-socioeconomic backgrounds are
less likely to attend college than high-income children (Shi, 2014). Additionally, students living
in urban, poverty stricken areas are less likely to have access to nutritious food, and this impacts
their academic functioning and academic achievement (Pungello, Iruka, Dotter, Mills-Koonce, &
Reznick, 2009).
In addition to academic performance, poverty impacts a child’s behavior. Pharrington and
Lober (2000) suggested that a major contributing factor to juvenile violence is poverty. Students
34
residing in urban high poverty areas have a greater likelihood of being exposed to crime and
negative influences during their out-of-school time than do their peers residing in more affluent
areas. Poverty has been founded to be closely associated with attention deficits issues,
hyperactivity, and impulsivity (Pharrington & Lober, 2000). The goal and efforts of school
should be to focus on reducing the causes of student’s disengagement from school which often
stems partly from their lack of preparation for school due to a lack of resources (Ravitch, 2013).
Dryfoos et al. wrote in 2005 that most of the Children’s Aid Society (CAS) community schools
were located in low-income neighborhoods. In 2016, community schools can be found across the
country. Center et al. (n.d.) observed that though there is no specific formula, community schools
are all founded on the understanding that poverty creates barriers to learning that schools cannot
ignore if all students are to have the same chance at success (Center et al., n.d.).
Student Performance in Urban Schools
Research conducted by Lippman et al. (1996) provided that on average, urban schools
have larger enrollment numbers and class sizes than suburban or rural schools, and this impacts
students’ opportunities for more individualized instruction and academic success. However, the
review of more recent literature revealed that enrollment numbers in urban schools have actually
declined and student performance has been impacted due to the lack of per pupil funding and
fewer resources (Gehring, 2005; Rich, 2012). Numerous researchers have argued that the
achievement gap opens well before entrance to structured schools, as many students enter school
unable to recite and understand basic age appropriate competencies (Center et al., n.d.).
Additionally, many students attending urban schools have fallen behind due to inadequate
education once in school. Low-income youth residing in urban areas typically end up in schools
35
with fewer resources, use outdated textbooks and suffer from a lack of educational technology,
all limiting their possibilities to academically advance as smoothly as their affluent peers (Center
et al., n.d.). The achievement gap widens and student performance decreases due to the lack of
needed supplemental assistance available to low-income students (Center et al., n.d.).
Failing and repeating grades, dropping out of school, being left behind, and not
performing at the expected grade level have become the norm in many schools across the
country, particularly in urban areas (Naiditch, n.d.). According to Gallagher et al. (2012), many
youth face difficultly in their performance due to their disengagement from the material and lack
of educational goals. These researchers have suggested that when students are disengaged, they:
“a) withdraw both socially and emotionally from the school climate, b) interact minimally with
others, c) fail to find their niche in the academic system, and d) do not develop adequate levels of
commitment to the institution of learning” (Gallagher et al., 2012, p. 288). Students attending
urban schools are more likely to be absent more days throughout the school year than students
attending suburban and rural schools (Lippman et al., 1996), and this impacts the cognitive
process and mastery. Too often, schools and teachers are inadequately prepared for the social,
political, and economic conditions impacting the lives of their urban students, families, and
communities, and this impacts students’ performance (Noel, 2010).
Another issue impacting student performance in urban areas is student mobility. Closing
the achievement gap is central to improving social mobility and increasing educational
opportunities (Anderson & Emig, 2014). Students with a low-socioeconomic status experience
student mobility at very high rates (Temple & Reynolds, 2000). Student mobility impacts
academic performance by delaying learning and decreasing mathematics and reading
36
achievement levels (Maxwell, 2008). Additionally, students with high mobility rates have been
found to have a high number of days absent, lower scores on criterion and norm referenced tests,
and an increased chance of grade retention (Ingersoll, Scamman, & Eckerling, 1989). High
mobility rates have a greater impact on Black and Hispanic students (Felner, Primavera, &
Cauce, 1981). Although this depends greatly on the environment in which students reside as well
as their socioeconomic status, the quality of education received at schools greatly impacts
students’ performance as well.
Center et al. (n.d.) discussed the inevitability of a stratified society when children from
low-income impoverished communities grow, and their achievement gaps turn into opportunity
gaps. These researchers observed that the vast majority of today’s low-income children will
become tomorrow’s low-income adults, perpetuating the country’s seemingly unbreakable cycle
of poverty. Evaluation data from organizations such as the Academy for Educational
Development, the Stanford Research Institute, and the Chapin Hall Centers for Children
demonstrate the positive impact of community schools on student learning, student performance,
and healthy youth development (Harkavy & Blank, 2002). Harkavy and Blank also found that
students who attended community schools were more aware of the services they needed to be
successful when compared to those students who attended low performing schools in poor
neighborhoods, and this knowledge can contribute to their overall success and academic
autonomy.
Teaching in Urban Schools
Warren and Lessner wrote in 2014 that placing the priority of teacher content knowledge
and credentials above the ability to create a classroom environment that values individual student
37
differences must be revisited. Urban schools with a high population of low-income students,
often referred to as hard-to-staff schools, are often taught by the least effective and least
experienced teachers (Borman & Dowling, 2008). In addition to the current staff of teachers,
recruiting new teachers to urban high-poverty schools is often impossible for some school
districts (Ingersoll & May, 2011). In an effort to recruit and retain highly-qualified and highly-
effective teachers in high-poverty urban schools, many school districts offer stipends as
incentives. For example, the LUS School District discussed in this study provides teachers with a
$1,500 stipend to work at select Title I schools in an effort to make these select schools more
appealing and teachers working in select Title I schools are eligible for student loan forgiveness
with a select number of years of service. Additionally, in 2017, in the same school district at one
select Title I middle school, $20,000 bonuses were offered to recruit highly effective teachers.
However, one may argue that this method attracts teachers who are in need of additional funds
and do not necessarily have the best interests of students in mind. One may also argue that
teachers attracted to working in Title I schools are especially dedicated and the stipends are spent
on providing materials and resources for their students. Rochkind, Ott, Immerwahr, Doble, &
Johnson (2007) reported findings from a poll conducted by the Public Agenda Foundation that a
very low percentage of teachers were attracted to high-needs schools for higher salaries. Instead,
they desired autonomy, support from administration, and supplemental enrichment
materials/programs.
On average, high poverty schools in urban areas lose roughly 20% of their faculty each
year (Ingersoll, 2004). The teacher turnover rate in these schools can often be attributed to
geographical location and salary; and researchers have found that teachers in low-income, high-
38
minority schools are more likely to leave than their colleagues at more affluent schools with
high-achieving students (Scafidi, Sjoquist, & Stinebrickner, 2007). According to Darling-
Hammond (2010), students in U.S. schools typically “see nearly twice as many teachers over the
course of their careers as those in many other countries” (p. 63). Also, teacher absenteeism has
been found to be higher in urban schools than in suburban and rural schools (Lippman et al.,
1996). This can negatively impact the student-teacher relationship. Additionally, high teacher
turnover rates and absenteeism from year to year disrupts the cycle of instruction. Guin (2004)
explained that the revolving door of personnel and different teacher strategies and methods
results in “less comprehensive and unified instructional programs” (p. 19) for students, and this
directly impacts their learning and progression. Overall, this inability to sustain consistency
among faculty interferes with the ability to develop trusting and healthy relationships that are
essential to building a positive school culture and norms.
Teacher retention is an issue within schools in urban areas, and many school districts
have been doing their best to address this problem. However, it is imperative that institutions of
higher education do their part in their teacher preparation programs and equip each new
generation of teachers with the necessary skill set and pedagogy to be successful in any
educational setting. Collaboration is particularly important in teacher education programs
committed to preparing high-quality teachers for urban schools (Smiley et al., 2010). Classroom
teachers who allow students to act, think, speak, and perform in their own various social
identities, without judgment, create the atmosphere for high-quality student-teacher interactions
(Warren & Lessner, 2014). Schools cannot teach children well if teachers lack an understanding
of their students’ cultures and lives (Warren, 2005). Culturally, competent adults in the lives of
39
children and youth exercise a major influence on a youth’s cultural attitudes and development
(Gallagher et al., 2012). Students living in high poverty areas face various stressors that may be
“foreign” to many people. It is imperative that teachers working in these areas gain an
understanding of different cultural dynamics in an effort to serve this underserved population of
students. Cultural responsive pedagogy is:
An educational approach that suggest that curriculum, teaching, and interpersonal
interactions in the educational process should be able to respond to the social and cultural
contexts of learners and connect learners’ cultural background and life experiences with
the learning they are now receiving (Wu, 2016, p. 178).
Culturally responsive teaching allows teachers and students to reject the status quo, promotes
diversity, increases student motivation and self-identity, and strengthens student-teacher
relationships (Ebersole, Kannahele-Mossman, & Kawakami, 2016).
Another key benefit of cultural responsive pedagogy is that it provides teachers with the
opportunity to be open-minded and challenges their views on different cultures, races, and
individuals living in circumstances that are different from their own. Many urban teachers hold
deficit views of low-income parents and students of color; that is, they hold them in disdain (or
pity them as victims), seeing them as part of the problem (Warren, 2005). The quality, or
efficacy, of student-teacher interactions supports the production of positive academic and social
outcomes for students of color (Warren & Lessner, 2014). Payne has created a framework for
understanding poverty as it pertains to education. Payne (2005) wrote, “Educators have
tremendous opportunities to influence some of the non-financial resources that make such a
difference in student’s lives. For example, it costs nothing to be an appropriate role model” (p.
40
25). In an effort to help educators understand poverty, Payne also explained that there are hidden
rules among classes and understanding these rules allows educators to better understand students
living in low-income settings. For example, the impoverished class believes that education is
“valued and revered as abstract but not as reality” (Payne, 2005, p. 42), but the wealthy class
believes that education is a “necessary tradition for making and maintaining connections” (p.
43). Teachers working in urban school settings are exposed to various cultural differences that
force paradigm shifts and foster cultural responsive pedagogy which has the opportunity to
impact teacher quality. However, researchers, over the course of several decades, have suggested
that teacher quality is not fairly distributed in high-minority/poor schools when compared to
more affluent schools due to a high volume of inexperience teachers, out-of-field teachers, and
uncertified teachers (Haycock & Crawford, 2008). To address this problem, Haycock and
Crawford (2008) reported the efforts that various school districts are making to ensure that high-
minority schools and poor students receive quality instruction through the use of extensive
professional development.
Gallagher et al. (2012), described their model for leading in urban education settings.
They outlined the following 10 strategies for improving teacher quality in urban school districts:
1. Expand the talent pipeline to seek out top teacher and principal talent.
2. Strengthen screening for the selection of new teachers and give school sites more
autonomy to hire teachers who fit the school’s instructional vision.
3. Place top talent in high-needs schools.
4. Develop new intensive induction and mentoring programs for teachers.
5. Provide high-quality professional development on an ongoing basis.
41
6. Have a strong evaluation system to measure teacher performance.
7. Manage teacher performance to improve teacher quality and student achievement.
8. Reward, promote, and retain effective teachers and principals.
9. Restructure human resource departments to manage human capital strategically so as
to hire and support teachers, provide professional development, collect data, and
ensure accountability--all focused on improving student achievement.
10. Implement a relevant, comprehensive, and easy-to-use data system (p. 247).
In an effort to educate the whole child, community schools have shown promising
perspectives regarding teaching at a community school. Ediger (2004) explained that teachers in
community schools say they have more time to work with students outside of the limited school
time and are provided with opportunities to interact with parents outside of the standard parent-
teacher conference. Research gathered by Quinn and Dryfoos (2009) revealed that teachers in
well-developed community schools typically reported the following benefits: (a) more children
enter school ready to learn, (b) students attend school more regularly and move less often, (c)
parents are more involved in their children’s education (at home and at school), (d) students have
access to health care, (e) students have greater access to extended learning opportunities, and (f)
community support for public schools is enhanced through active community involvement.
Community schools provide the opportunity for teachers to better understand their students both
inside and outside of the classroom (Cairney, 2000). Blank, Jacobson, and Pearson (2009)
suggested that in practice, a community school is a place where students are ready to learn and
teachers are free to teach. Beers et al. (1953) suggested that the professional staff of a community
school possesses, as a group, the following competencies: a point of view which merges living
42
and learning, a sensitivity to social problems and trends, and the ability to live and work with
others. They also need to have knowledge of the community and of techniques for studying the
community, a breadth of interest and educational preparation, physical health and emotional
stability, ability to know what is known, knowledge of children and youth, flexibility, and faith
in people. Additionally, community schools foster relational trust by allowing all stakeholders,
including teachers a shared voice, recognizing every the ability to lead of all school personnel
(Coalition for Community Schools, 2017).
Teachers working in urban schools may also face changes in the school structure and
requirements in an effort to increase student performance, such as a change in administration and
the fear of losing their jobs to a new set of “fresh” teachers and administrators. The No Child
Left Behind Act of 2001 (NCLB), which was replaced by Every Student Succeeds Act (ESSA),
made a strong push for accountability (Luna, 2011). NCLB provided that schools would be held
more accountable for student achievement levels and performance. When schools fail to make
adequate yearly process (AYP), it is the school district’s responsibility to provide support and
assistance to the schools. With the implementation ESSA community schools have been working
to support various provisions of the act. According to the Coalition for Community Schools
(2017), the “school quality indictor for state accountability systems (Title I)” is supported
through the following components: student-centered, powerful learning, integrated health, and
social supports (p.13).
In addition to district support, many schools are provided assistance with federal funding
to increase student performance. School Improvement Grants (SIGs), which are a part of Title I
of the Elementary and Secondary Education Act of 1964 (ESA), provides funding to schools to
43
acquire resources to raise the achievement level of students in low-performing schools (USDOE,
2016). The four federally defined school improvement models are: (a) transformation, which
replaces the principal and adjustments to instructional materials and times, (b) turnaround, which
replaces the principal and at least 50% of the staff, (c) restart, which includes converting the
school’s operational system, and (d) school closure, which closes the school and places the
students in high performing schools in the district (Corbett, 2011).
School districts are required to apply for the SIGs on behalf of schools that fall into the
three tiers. Schools in Tier I are typically elementary of secondary schools receiving Title I
funding and are within the lowest 5% of such schools in the state (also includes high schools
with less than 60% graduation rate for several consecutive years), Tier II includes secondary
schools that are in the same lowest 5% are eligible for Title I funds but do not receive them, and
Tier III includes elementary of secondary schools “identified for improvement that are not in
Tier I” (Herrmann, Dragoset, & James-Burdumy, 2014). In 2015, $775, 553, 867 SIG funding
was provided to schools throughout the southern state (USDOE, 2015). Many schools in urban
districts face funding issues which can impact the ability for teachers to adequately instruct
students. Therefore, this additional funding, if used effectively, can greatly impact student
performance. Research conducted by Dragoset et al. (2017), found that “in higher grades, the
turnaround model was associated with larger student achievement gains in math than the
transformation model” (p. 12).
Although researchers have shown that implementing one of the four school improvement
models has proven effective and there is federal support of the models, there has been some
44
opposition by those who do not believe this method of correcting schools is a good best practice.
Ravitch (2013) expressed the belief that:
Public schools are rooted in their communities and that they exist to serve the children in
the community. If they are doing a poor job, the leadership of the school system must do
whatever is necessary to improve the schools; supply more staff, more specialists, more
resources—not close them and replace them with new schools and new names (p. 220).
According to Coggshall, Lasagna, and Laine (2009), “in a transformed school,
communities and families will participate in student learning, and students themselves will step
out into the world, more meaningfully engaging with the lessons it has to offer” (p. 2). The
community school literature does not suggest that community school supporters and
organizations were opposed to the four school improvement models. However, the underlying
mission of community schools supports a rationale for a new method of transforming schools
without school closure, reduction in workforce, and/or fear of school closure. Stability and
consistency among staff is vital to the success of low-income students, as they depend greatly on
their teachers (Downey, Von Hippel, & Hughes, 2008). Therefore, the method of closing a
school and removing these caring adults from their lives could also negatively impact student
performance. For many students, their school is truly their home and they feel a sense of
belonging through connectedness, support and relationships with caring adults (Dehuff, 2013;
Johnson, Crosnoe, Elder, (2001). Consequently, the closing of a school could negatively impact
student performance. According to Coggshall et al. (2009), the transformation of schools means
“that education will become more ‘unbundled’ in which schools are no longer wrapped in a neat
brick-and-mortar school package” (p. 2). Community schools provide a form of school
45
transformation through this method of bundling (Communities for Excellent Public Schools,
2010; The Federation for Community Schools, n.d.; Center for Mental Health in Schools, 2008).
Discipline and Urban Education
Discipline problems in urban schools is a topic that has long been discussed and debated.
The study of school discipline data goes as far back as 1975, starting with a study conducted by
the Children’s Defense Fund (Shika et al., 2006). In the study, the Children’s Defense Fund
explored the U.S. Department of Education’s Office for Civil Rights (OCR) data and found that
there was disproportionality in suspensions among races. It was found that Black students were
suspended between two and three times more than White students at all levels; elementary,
middle, and high school (Shika et al., 2006).
Over the course of the past 30+ years, the data found in this initial study on discipline
still holds true. According to the USDOE’s Office for Civil Rights 2011-2012 School Discipline
data collection, “Black students are suspended and expelled at a rate three times greater than
White students. On average, 4.6% of White students are suspended, compared to 16.4% of Black
students” (USDOE, Office for Civil Rights, 2014, p. 3). More specifically, one southern state,
along with four other states (Indiana, North Carolina, Rhode Island, and South Carolina),
reported “male suspension rates higher than the nation for every racial/ethnic group” (USDOE,
2014, p. 11). Skiba and Losen (2016) explained that “out-of-school suspension and expulsion,
and their associated risk fall far more heavily on historically disadvantaged groups, especially
black students” (p. 5). Researchers have shown that poverty and discipline are strongly
connected. Brantlinger (1991) found that students who receive free or reduced lunch were more
likely to be suspended than those students not receiving free or reduced lunch. This reinforces a
46
connection presented earlier in the literature review by Aiken & Barbarian, 2013; Greever, 2014;
and Ravitch (2013), correlating poverty to student performance.
Discipline in urban schools can be associated with factors such as zero tolerance policies,
environmental factors, and peer groups. Zero tolerance was initially implemented to keep guns
and illegal drugs out of schools in an effort to ensure a safe educational environment (Skiba &
Peterson, 2000). However, zero tolerance policies attempt to use a “one size fits all” approach to
disciplinary actions and consequences. These policies typically include automatic suspensions or
expulsion for certain incidents regardless of the context of the situation, age of the child, or
cognitive ability of the child (Cornell & Sheras, 2006). For example, if a student’s parent packed
a knife in a lunch box to cut a sandwich and the knife was found, the student would be
disciplined in the same way as a student who brought a knife to school with the intent to harm
another student. Students living in high-poverty urban areas are exposed to more negative
influences and have more stressors than their more affluent peers who live in suburban areas, and
this impacts a student’s health outcomes (The National Center for Victims of Crime, 2012;
Thomas et al., 2012). Zero tolerance, which takes a more reactive than preventive approach to
discipline, does not take into account how this environment and certain stressors impact a child’s
cognitive ability and decision making.
Additionally, Shika et al. (2006) found that “Zero tolerance may increase the use of
profiling, a method of prospectively identifying students who may be at-risk of violence or
disruption by comparison to profiles of others who have engaged in such behavior in the past”
(p. 8). The use of such profiling and strict zero tolerance policies cause many students to find
themselves in the juvenile justice system. This contributes to what is known as the school-to-
47
prison pipeline which has been expanding due to the large number of students who have been
referred to the juvenile justice system for incidents that were committed at school (Shika et al.,
2006). With this form of “referral system,” many question if a students’ constitutional rights are
being fully upheld. There has also been a disproportionality in school based arrests, with a higher
percentage taking place among minority students in urban areas than non-minority students in
suburban areas. Suspension and expulsion impacts students by decreasing the quality of the
school climate, increasing the risk of negative behavior, and students not graduating on time or
dropping out of school (Skiba & Losen, 2016). Often the discipline inequalities that are seen
support the notation of a “broke” racial narrative, because the inequality is often based not on a
difference in actual behavior but on a difference in the way that children and their families are
perceived (Brown & Mediratta, 2015). This extends the concept of profiling from students alone
to include their families and can create negative stereotypes that hinder the learning environment.
Discipline problems in urban schools have required educators to use both prevention and
intervention programs. Three common programs being used in urban schools to control
disciplinary problems are Positive Behavior Support (PBS), Restorative Justice, and
Developmental Discipline. The latter considers how an infraction should be handled and
considers the social-emotional state of a child (Santiago et al., 2012). “Classroom moral
discussion of real-life dilemmas, hypothetical situations and literature help to bring in better
awareness about desirable behaviors” (Mumthas, Munavvir, & Abdul Gafoor, 2014, p. 307).
Positive Behavior Support, or PBS, is based on understanding why problem behaviors
occur school wide, in the classroom, or with an individual student. The southern state’s PBS
Project (2002) explained that “PBS is the application of evidence-based strategies and systems to
48
assist schools to increase academic performance, increase safety, decrease problem behavior, and
establish positive school cultures” (para. 1). PBS provides several strategies to manage
classroom behaviors and create a positive school climate, offering a positive alternative to
traditional methods of discipline (Frey, Lingo, & Nelson, 2008).
Restorative justice has three main goals: (a) accountability, which holds parties involved
responsibility for their actions and allows them the opportunity to repair any harm that was
caused; (b) community safety, which focuses on implementing strategies to keep the community
safe and empower the community; and (c) competency development, which seeks to increase the
social skills of those who harm others, identify and address the underlying factor(s) for such
behaviors, and the continuous self-improvement of youth (Ashley & Burke, n.d.). Restorative
justice correlates to the “reintegrative shaming theory” which recognizes the responsibility and
impact of both the wrongdoer and the person(s) harmed; and the shaming process may result in
different actions such as a public apology by a student and a teacher or an administrator’s
expression of disappointment in students for their actions (Braithwaite, 2004). Restorative justice
forces society and schools to move away from the “eye for an eye” or “one size fits all”
approaches to consequences and conflict resolution (Zehr, 2002). “Restorative justice in schools
is meant to bring all stakeholders together to resolve issues and build relationships, rather than
control student misbehavior through punitive exclusionary approaches” (Fronius, Persson,
Guckenburg, Hurley, & Petrosino, 2016, p. 6).
As it has been noted earlier in the literature review, students living in high poverty urban
areas face very unique stressors and are often exposed to negative and violent events that may
occur on a daily basis in their surroundings causing them to exhibit behaviors and anger that may
49
not be generally acceptable although students may perceive these behaviors as necessary for
survival outside of school (Payne, 2005). Payne also wrote that “If students from poverty don’t
know how to fit in physically, they are going to be in danger on the streets. But if that is their
only method for solving a problem, then they cannot be successful in school” (p. 77).
Community schools throughout the U.S. have recognized that this is an issue and that some
students may struggle with the ability to “code switch” and adapt to different environments
without using the same behaviors and displaying misdirected anger through the use of anger
coping skills. It is important that students learn how to suppress certain emotions. “Anger coping
is a cognitive-behavioral group intervention designed to reduce aggressive and disruptive
behaviors by enhancing children’s abilities to cope adaptively with difficult situations and
feelings” (Lochman, Palardy, McElroy, Phillips, & Holmes, n.d., p. 48).
A community school in a large urban school district offers students anger management
courses in an effort to equip them with the necessary skill set to make conscious decisions and
control their emotions. The use of anger management and character development supports
Glaser’s (1998) use of reality therapy, the process by which teachers assist students in making
positive decisions and understanding the connection between their behavior and consequences.
The underlying concept that Glaser (1998) presented is that all individuals are responsible for
their own behaviors. Community schools throughout the United States and abroad aim to provide
students with the skill set to be not only successful academically, but law abiding independent
thinkers as well.
50
Community Schools and Relationship Building
School-Community Relationship
American educators, policymakers, and parents continue to search for ways to improve
student achievement in schools. Blank, Jacobson, & Melaville (2012) aptly described school
reform as changing the aim of schools in an effort to better educate a generation of students.
They also noted the importance of community and strong school community partnerships to
school reform. Vollmer (2010) sent a very direct and telling message that “schools cannot do it
alone” (p. 9). Crowson and Hinz (2015) observed that education has always been an important
topic, that it was indeed too important to be left solely to educators, and that school reformers
have recognized the need to organize services to strengthen the community connections for
urban schools. Schorr (1977) as cited in Crowson and Boyd (2001), suggested, “A strategy for
school improvement that rests heavily on an ecological sense of “coproduction” between the
school and community, a shared revitalization of both neighborhood and school” (p. 17). This
sense of coproduction is the foundation of the community school rationale.
Just as the word “urban” can be interpreted in a variety of ways, so can “community” and
the interpretation of community has evolved over the last six decades. Beers et al. (1953)
explained that a community can be perceived as a closely-knit area in which people operate self-
sufficiently, a fraternal group of people, a political community, an economic community or
community in a psychological sense in which people share common beliefs and values. In regard
to the school-community relationship, community is the area in which the students and their
families attending a particular school reside. The school-community relationship is extremely
important, and “the school is the one institution in the community which reaches into the greatest
51
number of homes” (Beers et al., 1953, p. 185). Knowing that schools reach most homes in a
given community, it is important for schools to actively engage and reach out to the community.
Attempting to engage the community by waiting for them to come to the school is not effective
in this generation. In an effort to engage the community, schools must reach out by shifting the
venue and removing time constraints imposed that often limit involvement (Vollmer, 2010).
People respond better when they are in environments that are supportive and safe. Community
schools have “shifted the venue” by providing helpful resources at schools that once were not
available to some families and have begun to remove time constraints by offering extended hours
and some weekend opportunities.
School-community relationships take different forms such as “informational personal
relations, business and professional relations, relations as members of social and civic groups or
community agencies, and relations that arise directly from working on school-community
problems” (Beers et al., 1953, p. 159). Many scholars have worked to develop strategies for
school-community relationships. In an effort to solve ever changing societal problems that
impact schools and communities, Brooks (2009) reminded school officials that they “cannot
continue to work in a vacuum when attempting to solve problems” (p. 73). Berg, Melaville, and
Blank (2006) offered practical suggestions to improving community engagement. They stressed
the importance of having a direction and not losing sight of goals, reaching out to and working
with others in a shared governance environment, not ignoring problems, and publicizing the
school’s efforts. Additionally, Blank, Jacobson, & Melaville (2012) provided the following six
strategies that successful community school initiatives use to build effective partnerships with
local agencies:
52
1. Ensure that all partners share a common vision.
2. Establish formal relationships and collaborative structures to engage stakeholders.
3. Encourage open dialogue about challenges and solutions.
4. Engage partners in the use of data.
5. Create and empower central-office capacity at the district level to sustain community
school work.
6. Leverage community resources and braid funding streams (p. 2).
Another important component of the school-community relationship is connectedness.
School connectedness was defined by the Centers for Disease Control and Prevention (2009) as
“the belief by students that adults in the school care about their learning as well as about them as
individuals” (p. 3). According to the Centers for Disease Control and Prevention (2009), one of
the strategies to increase school connectedness is to “create trusting and caring relationships that
promote open communication among administrators, teachers, staff, students, families, and
communities” (p. 9).
In Schools Can Not Do It Alone, Vollmer (2010) outlined what he called the Terrible
Twenty Trends, those trends that he believed were wreaking havoc on the school-community
relationship. Among the Terrible Twenty Trends are the following: negative media on education,
fear of school violence, culture war, the frenzy of privatization, union bashing, standardized
testing, and ever-expanding expectations. Vollmer (2010) suggested that in order to strengthen
school-community relationships, it is imperative to minimize the impact of these trends. Vollmer
(2010) also outlined what he called Prerequisites of Progress, four conditions that are needed to
strengthen the school community relationship. First, is community understanding Vollmer
53
explained that “The community must know what we are doing, why we do it that way, and how
we plan to change it” (p. 114). Second, is community trust which allows community members to
fully understand and support education. Third, is community permission which it important to
the culture of the town. Last is community support which is important because schools simply
need additional resources. By looking at both perspectives of the “dos and don’ts” of community
involvement, schools are able to plan effectively and accordingly.
Gray (2013) provided that:
An effective community engagement framework for education should not be limited to
connecting with individual parents and community members. It should look at building
engagement with organizations and institutions that have relationships with groups of
organized parents, families, and community members (p. 45).
In addition to connections, another important component of the school-community is that
schools have a clear vision constructed through a team effort to reflect the needs of the staff,
families, and the community (Berg et al., 2006). In order for any relationship involving students
to work, there must be an understanding of equity; the strength of each party contributes to the
academic success of the student (Epstein, 2015). The school-community connection “requires
that schools become institutions that work with parents and the community to educate children”
(Gold & Simon, 2002, p.13). This allows the school-community relationship to support the
concepts of mutual investment and accountability (Gray, 2013). Crowson and Boyd (1993)
explained that “Parental involvement in school governance, instructional partnerships, school-to-
community ‘outreach’ and children’s service coordination are interconnected and critical
components in the overall improvement of urban education” (p. 142).
54
Oftentimes, schools isolate themselves from the community in which they serve for
various reasons. Crowson (2011) summarized this isolation, writing, “images of educational
bureaucracies have long had a closed-system aura” (p. 471). With the expansion of community
schools throughout the U.S. and internationally, schools have begun to operate more as open-
systems as noted earlier in the literature review, and this has greatly impacted the organization of
many schools, influencing the school climate, and ultimately student achievement.
School climate has long been discussed as having an important influence on student
motivation (Gallagher et al., 2012) and has been recognized as impacting relationship building
ability. On a broader scale, the school-community partnership offers similar benefits to those
derived in positive school climates. Schools have begun to realize that building social capital and
reaching out to communities is imperative to strengthening communities and successfully
educating students while building community power (Crowson, 1998). Community power is a
product of residents of low-income neighborhoods gaining the skill sets and influence to impact
and improve their schools and community (Gold & Simon, 2002). Community engagement and
partnerships with schools eliminate issues of inequity that often affect low-income communities
(Gray, 2013). Increasing community involvement decreases resistance and increases community
support for district initiatives (Vollmer, 2010). When the school district has the support of the
community, cooperation and compliance is more prevalent, and this ultimately impacts student
success.
There has been much discussion regarding service organizations that do not partner very
easily (Crowson & Boyd, 1996). However, community schools have found a way to break this
barrier. Community schools pride themselves on their successful community involvement and
55
believe that “community engagement is the hallmark of a community school” (Berg et al., 2006,
p. 1). Effective school-community partnerships can greatly impact student success. “Well-
designed and well-implemented community partnerships can lead to higher grades and test
scores, better attendance, improved behavior, better social skills, more classes passed and/or
more credits earned, and increased graduation rates” (Epstein, 2015, p. 1). It has been
demonstrated that parental involvement and community partnerships improve a student’s attitude
about school (Epstein, 2015). High levels of community involvement can often be found at very
high-performing schools (Yull, Blitz, Thompson, & Murray, 2014).
Blank, Melaville, and Shah (2003) discussed research results which revealed that
community schools impact the community in numerous ways (e.g., increasing community
knowledge, improving perceptions of initiative, increasing community use of school building,
increasing family awareness of community agencies, increasing community members access to
facilities previously unknown or unaffordable, improving security and safety in surrounding
areas, and strengthening community pride and identity, engagement of citizens and students in
school and community service). In addition to impacting student achievement, school-
community partnerships provide assistance with school resources and materials. One of the
barriers often impacting schools, particularly schools in urban areas, has been the lack of
funding. Community schools receive programmatic and financial support from various resources.
Blank et al. (2012) commented on the importance of community resources in supporting
community schools, noting that a majority of funding in community schools comes from sources
beyond the school district itself:
56
On average only about one-quarter of all resources in community schools come from
school districts and the remainder is leveraged from other sectors including local, state,
and federal funding streams; foundations; and a mix of public agencies and community-
based organizations (p. 20).
Parent-School Relationship
Although focusing on the education of the students is important, schools must also aim to
build strong relationships with their families. Epstein et al. (2002) explained that “the way
schools care about children is reflected in the way the schools care about the children’s families”
(p. 20). In order to strengthen the parent-school relationship, the school must first create a
welcoming atmosphere (Epstein, 2015). School climate is a concept that has been important to
educators for roughly 100 years, but the concept was not thoroughly researched until the 1950s
(National School Climate Council, 2007). “School climate refers to the quality and character of
school life. It is based on patterns of school life experiences and reflects norms, goals, values,
interpersonal relationships, teaching, learning and leadership practices and organizational
structures” (National School Climate Center, 2008, p. 5). Cohen (2012) posited that positive
school climate includes taking an active interest in all cultures, respecting diversity, and
achieving active participation from students, their families and the community. Creating a
positive school climate is the first step in the journey to strengthening the parent-school
relationship.
The need for parental involvement is the most agreed upon topic in education (Epstein et
al., 2002). Over the course of the last several decades, educational policymakers have recognized
the importance of strengthening the parent-school relationship and increasing parental
57
involvement to impact student development (Watson, Sanders-Lawson, & McNeal, 2012). Many
policies such as the Elementary and Secondary Act (ESEA) and the No Child Left Behind Act
(NCLB) of 2001 have clearly defined parental involvement and have outlined specific ways for
parents to be involved in their child’s educational journey (Afterschool Alliance, 2012). Though
many school districts throughout the U.S. strive to comply with federal policies, many have
found it difficult to fully engage parents due to the following barriers: cultural, language,
socioeconomic, parents’ perception of schools, school personnel perceptions of certain families
particularly in schools with a large minority population and majority of low-income students
(Afterschool Alliance, 2012). Low-income parents often face obstacles that prevent or limit them
from being fully involved in their child’s education. These include a lack of transportation and a
lack of knowledge of school events and school policies (Vega, Moore, & Miranda, 2015).
A common misconception among educators about low-income parents is that just
because they are not physically at school events and meetings, they do not value education and
do not care about or support their child’s education (Vega et al., 2015). Conversely, researchers
have concluded that a vast majority of parents want to be involved in their children’s education,
regardless of race, income, ethnicity. Due to many deficit models of parental involvement some
parents are left out and perceived as “uninvolved” and “careless” (Epstein, 2015). It is important
that “family engagement does not prescribe to parents how they can contribute to the school, but
rather listens to the parents to understand their concerns” (Yull et al., 2014, p. 12). Epstein et al.
(2002) determined that affluent schools have more parental involvement and that urban schools
have to work more strategically and creatively to actively engage parents. It is extremely
important to focus on the perception of the parents because the way parents and students view
58
their schools is a strong predictor of academic, social, and emotional outcomes (Smith, Connolly,
& Pryseski, 2014).
Additional obstacles impacting parental engagement include trust and ownership
(Afterschool Alliance, 2012). Many parents who dislike school have had negative experiences
with schools and feel uncomfortable at schools for various reasons, such as lack of recognition of
diversity (Berg et al., 2006) and/or cultural bias (Yull et al., 2014). Berg et al. (2006) discussed
the importance of recognizing and supporting diversity, observing that “families are more likely
to participate when they feel invited and when diversity is acknowledged and viewed as a
strength” (p. 20). Yull et al. (2014) expressed the belief that cultural bias often impacts minority
parents’ ability to be fully involved in their child’s education.
Parents are stakeholders whose incentives or rewards for participation should shift from
tangible incentives to relationships and resources (Crowson & Boyd, 1993). The Children’s Aid
Society has played a tremendous role with the development and operation of community schools
throughout the United States and abroad. The Children’s Aid Society (CAS) Parent Involvement
Program:
Has a pivotal role within the larger context of CAS’s partnership with the schools and the
model is culturally responsive and provides multiple entry points for meeting parents at
their level as well as multiple opportunities to engage with, support, and strengthen the
school (Dryfoos et al., 2005, p. 45).
Parental involvement in afterschool programs increases youth participation and
constructive programs (Afterschool Alliance, 2012). With parents serving as many students’ first
59
role models and motivators, providing opportunities for parents to take ownership and become
more involved in their child’s school will encourage the child to do the same.
Community schools throughout the U.S. have addressed increasing parental involvement
by providing opportunities for parents to gain trust in the school and to develop a sense of
ownership in their children’s education (Epstein, 2015). In an effort to fully reach the whole
family, family engagement plans should be individualized and structured to meet the needs of the
school population and the surrounding community (Epstein, 2015). Schools should analyze
parental involvement from a broader perspective to include the roles of different parenting styles
such as parents of students living in poverty and single parent families (Vega et al., 2015).
Community schools take this precise approach and work from the “inside out” by first
identifying the issues impacting students, their families, and the community and then providing
services to address these issues. In community schools, students and parents have access to a
support system such as General Education Diploma (GED) and English as a Second Language
(ESL) classes, and life coaching which allows community members to assist families in
becoming more stable and may contribute to students being more focused in school (Chairney,
2000). Blank, Jacobson, and Pearson (2009) reported that various researchers have indicated that
“parents of community school students are more engaged in their children’s learning and more
involved in their school” (p. 34).
Parent-Child Relationship
Building a strong, trusting, supportive, and healthy relationship is important to the
school-community relationship, parent-school relationship and parent-child relationship. The
parent-relationship greatly impacts the child’s physical, emotional, psychological, and academic
60
development. Berg et al. (2002) emphasized what was earlier discussed suggests that “Families
are children’s first teachers and their most influential role models and motivators” (p. 16).
According to research reported by Afterschool Alliance (2012), parental involvement and a
‘positive parent-child relationship and “improves students” academic performance, attendance
and graduation rates; reduces dropout rates and at-risk behaviors, such as alcohol and drug use;
and positively impacts students’ attitudes, behaviors and overall well-being (p. 1). Supportive
parents and other caring adults in students’ lives encourages student growth (Afterschool
Alliance, 2012; Berg et al., 2002).
The educational level of parents has an impact of student achievement, as some parents
are not able to assist their children with homework or understand some of the school dynamics
due to their comfort level and lack of understanding the material (Blair, Blair, & Madama, 1999).
Better educated parents pay more attention to the quality of their child’s education (Egalite,
2016). According to Egalite (2016), “Parental education has been identified as the single
strongest correlate of children’s success in school, the number of years they attend school, and
their success in life” (p. 72). In addition to not being involved in their child’s educational journey
due to a lack of educational understanding, parents are frequently not as involved because they
do not have a positive view of schools and are “afraid” of becoming too involved. Ferrara (2015)
posited that some parents consider the school to be an intimidating place because they are trying
to understand their roles as parents and gain confidence in their ability to help their children
learn. The lack of understanding creates a barrier between the child and the parents, thus
impacting the overall relationship.
61
Educational level impacts income and living arrangements, and this can also create stress
in the parent-child relationship. A lack of higher education attainment correlates with low
income (Barajas, 2011). Huston et al. (2001) found a correlation between income and emotional
support and positive adult psychological well-being, positive parenting, and positive parent-child
relationships. Parents earning low wages often have to work long hours, interfering with the
bonding time available for the parent-child. In addition to working long hours, parents earning
low incomes often have limited housing opportunities. In comparison to renting, home
ownership typically allows parents to reside in a higher quality environment and limits negative
neighborhood influences (Haurin, Parcel, & Haurin, 2001). Haurin et al. (2001) also explained
that parental homeownership positively impacts student success and increases the graduation
probability.
Another barrier preventing some parents from fostering strong and positive relationships
with their children is the lack of a two-parent household. Barajas (2011) explained, based on his
research, that by the age of 15 almost half of all U.S. students will have lived in a single-parent
family, and this living arrangement has tripled in the United Stated in the past 50 years for
African American and Latino families. Children living with just one parent are at greater risk of
grade repetition and school suspension than students living with two parents (Egalite, 2016).
Additionally, a diverse majority of single-parent households are mother-led and “unemployment
is often associated with more stress than employment, particularly for single mothers” (Huston et
al., 2001, p. 319). Single-parent households exist for various reasons, such as death of the other
parent and/or divorce. However, a great determinant of single parent households for students
attending urban schools is incarceration of the absent parent. Egalite (2016) provided research
62
which indicates that “two percentage of U.S. children have a parent in federal or state prison and
Black students are 7.5 times more likely than White children to have an incarcerated parent” (p.
73). Although the dynamics of the parent-child relationship greatly impacts the child, these
dynamics impact the parent as well. A positive parent-child relationship can help parents feel
less alone, more effective, and less stressed (Mastergeorge, 2013).
The underlying component of the parent-child relationship is the choice of parenting
style. Various parenting styles impact student academic achievement. Common parenting styles
that impact student achievement are the authoritative parenting style which allows the child to
have a degree of autonomy and the permissive parenting style whereby the parent does not
control or encourage the child to obey rules and standards (Mensah & Kuranchie, 2013).
Although the parenting style varies from household to household, parents often struggle with
basic parenting skills and understanding the best way to discipline, guide and bond with their
children. Parents need assistance with parenting for various reasons (e.g., financial and emotional
stress) or simply not knowing how to provide appropriate parental support (Ravitch, 2013). One
of Epstein’s keys of parental involvement in parenting is to assist families with parenting skills
in effort for parents to support children as students and assist schools in understanding families
(Epstein, Coates, Salinas, Sanders, & Simon, 1997). Parenting education courses provide parents
with an array of necessary information and aim to enhance parents’ confidence, competence, and
child-rearing skills (Bowman, Pratt, Rennekamp, & Sektnan, 2010). If equipped with the proper
assistance, thriving children can be raised in any type of family (Mastergeorge et al., 2013).
Due to the opportunities, diversity, and independence that the U.S. provides, the U.S.
school system is filled with students whose parents are immigrants from other countries, and
63
who do not speak or understand English. These students often learn English in an American
school system as a second language, and their parents are not always provided the same
linguistic opportunity. Often parents who speak a language other than English struggle with
getting involved in their child’s academics due to language barriers and comprehension (Tinkler,
2002). Additionally, this impacts the parent-child relationship, and the language barrier begins to
not only create a gap between the parent and the school but between the parent and the child as
well. All too often, school personnel with whom these families deal primarily speak English,
making attending meetings, receiving written correspondence and verbal communication
difficult for parents (Tinkler, 2002). This also makes communicating behaviors and grades
extremely difficult. The inability to bond with their children regarding school issues creates
separation (Aspiazu, Bauer, & Spillet, 1998).
The foundation of a child’s learning is provided through positive parent-child
relationships (Mastergeorge et al., 2013). Community schools throughout the U.S. have
recognized the barriers that impact the parent-child relationship and have incorporated various
programs in community schools to assist parents and ultimately break down these barriers. Many
community schools, such as the one involved in this study, provides parent resources such as
adult education courses, real estate literacy, parenting courses, and English literacy courses. By
incorporating these enhancements into their basic structures, community schools aim to address
the well-being of both students and their families. Mastergeorge et al. noted that “Social support
is one of the greatest protective factors against parental stress, depression, and low self-efficacy”
(p. 3). Community schools recognize the need for healthy parents in an effort to development
healthy children and have tackled this through support programs. Though a community school
64
builds a bridge between the community and the school district, it also strengthens the bridge
which connects the parent and the child. Ravitch (2013) suggested that “When parents are
actively involved in their children’s lives, their children feel their support and their love” (p.
259). The community model aims to break down barriers to allow parents to be more involved,
for students to feel supported, and for parents and their children to share a healthy bond.
Community Schools and Student Self-Improvement
Maslow’s Hierarchy of Needs
The theory of human motivation or Maslow’s hierarchy of needs was developed by
Maslow in 1943. Maslow (1943, 1954) identified and ranked human needs into five categories.
The community school rationale can be related to Maslow’s hierarchy of needs, as community
schools aim to educate students holistically while addressing all five categories of needs: (a)
psychological; (b) safety; (c) belongingness/love; (d) esteem; and (e) self-actualization.
The physiological needs are basic survival needs, such as food, water, sleep, and shelter.
Many community schools provide food pantries and access to social services resources to
provide students and their families with what Maslow referred to as physiological needs.
The safety needs provide order and structure such as job security, living in a safe
environment, and avoiding danger. Community schools throughout the U.S. have aimed to not
only provide students, but their families as well, with resources to improve their quality of living
and environment. These resources include adult education, financial literacy, and real estate
literacy.
The belongingness and love needs deal with the relationships that an individual has with
others and include family, friends, clubs, and peer groups. Part of relationship building within
65
community schools is to strengthen the parent-child relationship, and this can be accomplished,
in part, with resources such as parenting courses. Parenting courses and increasing the dynamics
of the parent-child relationship correlates with Ghezzie’s (2003) suggestion that a stable and
healthy relationship with a caring adult is critical to the well-being of children. The LUS School
District has provided students with anger management resources, and these resources can impact
the relationships of students with their peers, friends, and family. Anger management is learning
how to recognize signs of anger and taking control of these signs and dealing with the decision in
a positive way (Mayo Clinic Staff, 2011). Anger management programs and courses in schools
teach students how to handle their anger and emotions in an appropriate way, according to school
rules and procedures. Over time, not dealing with anger issues can lead to hypertension, asthma,
headaches, bullying and aggressiveness, and cardiovascular disease (Rice & Howell, 2006). By
providing services such as anger management, community schools are addressing the core of
many issues impacting schools such as discipline, bullying, and various health issues.
The self-esteem needs category deals with both self-respect and respect from others. It
includes the need for recognition, independence, and acceptance. Counseling services are
provided to students at many community schools, aiming to increase self-esteem, self-respect
and mental health.
The final category, self-actualization needs, is the desire to fulfill one’s highest potential
and includes trust, honesty, awareness, and freedom (Maslow, 1943). Self-efficacy and self-
esteem impacts a person’s goals and aspirations. Researchers have shown that the stronger the
self-efficacy of individuals, the more committed they are to accomplish the high goals that they
set (Bandura, 2004; Luna, 2011). People with low self-efficacy produce low outcomes and do
66
not handle obstacles and difficulties well (Bandura, 2004). Self-actualization also deals with
individuals reaching their fullest potential. Community schools provide students with additional
resources to help them reach their fullest potential while breaking down barriers. In an effort to
ensure that students are thriving in school and prepared for life after school, many community
schools provide supplemental enrichment activities such as tutoring, mentoring, job coaching,
financial literacy, and real world curriculum.
The additional resources provided at community schools are parallel with Maslow’s
Hierarchy of Needs and the impact of federal education regulations. The implementation of
NCLB accountability for student performance has increased pressure for student proficiency in
mathematics and reading, and the need for students to make adequate yearly progress (AYP) has
increased tremendously (Luna, 2011). This has led to an increase in supplemental programs
designed to help students achieve. However, many children fail to get additional enrichment due
to expensive fees that their parents cannot afford (Vandell & Shumow, 1999). A key component
of community schools throughout the U.S. is that students are provided with the opportunity to
receive supplemental enrichment and tutoring services. Common characteristics of supplemental
programs include prepared staff, intentional programming, alignment with the school day, strong
community partners, safety, health and wellness, sustained student participation and access, and
ongoing assessment and improvement (Afterschool Alliance, 2011). Data presented by the
Afterschool Alliance (2014) suggested that students who regularly participate in before and after
school enrichment programs “have better grades and behavior in school; better peer relations and
emotional well-being; and lower incidences of drug-use, violence and unintended pregnancy” (p.
2).
67
Tutoring has been considered the most powerful form of instruction for increasing
student performance, thereby supplementing instruction (Burns, Senesac, & Symington, 2004;
Slavin, 1999). The tutor-tutee relationship is extremely important to the success of students
because once students perceive that the teacher cares about them, academic achievement
improves (Klem & Connell, 2004). In addition to tutoring, many supplemental programs include
a component of mentoring. Kochan and Pascarelli (2003) suggested that mentoring improves
student achievement and retention rates, sociological and emotional support, career
advancement, and personal growth. Mentoring can provide students with opportunities to live
meaningful lives. A nurturing and consistent mentor-mentee relationship fosters a child’s ability
to learn (Kera, 1997; McMillian & Reed, 1994). More recently, Ferrara (2015) supported the
value of mentoring: “Students who drop out of school face many negative consequences
including decreased pay, higher, unemployment, higher rates of incarceration, and even early
deaths” (p. 29).
Academics are the basis of education and provide the blueprint for what students will
learn in schools and what teachers will deliver. Herschback (2001) suggested that meaningful
education connects classroom instruction to what is happening in the real-world. Blank et al.
(2012) explained that “Community schools establish “cradle to career” conditions for learning
that make it possible for every child to succeed” (p. 4). Community schools have an emphasis on
using real-world curriculum to prepare students for life after school, emphasizing that students
need real-life connections to understand the importance of school and the society as a whole as
supported by Dewey in the early 1900s. Real-life curriculum also allows students to increase
their critical thinking skills that they may need after high school (Rowe, 2009). Additionally,
68
providing relatable information for students allows them to have more ownership in school. The
Centers for Disease Control and Prevention (2009) explained that “Students are more likely to
engage in healthy behaviors and succeed academically when they feel connected to school” (p.
5). Additionally, according to Cole (2010), real-life curriculum and community-based learning
fosters students’ civic participation, and this emphasis benefits not only the students but teachers
as well. Community-based education allows teachers to enrich students and expand classroom
learning by making learning meaningful, relating curriculum to issues impacting students, their
families, community and connecting cultures (Cole, 2010). The use of real-world curriculum also
allows teachers to build partnerships with industry professionals and local community
organizations through gathering knowledge for instruction (Rogers-Chapman & Darling-
Hammond, 2013).
Student Mental, Emotional, and Physical Health
Education reform has been focused on making academic gains and student achievement.
However, what has been missing from education reform is the effort to focus on the well-being
of the whole child, including academic, mental, and physical stamina. “If the root causes of
poverty are not addressed, society will remain unchanged and some poor students will get to go
to college but the vast majority who are impoverished will remain impoverished” (Ravitch, 2013,
p. 225). Wraparound services are provided when a team of individuals construct individualized
services for a child and their family to succeed at school and at home Bruns et al. (2004). The
community school model has used a form of wraparound services which includes using services
to address the causes of poverty, family educational background, and access to resources.
69
In the Reign of Error (2013), Ravitch explained that wraparound services make a
difference and provide four solutions to address problems for students living in poverty. The
solutions are that (a) “every school should have a nurse, doctor, or health clinic to ensure that
children get regular medical checkups and prompt treatment for illnesses” (p. 255); (b)
“disadvantaged children should have summer programs that give them enrichment activities,
sports, the arts, tutoring, and literacy activities to maintain the gains of the previous academic
year” (p. 255), (c) “disadvantaged children benefit if they have the opportunity to participate in
excellent after-school enrichment programs” (p. 257); and (d) “parent education will support and
intensify the impact of all interventions” (p. 258). The community school rationale and models
have been aligned with the solutions suggested by Ravitch. To ensure successful implementation
and delivery of wraparound services, Burns et al. (2004) suggested 10 principles for the
wraparound process:
1. Family voice and choice. “Family and youth/child perspectives are intentionally
elicited and prioritized during all phases of the wraparound process” (p.4).
2. Team based. “The wraparound team consists of individuals agreed upon by the family
and committed to them through informal, formal, and community support and service
relationships” (p. 5).
3. Natural supports. “The wraparound plan reflects activities and interventions that draw
on sources of natural support” (p. 6).
4. Collaboration. “Team members work cooperatively and share responsibility for
developing, implementing, monitoring, and evaluating a single wraparound plan” (p.
7).
70
5. Community-based. “The wraparound team implements service and support strategies
that take place in the most inclusive, most responsive, most accessible, and least
restrictive settings possible; and that safely promote child and family integration into
home and community life” (p. 8).
6. Culturally competent. “The wraparound process demonstrates respect for and builds
on the values, preferences, beliefs, cultures, and identify of the child/youth and
family, and their community” (p. 8).
7. Individualized. “To achieve the goals laid out in the wraparound plan, the team
develops and implements a customized set of strategies, supports, and services” (p.
9).
8. Strengths based. “The wraparound process and the wraparound plan identify, build
on, and enhance the capabilities, knowledge, skills, and assets of the child and family,
their community, and other team members” (p. 9).
9. Persistence. “Despite challenges, the team persists in working toward the goals
included in the wraparound plan until the team reaches agreement that a formal
wraparound process is no longer required” (p. 10).
10. Outcome based. “The team ties the goals and strategies of the wraparound plan to
observable or measureable indictors of success, monitors progress in terms of these
indicators, and revises the plan accordingly” (p. 10).
Part of the wraparound process involves determining services that are required for each
specific demographic of students and families who are being served. These services include
resources important to a child’s mental, emotional, and physical health. Throughout the halls of
71
U.S. schools walk students who are faced with various stressors that can impact their mental and
physical health, social skills, and academic performance. Crowson and Boyd (1993) observed
that “Few ideas have caught on in public education as rapidly or as widely as the notion that
public schools and other social and health agencies should collaborate to provide more effective
services for children” (p. 143). Many of the issues that 21st century students face are so
widespread that one is reminded of Vollmer’s (2010) statement that, “Schools cannot do it
alone” (p. 9).
Research findings presented by Merikangas (2010) indicated that in the average U.S.
class approximately four to five students struggle with mental illness or stress, and these students
are three times more likely to be tardy and absent (Gall, Pagano, Desmond, Perrin, & Murphy,
2000). A vast majority of most students who are in need of mental health services do not receive
them for various reasons such as lack of funding, insurance, access/knowledge of services, and
denial of the illness (Kutash, Duchnowski, & Lynn, 2006). Mental illness impacts students in a
variety of ways and can impact their self-esteem and their day-to-day interactions with others.
Low self-esteem may lead to negative self-talk and depression. Self-talk consists of the
statements that people make to themselves, both aloud and internally, which ultimately
determine how they perceive themselves (Hackfort & Schwenkmezger, 1993). Students suffering
depression and anxiety are more likely to struggle with concentration and completing homework
than those students not suffering with these symptoms (Humensky et al., 2010). Additionally,
Slap, Goodman, and Huang, (2001) explained that students who have attempted suicide or have
suicidal thoughts are more likely to display low academic performance. Understanding that
stress, anxiety, and depression negatively impact student academic performance (Siraj, Roslan,
72
Hasan, Jin, & Othman, 2014) the need for wraparound services is great. Community school
stakeholders and policymakers have identified the trend between mental health and academic
performance and use a wraparound approach which addresses these issues.
Various students in the U.S. school system are struggling with physical ailments which
has the ability to have an impact their academic performance. Physical health issues result from a
variety of factors such as engaging in dangerous behaviors, lack of proper medical treatment, and
genetics. Swerdlik, Reeder, and Bucy, (1999) wrote that “Many students engage in smoking,
binge drinking, and unsafe sex, which put them at risk of developing serious health problems” (p.
72). Identifying this issue, community schools understand the need for developing a child’s
character and decision making skills. According to the USDOE (2007), “The term character
includes the emotional, intellectual and moral qualities of a person or group as well as the
demonstration of these qualities in prosocial behavior” (p. 3). In an effort to eliminate the
frequency of students’ participation in these activities and eliminate health problems caused by
these activities, many community schools offer character education to improve students’ decision
making skills that will carry over into adulthood.
Ferebee noted in 2004 that approximately 25% of school aged children in the U.S. had
vision problems. Basch (2011) more recently observed that students living in poverty were at
greater risk of untreated need for vison services and under-treatment of vision problems.
Inadequate vision care for children has been linked to social and emotional issues, increased
dropping out of high school, juvenile delinquency, and literacy problems that are likely to
transition into adulthood (Zaba, 2011). In addition to vision complications, many students
experience an intense struggle with tooth pain. In 2012, Dye, Xianfen, Beltran-Anguilar reported
73
that “about 20% of children aged 5 to 11 years had untreated dental caries and 13% of
adolescents aged 12 to 19 years had untreated caries” (p. 5). Two years later, in 2014, the
Centers for Disease Control and Prevention indicated that “tooth decay (cavities) is one of the
most common chronic conditions of childhood in the United States” (para.1). There is a strong
correlation between health and outcomes. Students who are unhealthy typically do not perform
well (Swerdlik et al., 1999). Overall, healthy students are better learners (Centers for Disease
Control and Prevention, 2014). Community schools promote a desire to develop students
academically, mentally, physically, and socially through a whole-child approach to education.
Summary
The world in which students live and work is changing and advancing at a rate that
outpaces policymakers’ abilities to ensure that schools have the capacity to meet student needs.
Policies such as NCLB, have required increased expectations for students’ proficiency. As the
expectations increase, resources must increase as well to tackle the core of what impacts student
performance, the needs of students. Community schools address the core. The rationale of
community schools has spread throughout the United States and gained much support in recent
years from influential policymakers. In a 2012 speech at the Askwith Forum, then U.S. Secretary
of Education Arne Duncan, expressed his support for community schools and expressed the
underlying justification behind the community school model:
“It never made sense to me that poor children should be expected to learn just as rapidly
as other students when they couldn’t see the blackboard, or when their mouths ached
from untreated cavities and gum disease. It’s the responsibility of schools to teach all
children--and have high expectations for every student, rich and poor” (Duncan, 2012).
74
Community schools aim to foster a strong sense of learning and connections between the
school and the community. By thinking in new ways of community, family, and school
partnerships, community schools are able to increase student outcomes, parental involvement,
community involvement and education policy. From the beginning, solving children’s
nonacademic problems has been the core of community schools (Dryfoos et al., 2005) and early
community school advocates understood the connection between a healthy community and a
healthy child. The Children’s Aid Society has developed three mantras that guide the daily work
of community schools: “It’s all about relationships, everything has to be negotiated, all the time,
and to make partnerships really work, you have to have the work ‘yes’ written in your heart”
(Dryfoos et al., 2005, p. 262). Community schools pay equal attention to teaching and learning,
and this contributes to making community schools an effective reform strategy (Santiago et al.,
2012). Ravitch (2013) wrote, “If we can help students and parents, then we help the society” (p.
260). Community schools aim to close the achievement gap as a society and educational system.
75
CHAPTER 3
METHODOLOGY
Introduction
Community schools have been recognized as safe places, even in the most dangerous
areas, and they have significantly enhanced the quality of life for students, their families, and
community members (State Education Association, 2016). In one southern state, the quality of
life of parents, community members, and students has been impacted by the implementation of
the community school model in the LUS School District. The community school’s mission is to
empower students and strengthen communities for lifelong success (LUS School District, 2016).
In addition to strengthening communities, the community school in the target district has thrived
on the vision of being an international model for high performance (LUS School District, 2016).
This chapter provides a detailed description of the target school, its organization, mission,
and goals. It also contains an overview of the methods and procedures that were used to collect
and analyze the data to respond to the five research questions. Both quantitative and qualitative
research methods were used to analyze the data collected through various instruments. The
chapter contains (a) a restatement of the purpose of the study, (b) a profile of the target school
district and community school, (c) details regarding the selection of participants, (d)
instrumentation used to conduct the study, (e) data collection procedures, and (f) methods of data
analysis.
Purpose of Study
The purpose of this study was to investigate the impact of the community school
practices, such as extended enrichment hours, character development, anger management,
76
counseling, tutoring, and mental and physical healthcare on student performance in a community
school in the LUS School District, a large urban school district in the southern United States. The
researcher examined the community school practices and services as they related to the
effectiveness and impact on student performance outcomes. The study generated information that
may be helpful to schools and stakeholders who are considering adopting community school
practices.
An independent samples t test was selected as the statistical tool to be used in the analysis
of Research Questions 1-3, because an independent samples t test compares the means of two
independent groups in an effort to determine if the means are statistically different. Descriptive
statistics were used in the analysis of Research Questions 4 and 5. Independent samples t tests
are commonly used to test statistical differences between the means of two scores, statistical
differences between the means of two interventions, and statistical difference between the means
of two groups. These statistical tests were run using historical, pre-existing data provided by the
State Department of Education and LUS School District’s Office of Accountability, Research, &
Assessment. The software program, Statistical Package for Social Sciences (SPSS), version 24,
2016, was used to perform the statistical analysis on these data. Table 4 describes the data
analysis and statistical analysis that were used to address each of the five research questions.
Research Questions and Hypotheses
The following five questions and hypotheses were developed to guide this study:
1. What is the difference in cumulative grade point average (GPA) of the 2011-2012 senior
cohort compared to the 2015-2016 senior cohort after the school’s transition to a
community school in a large urban school district in the southern United States?
77
H0: There is no significant difference in cumulative grade point average of the 2011-
2012 senior cohort as compared to the 2015-2016 senior cohort after the school’s
transition to a community school in a large urban school district in the southern
United States.
The dependent variable for this question are cumulative grade point averages (GPA).
The independent variables for this question were traditional school and community
school.
The statistical tool for this question was an independent samples t test to test
statistical differences between the means of two groups.
2. What is the difference in attendance of the 2011-2012 senior cohort compared to the
2015-2016 senior cohort after the school’s transition to a community school in a large
urban school district in the southern United States and compared to similar high
schools in the same school district?
H0: There is no significant difference in attendance of the 2011-2012 senior cohort
compared to the 2015-2016 senior cohort after the school’s transition to a community
school in a large urban school district in the southern United States and compared to
similar high schools in the same school district and compared to similar high schools
in the same school district.
The dependent variable for this question was attendance. The independent variables
for this question were traditional school and community school.
The statistical tool for this question was an independent samples t test to test
statistical differences between the means of two groups.
78
3. What is the difference in the number of suspensions and length of suspensions of the
2011-2012 senior cohort compared to the 2015-2016 senior cohort after the school’s
transition to a community school in a large urban school district in the southern
United States and compared to similar high schools in the same school district?
H0: There is no significant in the number of suspensions and length of suspensions of
the 2011-2012 senior cohort compared to the 2015-2016 senior cohort after the
school’s transition to a community school in a large urban school district in the
southern United States and compared to similar high schools in the same school
district.
The dependent variable for this question was discipline. The independent variables
for this question were traditional school and community school.
The statistical tool for this question was an independent samples t test to test
statistical differences between the means of two groups.
4. What is the difference in the 2011-2012 graduation rate compared to the 2015-2016
graduation rate after the school’s transition to a community school in a large urban
school district in the southern United States and compared to similar high schools in
the same school district?
The dependent variable for this question was graduation rate. The independent
variables for this question were traditional school and community school.
Descriptive analysis was used to identity differences between the two groups.
5. What is the frequency distribution, by categories, of the 2011-2012 industry
certifications compared to the frequency distribution, by categories, of the 2015-2016
79
industry certifications after the school’s transition to a community school in a large
urban school district in the southern United States and compared to similar high
schools the same school district?
The dependent variable for this question was industry certification. The independent
variables for this question were traditional school and community school.
Descriptive analysis was used to identity differences between the two groups.
Profile of the LUS School District
According to the LUS School District 2015-2016 Pocket Guide, the district was the tenth
largest school district in the nation and the fourth largest in its state. The school district had 125
elementary schools, 3 K-8 schools, 35 middle schools, and 19 high schools, one of which had
been designated as a community school. There were 186 schools in the school district, including
exceptional, alternative, and charter schools. As of October 2015, the target school district had a
total of 197,249 students, excluding pre-kindergarten students. The district’s student racial/ethnic
distribution was as follows: Black, 27%; White, 28%; Hispanic, 38%; Asian, 5%; and Multi-
cultural, 2%. The school district was very diverse, and its students spoke 167 different languages
and dialects and had origins in 200 countries/regions.
The school district had imposed a state-of-the-art emphasis on technology and planned to
have all traditional high schools transition to digital curriculum by the 2016-2017 academic year.
The district had 13,747 instructional staff members, of which 38% of teachers had advanced
degrees. Seven of the district’s 19 traditional high schools were ranked in the top 100 in the state.
In 2014, the school district was named the co-winner of the 2014 Broad Prize for Urban
Education. It offered its students a variety of magnet programs such as aviation and aerospace,
80
foreign language, International Baccalaureate® Programme, Cambridge Program, hospitality
management, medical careers, law, and engineering. The school district was one of the state’s
leading providers of postsecondary technical education, offering career-certificate training
programs at five technical center campuses throughout the district.
The LUS Community School Model
On Tuesday, July 19, 2016, the researcher spoke with Amy Ellis, the Assistant Director
of the Center for Community Schools and Child Welfare at the University of Central Florida
regarding the implementation and expansion of the community school model in the state. At this
time, Ellis explained to the researcher the foundation, implementation, structure, and rationale
behind the community school model being used in the state. Ellis has over 20 years’ experience
in education, ranging from serving as the District SAFE Coordinator, Prevention Specialist,
Intervention Specialist, and Senior Administrator at the LUS community school. While serving
in the role of Senior Administrator, Ellis was instrumental in the start-up phase of the community
school in the LUS School District. She holds Bachelor of Arts in Music Education and Master of
Science in Music Education from the Florida State University as well as certification in
educational leadership. In her position, Ellis worked directly with school districts that were
implementing community schools throughout the southern states by providing technical
assistance, networking, and regular communication.
The LUS community school grew out of communication between the President of the
Children’s Home Society in Florida and the Dean of the College of Health and Public Affairs at
the University of Central Florida (A. Ellis, personal communication, September 28, 2016). After
discussing the need for this model in the southern state, the President of the Children’s Home
81
Society in Florida and the Dean of the College of Health and Public Affairs at the University of
Central Florida traveled to New York City to visit the Children’s Aid Society. After returning
from the visit, the efforts were underway to implement the community school model in the state.
Originally, the community school was suggested to be implemented at a local elementary school;
however, due to a lack of funding and support, a high school was selected (A. Ellis, personal
communication, September 28, 2016). The high school was targeted to add community school
services due to the low-performing status, the needs of the school and the community, and the
cooperation and support of the school’s administration.
The community school in the LUS School District considers itself to be a comprehensive
community school with a unique organization structure (Ellis, personal communication, 2016).
The organizational structure consists of four core partners, together providing an array of
services. The core partners are the LUS School District, True Health, Children’s Home Society,
and the University of Central Florida (Center for Community Schools and Child Welfare
Innovation, 2016). Additionally, JP Morgan Chase serves as the lead financial contributor. The
University of Central Florida assists with the strategic planning, data collection, and start-up,
providing sustainability assistance. The Children’s Home Society provides healthcare providers
and personnel to deliver services to students and their families. The LUS School District is
responsible for providing and maintaining the facilities for the community school programs and
providing regular and clear communication to the students, parents, and community regarding
new and continuing initiatives. True Health provides medical services for students (Center for
Community Schools and Child Welfare Innovation, 2016).
82
The community school in the LUS School District set out to impact student performance
through both short-term and long-term results from the community school practices. Some of the
short-term goals results include: (a) increasing the number of students attending school and
performing at or above grade level; (b) increasing the number of students who are exposed to
holistic health education and; students and community have access to health; (c) increasing
exposure to workforce, college, career, vocational, and/or military opportunities; and (d)
increasing the number of families, community members, and organizations that are invested in
student success at the community school. Some of the short-term goals results include: (a)
increasing the number of students who succeed academically by increasing standardized test
scores, grade, graduation rate, and decreasing the failure rate; (b) increasing the number of
community members and students who actively participate in preventive care; (c) increasing
exposure to workforce, college, career, vocational, and a military opportunities; and (d)
increasing students’ accessibility to learning in a safe, supportive, and stable environment which
includes school, home, work, church, and community.
The community school in the LUS School District developed a progress plan for the
2016-17 school year to increase the outputs and development of the school in the following
seven areas: (a) food and nutrition, (b) health and mental health services, (c) programming and
providers, (d) data and evaluation, (e) parents, (f) the University of Central Florida, and (g)
cabinet organization. In the area of food and nutrition, the community school was projected to
implement a community garden, a food pantry and snack cabinets. In the area of health and
mental health services, the community school had a goal to have the wellness college running
seamlessly with a plan of sustainability. In the area of programming and providers, the
83
community school’s goal was to identify one or two overarching providers that would tailor
programs to the needs of the community school students and form partnerships with feeder
schools and their parents. In the area of data and evaluation, the community school was projected
to implement a long-term evaluation tracking system. In the area of parents, the community
school’s goal was to sustain parental involvement and engagement. In the area of the University
of Central Florida, the community school was projected to implement a mentoring program and
to provide pedagogical trainings for teachers. No changes were projected in the final area,
cabinet organization, for the 2016-2017 school year.
Ellis explained that:
The unique thing about the LUS School District’s community school model is the use of
the four core partners. The rationale behind the four core partnership is to have the local
school district, non-profit agency, service provider, and local college/university all work
together to cover the needs of the campus and the community at large (A. Ellis, personal
communication, September 28, 2016).
The partners provide a range of services at the community school in the school’s wellness
cottage. The community school in the LUS School District opened its doors in October 2012;
however, the wellness cottage was not accessible to students until January 2015. The wellness
cottage provided behavioral health, dental, and medical services. All community schools being
implemented in the home state of this school district were anticipated to use this founding model.
In addition to the four-core partnership, the LUS School District has a unique
organization structure which consists of the leadership team, executive team, and leadership
cabinet. The organization structure also includes a community leadership council,
84
communication team, data team, grants team, community school staff, school intervention team,
outside providers, community leadership council, and student leadership council. The
Community School Leadership Cabinet is the oversight body leading the community school. The
Executive Committee is a core member group from the cabinet which can be brought together to
make quick decisions. The Leadership Council is the operational team that oversees operations
and carries out Community School Cabinet decisions at the community school level. The
Communications Team works on public relations for the community school including media
events, website, newsletters, and resource fairs. The Data Team leads data collection system
efforts for the community school. The Grants Team is established to work on any large grant
opportunities that would strengthen the operations of the community school.
Community School staff monitors the school’s efforts and works together on various
initiatives. The core positions of the Community School staff includes a Director, after school
coordinator, parent and outreach coordinator, and a school health programs coordinator.
Additional positions include the following: administrative/data coordinator, Assistant Director,
school nurse (RN or LPN), physician, mental health counselor(s), and vista volunteer(s). The
School Intervention Team works together to address and monitor school-wide intervention needs
as well as individual student needs. The outside providers works together to align their efforts
with the school and to offer services and support to one another. The Community Leadership
Council provides the community school a voice of the community. The group also helps support
all efforts within the community school as well as supplying the needs of the school when
appropriate (e.g., eye glasses). The Student Leadership Council provides the community school
with a voice of the students. The group also helps support all efforts within the community
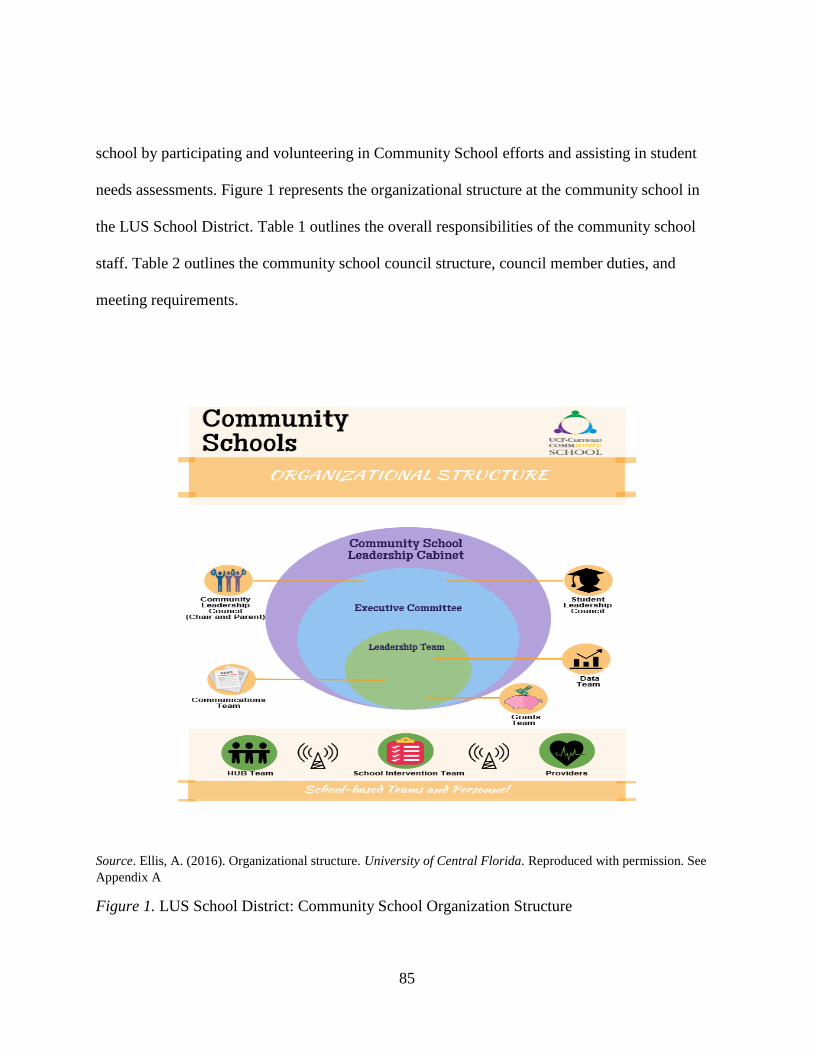
85
school by participating and volunteering in Community School efforts and assisting in student
needs assessments. Figure 1 represents the organizational structure at the community school in
the LUS School District. Table 1 outlines the overall responsibilities of the community school
staff. Table 2 outlines the community school council structure, council member duties, and
meeting requirements.
Source. Ellis, A. (2016). Organizational structure. University of Central Florida. Reproduced with permission. See
Appendix A
Figure 1. LUS School District: Community School Organization Structure
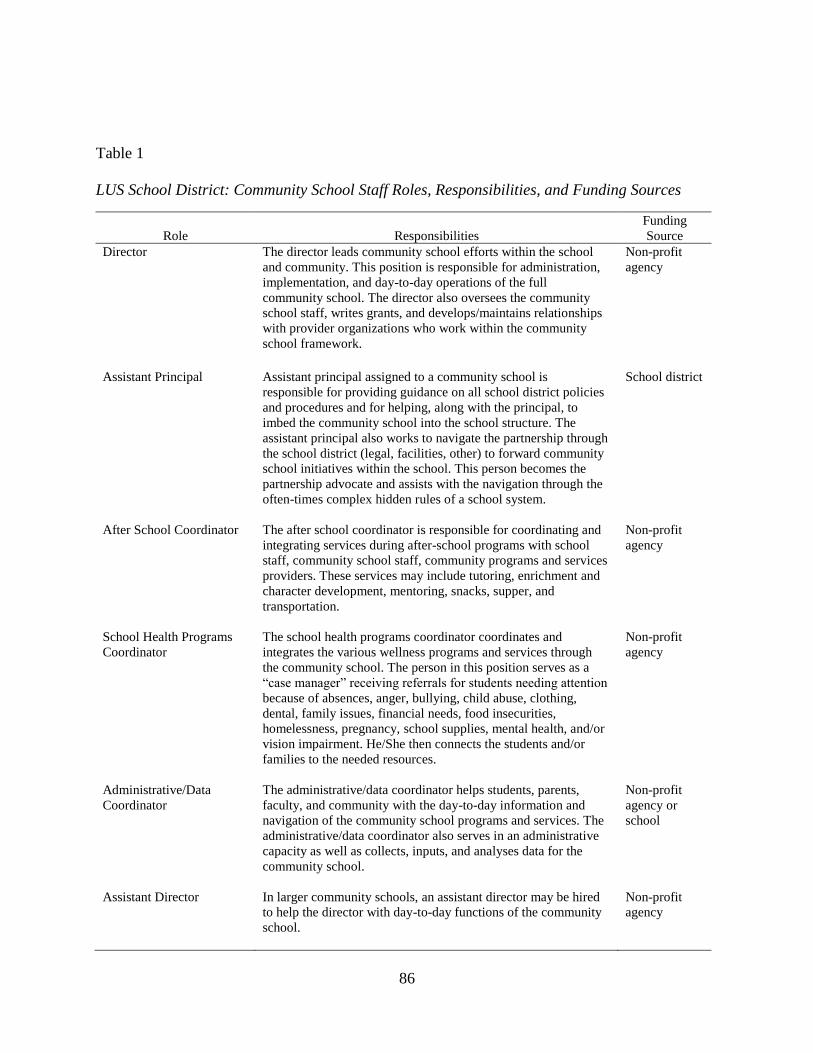
86
Table 1
LUS School District: Community School Staff Roles, Responsibilities, and Funding Sources
Role
Responsibilities
Funding
Source
Director The director leads community school efforts within the school
and community. This position is responsible for administration,
implementation, and day-to-day operations of the full
community school. The director also oversees the community
school staff, writes grants, and develops/maintains relationships
with provider organizations who work within the community
school framework.
Non-profit
agency
Assistant Principal Assistant principal assigned to a community school is
responsible for providing guidance on all school district policies
and procedures and for helping, along with the principal, to
imbed the community school into the school structure. The
assistant principal also works to navigate the partnership through
the school district (legal, facilities, other) to forward community
school initiatives within the school. This person becomes the
partnership advocate and assists with the navigation through the
often-times complex hidden rules of a school system.
School district
After School Coordinator The after school coordinator is responsible for coordinating and
integrating services during after-school programs with school
staff, community school staff, community programs and services
providers. These services may include tutoring, enrichment and
character development, mentoring, snacks, supper, and
transportation.
Non-profit
agency
School Health Programs
Coordinator
The school health programs coordinator coordinates and
integrates the various wellness programs and services through
the community school. The person in this position serves as a
“case manager” receiving referrals for students needing attention
because of absences, anger, bullying, child abuse, clothing,
dental, family issues, financial needs, food insecurities,
homelessness, pregnancy, school supplies, mental health, and/or
vision impairment. He/She then connects the students and/or
families to the needed resources.
Non-profit
agency
Administrative/Data
Coordinator
The administrative/data coordinator helps students, parents,
faculty, and community with the day-to-day information and
navigation of the community school programs and services. The
administrative/data coordinator also serves in an administrative
capacity as well as collects, inputs, and analyses data for the
community school.
Non-profit
agency or
school
Assistant Director In larger community schools, an assistant director may be hired
to help the director with day-to-day functions of the community
school.
Non-profit
agency
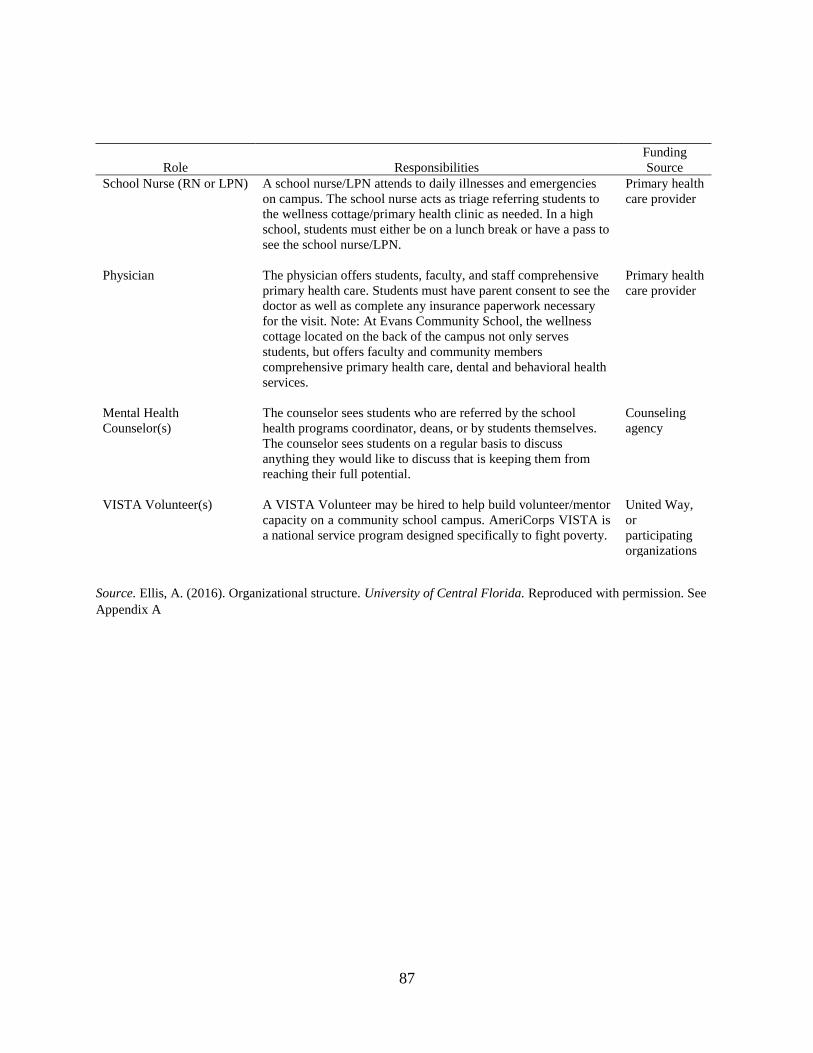
87
Role
Responsibilities
Funding
Source
School Nurse (RN or LPN) A school nurse/LPN attends to daily illnesses and emergencies
on campus. The school nurse acts as triage referring students to
the wellness cottage/primary health clinic as needed. In a high
school, students must either be on a lunch break or have a pass to
see the school nurse/LPN.
Primary health
care provider
Physician The physician offers students, faculty, and staff comprehensive
primary health care. Students must have parent consent to see the
doctor as well as complete any insurance paperwork necessary
for the visit. Note: At Evans Community School, the wellness
cottage located on the back of the campus not only serves
students, but offers faculty and community members
comprehensive primary health care, dental and behavioral health
services.
Primary health
care provider
Mental Health
Counselor(s)
The counselor sees students who are referred by the school
health programs coordinator, deans, or by students themselves.
The counselor sees students on a regular basis to discuss
anything they would like to discuss that is keeping them from
reaching their full potential.
Counseling
agency
VISTA Volunteer(s) A VISTA Volunteer may be hired to help build volunteer/mentor
capacity on a community school campus. AmeriCorps VISTA is
a national service program designed specifically to fight poverty.
United Way,
or
participating
organizations
Source. Ellis, A. (2016). Organizational structure. University of Central Florida. Reproduced with permission. See
Appendix A
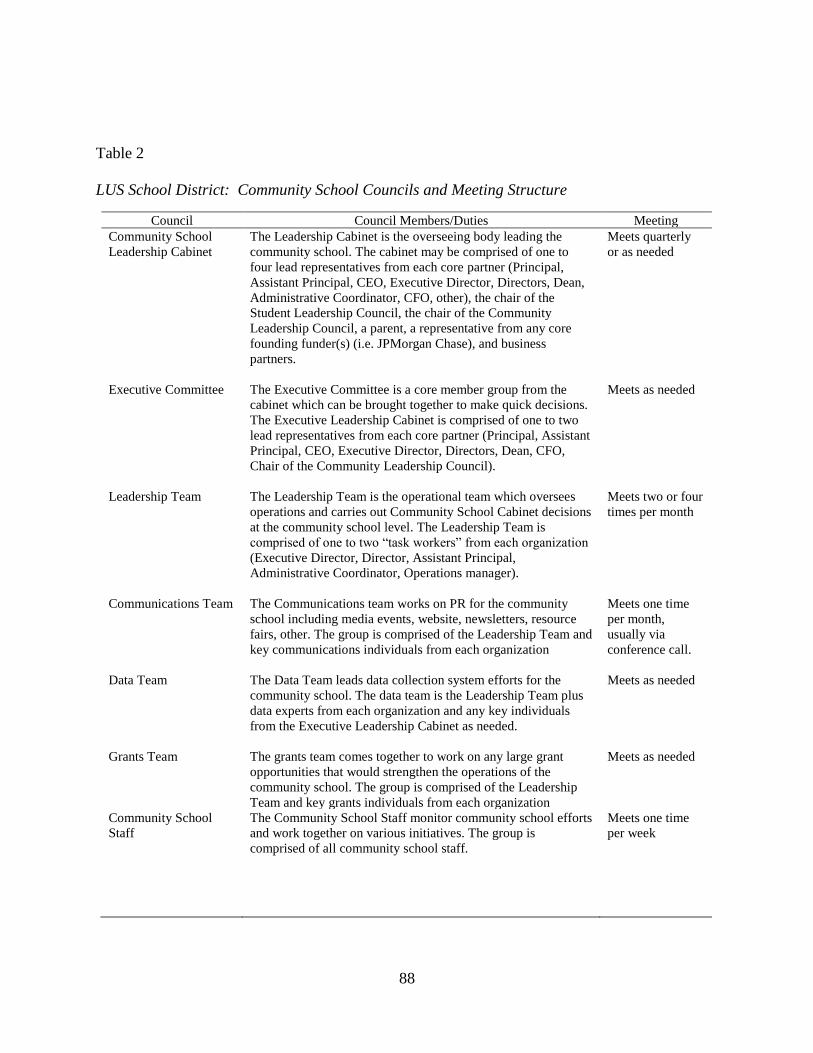
88
Table 2
LUS School District: Community School Councils and Meeting Structure
Council Council Members/Duties Meeting
Community School
Leadership Cabinet
The Leadership Cabinet is the overseeing body leading the
community school. The cabinet may be comprised of one to
four lead representatives from each core partner (Principal,
Assistant Principal, CEO, Executive Director, Directors, Dean,
Administrative Coordinator, CFO, other), the chair of the
Student Leadership Council, the chair of the Community
Leadership Council, a parent, a representative from any core
founding funder(s) (i.e. JPMorgan Chase), and business
partners.
Meets quarterly
or as needed
Executive Committee The Executive Committee is a core member group from the
cabinet which can be brought together to make quick decisions.
The Executive Leadership Cabinet is comprised of one to two
lead representatives from each core partner (Principal, Assistant
Principal, CEO, Executive Director, Directors, Dean, CFO,
Chair of the Community Leadership Council).
Meets as needed
Leadership Team The Leadership Team is the operational team which oversees
operations and carries out Community School Cabinet decisions
at the community school level. The Leadership Team is
comprised of one to two “task workers” from each organization
(Executive Director, Director, Assistant Principal,
Administrative Coordinator, Operations manager).
Meets two or four
times per month
Communications Team The Communications team works on PR for the community
school including media events, website, newsletters, resource
fairs, other. The group is comprised of the Leadership Team and
key communications individuals from each organization
Meets one time
per month,
usually via
conference call.
Data Team The Data Team leads data collection system efforts for the
community school. The data team is the Leadership Team plus
data experts from each organization and any key individuals
from the Executive Leadership Cabinet as needed.
Meets as needed
Grants Team The grants team comes together to work on any large grant
opportunities that would strengthen the operations of the
community school. The group is comprised of the Leadership
Team and key grants individuals from each organization
Meets as needed
Community School
Staff
The Community School Staff monitor community school efforts
and work together on various initiatives. The group is
comprised of all community school staff.
Meets one time
per week
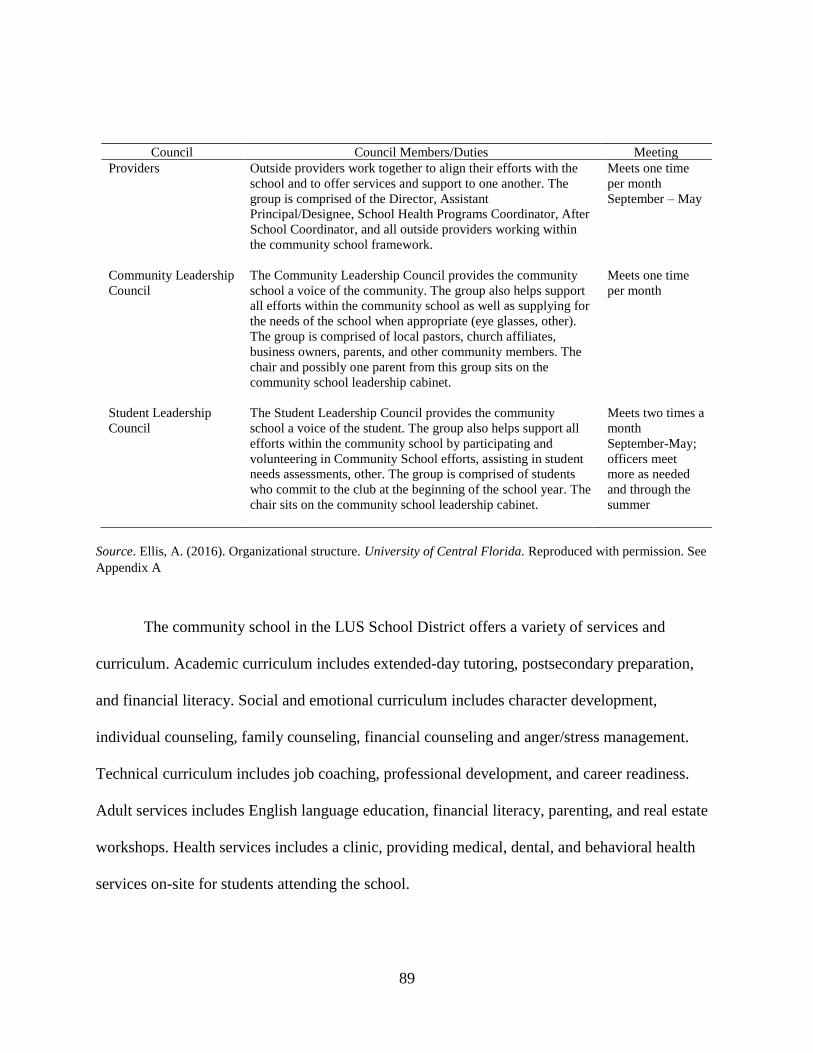
89
Council Council Members/Duties Meeting
Providers Outside providers work together to align their efforts with the
school and to offer services and support to one another. The
group is comprised of the Director, Assistant
Principal/Designee, School Health Programs Coordinator, After
School Coordinator, and all outside providers working within
the community school framework.
Meets one time
per month
September – May
Community Leadership
Council
The Community Leadership Council provides the community
school a voice of the community. The group also helps support
all efforts within the community school as well as supplying for
the needs of the school when appropriate (eye glasses, other).
The group is comprised of local pastors, church affiliates,
business owners, parents, and other community members. The
chair and possibly one parent from this group sits on the
community school leadership cabinet.
Meets one time
per month
Student Leadership
Council
The Student Leadership Council provides the community
school a voice of the student. The group also helps support all
efforts within the community school by participating and
volunteering in Community School efforts, assisting in student
needs assessments, other. The group is comprised of students
who commit to the club at the beginning of the school year. The
chair sits on the community school leadership cabinet.
Meets two times a
month
September-May;
officers meet
more as needed
and through the
summer
Source. Ellis, A. (2016). Organizational structure. University of Central Florida. Reproduced with permission. See
Appendix A
The community school in the LUS School District offers a variety of services and
curriculum. Academic curriculum includes extended-day tutoring, postsecondary preparation,
and financial literacy. Social and emotional curriculum includes character development,
individual counseling, family counseling, financial counseling and anger/stress management.
Technical curriculum includes job coaching, professional development, and career readiness.
Adult services includes English language education, financial literacy, parenting, and real estate
workshops. Health services includes a clinic, providing medical, dental, and behavioral health
services on-site for students attending the school.
90
Selection of Participants
The population and sample for this study consisted of 405 students classified as seniors
for the 2011-2012 academic year and 515 students classified as seniors for the 2015-2016
academic year attending a community school in a large urban school district in the southern U.S.,
referred to as the LUS School District. The comparative population and sample groups for this
study, Group 1 and Group 2, consisted of all students classified as seniors for the 2011-2012 and
2015-2016 academic years attending like high schools, High School A and High School B, in the
LUS School District. The sample for High School A/Group 1 consisted of 369 students classified
as seniors for the 2011-2012 academic year and 541 students classified as seniors for the 2015-
2016 academic year. The sample for High School B/Group 2 consisted of 143 students classified
as seniors for the 2011-2012 academic year and 148 students classified as seniors for the 2015-
2016 school year.
Comparison schools were selected by the researcher as like high schools according to
similarity in school population, such as demographics, percentage of minority students, and
percentage of Limited English Proficiency/English Language Learners students; free and reduced
lunch rate, and Title I classification. These data were retrieved from the State Department of
Education 2014-2015 school grade simulation report. Table 3 reflects the composition of the
LUS Community School and the two comparison schools.
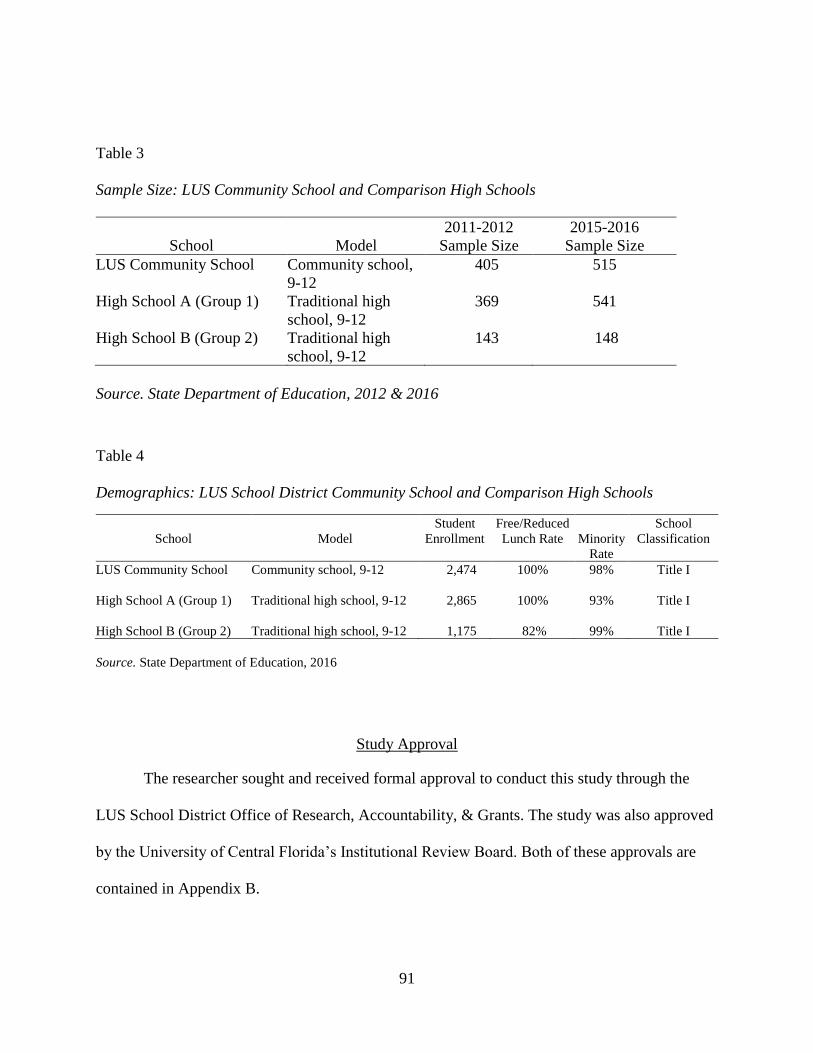
91
Table 3
Sample Size: LUS Community School and Comparison High Schools
School
Model
2011-2012
Sample Size
2015-2016
Sample Size
LUS Community School
Community school,
9-12
405
515
High School A (Group 1)
Traditional high
school, 9-12
369 541
High School B (Group 2) Traditional high
school, 9-12
143 148
Source. State Department of Education, 2012 & 2016
Table 4
Demographics: LUS School District Community School and Comparison High Schools
School
Model
Student
Enrollment
Free/Reduced
Lunch Rate
Minority
Rate
School
Classification
LUS Community School
Community school, 9-12 2,474
100%
98% Title I
High School A (Group 1)
Traditional high school, 9-12 2,865 100% 93%
Title I
High School B (Group 2) Traditional high school, 9-12 1,175 82% 99% Title I
Source. State Department of Education, 2016
Study Approval
The researcher sought and received formal approval to conduct this study through the
LUS School District Office of Research, Accountability, & Grants. The study was also approved
by the University of Central Florida’s Institutional Review Board. Both of these approvals are
contained in Appendix B.
92
Data Collection
For Research Questions 1-5, data were obtained from the LUS School District to identify
students classified as seniors for the 2011-2012 and 2015-2016 academic school years. For
Research Question 1, the student information service database from the LUS School District
provided cumulative grade point average (GPA) data for seniors for the 2011-2012 academic
year before the school’s transition to a community school and senior cumulative grade point
average (GPA) data for the 2015-2016 school year after the school’s transition to a community
school. Student enrollment numbers and data were also obtained from the State Department of
Education.
For Research Question 2, attendance data were obtained from LUS School District for
students classified as seniors for the 2011-2012 and 2015-2016 academic school years at a
community school in a large urban school district in the southern United States and similar high
schools in the same school district. Attendance was determined by the number of days students
were present of the possible 180 school days. Attendance also included number of days absent
and number of unexcused absences. For Research Question 3, the Office of Accountability,
Research & Assessment provided historical discipline data for the following school years: 2011-
2012 and 2015-2016. The discipline data included the number of suspensions and length of
suspensions overall.
For Research Question 4, data were obtained from the state’s database to determine
graduation rates for the following years: 2011-2012 and 2015-2016. The researcher also used the
state’s information service database to compile graduation rates of the like high schools in the
LUS School District for the following years: 2011-2012 and 2015-2016. For Research Question
93
5, both quantitative and qualitative data were obtained from the State Department of Education
database to determine the frequency and categories of industry certification for the following
years: 2011-2012 and 2015-2016. The State Department of Education information service
database was also used to determine the frequency and categories of industry certification of
target high schools in this study for the following years: 2011-2012 and 2015-2016.
Data Analysis
This study was conducted to determine the effectiveness of the community school
practices. Data were collected directly from the LUS School District’s student database and the
State Department of Education. All student information was de-identified for confidentiality, and
the researcher cross-referenced all reports. In the original reports from the LUS, students were
assigned a numeric code. The data collected directly from the LUS School District consisted of
two reports. The data reports received from the LUS School District were itemized by course per
student in an effort for the researcher to calculate the individual student’s cumulative grade
period average based on the student’s final grade in courses taken. The researcher analyzed each
of the reports, grouped the community school in a large urban school district and comparisons
schools and grouped the individual students according to their assigned numeric code. The first
report labeled ‘final_1112’ consisted of a total of 28,556 courses; 13,108 for the community
school in a large urban school district, 10,853 courses for High School A (Group 1) and 4,595
courses for High School B (Group 2).
The second report labeled as ‘final_1516’ consisted a total of 53,754 courses; 23,763
courses for LUS Community School, 23,327 courses for High School A (Group 1) and 6,664
courses High School B (Group 2). Courses included in both reports dated back to the 2006-2007,
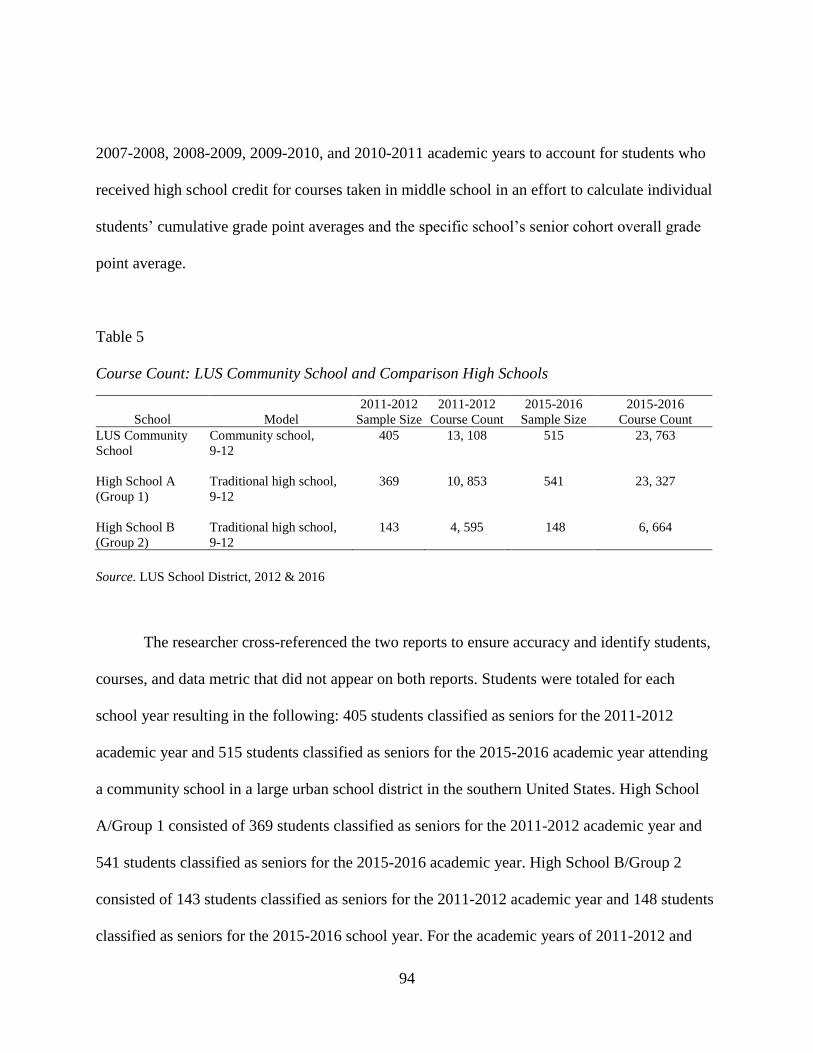
94
2007-2008, 2008-2009, 2009-2010, and 2010-2011 academic years to account for students who
received high school credit for courses taken in middle school in an effort to calculate individual
students’ cumulative grade point averages and the specific school’s senior cohort overall grade
point average.
Table 5
Course Count: LUS Community School and Comparison High Schools
School
Model
2011-2012
Sample Size
2011-2012
Course Count
2015-2016
Sample Size
2015-2016
Course Count
LUS Community
School
Community school,
9-12
405
13, 108 515
23, 763
High School A
(Group 1)
Traditional high school,
9-12
369 10, 853 541 23, 327
High School B
(Group 2)
Traditional high school,
9-12
143 4, 595 148 6, 664
Source. LUS School District, 2012 & 2016
The researcher cross-referenced the two reports to ensure accuracy and identify students,
courses, and data metric that did not appear on both reports. Students were totaled for each
school year resulting in the following: 405 students classified as seniors for the 2011-2012
academic year and 515 students classified as seniors for the 2015-2016 academic year attending
a community school in a large urban school district in the southern United States. High School
A/Group 1 consisted of 369 students classified as seniors for the 2011-2012 academic year and
541 students classified as seniors for the 2015-2016 academic year. High School B/Group 2
consisted of 143 students classified as seniors for the 2011-2012 academic year and 148 students
classified as seniors for the 2015-2016 school year. For the academic years of 2011-2012 and
95
2015-2016 students were categorized by school and student identification number using
Microsoft Excel.
To answer Research Question 1, cumulative grade point average (GPA) data were used to
determine if there was a difference in student academic performance between the 2011-2012
senior cohort attending the school before the school’s transition to a community school and that
of the 2015-2016 senior cohort after the school’s transition to a community school. Grade point
average (GPA) reports provided by the LUS School District were sorted and analyzed using a
Microsoft Excel spreadsheet consisting of columns labeled: student assigned numeric code,
gender, race, course number, course title, final score, credit attempted, and credit received.
Additional data used to answer the first research question were received from the State
Department of Education. Cumulative grade point average data received from the State
Department of Education included only data for the community school. It did not include
cumulative grade point average data for the two comparison schools, High School A and High
School B. Cumulative grade point average means were used to generate the independent samples
t-test to find the difference between the means with significance.
To answer Research Question 2, attendance data were obtained from the LUS School
District to determine if there was a difference in attendance between the 2011-2012 senior cohort
attending before the school’s transition to a community school compared to the 2015-2016 senior
cohort after the school’s transition to a community school and compared to similar high schools
in the same school district. Attendance data were identified using Microsoft Excel, consisting of
columns labeled: student assigned numeric code, race, gender, number of days present, number
of days absence, and number of possible days. Students with a number of attendance days
96
totaling more than 180 were not included in the data analysis. Students whose total days of
attendance were greater than the number of school days in the school year were removed to
ensure that the total number of days were the same for all students included in the statistical
analysis. The t-test performed compares the means of the percentages of students attending the
LUS Community School and comparison schools, High School A and High School B, for the
following school years: 2011-2012 and 2015-2016. In an effort to provide a more in-depth
display of attendance, the researcher sought to provide additional data pertaining to attendance to
provide further evidence of the attendance policies and guidelines in the LUS School District.
According to the LUS School District’s 2011-2012 Attendance Policy and Procedures, “In order
to earn credit for a class, students in grades 9-12 must be present for a total of 135 hours per
class during the school year. In order to be in attendance for 135 hours, the student can have no
more than 10 unexcused absences in a semester or 20 unexcused absences in a school year”
(p.6). Days that students miss due to suspension were considered excused absences (LUS School
District, 2011-2012, 2015-2016). In regard to truancy, when a student has five “tardies” to school
or five early departures from school this was counted as one unexcused absence LUS School
District (2011-2012, 2015-2016).
To answer Research Question 3, discipline data were identified and coded using a
Microsoft Excel spreadsheet. The discipline spreadsheet contained columns labeled: student,
assigned numeric code, gender, race, number of suspensions days, and length of suspension
overall. The suspension means were used to generate the independent samples t-test to find the
difference between the means with significance.
97
To answer Research Question 4, graduation rate data were obtained from the State
Department of Education database for the following years: 2011-2012 and 2015-2016.
Additionally, the researcher recorded and reported graduation rate data for the following years:
2012-2013, 2013-2014, and 2014-2015. The data were compiled into a Microsoft Excel
spreadsheet with the following columns: academic school year, school name, school code, school
grade, cohort number, free and reduced lunch percentage, and graduation rate. The graduation
rate was analyzed for changes.
To answer Research Question 5, the industry certification report received from the State
Department of Education’s Office of Career Technical Education was analyzed using a
Microsoft Excel spreadsheet with the following columns: student, assigned numeric code, school
name, industry certification identification, industry certification name, grade, number taken, and
number passed. Tables were also created to display data and better display the comparison of like
schools. To analyze the industry certifications, frequency tables were used to compare the
changes of descriptive statistics.
Summary
The procedures and methods that were used to conduct the study have been presented in
this chapter. Quantitative and qualitative research methods were used to analyze the data and
respond to the five research questions. The researcher presented a restatement of the purpose of
the study, a profile of the target school district and community school along with demographics
of the community high school and the comparison high schools. The sources of data used to
conduct the study were explained as were the data collection procedures and methods of data
analysis. The linkage between the research questions, research method, variables, data sources,

98
and data analysis is shown in Table 6. Results of the data analysis and discussion of the findings
are presented in Chapters 4 and 5.
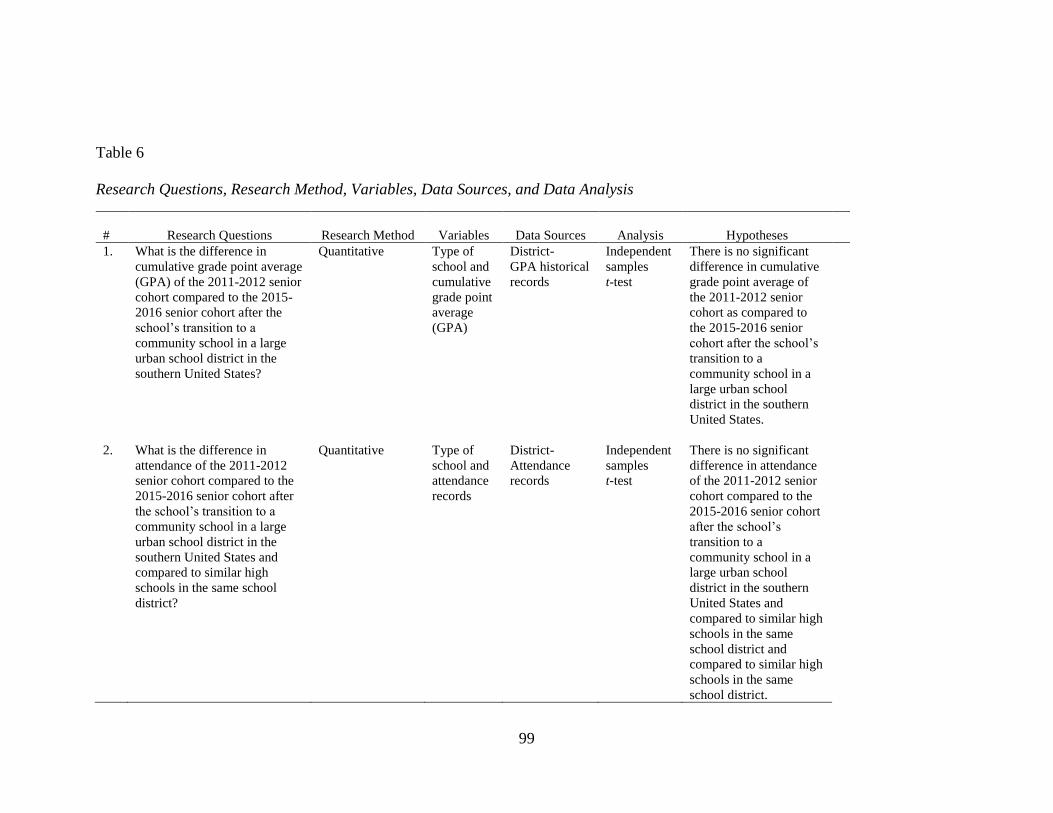
99
Table 6
Research Questions, Research Method, Variables, Data Sources, and Data Analysis
#
Research Questions
Research Method
Variables
Data Sources
Analysis
Hypotheses
1. What is the difference in
cumulative grade point average
(GPA) of the 2011-2012 senior
cohort compared to the 2015-
2016 senior cohort after the
school’s transition to a
community school in a large
urban school district in the
southern United States?
Quantitative Type of
school and
cumulative
grade point
average
(GPA)
District-
GPA historical
records
Independent
samples
t-test
There is no significant
difference in cumulative
grade point average of
the 2011-2012 senior
cohort as compared to
the 2015-2016 senior
cohort after the school’s
transition to a
community school in a
large urban school
district in the southern
United States.
2. What is the difference in
attendance of the 2011-2012
senior cohort compared to the
2015-2016 senior cohort after
the school’s transition to a
community school in a large
urban school district in the
southern United States and
compared to similar high
schools in the same school
district?
Quantitative Type of
school and
attendance
records
District-
Attendance
records
Independent
samples
t-test
There is no significant
difference in attendance
of the 2011-2012 senior
cohort compared to the
2015-2016 senior cohort
after the school’s
transition to a
community school in a
large urban school
district in the southern
United States and
compared to similar high
schools in the same
school district and
compared to similar high
schools in the same
school district.
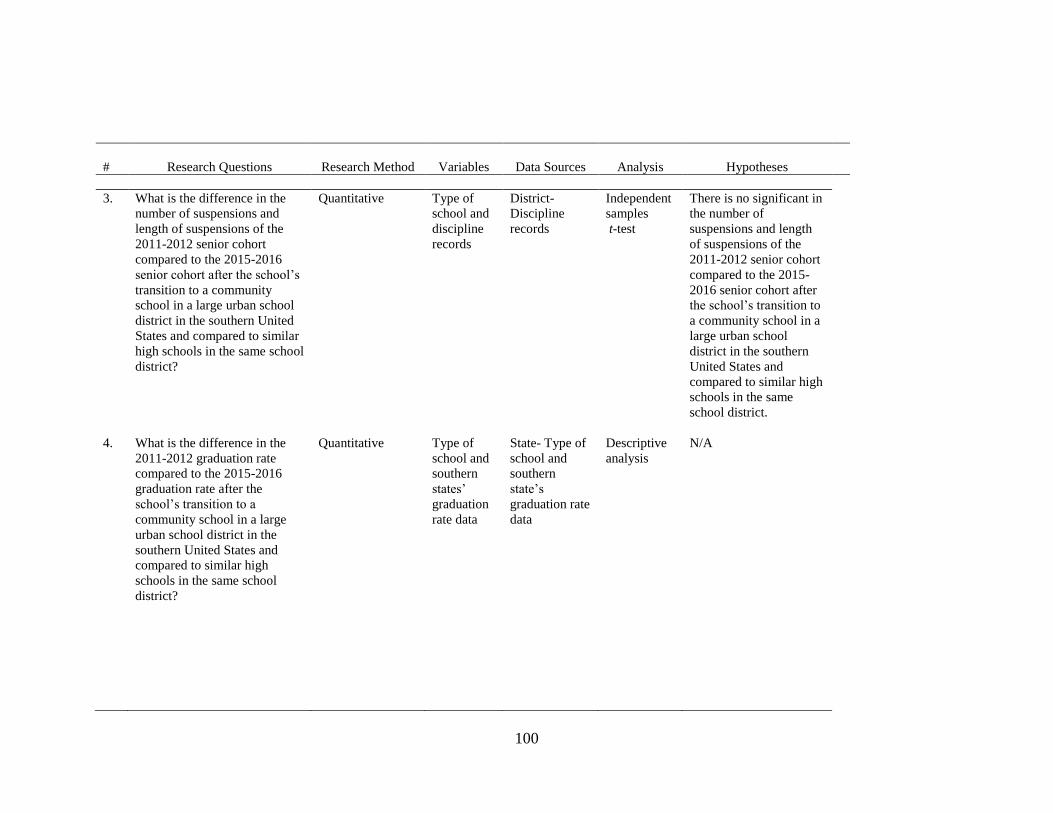
100
#
Research Questions
Research Method
Variables
Data Sources
Analysis
Hypotheses
3. What is the difference in the
number of suspensions and
length of suspensions of the
2011-2012 senior cohort
compared to the 2015-2016
senior cohort after the school’s
transition to a community
school in a large urban school
district in the southern United
States and compared to similar
high schools in the same school
district?
Quantitative Type of
school and
discipline
records
District-
Discipline
records
Independent
samples
t-test
There is no significant in
the number of
suspensions and length
of suspensions of the
2011-2012 senior cohort
compared to the 2015-
2016 senior cohort after
the school’s transition to
a community school in a
large urban school
district in the southern
United States and
compared to similar high
schools in the same
school district.
4. What is the difference in the
2011-2012 graduation rate
compared to the 2015-2016
graduation rate after the
school’s transition to a
community school in a large
urban school district in the
southern United States and
compared to similar high
schools in the same school
district?
Quantitative Type of
school and
southern
states’
graduation
rate data
State- Type of
school and
southern
state’s
graduation rate
data
Descriptive
analysis
N/A
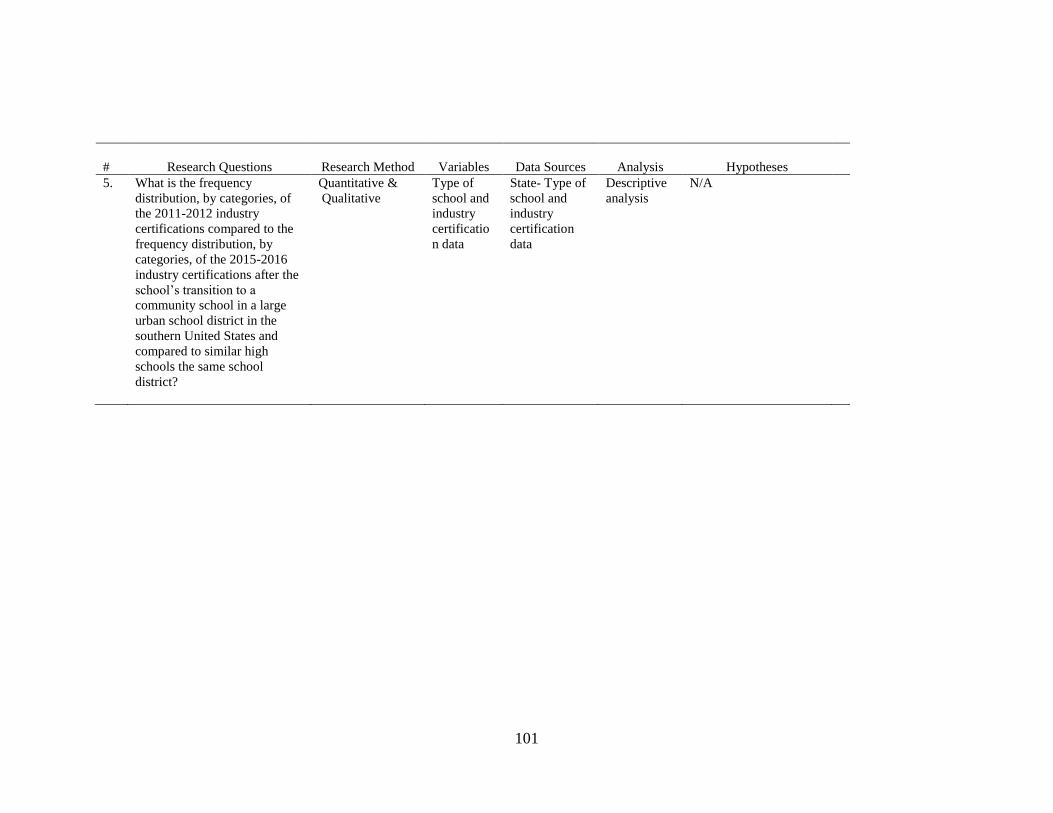
101
#
Research Questions
Research Method
Variables
Data Sources
Analysis
Hypotheses
5. What is the frequency
distribution, by categories, of
the 2011-2012 industry
certifications compared to the
frequency distribution, by
categories, of the 2015-2016
industry certifications after the
school’s transition to a
community school in a large
urban school district in the
southern United States and
compared to similar high
schools the same school
district?
Quantitative &
Qualitative
Type of
school and
industry
certificatio
n data
State- Type of
school and
industry
certification
data
Descriptive
analysis
N/A
102
CHAPTER 4
DATA ANALYSIS
Introduction
This study sought to determine if the community school practices such as extended
enrichment hours, character development, anger management, counseling, tutoring and mental
and physical healthcare has an impact on student performance at a community school in a large
urban school district in the southern United States. The areas designated to determine student
performance include cumulative grade point averages (GPA) for the senior cohort of 2011-2012
and 2015-2016, the difference in attendance of the 2011-2012 senior cohort compared to the
2015-2016 senior cohort, difference in number of suspensions and length of suspensions overall
of the 2011-2012 senior cohort compared to the 2015-2016 senior cohort, 2011-2012 graduation
rate compared to the 2015-2016 graduation rate, and the frequency distribution, by categories, of
the 2011-2012 industry certifications compared to the frequency distribution, by categories, of
the 2015-2016 industry certifications.
Additionally, this study sought to compare student performance to similar schools in the
categories of attendance, discipline, graduation rate and the frequency distribution, by categories,
of the industry certifications. High schools were selected based on similarity in the percentage of
minority students, free and reduced lunch rate, and Title I classification.
Independent samples t tests were run to analyze the impact of the community school
practices of the sample group. An independent samples t test was an appropriate analysis for this
study because it compares the means of two independent groups in an effort to determine if the
means are statistically different. Independent samples t tests are used to test statistical differences
between the means of two scores, statistical differences between the means of two interventions,
103
and statistical difference between the means of two groups. An independent t test allowed the
researcher to test the impact of the community school practices on the identified population and
sample and compared to the comparisons population and sample at similar high schools.
Descriptive Statistics
Population and Sample
The population for this study were the students attending a community school in a large
urban school district in the southern United States. The sample for this study consisted of 405
students classified as seniors for the 2011-2012 academic year and 515 students classified as
seniors for the 2015-2016 academic year attending the community school, referred to as the LUS
Community School. The comparative population, Group 1 and Group 2, for this study consisted
of all students classified as seniors for the 2011-2012 and 2015-2016 academic years attending
like high schools, High School A and High School B, in the LUS School District. The sample for
High School A/Group 1 consisted of 369 students classified as seniors for the 2011-2012
academic year and 541 students classified as seniors for the 2015-2016 academic year.
The sample for High School B/Group 2 consisted of 143 students classified as seniors for
the 2011-2012 academic year and 148 students classified as seniors for the 2015-2016 school
year. Comparison schools were selected by the researcher as like high schools according to
similarity in school population and demographics such as the percentage of minority students,
and the percentage of Limited English Proficiency/English Language Learners students; free and
reduced lunch rate, and Title I classification
104
Stability Rate
During the five years involved in this study 2011-2016, data analysis for the senior
cohorts at the LUS Community School was impacted by student mobility. Student mobility has
been cited as a limitation in this study. Consistent enrollment or mobility rate transitioned to the
stability rate in the 2001-2002 school year in the State in the southern United States where the
community school is located. According to the State Department of Education (2017), the
stability rate is “The percentage of students from the October membership count who are still
present in the second semester (February count)”. The researcher attempted to report on the
stability; however a few gaps were noted in the reporting of stability rate by the State
Department of Education. In 2011-2012, the LUS School District had a stability rate of 91%
(State Department of Education, 2012).
During the 2012-2013 school year, this stability rate increased to 93% (State Department
of Education, 2013). During the 2013-2014 school year there was a gradual increase in stability
rate from 93% to 93.6% (State Department of Education, 2014). During the time of this research,
the stability rate for the 2014-2015 and 2015-2016 school years were not available in the State
Department’s online educational portal. The State Department of Education informed the
researcher that the 2014-2015 and 2015-2016 stability rates were not available due to this
indicator possibly being replaced with another measure. The gaps in the research reported by the
State Department of Education prevented the researcher from determining the stability of student
membership in the LUS School District.
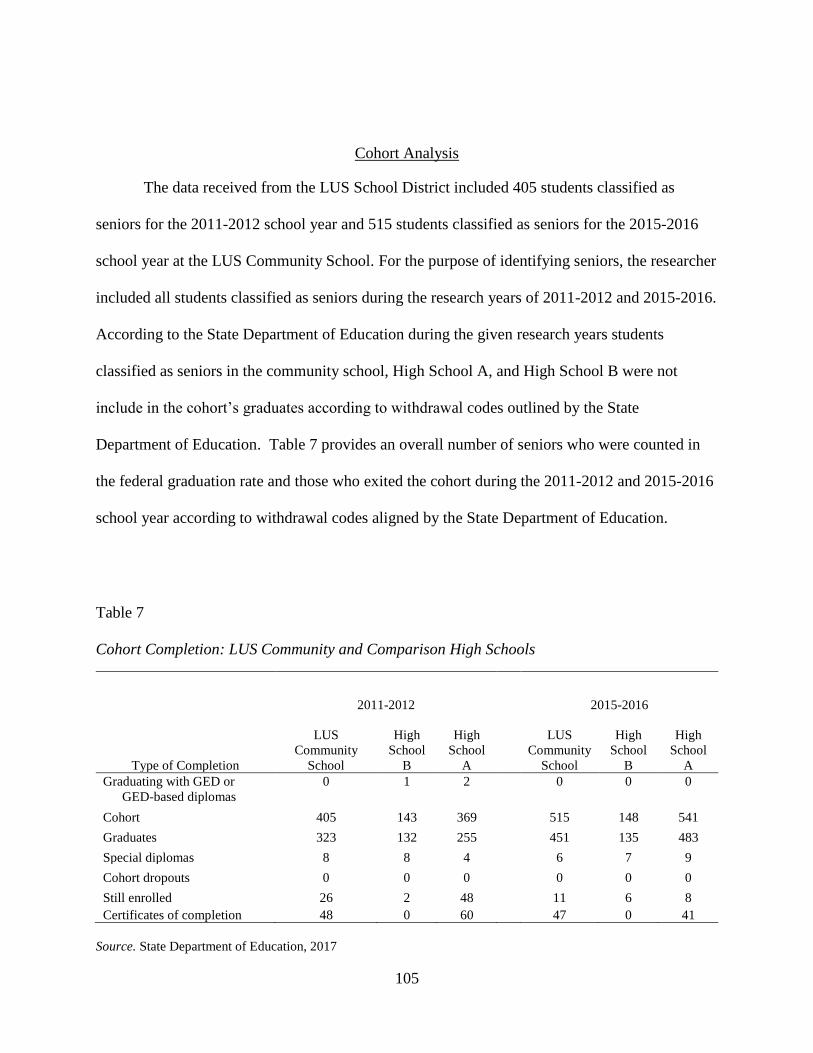
105
Cohort Analysis
The data received from the LUS School District included 405 students classified as
seniors for the 2011-2012 school year and 515 students classified as seniors for the 2015-2016
school year at the LUS Community School. For the purpose of identifying seniors, the researcher
included all students classified as seniors during the research years of 2011-2012 and 2015-2016.
According to the State Department of Education during the given research years students
classified as seniors in the community school, High School A, and High School B were not
include in the cohort’s graduates according to withdrawal codes outlined by the State
Department of Education. Table 7 provides an overall number of seniors who were counted in
the federal graduation rate and those who exited the cohort during the 2011-2012 and 2015-2016
school year according to withdrawal codes aligned by the State Department of Education.
Table 7
Cohort Completion: LUS Community and Comparison High Schools
2011-2012
2015-2016
Type of Completion
LUS
Community
School
High
School
B
High
School
A
LUS
Community
School
High
School
B
High
School
A
Graduating with GED or
GED-based diplomas
0 1 2 0 0 0
Cohort 405 143 369 515 148 541
Graduates 323 132 255 451 135 483
Special diplomas 8 8 4 6 7 9
Cohort dropouts 0 0 0 0 0 0
Still enrolled 26 2 48 11 6 8
Certificates of completion 48 0 60 47 0 41
Source. State Department of Education, 2017
106
During the 2011-2012 school year, of the 405 seniors in the sample at the LUS
Community School had 8 seniors received a special diploma (0.02%). During the 2015-2016
school year, of the 515 seniors in the sample at the LUS Community School 6 seniors received a
special diploma (0.01%). During the 2011-2012 school year, of the 369 seniors in the sample at
High School A, four seniors (0.01%) received a special diploma. During the 2015-2016 school
year, of the 541 seniors in the sample, nine students (0.02%) received a special diploma. During
the 2011-2012 school year, of the 143 seniors in the sample at High School B, eight seniors
(0.06%) received a special diploma. During the 2015-2015 school year, of the 148 seniors in the
sample, seven (0.05%) received a special diploma.
During the 2011-2012 school year, of the 405 seniors in the sample at the LUS
Community School, 26 seniors (0.06%) were still enrolled at the end of Survey 5. During the
2015-2016 school year at the LUS Community School, of the 515 seniors in the sample, 11
seniors (0.02%) were still enrolled at the end of Survey 5. During the 2011-2012 school year, of
the 369 seniors in the sample at High School A, 48 students (0.13%) were still enrolled at the end
of Survey 5. During the 2015-2016 school year, of the 541 seniors at High School A, eight
students were still enrolled at the end of Survey 5. During the 2011-2012 school year, of the 143
seniors in the sample at High School B, two seniors (0.01%) were still enrolled at the end of
Survey 5. During the 2015-2016 school year, of the 148 seniors in the sample, six seniors
(0.04%) were still enrolled at the end of Survey 5.
During the 2011-2012 school year, of the 405 seniors in the sample at the LUS
Community School 48 (0.12%) seniors received a certificate of completion. During the 2015-
2016 school year at the LUS Community School, of the 515 seniors in the sample 47 seniors
107
(0.09%) received a certificate of completion. During the 2011-2012 school year, of the 369
seniors in the sample at High School A, 60 seniors (0.16%) received a certificate of completion.
During the 2015-2016 school, of the 541 seniors in sample at High School A, 41 seniors (0.08%)
received a certificate of completion. During the 2011-2012, of the 143 seniors in the sample at
High School B, no students received a certificate of completion. During the 2015-2016 school
year, of the 148 seniors in the sample at High School B, no seniors received a certificate of
completion. For the 2011-2012 and 2015-2016 school years, the LUS Community School, High
School A, or High School B did not report any dropouts. Table 8 displays data for the sample by
race and Table 9 displays data for the sample by gender.
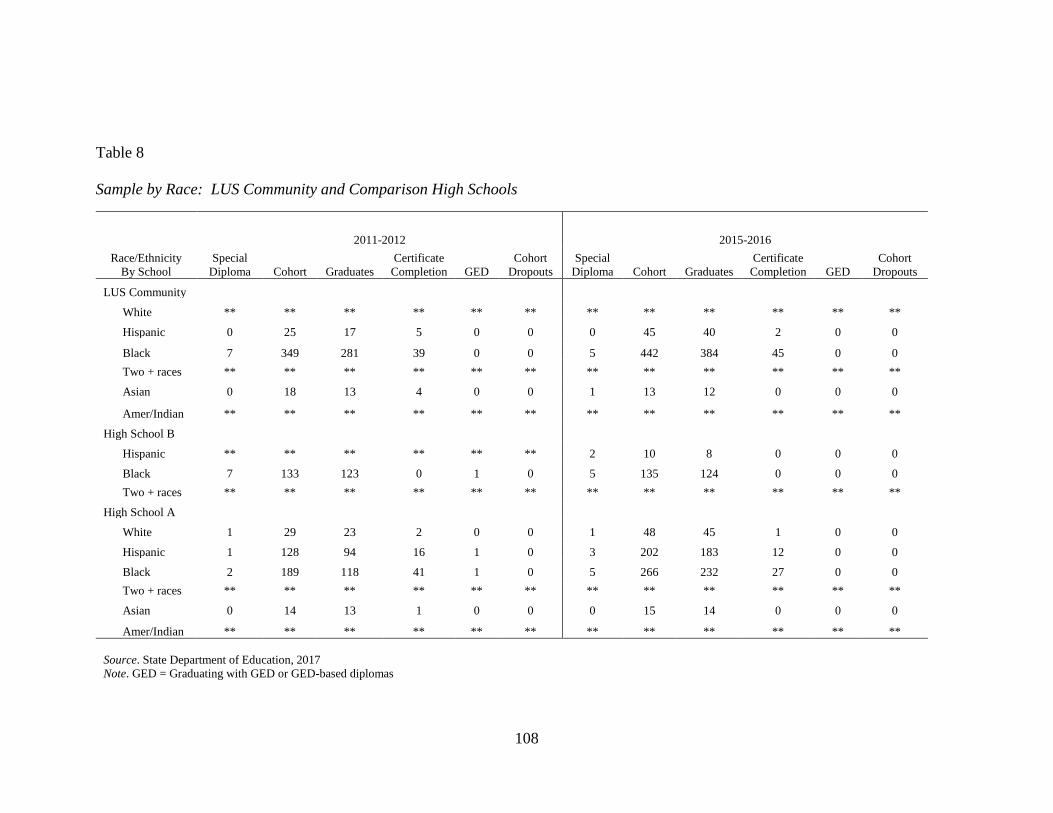
108
Table 8
Sample by Race: LUS Community and Comparison High Schools
2011-2012 2015-2016
Race/Ethnicity
By School
Special
Diploma Cohort Graduates
Certificate
Completion GED
Cohort
Dropouts
Special
Diploma Cohort Graduates
Certificate
Completion GED
Cohort
Dropouts
LUS Community
White ** ** ** ** ** ** ** ** ** ** ** **
Hispanic 0 25 17 5 0 0 0 45 40 2 0 0
Black 7 349 281 39 0 0 5 442 384 45 0 0
Two + races ** ** ** ** ** ** ** ** ** ** ** **
Asian 0 18 13 4 0 0 1 13 12 0 0 0
Amer/Indian ** ** ** ** ** ** ** ** ** ** ** **
High School B
Hispanic ** ** ** ** ** ** 2 10 8 0 0 0
Black 7 133 123 0 1 0 5 135 124 0 0 0
Two + races ** ** ** ** ** ** ** ** ** ** ** **
High School A
White 1 29 23 2 0 0 1 48 45 1 0 0
Hispanic 1 128 94 16 1 0 3 202 183 12 0 0
Black 2 189 118 41 1 0 5 266 232 27 0 0
Two + races ** ** ** ** ** ** ** ** ** ** ** **
Asian 0 14 13 1 0 0 0 15 14 0 0 0
Amer/Indian ** ** ** ** ** ** ** ** ** ** ** **
Source. State Department of Education, 2017
Note. GED = Graduating with GED or GED-based diplomas
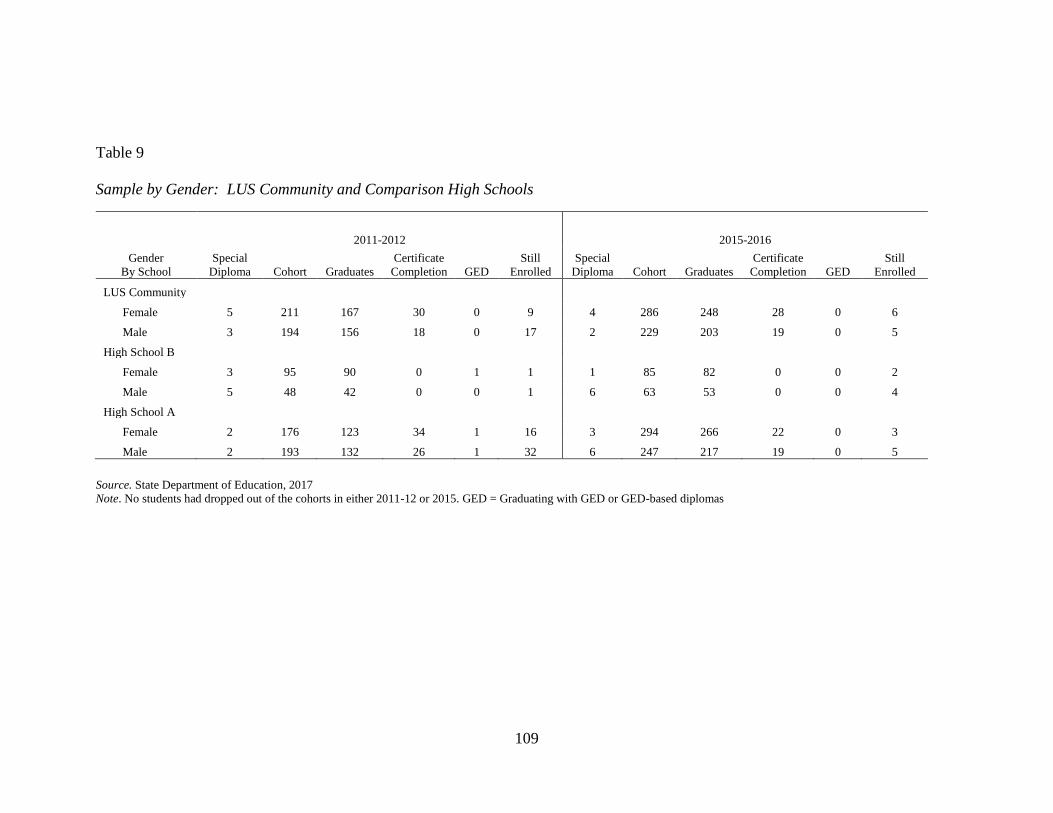
109
Table 9
Sample by Gender: LUS Community and Comparison High Schools
2011-2012 2015-2016
Gender
By School
Special
Diploma Cohort Graduates
Certificate
Completion GED
Still
Enrolled
Special
Diploma Cohort Graduates
Certificate
Completion GED
Still
Enrolled
LUS Community
Female 5 211 167 30 0 9 4 286 248 28 0 6
Male 3 194 156 18 0 17 2 229 203 19 0 5
High School B
Female 3 95 90 0 1 1 1 85 82 0 0 2
Male 5 48 42 0 0 1 6 63 53 0 0 4
High School A
Female 2 176 123 34 1 16 3 294 266 22 0 3
Male 2 193 132 26 1 32 6 247 217 19 0 5
Source. State Department of Education, 2017
Note. No students had dropped out of the cohorts in either 2011-12 or 2015. GED = Graduating with GED or GED-based diplomas
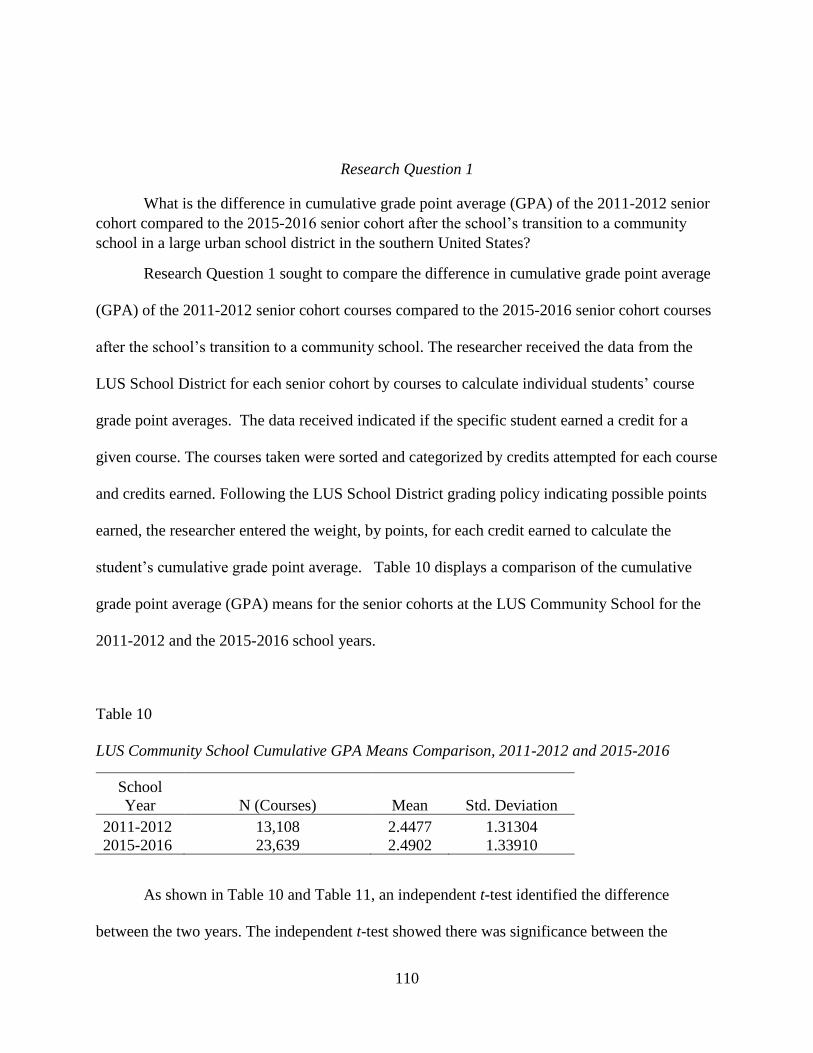
110
Research Question 1
What is the difference in cumulative grade point average (GPA) of the 2011-2012 senior
cohort compared to the 2015-2016 senior cohort after the school’s transition to a community
school in a large urban school district in the southern United States?
Research Question 1 sought to compare the difference in cumulative grade point average
(GPA) of the 2011-2012 senior cohort courses compared to the 2015-2016 senior cohort courses
after the school’s transition to a community school. The researcher received the data from the
LUS School District for each senior cohort by courses to calculate individual students’ course
grade point averages. The data received indicated if the specific student earned a credit for a
given course. The courses taken were sorted and categorized by credits attempted for each course
and credits earned. Following the LUS School District grading policy indicating possible points
earned, the researcher entered the weight, by points, for each credit earned to calculate the
student’s cumulative grade point average. Table 10 displays a comparison of the cumulative
grade point average (GPA) means for the senior cohorts at the LUS Community School for the
2011-2012 and the 2015-2016 school years.
Table 10
LUS Community School Cumulative GPA Means Comparison, 2011-2012 and 2015-2016
School
Year N (Courses) Mean Std. Deviation
2011-2012 13,108 2.4477 1.31304
2015-2016 23,639 2.4902 1.33910
As shown in Table 10 and Table 11, an independent t-test identified the difference
between the two years. The independent t-test showed there was significance between the
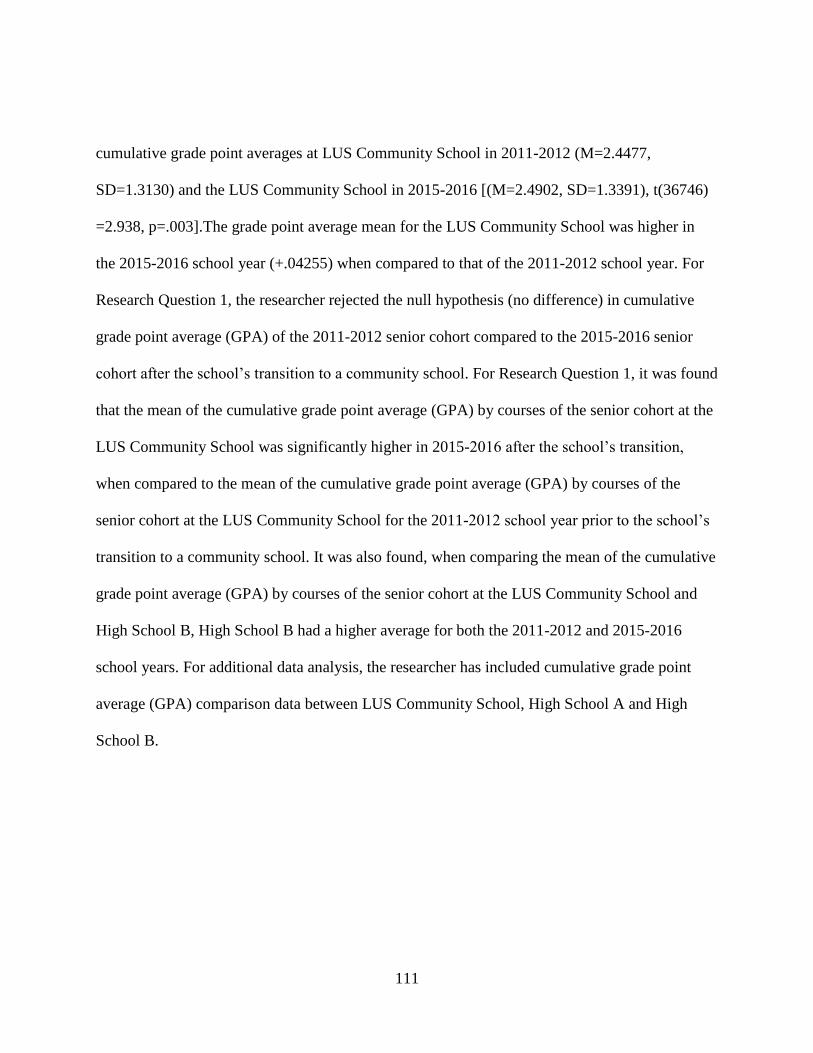
111
cumulative grade point averages at LUS Community School in 2011-2012 (M=2.4477,
SD=1.3130) and the LUS Community School in 2015-2016 [(M=2.4902, SD=1.3391), t(36746)
=2.938, p=.003].The grade point average mean for the LUS Community School was higher in
the 2015-2016 school year (+.04255) when compared to that of the 2011-2012 school year. For
Research Question 1, the researcher rejected the null hypothesis (no difference) in cumulative
grade point average (GPA) of the 2011-2012 senior cohort compared to the 2015-2016 senior
cohort after the school’s transition to a community school. For Research Question 1, it was found
that the mean of the cumulative grade point average (GPA) by courses of the senior cohort at the
LUS Community School was significantly higher in 2015-2016 after the school’s transition,
when compared to the mean of the cumulative grade point average (GPA) by courses of the
senior cohort at the LUS Community School for the 2011-2012 school year prior to the school’s
transition to a community school. It was also found, when comparing the mean of the cumulative
grade point average (GPA) by courses of the senior cohort at the LUS Community School and
High School B, High School B had a higher average for both the 2011-2012 and 2015-2016
school years. For additional data analysis, the researcher has included cumulative grade point
average (GPA) comparison data between LUS Community School, High School A and High
School B.
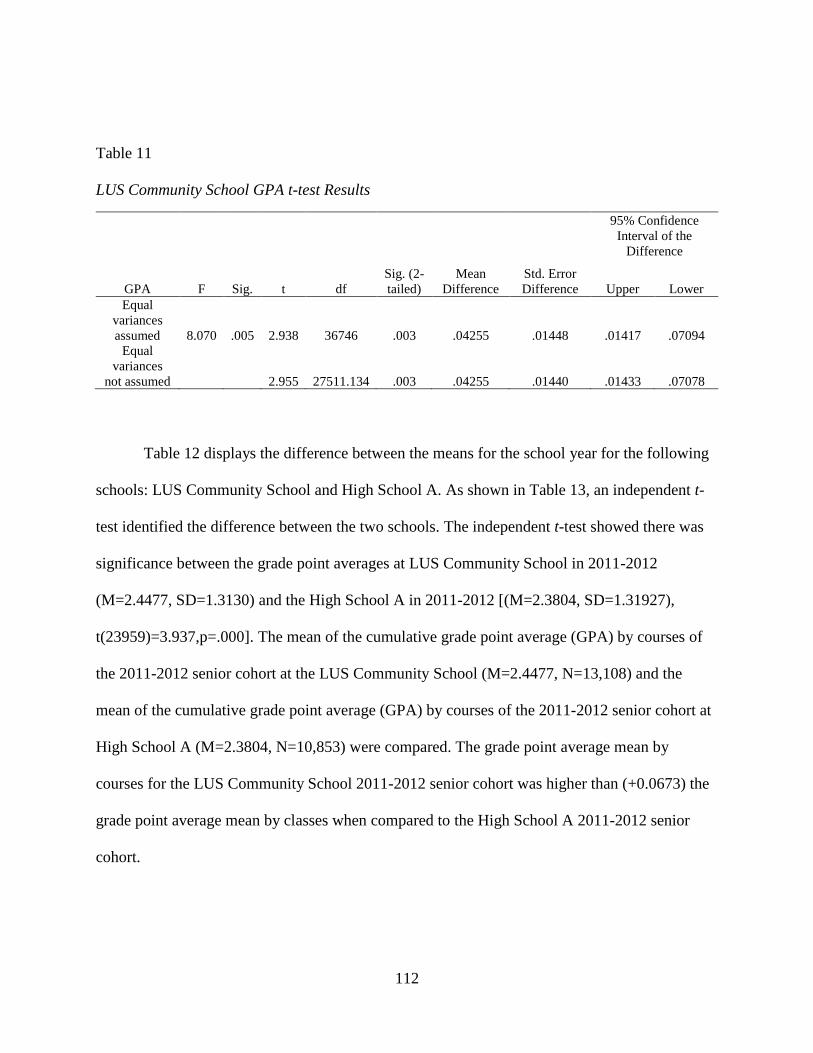
112
Table 11
LUS Community School GPA t-test Results
95% Confidence
Interval of the
Difference
GPA F Sig. t df
Sig. (2-
tailed)
Mean
Difference
Std. Error
Difference Upper Lower
Equal
variances
assumed 8.070 .005 2.938 36746 .003 .04255 .01448 .01417 .07094
Equal
variances
not assumed 2.955 27511.134 .003 .04255 .01440 .01433 .07078
Table 12 displays the difference between the means for the school year for the following
schools: LUS Community School and High School A. As shown in Table 13, an independent t-
test identified the difference between the two schools. The independent t-test showed there was
significance between the grade point averages at LUS Community School in 2011-2012
(M=2.4477, SD=1.3130) and the High School A in 2011-2012 [(M=2.3804, SD=1.31927),
t(23959)=3.937,p=.000]. The mean of the cumulative grade point average (GPA) by courses of
the 2011-2012 senior cohort at the LUS Community School (M=2.4477, N=13,108) and the
mean of the cumulative grade point average (GPA) by courses of the 2011-2012 senior cohort at
High School A (M=2.3804, N=10,853) were compared. The grade point average mean by
courses for the LUS Community School 2011-2012 senior cohort was higher than (+0.0673) the
grade point average mean by classes when compared to the High School A 2011-2012 senior
cohort.
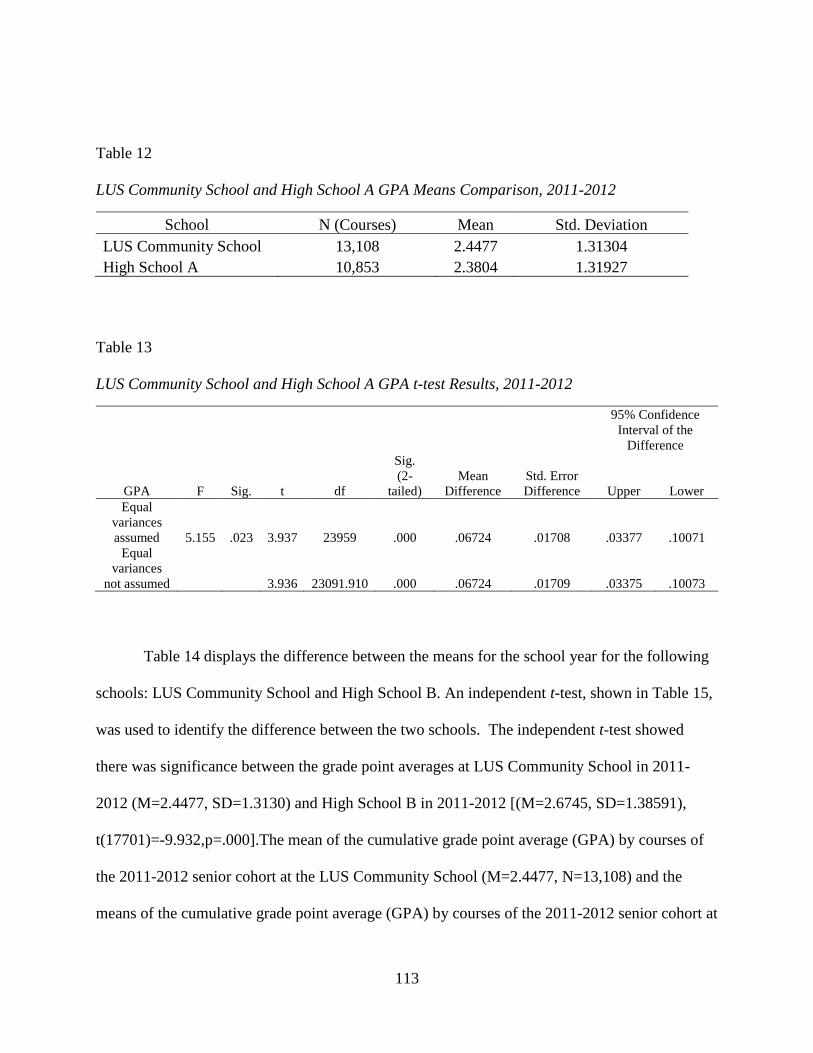
113
Table 12
LUS Community School and High School A GPA Means Comparison, 2011-2012
School N (Courses) Mean Std. Deviation
LUS Community School 13,108 2.4477 1.31304
High School A 10,853 2.3804 1.31927
Table 13
LUS Community School and High School A GPA t-test Results, 2011-2012
95% Confidence
Interval of the
Difference
GPA F Sig. t df
Sig.
(2-
tailed)
Mean
Difference
Std. Error
Difference Upper Lower
Equal
variances
assumed 5.155 .023 3.937 23959 .000 .06724 .01708 .03377 .10071
Equal
variances
not assumed 3.936 23091.910 .000 .06724 .01709 .03375 .10073
Table 14 displays the difference between the means for the school year for the following
schools: LUS Community School and High School B. An independent t-test, shown in Table 15,
was used to identify the difference between the two schools. The independent t-test showed
there was significance between the grade point averages at LUS Community School in 2011-
2012 (M=2.4477, SD=1.3130) and High School B in 2011-2012 [(M=2.6745, SD=1.38591),
t(17701)=-9.932,p=.000].The mean of the cumulative grade point average (GPA) by courses of
the 2011-2012 senior cohort at the LUS Community School (M=2.4477, N=13,108) and the
means of the cumulative grade point average (GPA) by courses of the 2011-2012 senior cohort at
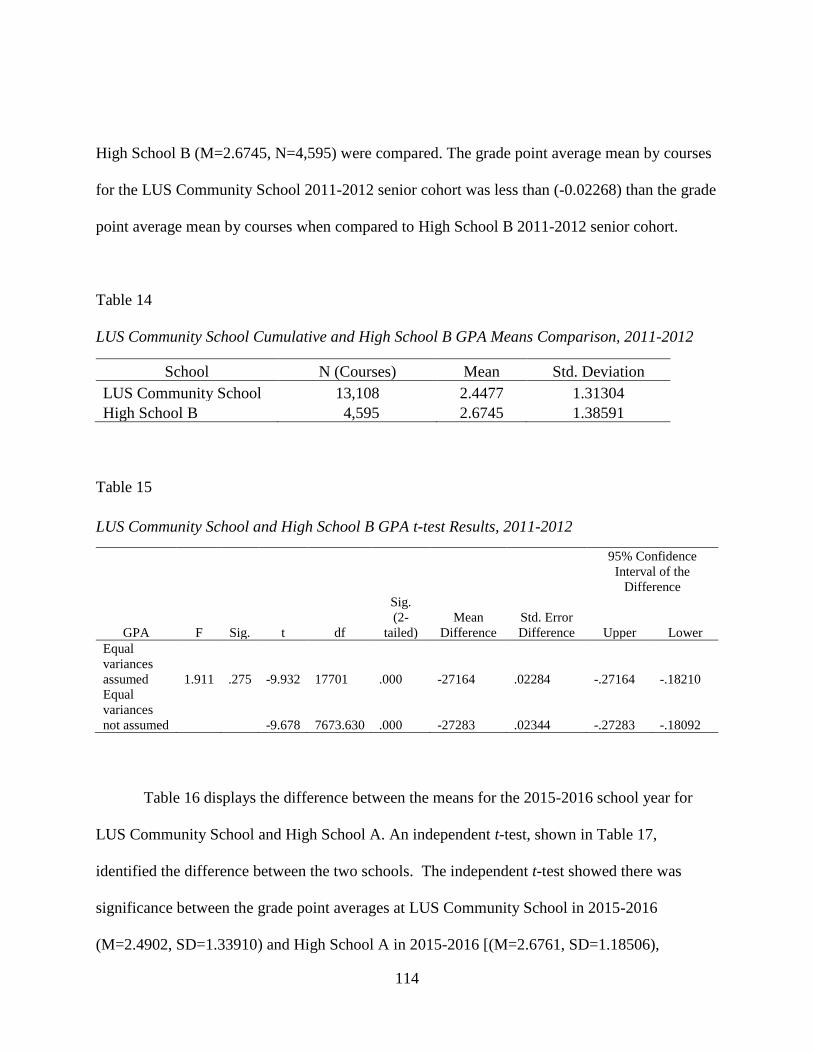
114
High School B (M=2.6745, N=4,595) were compared. The grade point average mean by courses
for the LUS Community School 2011-2012 senior cohort was less than (-0.02268) than the grade
point average mean by courses when compared to High School B 2011-2012 senior cohort.
Table 14
LUS Community School Cumulative and High School B GPA Means Comparison, 2011-2012
School N (Courses) Mean Std. Deviation
LUS Community School 13,108 2.4477 1.31304
High School B 4,595 2.6745 1.38591
Table 15
LUS Community School and High School B GPA t-test Results, 2011-2012
95% Confidence
Interval of the
Difference
GPA F Sig. t df
Sig.
(2-
tailed)
Mean
Difference
Std. Error
Difference Upper Lower
Equal
variances
assumed 1.911 .275 -9.932 17701 .000 -27164 .02284 -.27164 -.18210
Equal
variances
not assumed -9.678 7673.630 .000 -27283 .02344 -.27283 -.18092
Table 16 displays the difference between the means for the 2015-2016 school year for
LUS Community School and High School A. An independent t-test, shown in Table 17,
identified the difference between the two schools. The independent t-test showed there was
significance between the grade point averages at LUS Community School in 2015-2016
(M=2.4902, SD=1.33910) and High School A in 2015-2016 [(M=2.6761, SD=1.18506),
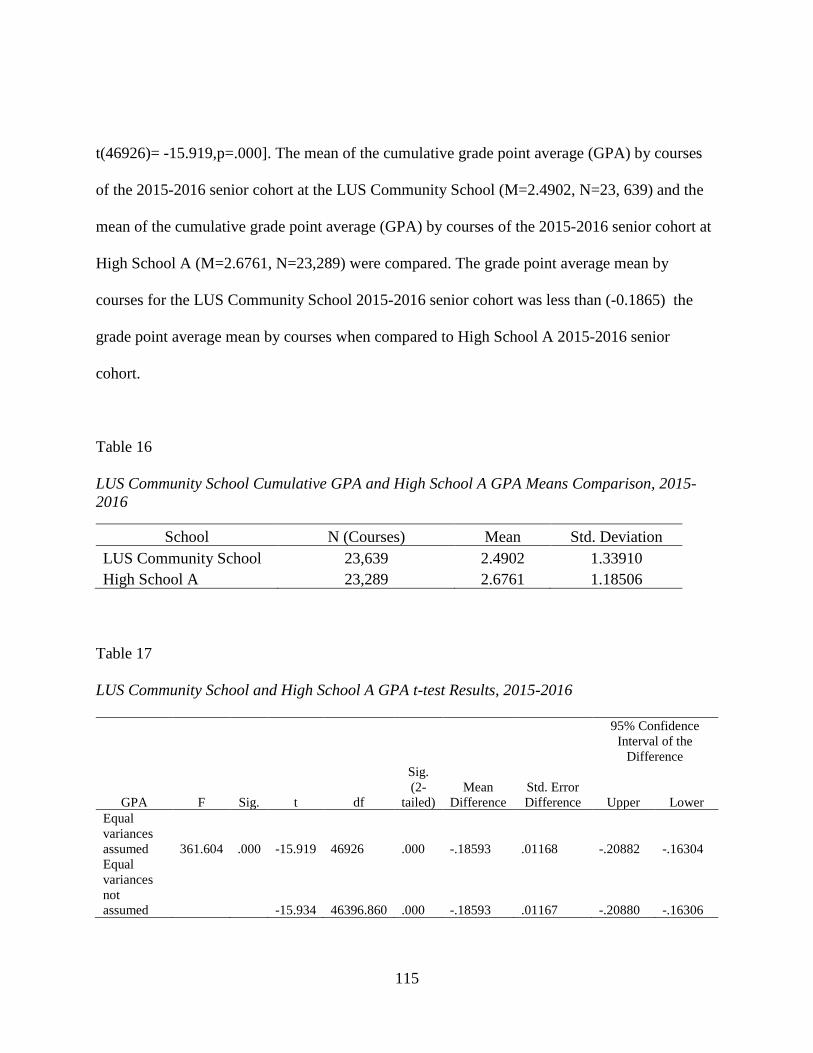
115
t(46926)= -15.919,p=.000]. The mean of the cumulative grade point average (GPA) by courses
of the 2015-2016 senior cohort at the LUS Community School (M=2.4902, N=23, 639) and the
mean of the cumulative grade point average (GPA) by courses of the 2015-2016 senior cohort at
High School A (M=2.6761, N=23,289) were compared. The grade point average mean by
courses for the LUS Community School 2015-2016 senior cohort was less than (-0.1865) the
grade point average mean by courses when compared to High School A 2015-2016 senior
cohort.
Table 16
LUS Community School Cumulative GPA and High School A GPA Means Comparison, 2015-
2016
School N (Courses) Mean Std. Deviation
LUS Community School 23,639 2.4902 1.33910
High School A 23,289 2.6761 1.18506
Table 17
LUS Community School and High School A GPA t-test Results, 2015-2016
95% Confidence
Interval of the
Difference
GPA F Sig. t df
Sig.
(2-
tailed)
Mean
Difference
Std. Error
Difference Upper Lower
Equal
variances
assumed 361.604 .000 -15.919 46926 .000 -.18593 .01168 -.20882 -.16304
Equal
variances
not
assumed -15.934 46396.860 .000 -.18593 .01167 -.20880 -.16306
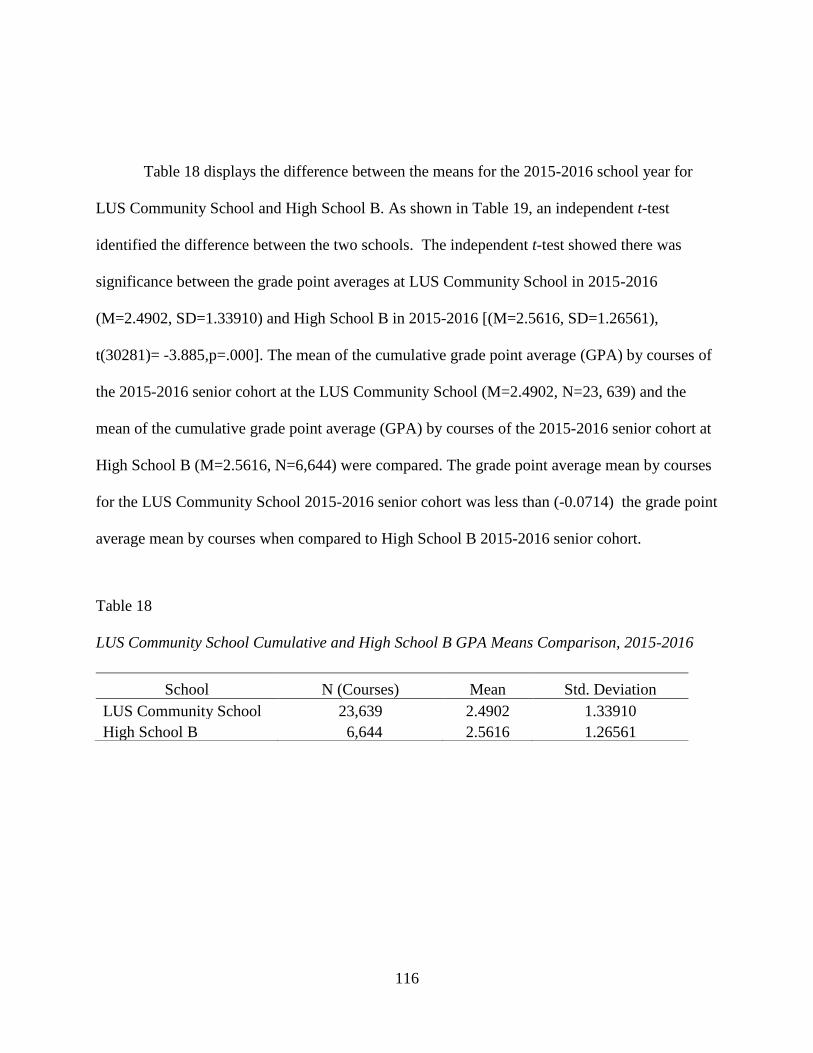
116
Table 18 displays the difference between the means for the 2015-2016 school year for
LUS Community School and High School B. As shown in Table 19, an independent t-test
identified the difference between the two schools. The independent t-test showed there was
significance between the grade point averages at LUS Community School in 2015-2016
(M=2.4902, SD=1.33910) and High School B in 2015-2016 [(M=2.5616, SD=1.26561),
t(30281)= -3.885,p=.000]. The mean of the cumulative grade point average (GPA) by courses of
the 2015-2016 senior cohort at the LUS Community School (M=2.4902, N=23, 639) and the
mean of the cumulative grade point average (GPA) by courses of the 2015-2016 senior cohort at
High School B (M=2.5616, N=6,644) were compared. The grade point average mean by courses
for the LUS Community School 2015-2016 senior cohort was less than (-0.0714) the grade point
average mean by courses when compared to High School B 2015-2016 senior cohort.
Table 18
LUS Community School Cumulative and High School B GPA Means Comparison, 2015-2016
School N (Courses) Mean Std. Deviation
LUS Community School 23,639 2.4902 1.33910
High School B 6,644 2.5616 1.26561
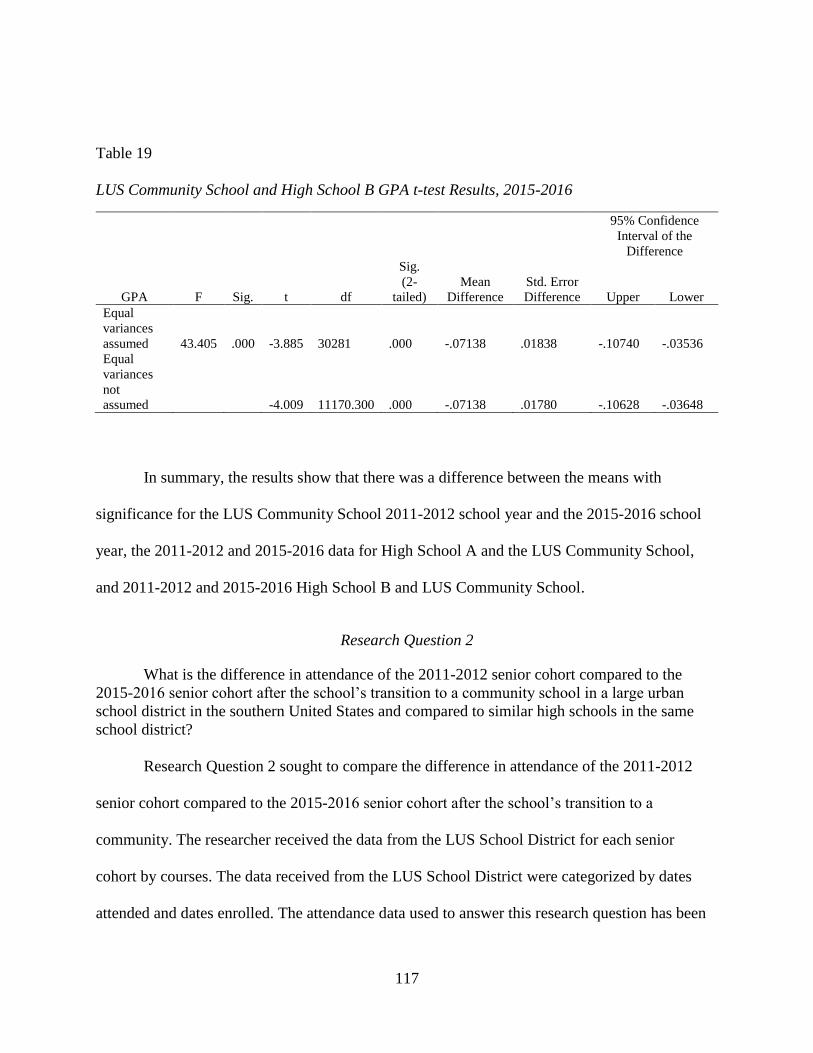
117
Table 19
LUS Community School and High School B GPA t-test Results, 2015-2016
95% Confidence
Interval of the
Difference
GPA F Sig. t df
Sig.
(2-
tailed)
Mean
Difference
Std. Error
Difference Upper Lower
Equal
variances
assumed 43.405 .000 -3.885 30281 .000 -.07138 .01838 -.10740 -.03536
Equal
variances
not
assumed -4.009 11170.300 .000 -.07138 .01780 -.10628 -.03648
In summary, the results show that there was a difference between the means with
significance for the LUS Community School 2011-2012 school year and the 2015-2016 school
year, the 2011-2012 and 2015-2016 data for High School A and the LUS Community School,
and 2011-2012 and 2015-2016 High School B and LUS Community School.
Research Question 2
What is the difference in attendance of the 2011-2012 senior cohort compared to the
2015-2016 senior cohort after the school’s transition to a community school in a large urban
school district in the southern United States and compared to similar high schools in the same
school district?
Research Question 2 sought to compare the difference in attendance of the 2011-2012
senior cohort compared to the 2015-2016 senior cohort after the school’s transition to a
community. The researcher received the data from the LUS School District for each senior
cohort by courses. The data received from the LUS School District were categorized by dates
attended and dates enrolled. The attendance data used to answer this research question has been
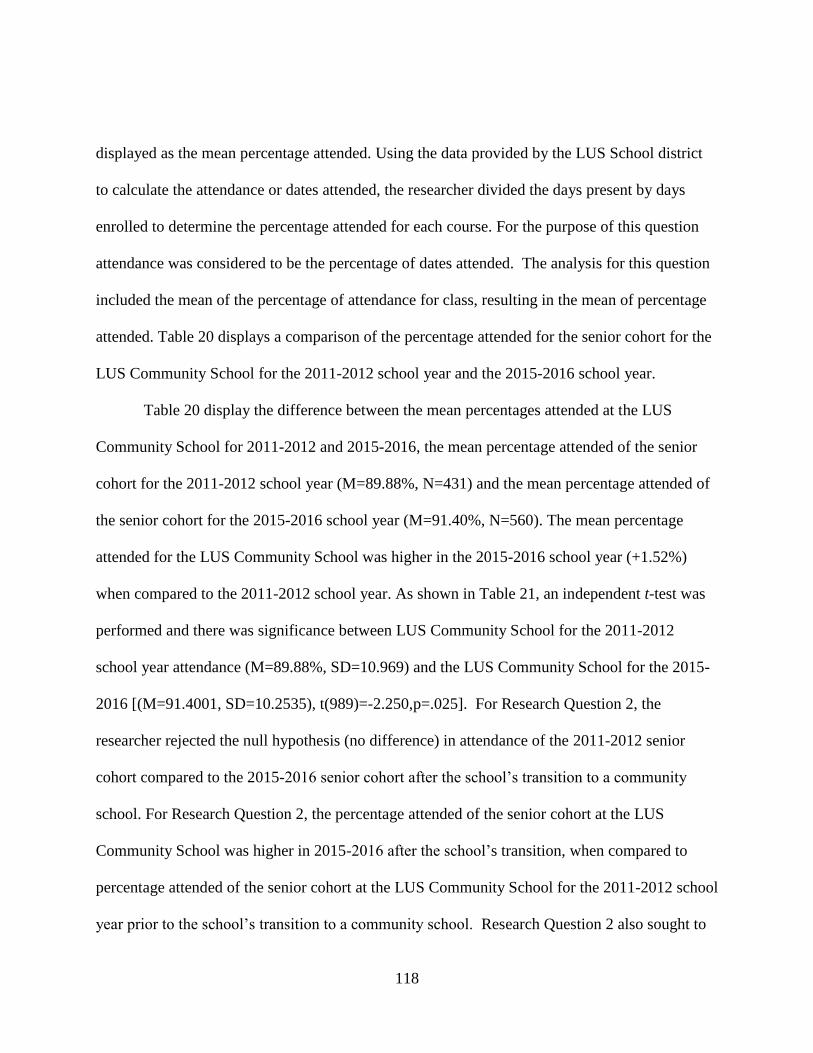
118
displayed as the mean percentage attended. Using the data provided by the LUS School district
to calculate the attendance or dates attended, the researcher divided the days present by days
enrolled to determine the percentage attended for each course. For the purpose of this question
attendance was considered to be the percentage of dates attended. The analysis for this question
included the mean of the percentage of attendance for class, resulting in the mean of percentage
attended. Table 20 displays a comparison of the percentage attended for the senior cohort for the
LUS Community School for the 2011-2012 school year and the 2015-2016 school year.
Table 20 display the difference between the mean percentages attended at the LUS
Community School for 2011-2012 and 2015-2016, the mean percentage attended of the senior
cohort for the 2011-2012 school year (M=89.88%, N=431) and the mean percentage attended of
the senior cohort for the 2015-2016 school year (M=91.40%, N=560). The mean percentage
attended for the LUS Community School was higher in the 2015-2016 school year (+1.52%)
when compared to the 2011-2012 school year. As shown in Table 21, an independent t-test was
performed and there was significance between LUS Community School for the 2011-2012
school year attendance (M=89.88%, SD=10.969) and the LUS Community School for the 2015-
2016 [(M=91.4001, SD=10.2535), t(989)=-2.250,p=.025]. For Research Question 2, the
researcher rejected the null hypothesis (no difference) in attendance of the 2011-2012 senior
cohort compared to the 2015-2016 senior cohort after the school’s transition to a community
school. For Research Question 2, the percentage attended of the senior cohort at the LUS
Community School was higher in 2015-2016 after the school’s transition, when compared to
percentage attended of the senior cohort at the LUS Community School for the 2011-2012 school
year prior to the school’s transition to a community school. Research Question 2 also sought to
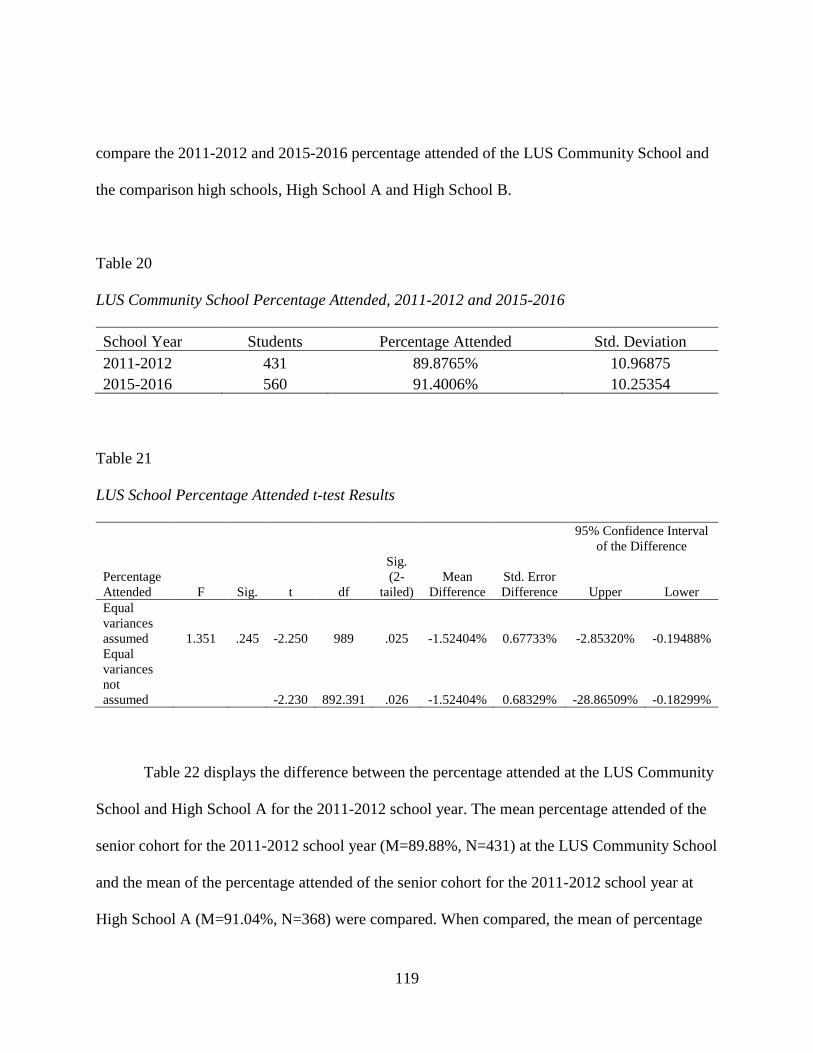
119
compare the 2011-2012 and 2015-2016 percentage attended of the LUS Community School and
the comparison high schools, High School A and High School B.
Table 20
LUS Community School Percentage Attended, 2011-2012 and 2015-2016
School Year Students Percentage Attended Std. Deviation
2011-2012 431 89.8765% 10.96875
2015-2016 560 91.4006% 10.25354
Table 21
LUS School Percentage Attended t-test Results
95% Confidence Interval
of the Difference
Percentage
Attended F Sig. t df
Sig.
(2-
tailed)
Mean
Difference
Std. Error
Difference Upper Lower
Equal
variances
assumed 1.351 .245 -2.250 989 .025 -1.52404% 0.67733% -2.85320% -0.19488%
Equal
variances
not
assumed -2.230 892.391 .026 -1.52404% 0.68329% -28.86509% -0.18299%
Table 22 displays the difference between the percentage attended at the LUS Community
School and High School A for the 2011-2012 school year. The mean percentage attended of the
senior cohort for the 2011-2012 school year (M=89.88%, N=431) at the LUS Community School
and the mean of the percentage attended of the senior cohort for the 2011-2012 school year at
High School A (M=91.04%, N=368) were compared. When compared, the mean of percentage
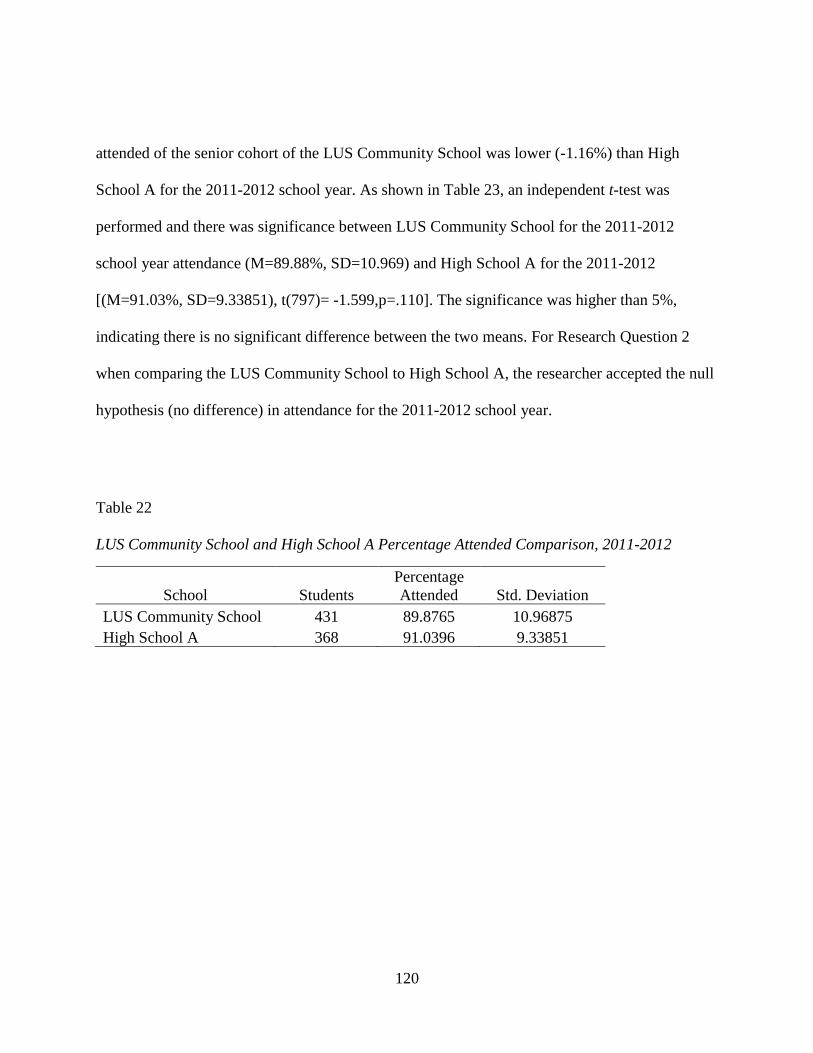
120
attended of the senior cohort of the LUS Community School was lower (-1.16%) than High
School A for the 2011-2012 school year. As shown in Table 23, an independent t-test was
performed and there was significance between LUS Community School for the 2011-2012
school year attendance (M=89.88%, SD=10.969) and High School A for the 2011-2012
[(M=91.03%, SD=9.33851), t(797)= -1.599,p=.110]. The significance was higher than 5%,
indicating there is no significant difference between the two means. For Research Question 2
when comparing the LUS Community School to High School A, the researcher accepted the null
hypothesis (no difference) in attendance for the 2011-2012 school year.
Table 22
LUS Community School and High School A Percentage Attended Comparison, 2011-2012
School Students
Percentage
Attended Std. Deviation
LUS Community School 431 89.8765 10.96875
High School A 368 91.0396 9.33851
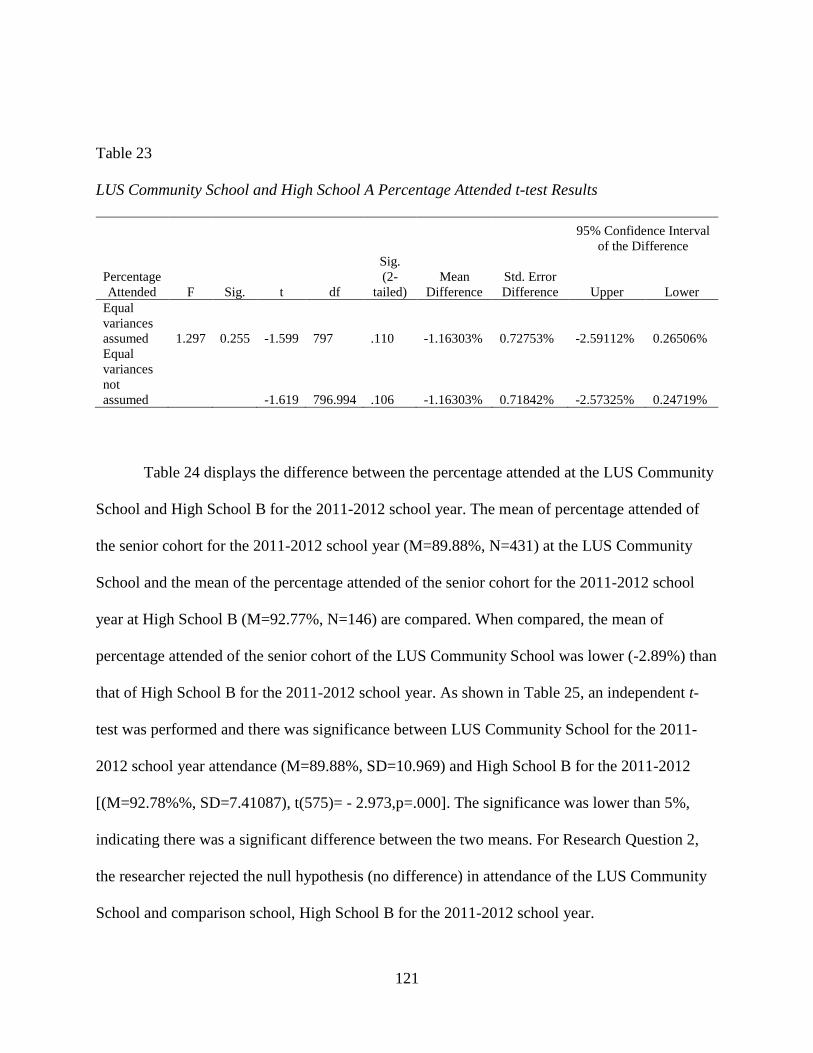
121
Table 23
LUS Community School and High School A Percentage Attended t-test Results
95% Confidence Interval
of the Difference
Percentage
Attended F Sig. t df
Sig.
(2-
tailed)
Mean
Difference
Std. Error
Difference Upper Lower
Equal
variances
assumed 1.297 0.255 -1.599 797 .110 -1.16303% 0.72753% -2.59112% 0.26506%
Equal
variances
not
assumed -1.619 796.994 .106 -1.16303% 0.71842% -2.57325% 0.24719%
Table 24 displays the difference between the percentage attended at the LUS Community
School and High School B for the 2011-2012 school year. The mean of percentage attended of
the senior cohort for the 2011-2012 school year (M=89.88%, N=431) at the LUS Community
School and the mean of the percentage attended of the senior cohort for the 2011-2012 school
year at High School B (M=92.77%, N=146) are compared. When compared, the mean of
percentage attended of the senior cohort of the LUS Community School was lower (-2.89%) than
that of High School B for the 2011-2012 school year. As shown in Table 25, an independent t-
test was performed and there was significance between LUS Community School for the 2011-
2012 school year attendance (M=89.88%, SD=10.969) and High School B for the 2011-2012
[(M=92.78%%, SD=7.41087), t(575)= - 2.973,p=.000]. The significance was lower than 5%,
indicating there was a significant difference between the two means. For Research Question 2,
the researcher rejected the null hypothesis (no difference) in attendance of the LUS Community
School and comparison school, High School B for the 2011-2012 school year.
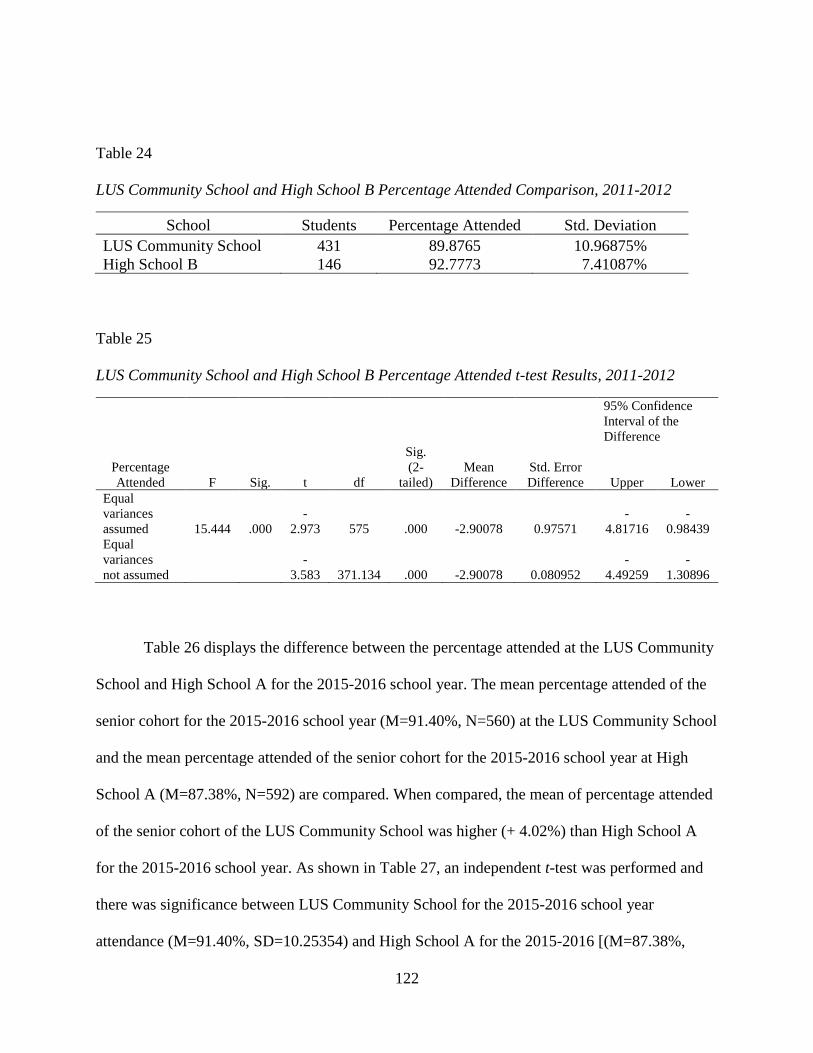
122
Table 24
LUS Community School and High School B Percentage Attended Comparison, 2011-2012
School Students Percentage Attended Std. Deviation
LUS Community School 431 89.8765 10.96875%
High School B 146 92.7773 7.41087%
Table 25
LUS Community School and High School B Percentage Attended t-test Results, 2011-2012
95% Confidence
Interval of the
Difference
Percentage
Attended F Sig. t df
Sig.
(2-
tailed)
Mean
Difference
Std. Error
Difference Upper Lower
Equal
variances
assumed 15.444 .000
-
2.973 575 .000 -2.90078 0.97571
-
4.81716
-
0.98439
Equal
variances
not assumed
-
3.583 371.134 .000 -2.90078 0.080952
-
4.49259
-
1.30896
Table 26 displays the difference between the percentage attended at the LUS Community
School and High School A for the 2015-2016 school year. The mean percentage attended of the
senior cohort for the 2015-2016 school year (M=91.40%, N=560) at the LUS Community School
and the mean percentage attended of the senior cohort for the 2015-2016 school year at High
School A (M=87.38%, N=592) are compared. When compared, the mean of percentage attended
of the senior cohort of the LUS Community School was higher (+ 4.02%) than High School A
for the 2015-2016 school year. As shown in Table 27, an independent t-test was performed and
there was significance between LUS Community School for the 2015-2016 school year
attendance (M=91.40%, SD=10.25354) and High School A for the 2015-2016 [(M=87.38%,
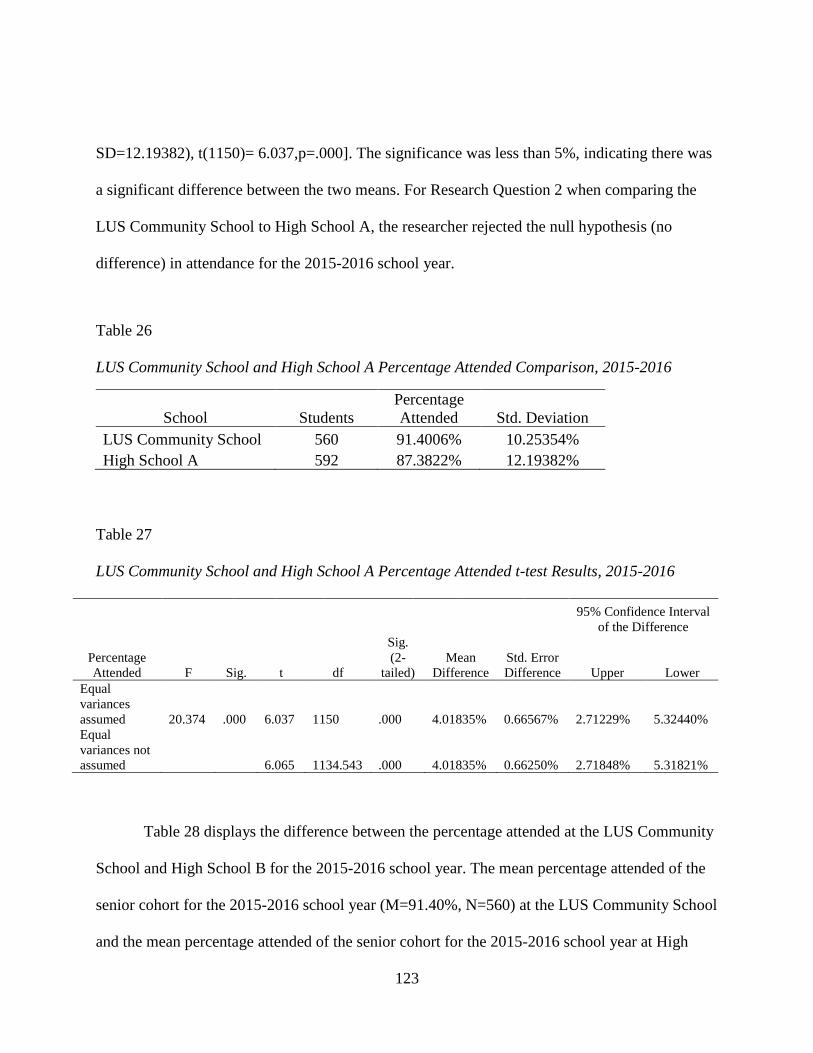
123
SD=12.19382), t(1150)= 6.037,p=.000]. The significance was less than 5%, indicating there was
a significant difference between the two means. For Research Question 2 when comparing the
LUS Community School to High School A, the researcher rejected the null hypothesis (no
difference) in attendance for the 2015-2016 school year.
Table 26
LUS Community School and High School A Percentage Attended Comparison, 2015-2016
School Students
Percentage
Attended Std. Deviation
LUS Community School 560 91.4006% 10.25354%
High School A 592 87.3822% 12.19382%
Table 27
LUS Community School and High School A Percentage Attended t-test Results, 2015-2016
95% Confidence Interval
of the Difference
Percentage
Attended F Sig. t df
Sig.
(2-
tailed)
Mean
Difference
Std. Error
Difference Upper Lower
Equal
variances
assumed 20.374 .000 6.037 1150 .000 4.01835% 0.66567% 2.71229% 5.32440%
Equal
variances not
assumed 6.065 1134.543 .000 4.01835% 0.66250% 2.71848% 5.31821%
Table 28 displays the difference between the percentage attended at the LUS Community
School and High School B for the 2015-2016 school year. The mean percentage attended of the
senior cohort for the 2015-2016 school year (M=91.40%, N=560) at the LUS Community School
and the mean percentage attended of the senior cohort for the 2015-2016 school year at High
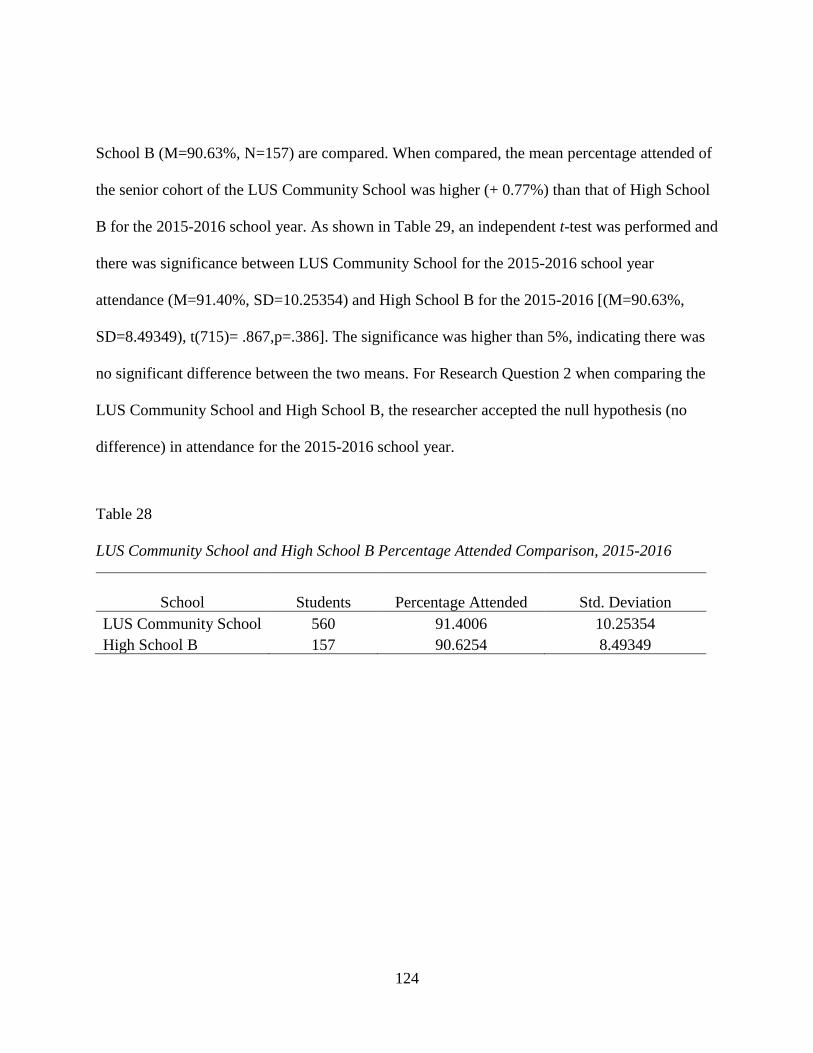
124
School B (M=90.63%, N=157) are compared. When compared, the mean percentage attended of
the senior cohort of the LUS Community School was higher (+ 0.77%) than that of High School
B for the 2015-2016 school year. As shown in Table 29, an independent t-test was performed and
there was significance between LUS Community School for the 2015-2016 school year
attendance (M=91.40%, SD=10.25354) and High School B for the 2015-2016 [(M=90.63%,
SD=8.49349), t(715)= .867,p=.386]. The significance was higher than 5%, indicating there was
no significant difference between the two means. For Research Question 2 when comparing the
LUS Community School and High School B, the researcher accepted the null hypothesis (no
difference) in attendance for the 2015-2016 school year.
Table 28
LUS Community School and High School B Percentage Attended Comparison, 2015-2016
School Students Percentage Attended Std. Deviation
LUS Community School 560 91.4006 10.25354
High School B 157 90.6254 8.49349
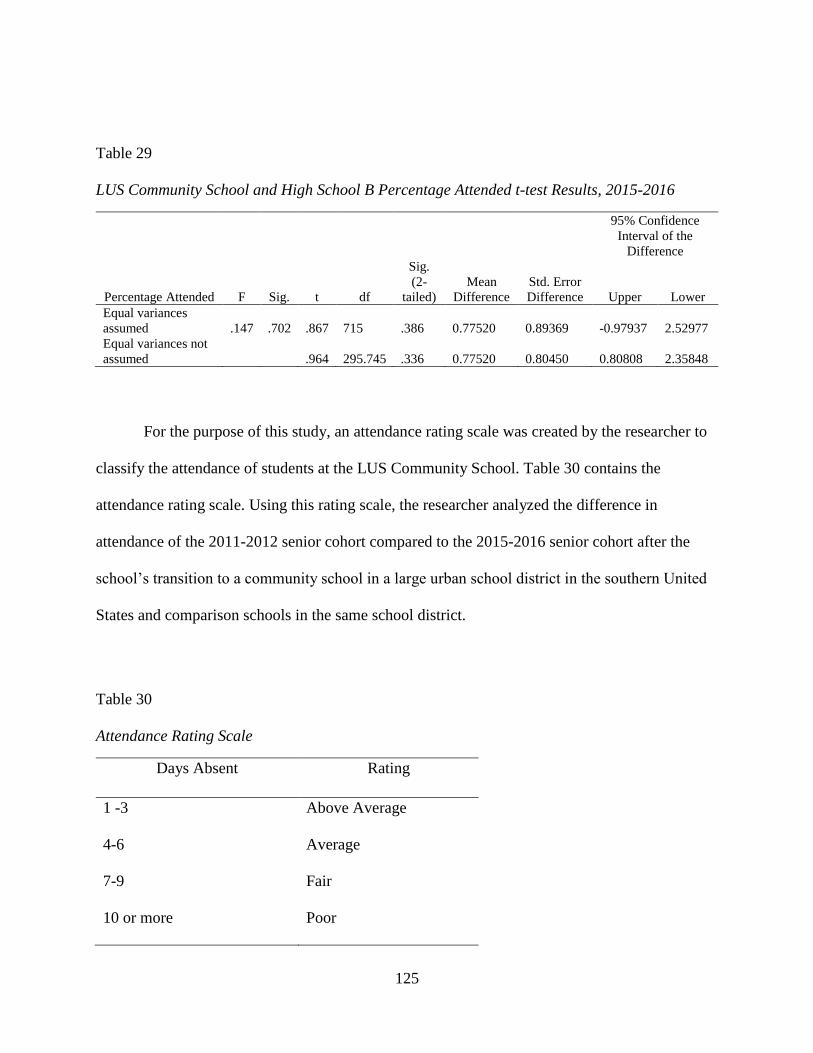
125
Table 29
LUS Community School and High School B Percentage Attended t-test Results, 2015-2016
95% Confidence
Interval of the
Difference
Percentage Attended F Sig. t df
Sig.
(2-
tailed)
Mean
Difference
Std. Error
Difference Upper Lower
Equal variances
assumed .147 .702 .867 715 .386 0.77520 0.89369 -0.97937 2.52977
Equal variances not
assumed .964 295.745 .336 0.77520 0.80450 0.80808 2.35848
For the purpose of this study, an attendance rating scale was created by the researcher to
classify the attendance of students at the LUS Community School. Table 30 contains the
attendance rating scale. Using this rating scale, the researcher analyzed the difference in
attendance of the 2011-2012 senior cohort compared to the 2015-2016 senior cohort after the
school’s transition to a community school in a large urban school district in the southern United
States and comparison schools in the same school district.
Table 30
Attendance Rating Scale
Days Absent Rating
1 -3 Above Average
4-6 Average
7-9 Fair
10 or more Poor
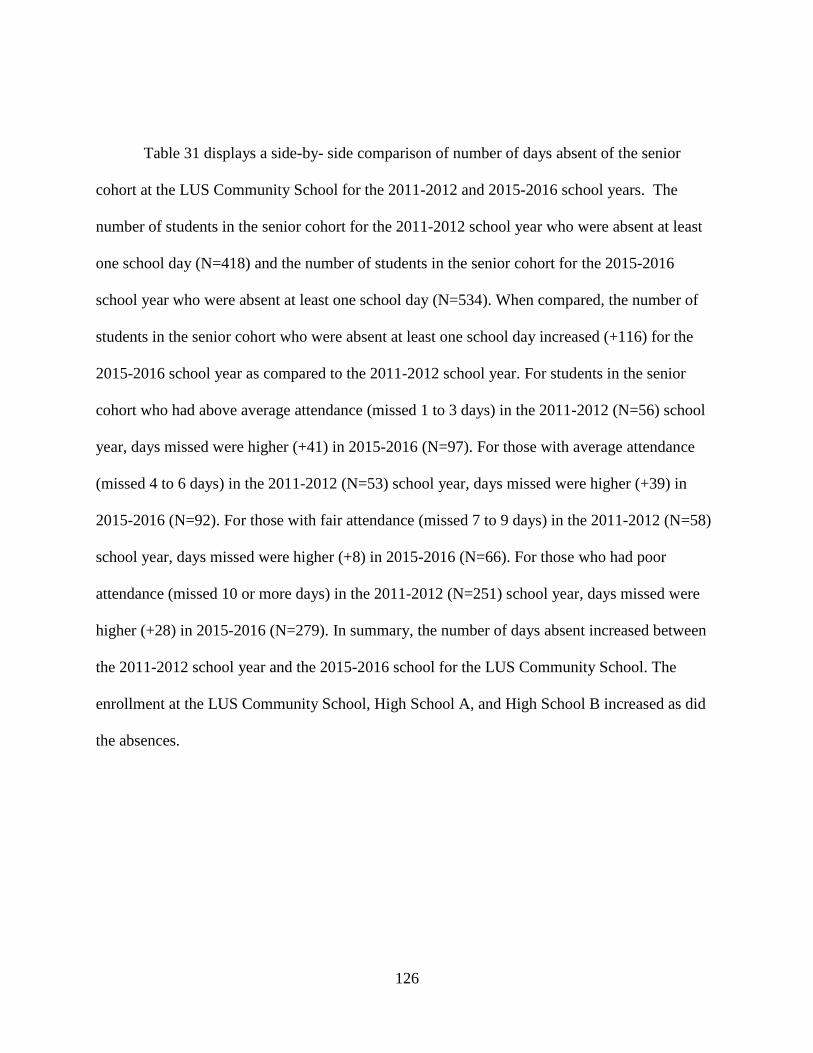
126
Table 31 displays a side-by- side comparison of number of days absent of the senior
cohort at the LUS Community School for the 2011-2012 and 2015-2016 school years. The
number of students in the senior cohort for the 2011-2012 school year who were absent at least
one school day (N=418) and the number of students in the senior cohort for the 2015-2016
school year who were absent at least one school day (N=534). When compared, the number of
students in the senior cohort who were absent at least one school day increased (+116) for the
2015-2016 school year as compared to the 2011-2012 school year. For students in the senior
cohort who had above average attendance (missed 1 to 3 days) in the 2011-2012 (N=56) school
year, days missed were higher (+41) in 2015-2016 (N=97). For those with average attendance
(missed 4 to 6 days) in the 2011-2012 (N=53) school year, days missed were higher (+39) in
2015-2016 (N=92). For those with fair attendance (missed 7 to 9 days) in the 2011-2012 (N=58)
school year, days missed were higher (+8) in 2015-2016 (N=66). For those who had poor
attendance (missed 10 or more days) in the 2011-2012 (N=251) school year, days missed were
higher (+28) in 2015-2016 (N=279). In summary, the number of days absent increased between
the 2011-2012 school year and the 2015-2016 school for the LUS Community School. The
enrollment at the LUS Community School, High School A, and High School B increased as did
the absences.
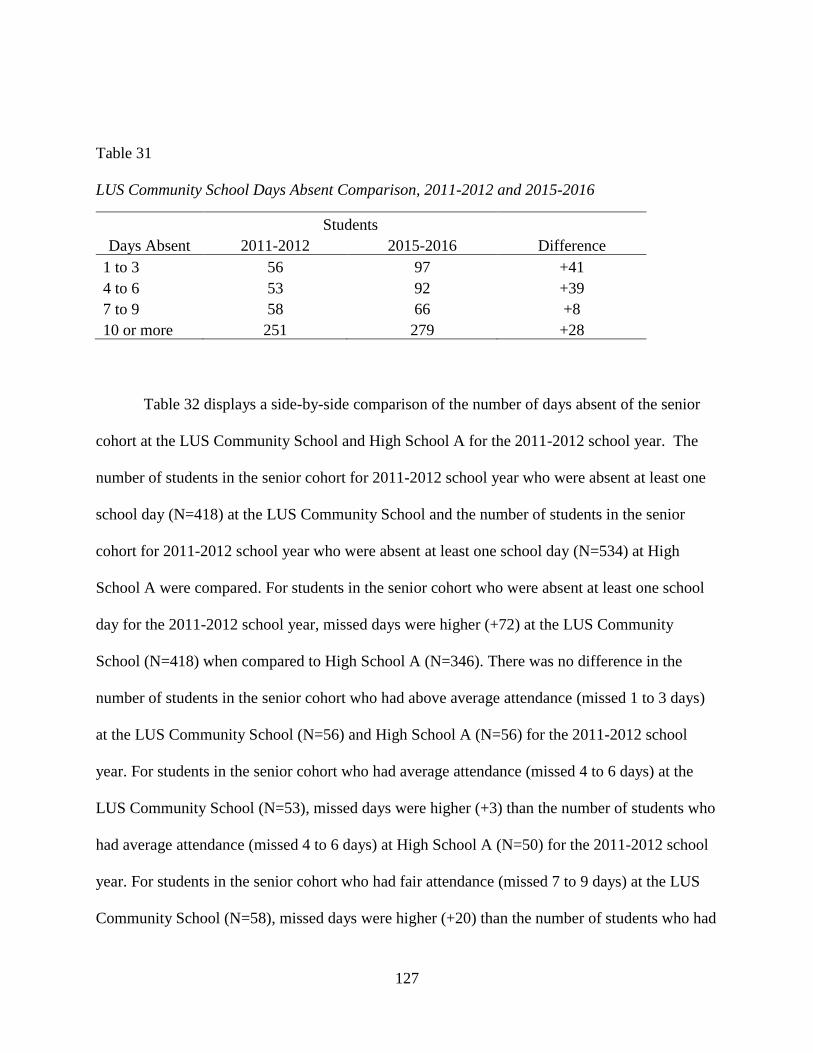
127
Table 31
LUS Community School Days Absent Comparison, 2011-2012 and 2015-2016
Students
Days Absent 2011-2012 2015-2016 Difference
1 to 3 56 97 +41
4 to 6 53 92 +39
7 to 9 58 66 +8
10 or more 251 279 +28
Table 32 displays a side-by-side comparison of the number of days absent of the senior
cohort at the LUS Community School and High School A for the 2011-2012 school year. The
number of students in the senior cohort for 2011-2012 school year who were absent at least one
school day (N=418) at the LUS Community School and the number of students in the senior
cohort for 2011-2012 school year who were absent at least one school day (N=534) at High
School A were compared. For students in the senior cohort who were absent at least one school
day for the 2011-2012 school year, missed days were higher (+72) at the LUS Community
School (N=418) when compared to High School A (N=346). There was no difference in the
number of students in the senior cohort who had above average attendance (missed 1 to 3 days)
at the LUS Community School (N=56) and High School A (N=56) for the 2011-2012 school
year. For students in the senior cohort who had average attendance (missed 4 to 6 days) at the
LUS Community School (N=53), missed days were higher (+3) than the number of students who
had average attendance (missed 4 to 6 days) at High School A (N=50) for the 2011-2012 school
year. For students in the senior cohort who had fair attendance (missed 7 to 9 days) at the LUS
Community School (N=58), missed days were higher (+20) than the number of students who had
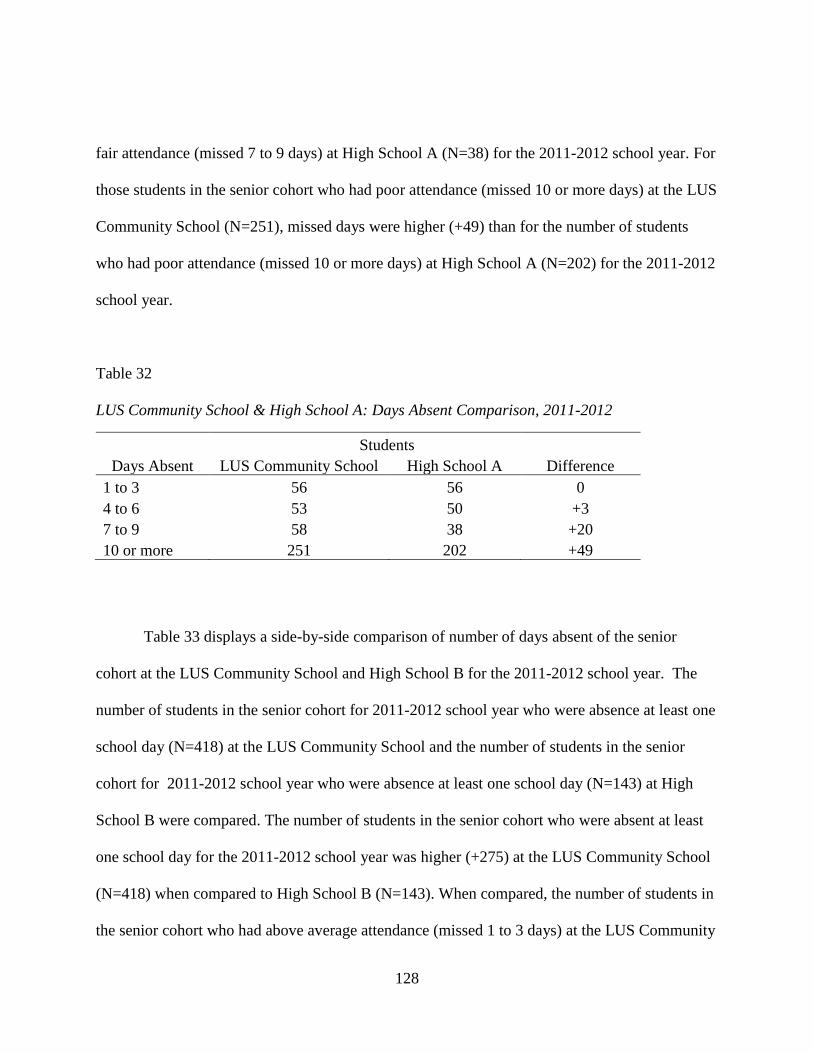
128
fair attendance (missed 7 to 9 days) at High School A (N=38) for the 2011-2012 school year. For
those students in the senior cohort who had poor attendance (missed 10 or more days) at the LUS
Community School (N=251), missed days were higher (+49) than for the number of students
who had poor attendance (missed 10 or more days) at High School A (N=202) for the 2011-2012
school year.
Table 32
LUS Community School & High School A: Days Absent Comparison, 2011-2012
Students
Days Absent LUS Community School High School A Difference
1 to 3 56 56 0
4 to 6 53 50 +3
7 to 9 58 38 +20
10 or more 251 202 +49
Table 33 displays a side-by-side comparison of number of days absent of the senior
cohort at the LUS Community School and High School B for the 2011-2012 school year. The
number of students in the senior cohort for 2011-2012 school year who were absence at least one
school day (N=418) at the LUS Community School and the number of students in the senior
cohort for 2011-2012 school year who were absence at least one school day (N=143) at High
School B were compared. The number of students in the senior cohort who were absent at least
one school day for the 2011-2012 school year was higher (+275) at the LUS Community School
(N=418) when compared to High School B (N=143). When compared, the number of students in
the senior cohort who had above average attendance (missed 1 to 3 days) at the LUS Community
129
School (N=56) was higher (+41) than the number of students who had above average attendance
(missed 1 to 3 days) at High School B (N=15) for the 2011-2012 school year. For students in the
senior cohort who had average attendance (missed 4 to 6 days) at the LUS Community School
(N=53) missed days were higher (+18) than the number of students who had average attendance
(missed 4 to 6 days) at High School B (N=35) for the 2011-2012 school year. For students in the
senior cohort who had fair attendance (missed 7 to 9 days) at the LUS Community School
(N=58), missed days were higher (+42) than the number of students who had fair attendance
(missed 7 to 9 days) at High School B (N=16) for the 2011-2012 school year. For students in the
senior cohort who had poor attendance (missed 10 or more days) at the LUS Community School
(N=251), missed days were higher (+174) than the number of students who had poor attendance
(missed 10 or more days) at High School B (N=77) for the 2011-2012 school year.
Table 33
LUS Community School & High School B: Days Absent Comparison, 2011-2012
Students
Days Absent LUS Community School High School B Difference
1 to 3 56 15 +41
4 to 6 53 35 +18
7 to 9 58 16 +42
10 or more 251 77 +174
In summary, the number of days absent was greater for all categories; 1 to 3 days, 4 to 6
days, 7 to 9 days, and 10 or more days, for the 2011-2012 senior cohort when compared to the
2015-2016 senior cohort at the LUS Community School. When compared to High School A, the
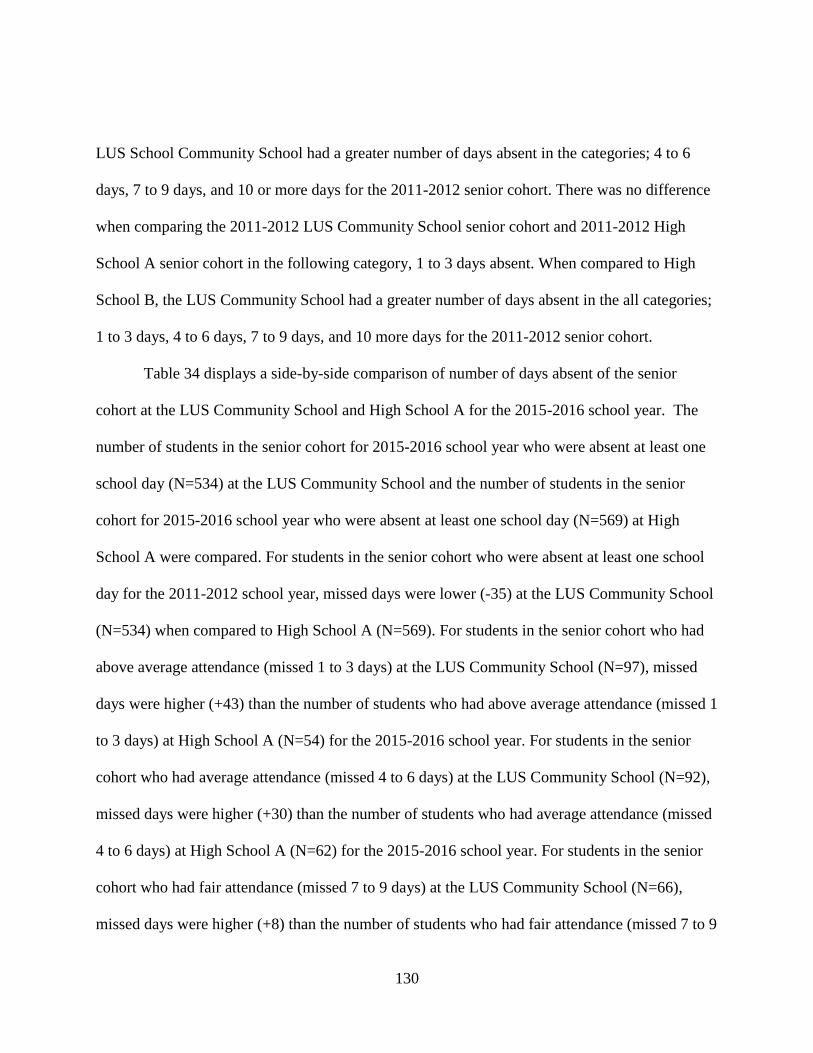
130
LUS School Community School had a greater number of days absent in the categories; 4 to 6
days, 7 to 9 days, and 10 or more days for the 2011-2012 senior cohort. There was no difference
when comparing the 2011-2012 LUS Community School senior cohort and 2011-2012 High
School A senior cohort in the following category, 1 to 3 days absent. When compared to High
School B, the LUS Community School had a greater number of days absent in the all categories;
1 to 3 days, 4 to 6 days, 7 to 9 days, and 10 more days for the 2011-2012 senior cohort.
Table 34 displays a side-by-side comparison of number of days absent of the senior
cohort at the LUS Community School and High School A for the 2015-2016 school year. The
number of students in the senior cohort for 2015-2016 school year who were absent at least one
school day (N=534) at the LUS Community School and the number of students in the senior
cohort for 2015-2016 school year who were absent at least one school day (N=569) at High
School A were compared. For students in the senior cohort who were absent at least one school
day for the 2011-2012 school year, missed days were lower (-35) at the LUS Community School
(N=534) when compared to High School A (N=569). For students in the senior cohort who had
above average attendance (missed 1 to 3 days) at the LUS Community School (N=97), missed
days were higher (+43) than the number of students who had above average attendance (missed 1
to 3 days) at High School A (N=54) for the 2015-2016 school year. For students in the senior
cohort who had average attendance (missed 4 to 6 days) at the LUS Community School (N=92),
missed days were higher (+30) than the number of students who had average attendance (missed
4 to 6 days) at High School A (N=62) for the 2015-2016 school year. For students in the senior
cohort who had fair attendance (missed 7 to 9 days) at the LUS Community School (N=66),
missed days were higher (+8) than the number of students who had fair attendance (missed 7 to 9
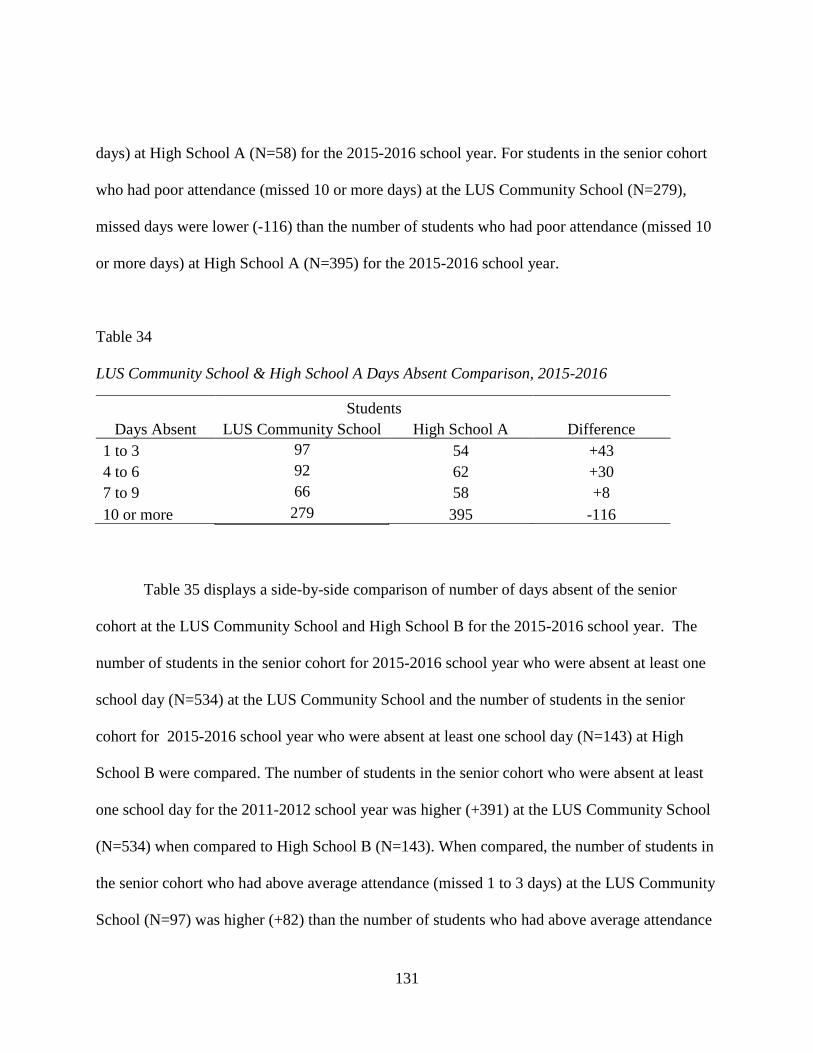
131
days) at High School A (N=58) for the 2015-2016 school year. For students in the senior cohort
who had poor attendance (missed 10 or more days) at the LUS Community School (N=279),
missed days were lower (-116) than the number of students who had poor attendance (missed 10
or more days) at High School A (N=395) for the 2015-2016 school year.
Table 34
LUS Community School & High School A Days Absent Comparison, 2015-2016
Students
Days Absent LUS Community School High School A Difference
1 to 3 97 54 +43
4 to 6 92 62 +30
7 to 9 66 58 +8
10 or more 279 395 -116
Table 35 displays a side-by-side comparison of number of days absent of the senior
cohort at the LUS Community School and High School B for the 2015-2016 school year. The
number of students in the senior cohort for 2015-2016 school year who were absent at least one
school day (N=534) at the LUS Community School and the number of students in the senior
cohort for 2015-2016 school year who were absent at least one school day (N=143) at High
School B were compared. The number of students in the senior cohort who were absent at least
one school day for the 2011-2012 school year was higher (+391) at the LUS Community School
(N=534) when compared to High School B (N=143). When compared, the number of students in
the senior cohort who had above average attendance (missed 1 to 3 days) at the LUS Community
School (N=97) was higher (+82) than the number of students who had above average attendance
132
(missed 1 to 3 days) at High School B (N=15) for the 2015-2016 school year. For students in the
senior cohort who had average attendance (missed 4 to 6 days) at the LUS Community School
(N=92), missed days were higher (+74) than the number of students who had average attendance
(missed 4 to 6 days) at High School B (N=18) for the 2015-2016 school year. For students in the
senior cohort who had fair attendance (missed 7 to 9 days) at the LUS Community School
(N=66), missed days were higher (+48) than the number of students who had fair attendance
(missed 7 to 9 days) at High School B (N=18) for the 2015-2016 school year. For students in the
senior cohort who had poor attendance (missed 10 or more days) at the LUS Community School
(N=279), missed days were higher (+187) than the number of students who had poor attendance
(missed 10 or more days) at High School B (N=92) for the 2015-2016 school year.
Table 35
LUS Community School & High School B Days Absent Comparison, 2015-2016
Students
Days Absent LUS Community School High School B Difference
1 to 3 97 15 +82
4 to 6 92 18 +74
7 to 9 66 18 +48
10 or more 279 92 +187
In summary, when compared to High School A, the LUS School Community School had
a greater number of days absent in the categories; 1 to 3 days, 4 to 6 days, and 7 to 9 days for the
2015-2016 senior cohort. The LUS Community School had less number of days absent when
compared to High School A for the 2015-2016 senior cohort. When compared to High School B,
133
the LUS Community School had a greater number of days absent in the all categories; 1 to 3
days, 4 to 6 days, 7 to 9 days, and 10 more days for the 2015-2016 senior cohort.
Research Question 3
What is the difference in the number of suspensions and length of suspensions of the
2011-2012 senior cohort compared to the 2015-2016 senior cohort after the school’s transition to
a community school in a large urban school district in the southern United States and compared
to similar high schools in the same school district?
Research Question 3 sought to compare the difference in the number of suspensions and
length of suspensions of students in the 2011-2012 senior cohort who were suspended compared
to the 2015-2016 senior cohort who were suspended after the school’s transition to a community
school. The researcher received the data from the LUS School District for each senior cohort by
courses. The discipline data used to answer this research question is displayed by number of
suspensions. The mean indicated the average number of suspensions for suspended students. The
mean was calculated using the number of students with a suspension as the denominator and the
number of suspensions as the numerator. Table 36 displays a side-by-side comparison of the
discipline means by the number of suspensions for the senior cohort for the LUS Community
School for the 2011-2012 school year and the 2015-2016 school year.
Table 36 displays the difference between the mean suspensions at the LUS Community
School for the following school years: 2011-2012 and 2015-2016. The mean suspensions of the
senior cohort for the 2011-2012 school year (M=3.14, N=28) and the mean of the suspensions of
the senior cohort for the 2015-2016 school year (M=3.69, N=35) were compared. The mean
suspensions for the LUS Community School was higher in the 2015-2016 school year (M
=+0.55, N = +7) when compared to the 2011-2012 school year. As shown in Table 37, an
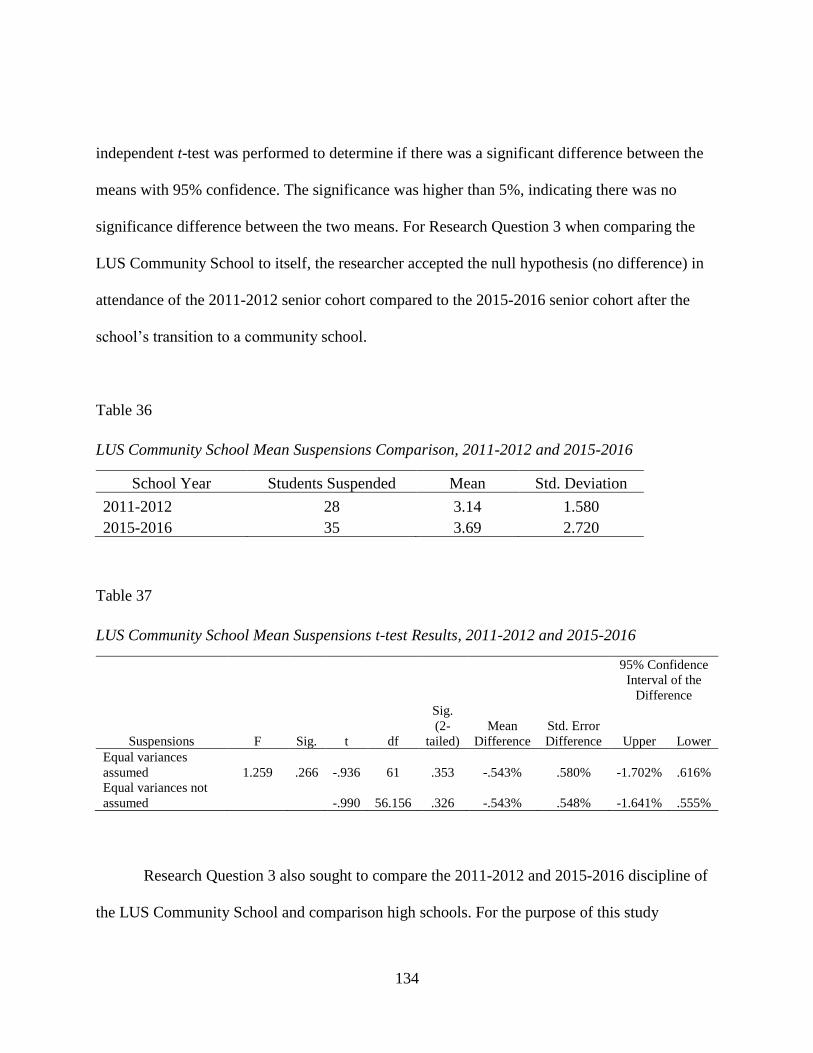
134
independent t-test was performed to determine if there was a significant difference between the
means with 95% confidence. The significance was higher than 5%, indicating there was no
significance difference between the two means. For Research Question 3 when comparing the
LUS Community School to itself, the researcher accepted the null hypothesis (no difference) in
attendance of the 2011-2012 senior cohort compared to the 2015-2016 senior cohort after the
school’s transition to a community school.
Table 36
LUS Community School Mean Suspensions Comparison, 2011-2012 and 2015-2016
School Year Students Suspended Mean Std. Deviation
2011-2012 28 3.14 1.580
2015-2016 35 3.69 2.720
Table 37
LUS Community School Mean Suspensions t-test Results, 2011-2012 and 2015-2016
95% Confidence
Interval of the
Difference
Suspensions F Sig. t df
Sig.
(2-
tailed)
Mean
Difference
Std. Error
Difference Upper Lower
Equal variances
assumed 1.259 .266 -.936 61 .353 -.543% .580% -1.702% .616%
Equal variances not
assumed -.990 56.156 .326 -.543% .548% -1.641% .555%
Research Question 3 also sought to compare the 2011-2012 and 2015-2016 discipline of
the LUS Community School and comparison high schools. For the purpose of this study
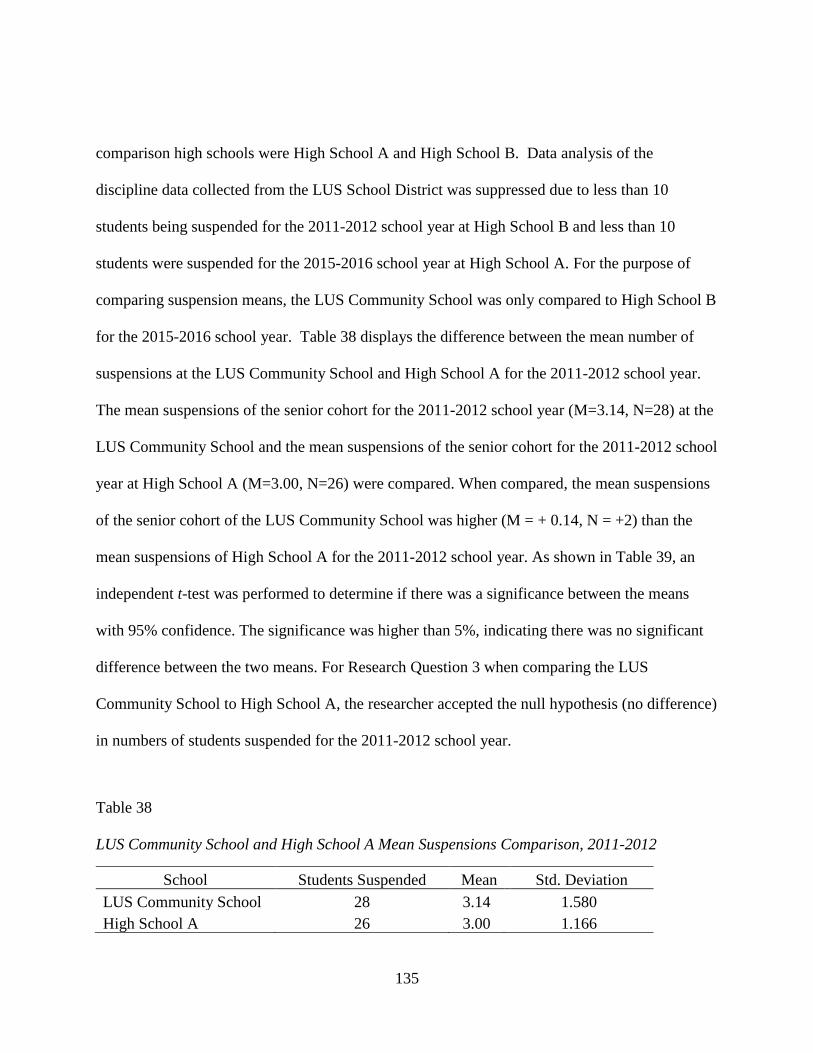
135
comparison high schools were High School A and High School B. Data analysis of the
discipline data collected from the LUS School District was suppressed due to less than 10
students being suspended for the 2011-2012 school year at High School B and less than 10
students were suspended for the 2015-2016 school year at High School A. For the purpose of
comparing suspension means, the LUS Community School was only compared to High School B
for the 2015-2016 school year. Table 38 displays the difference between the mean number of
suspensions at the LUS Community School and High School A for the 2011-2012 school year.
The mean suspensions of the senior cohort for the 2011-2012 school year (M=3.14, N=28) at the
LUS Community School and the mean suspensions of the senior cohort for the 2011-2012 school
year at High School A (M=3.00, N=26) were compared. When compared, the mean suspensions
of the senior cohort of the LUS Community School was higher (M = + 0.14, N = +2) than the
mean suspensions of High School A for the 2011-2012 school year. As shown in Table 39, an
independent t-test was performed to determine if there was a significance between the means
with 95% confidence. The significance was higher than 5%, indicating there was no significant
difference between the two means. For Research Question 3 when comparing the LUS
Community School to High School A, the researcher accepted the null hypothesis (no difference)
in numbers of students suspended for the 2011-2012 school year.
Table 38
LUS Community School and High School A Mean Suspensions Comparison, 2011-2012
School Students Suspended Mean Std. Deviation
LUS Community School 28 3.14 1.580
High School A 26 3.00 1.166
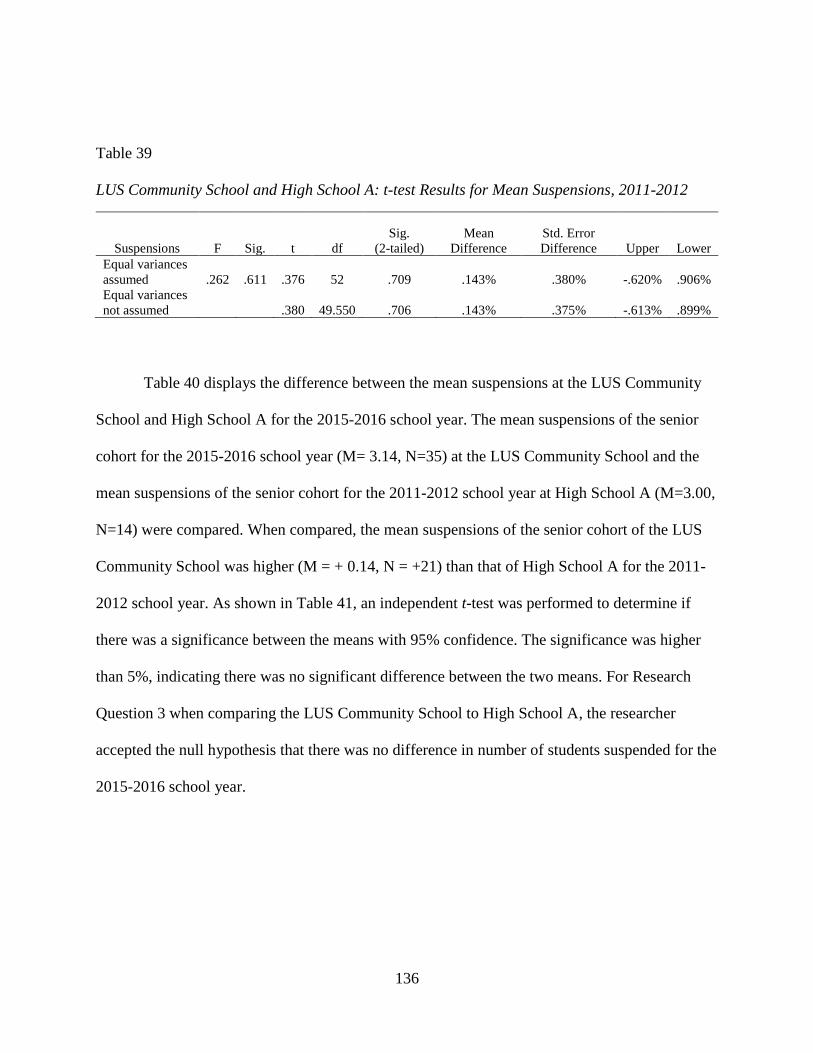
136
Table 39
LUS Community School and High School A: t-test Results for Mean Suspensions, 2011-2012
Suspensions F Sig. t df
Sig.
(2-tailed)
Mean
Difference
Std. Error
Difference Upper Lower
Equal variances
assumed .262 .611 .376 52 .709 .143% .380% -.620% .906%
Equal variances
not assumed .380 49.550 .706 .143% .375% -.613% .899%
Table 40 displays the difference between the mean suspensions at the LUS Community
School and High School A for the 2015-2016 school year. The mean suspensions of the senior
cohort for the 2015-2016 school year (M= 3.14, N=35) at the LUS Community School and the
mean suspensions of the senior cohort for the 2011-2012 school year at High School A (M=3.00,
N=14) were compared. When compared, the mean suspensions of the senior cohort of the LUS
Community School was higher (M = + 0.14, N = +21) than that of High School A for the 2011-
2012 school year. As shown in Table 41, an independent t-test was performed to determine if
there was a significance between the means with 95% confidence. The significance was higher
than 5%, indicating there was no significant difference between the two means. For Research
Question 3 when comparing the LUS Community School to High School A, the researcher
accepted the null hypothesis that there was no difference in number of students suspended for the
2015-2016 school year.
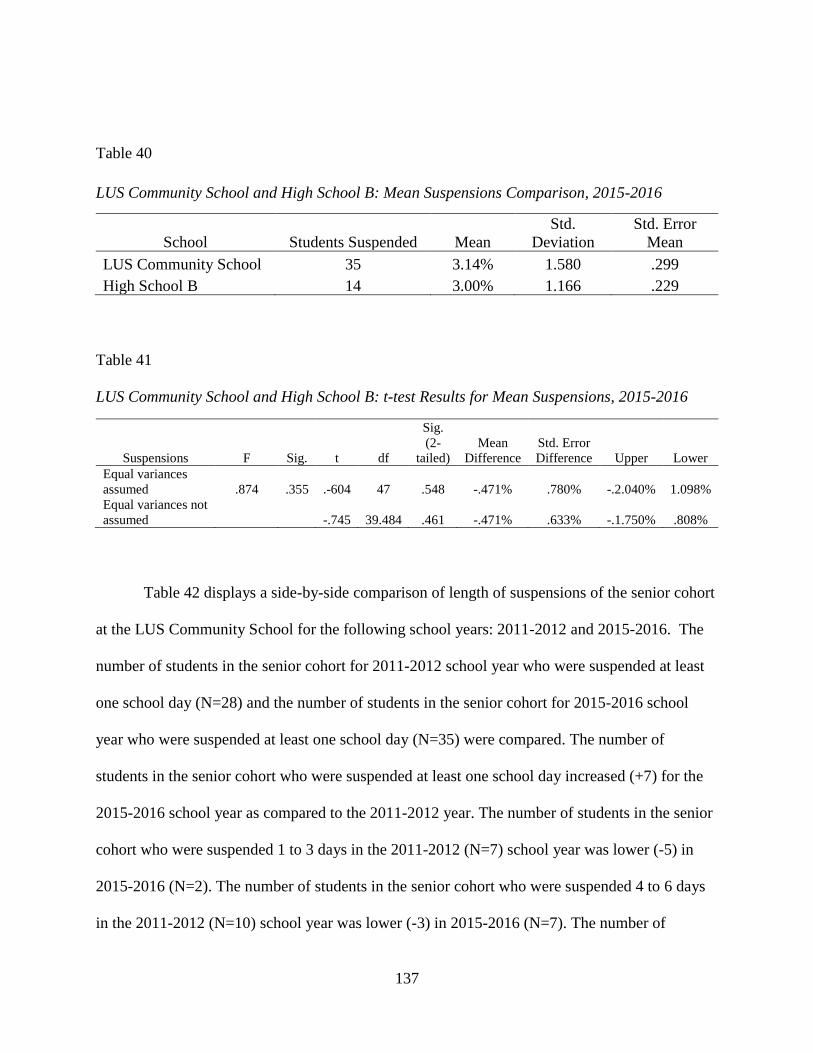
137
Table 40
LUS Community School and High School B: Mean Suspensions Comparison, 2015-2016
School Students Suspended Mean
Std.
Deviation
Std. Error
Mean
LUS Community School 35 3.14% 1.580 .299
High School B 14 3.00% 1.166 .229
Table 41
LUS Community School and High School B: t-test Results for Mean Suspensions, 2015-2016
Suspensions F Sig. t df
Sig.
(2-
tailed)
Mean
Difference
Std. Error
Difference Upper Lower
Equal variances
assumed .874 .355 .-604 47 .548 -.471% .780% -.2.040% 1.098%
Equal variances not
assumed -.745 39.484 .461 -.471% .633% -.1.750% .808%
Table 42 displays a side-by-side comparison of length of suspensions of the senior cohort
at the LUS Community School for the following school years: 2011-2012 and 2015-2016. The
number of students in the senior cohort for 2011-2012 school year who were suspended at least
one school day (N=28) and the number of students in the senior cohort for 2015-2016 school
year who were suspended at least one school day (N=35) were compared. The number of
students in the senior cohort who were suspended at least one school day increased (+7) for the
2015-2016 school year as compared to the 2011-2012 year. The number of students in the senior
cohort who were suspended 1 to 3 days in the 2011-2012 (N=7) school year was lower (-5) in
2015-2016 (N=2). The number of students in the senior cohort who were suspended 4 to 6 days
in the 2011-2012 (N=10) school year was lower (-3) in 2015-2016 (N=7). The number of
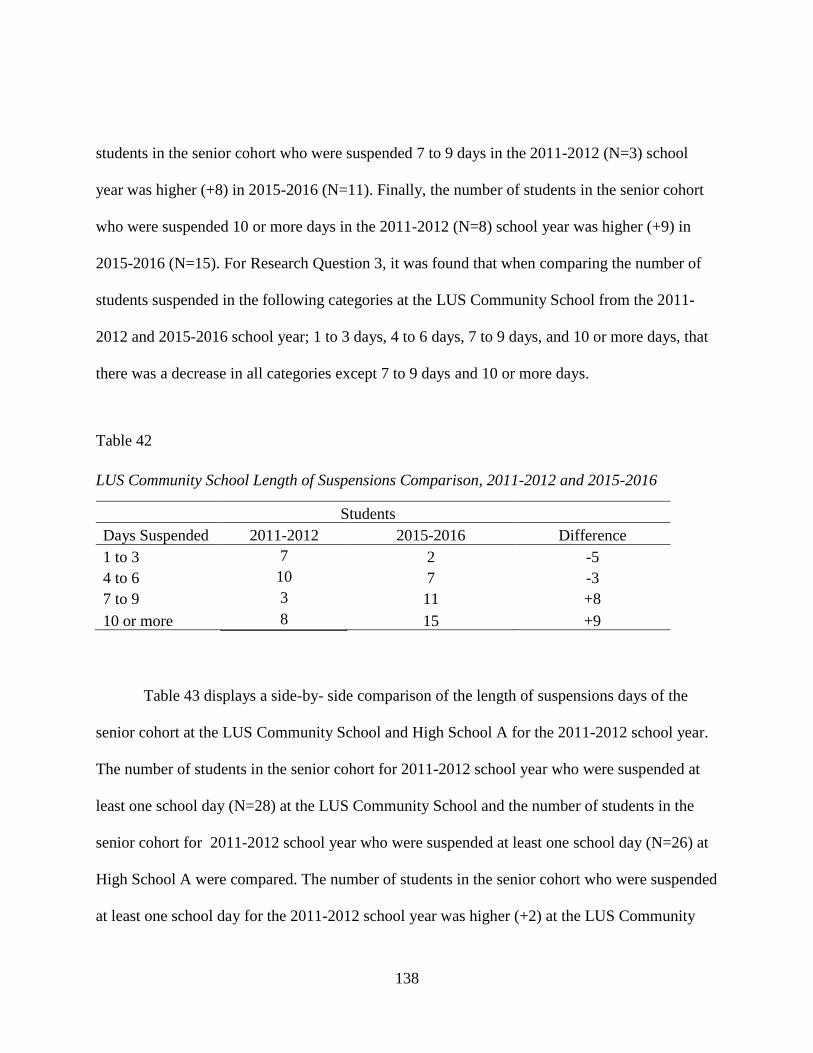
138
students in the senior cohort who were suspended 7 to 9 days in the 2011-2012 (N=3) school
year was higher (+8) in 2015-2016 (N=11). Finally, the number of students in the senior cohort
who were suspended 10 or more days in the 2011-2012 (N=8) school year was higher (+9) in
2015-2016 (N=15). For Research Question 3, it was found that when comparing the number of
students suspended in the following categories at the LUS Community School from the 2011-
2012 and 2015-2016 school year; 1 to 3 days, 4 to 6 days, 7 to 9 days, and 10 or more days, that
there was a decrease in all categories except 7 to 9 days and 10 or more days.
Table 42
LUS Community School Length of Suspensions Comparison, 2011-2012 and 2015-2016
Students
Days Suspended 2011-2012 2015-2016 Difference
1 to 3 7 2 -5
4 to 6 10 7 -3
7 to 9 3 11 +8
10 or more 8 15 +9
Table 43 displays a side-by- side comparison of the length of suspensions days of the
senior cohort at the LUS Community School and High School A for the 2011-2012 school year.
The number of students in the senior cohort for 2011-2012 school year who were suspended at
least one school day (N=28) at the LUS Community School and the number of students in the
senior cohort for 2011-2012 school year who were suspended at least one school day (N=26) at
High School A were compared. The number of students in the senior cohort who were suspended
at least one school day for the 2011-2012 school year was higher (+2) at the LUS Community
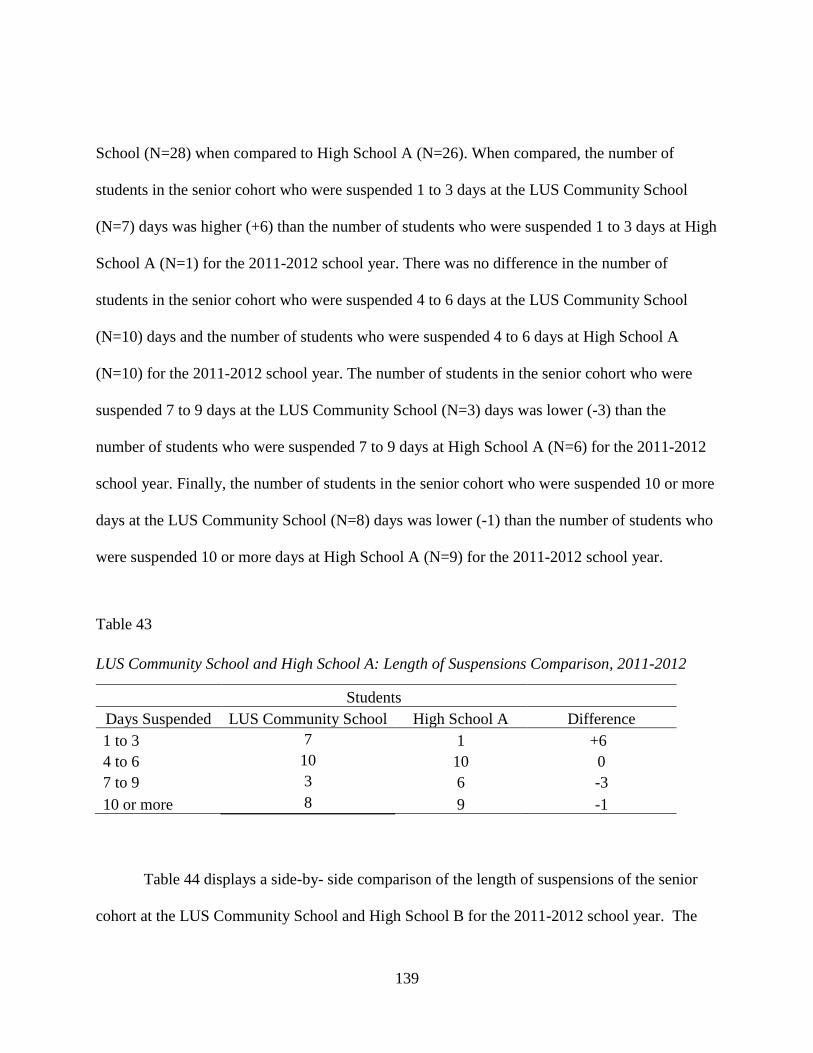
139
School (N=28) when compared to High School A (N=26). When compared, the number of
students in the senior cohort who were suspended 1 to 3 days at the LUS Community School
(N=7) days was higher (+6) than the number of students who were suspended 1 to 3 days at High
School A (N=1) for the 2011-2012 school year. There was no difference in the number of
students in the senior cohort who were suspended 4 to 6 days at the LUS Community School
(N=10) days and the number of students who were suspended 4 to 6 days at High School A
(N=10) for the 2011-2012 school year. The number of students in the senior cohort who were
suspended 7 to 9 days at the LUS Community School (N=3) days was lower (-3) than the
number of students who were suspended 7 to 9 days at High School A (N=6) for the 2011-2012
school year. Finally, the number of students in the senior cohort who were suspended 10 or more
days at the LUS Community School (N=8) days was lower (-1) than the number of students who
were suspended 10 or more days at High School A (N=9) for the 2011-2012 school year.
Table 43
LUS Community School and High School A: Length of Suspensions Comparison, 2011-2012
Students
Days Suspended LUS Community School High School A Difference
1 to 3 7 1 +6
4 to 6 10 10 0
7 to 9 3 6 -3
10 or more 8 9 -1
Table 44 displays a side-by- side comparison of the length of suspensions of the senior
cohort at the LUS Community School and High School B for the 2011-2012 school year. The
140
number of students in the senior cohort for 2011-2012 school year who were suspended at least
one school day (N=28) at the LUS Community School and the number of students in the senior
cohort for 2011-2012 school year who were suspended at least one school day (N=1) at High
School B were compared. The number of students in the senior cohort who were suspended at
least one school day for the 2011-2012 school year was higher (+27) at the LUS Community
School (N=28) when compared to High School B (N=1). The number of students in the senior
cohort who were suspended 1 to 3 days at the LUS Community School (N=7) days was higher
(+7) than the number of students who were suspended 1 to 3 days at High School B (N=0) for
the 2011-2012 school year. The number of students in the senior cohort who were suspended 4
to 6 days at the LUS Community School (N=10) days was higher (+10) than the number of
students who were suspended 1 to 3 days at High School B (N=0) for the 2011-2012 school year.
The number of students in the senior cohort who were suspended 7 to 9 at the LUS Community
School (N=3) days was higher (+2) than the number of students who were suspended 7 to 9 days
at High School B (N=1) for the 2011-2012 school year. Finally, the number of students in the
senior cohort who were suspended 10 or more days at the LUS Community School (N=8) days
was higher (+8) than the number of students who were suspended 10 or more days at High
School B (N=0) for the 2011-2012 school year.
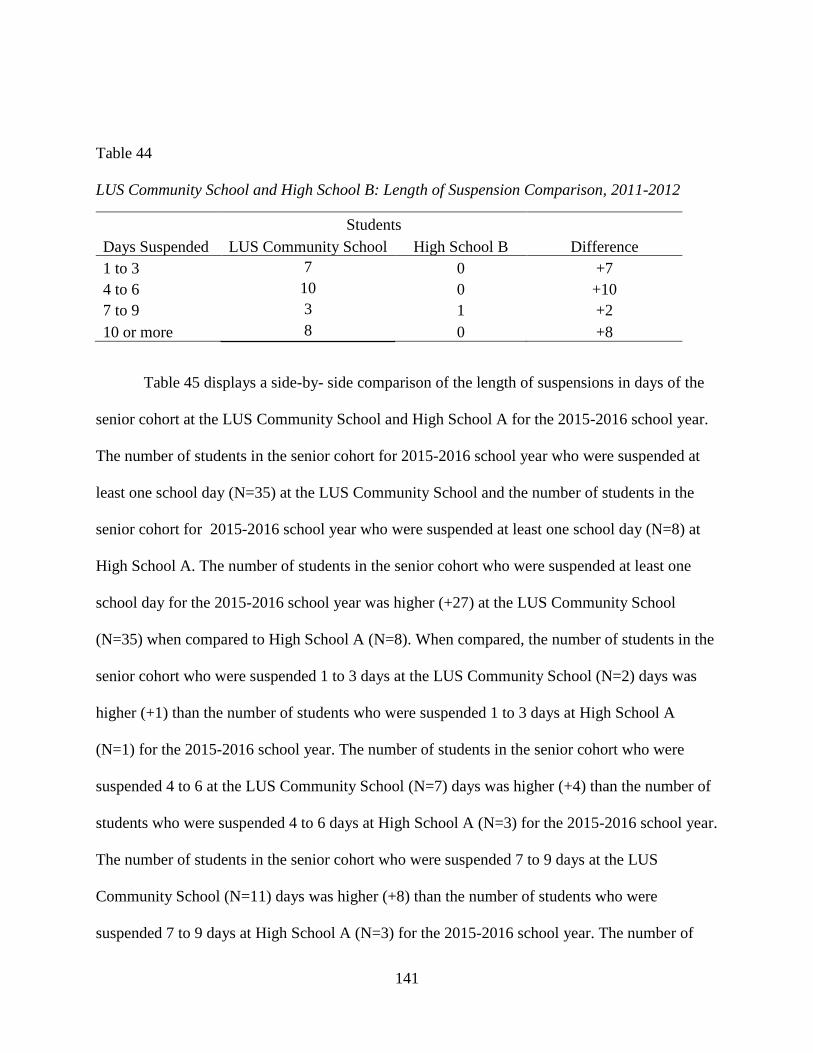
141
Table 44
LUS Community School and High School B: Length of Suspension Comparison, 2011-2012
Students
Days Suspended LUS Community School High School B Difference
1 to 3 7 0 +7
4 to 6 10 0 +10
7 to 9 3 1 +2
10 or more 8 0 +8
Table 45 displays a side-by- side comparison of the length of suspensions in days of the
senior cohort at the LUS Community School and High School A for the 2015-2016 school year.
The number of students in the senior cohort for 2015-2016 school year who were suspended at
least one school day (N=35) at the LUS Community School and the number of students in the
senior cohort for 2015-2016 school year who were suspended at least one school day (N=8) at
High School A. The number of students in the senior cohort who were suspended at least one
school day for the 2015-2016 school year was higher (+27) at the LUS Community School
(N=35) when compared to High School A (N=8). When compared, the number of students in the
senior cohort who were suspended 1 to 3 days at the LUS Community School (N=2) days was
higher (+1) than the number of students who were suspended 1 to 3 days at High School A
(N=1) for the 2015-2016 school year. The number of students in the senior cohort who were
suspended 4 to 6 at the LUS Community School (N=7) days was higher (+4) than the number of
students who were suspended 4 to 6 days at High School A (N=3) for the 2015-2016 school year.
The number of students in the senior cohort who were suspended 7 to 9 days at the LUS
Community School (N=11) days was higher (+8) than the number of students who were
suspended 7 to 9 days at High School A (N=3) for the 2015-2016 school year. The number of
142
students in the senior cohort who were suspended 10 or more days at the LUS Community
School (N=15) days was higher (+14) than the number of students who were suspended 10 or
more days at High School A (N=1) for the 2015-2016 school year.
Table 45
LUS Community School and High School A: Length of Suspensions Comparison, 2015-2016
Students
Days Suspended LUS Community School High School A Difference
1 to 3 2 1 +1
4 to 6 7 3 +4
7 to 9 11 3 +8
10 or more 15 1 +14
Table 46 displays a side-by-side comparison of the length of suspensions in days of the
senior cohort at the LUS Community School and High School B for the 2015-2016 school year.
The number of students in the senior cohort for 2015-2016 school year who were suspended at
least one school day (N=35) at the LUS Community School and the number of students in the
senior cohort for 2015-2016 school year who were suspended at least one school day (N=14) at
High School B were compared. The number of students in the senior cohort who were suspended
at least one school day for the 2015-2016 school year was higher (+21) at the LUS Community
School (N=35) when compared to High School B (N=14). The number of students in the senior
cohort who were suspended 1 to 3 days at the LUS Community School (N=2) days was higher
(+2) than the number of students who were suspended 1 to 3 days at High School B (N=0) for
the 2015-2016 school year. The number of students in the senior cohort who were suspended 4 to
143
6 at the LUS Community School (N=1) days was higher (+6) than the number of students who
were suspended 4 to 6 days at High School B (N=1) for the 2015-2016 school year. The number
of students in the senior cohort who were suspended 7 to 9 days at the LUS Community School
(N=11) days was higher (+10) than the number of students who were suspended 7 to 9 days at
High School B (N=1) for the 2015-2016 school year. Finally, the number of students in the
senior cohort who were suspended 10 or more days at the LUS Community School (N=15) days
was higher (+3) than the number of students who were suspended 10 or more days at High
School B (N=12) for the 2015-2016 school year.
Table 46
LUS Community School and High School B: Length of Suspensions Comparison, 2015-2016
Students
Days Suspended LUS Community School High School B Difference
1 to 3 2 0 +2
4 to 6 7 1 +6
7 to 9 11 1 +10
10 or more 15 12 +3
In summary, when comparing the 2011-2012 senior cohort to the 2015-2016 senior cohort
at the LUS Community School, the number of mean suspensions were greater for the 2015-2016
senior cohort. Thus, indicating that more students in the 2015-2016 senior cohort were suspended.
When comparing the 2015-2016 senior cohort at High School B, the number of mean suspensions
were higher at the LUS Community School. There was no significant difference between the
means. No suspensions were reported for the 2011-2012 school year at High School B and for the
144
2015-2016 school year at High School A because fewer than 10 suspensions occurred. Thus, no
analyses were performed.
Research Question 4
What is the difference in the 2011-2012 graduation rate compared to the 2015-2016
graduation rate after the school’s transition to a community school in a large urban school district
in the southern United States and compared to similar high schools in the same school district?
Research Question 4 sought to compare the difference in the LUS 2011-2012 graduation
rate with its 2015-2016 graduation rate after the school’s transition to a community school in a
large urban school district in the southern United States and with similar high schools in the
same school district. To answer Research Question 4, the researcher used released data from the
XDOE and data received from the LUS School District. The researcher crossed referenced the
two data sets. For compatibility, only students with graduating codes according to the XDOE
were included in the analysis. Students in the LUS School District data set with non-graduate
codes were removed from the data set. Table 47 contains a side-by-side comparison of the
graduation rate for the senior cohort for the LUS Community School for the 2011-2012 and
2015-2016 school years. The percentage of graduates for the 2011-2012 school year (GR = 79.8)
and the percentage of graduates for the 2015-2016 school year (GR = 87.6) were compared, and
the percentage of graduates at the LUS Community School was greater in 2015-2016 than in
2011-2012. Thus, the percentage of graduates was higher during the 2015-2016 school year after
the school’s transition to a community school in a large urban school district in the southern
United States when compared to the percentage of graduates prior to the school’s transition to a
community school.
145
Table 47
LUS Community School Graduation Rate Comparison, 2011-2012 and 2015-2016 Cohorts
2011-12 2015-16
Cohort
f
Graduates
f (%)
Cohort
f
Graduates
f (%)
LUS Community
School 405 323 (79.8%) 515 451 (87.6%)
Source. State Department of Education, 2017
Research Question 4 compared the 2011-2012 graduation rate to the 2015-2016
graduation rate at the LUS Community School. For the 2011-2012 school year, 405 seniors were
in the senior cohort. Of the 405 seniors, 323 seniors (79.8%) were classified as graduates. For the
2015-2016 school year, 515 seniors were in the senior cohort. Of the 515 seniors, 451 seniors
(87.6%) were classified as graduates. The LUS Community School experienced an increase
(+8.1%) in the number of graduates from the 2011-2012 school year to the 2015-2016 school
year.
Over the course of the five years of this study, 2011-2016, the LUS Community School
experienced a gradual increase (+7.8) in graduation rate. Table 48 displays data for the LUS
Community School’s graduation rate over the five years of this study, 2011-2016. For the 2011-
2012 school year, 405 seniors were in the senior cohort. Of the 405 seniors, 323 seniors (79.8%)
were classified as graduates. The graduation rate at the LUS Community School decreased (-
2.5%) in the 2012-2013 school year with 337 of 436 (77.3%) seniors in the cohort graduating.
The graduation rate at the LUS Community School increased slightly (+0.4%) in 2013-2014
school year, with 352 of 452 seniors (77.7%) graduating. There was a spike (+5.8%) in the
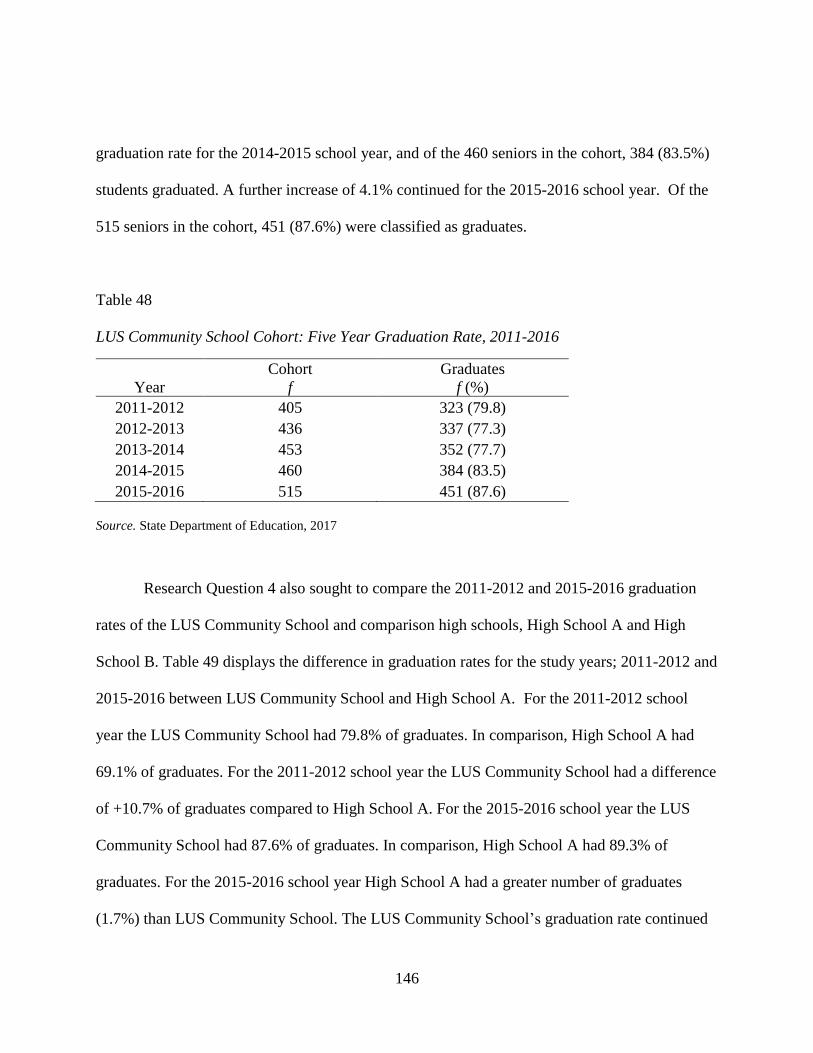
146
graduation rate for the 2014-2015 school year, and of the 460 seniors in the cohort, 384 (83.5%)
students graduated. A further increase of 4.1% continued for the 2015-2016 school year. Of the
515 seniors in the cohort, 451 (87.6%) were classified as graduates.
Table 48
LUS Community School Cohort: Five Year Graduation Rate, 2011-2016
Year
Cohort
f
Graduates
f (%)
2011-2012 405 323 (79.8)
2012-2013 436 337 (77.3)
2013-2014 453 352 (77.7)
2014-2015 460 384 (83.5)
2015-2016 515 451 (87.6)
Source. State Department of Education, 2017
Research Question 4 also sought to compare the 2011-2012 and 2015-2016 graduation
rates of the LUS Community School and comparison high schools, High School A and High
School B. Table 49 displays the difference in graduation rates for the study years; 2011-2012 and
2015-2016 between LUS Community School and High School A. For the 2011-2012 school
year the LUS Community School had 79.8% of graduates. In comparison, High School A had
69.1% of graduates. For the 2011-2012 school year the LUS Community School had a difference
of +10.7% of graduates compared to High School A. For the 2015-2016 school year the LUS
Community School had 87.6% of graduates. In comparison, High School A had 89.3% of
graduates. For the 2015-2016 school year High School A had a greater number of graduates
(1.7%) than LUS Community School. The LUS Community School’s graduation rate continued
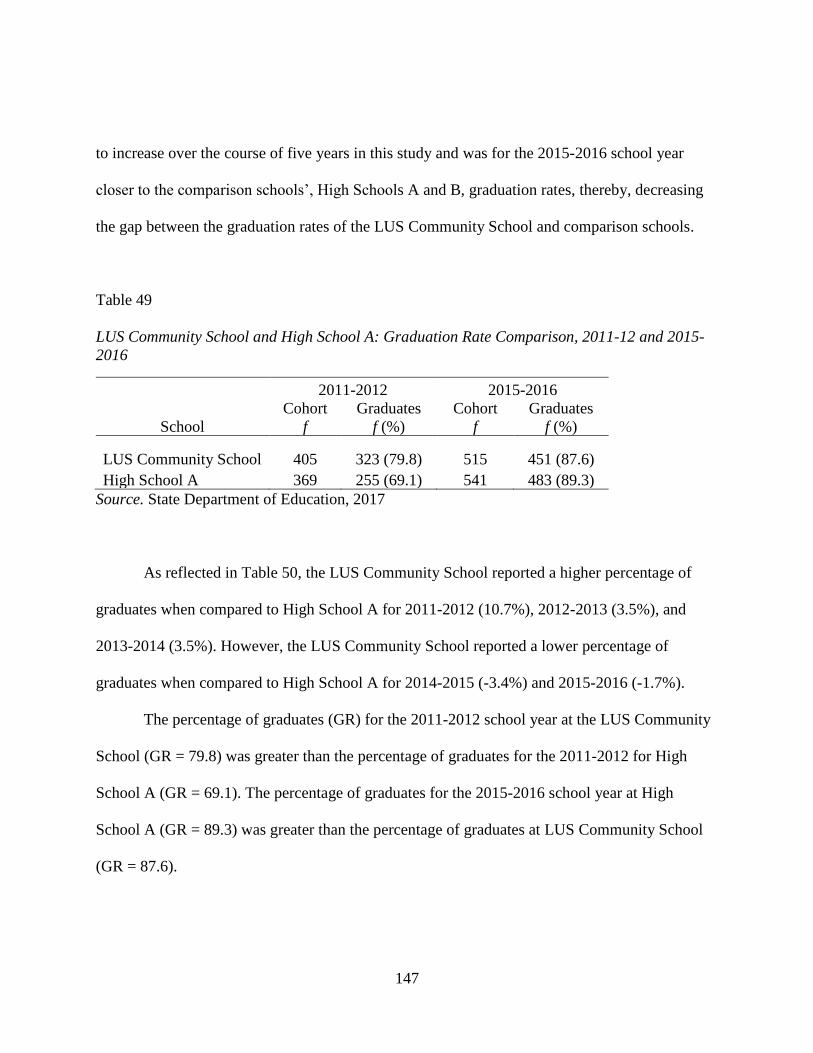
147
to increase over the course of five years in this study and was for the 2015-2016 school year
closer to the comparison schools’, High Schools A and B, graduation rates, thereby, decreasing
the gap between the graduation rates of the LUS Community School and comparison schools.
Table 49
LUS Community School and High School A: Graduation Rate Comparison, 2011-12 and 2015-
2016
2011-2012 2015-2016
School
Cohort
f
Graduates
f (%)
Cohort
f
Graduates
f (%)
LUS Community School 405 323 (79.8) 515 451 (87.6)
High School A 369 255 (69.1) 541 483 (89.3)
Source. State Department of Education, 2017
As reflected in Table 50, the LUS Community School reported a higher percentage of
graduates when compared to High School A for 2011-2012 (10.7%), 2012-2013 (3.5%), and
2013-2014 (3.5%). However, the LUS Community School reported a lower percentage of
graduates when compared to High School A for 2014-2015 (-3.4%) and 2015-2016 (-1.7%).
The percentage of graduates (GR) for the 2011-2012 school year at the LUS Community
School (GR = 79.8) was greater than the percentage of graduates for the 2011-2012 for High
School A (GR = 69.1). The percentage of graduates for the 2015-2016 school year at High
School A (GR = 89.3) was greater than the percentage of graduates at LUS Community School
(GR = 87.6).
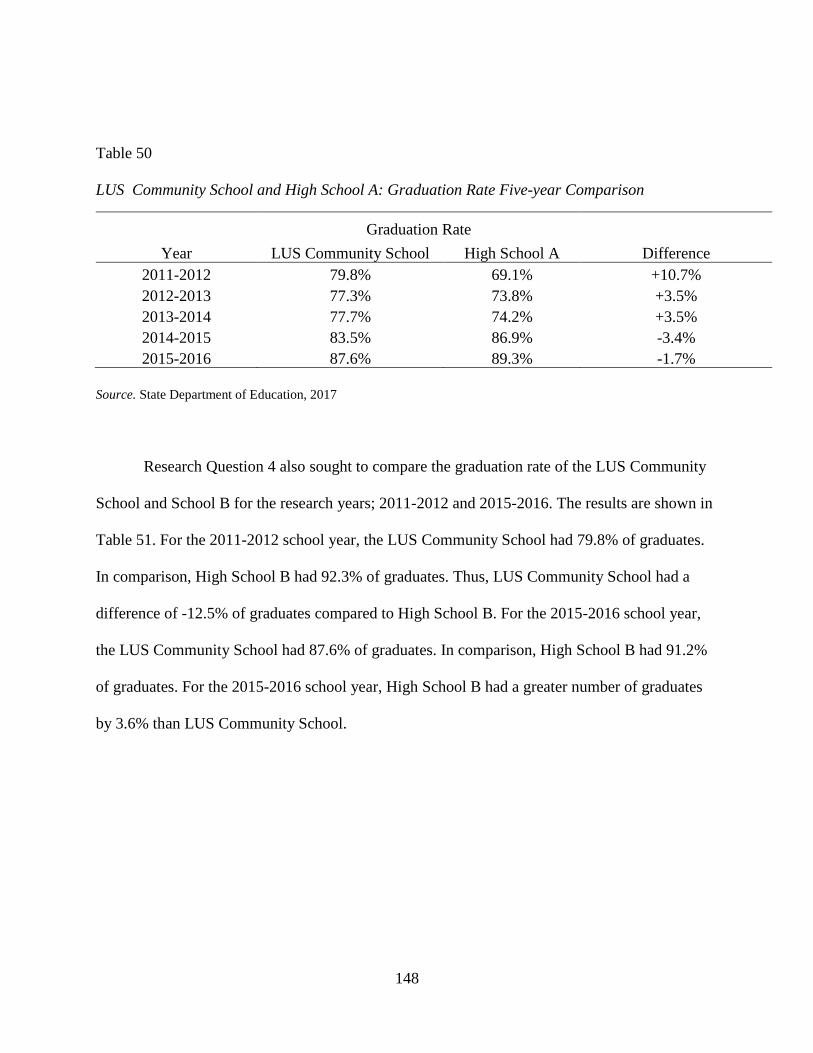
148
Table 50
LUS Community School and High School A: Graduation Rate Five-year Comparison
Graduation Rate
Year LUS Community School High School A Difference
2011-2012 79.8% 69.1% +10.7%
2012-2013 77.3% 73.8% +3.5%
2013-2014 77.7% 74.2% +3.5%
2014-2015 83.5% 86.9% -3.4%
2015-2016 87.6% 89.3% -1.7%
Source. State Department of Education, 2017
Research Question 4 also sought to compare the graduation rate of the LUS Community
School and School B for the research years; 2011-2012 and 2015-2016. The results are shown in
Table 51. For the 2011-2012 school year, the LUS Community School had 79.8% of graduates.
In comparison, High School B had 92.3% of graduates. Thus, LUS Community School had a
difference of -12.5% of graduates compared to High School B. For the 2015-2016 school year,
the LUS Community School had 87.6% of graduates. In comparison, High School B had 91.2%
of graduates. For the 2015-2016 school year, High School B had a greater number of graduates
by 3.6% than LUS Community School.
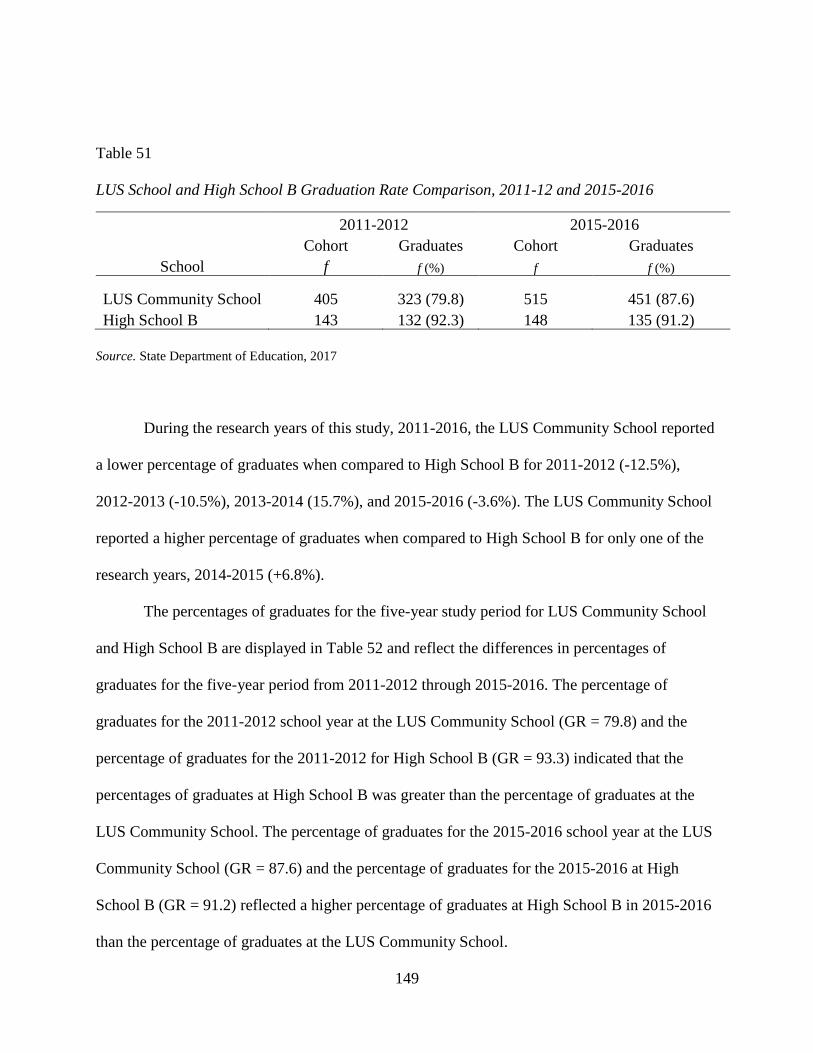
149
Table 51
LUS School and High School B Graduation Rate Comparison, 2011-12 and 2015-2016
2011-2012 2015-2016
Cohort Graduates Cohort Graduates
School f f (%) f f (%)
LUS Community School 405 323 (79.8) 515 451 (87.6)
High School B 143 132 (92.3) 148 135 (91.2)
Source. State Department of Education, 2017
During the research years of this study, 2011-2016, the LUS Community School reported
a lower percentage of graduates when compared to High School B for 2011-2012 (-12.5%),
2012-2013 (-10.5%), 2013-2014 (15.7%), and 2015-2016 (-3.6%). The LUS Community School
reported a higher percentage of graduates when compared to High School B for only one of the
research years, 2014-2015 (+6.8%).
The percentages of graduates for the five-year study period for LUS Community School
and High School B are displayed in Table 52 and reflect the differences in percentages of
graduates for the five-year period from 2011-2012 through 2015-2016. The percentage of
graduates for the 2011-2012 school year at the LUS Community School (GR = 79.8) and the
percentage of graduates for the 2011-2012 for High School B (GR = 93.3) indicated that the
percentages of graduates at High School B was greater than the percentage of graduates at the
LUS Community School. The percentage of graduates for the 2015-2016 school year at the LUS
Community School (GR = 87.6) and the percentage of graduates for the 2015-2016 at High
School B (GR = 91.2) reflected a higher percentage of graduates at High School B in 2015-2016
than the percentage of graduates at the LUS Community School.
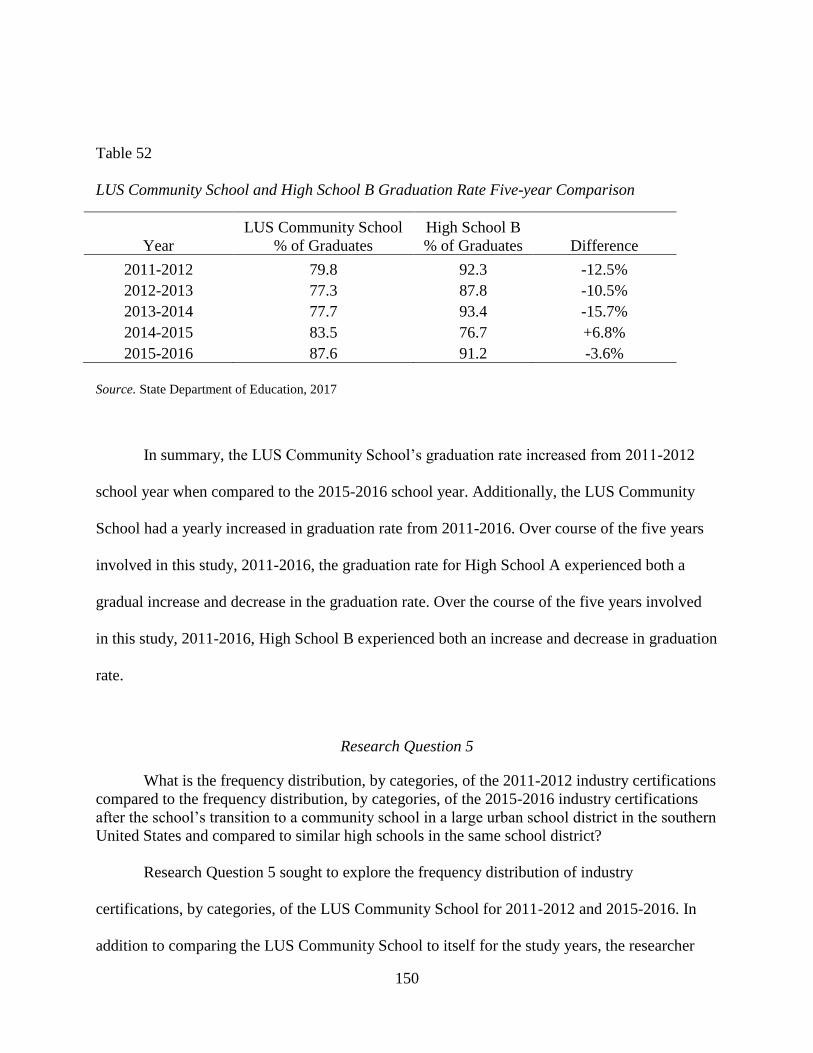
150
Table 52
LUS Community School and High School B Graduation Rate Five-year Comparison
Year
LUS Community School
% of Graduates
High School B
% of Graduates Difference
2011-2012 79.8 92.3 -12.5%
2012-2013 77.3 87.8 -10.5%
2013-2014 77.7 93.4 -15.7%
2014-2015 83.5 76.7 +6.8%
2015-2016 87.6 91.2 -3.6%
Source. State Department of Education, 2017
In summary, the LUS Community School’s graduation rate increased from 2011-2012
school year when compared to the 2015-2016 school year. Additionally, the LUS Community
School had a yearly increased in graduation rate from 2011-2016. Over course of the five years
involved in this study, 2011-2016, the graduation rate for High School A experienced both a
gradual increase and decrease in the graduation rate. Over the course of the five years involved
in this study, 2011-2016, High School B experienced both an increase and decrease in graduation
rate.
Research Question 5
What is the frequency distribution, by categories, of the 2011-2012 industry certifications
compared to the frequency distribution, by categories, of the 2015-2016 industry certifications
after the school’s transition to a community school in a large urban school district in the southern
United States and compared to similar high schools in the same school district?
Research Question 5 sought to explore the frequency distribution of industry
certifications, by categories, of the LUS Community School for 2011-2012 and 2015-2016. In
addition to comparing the LUS Community School to itself for the study years, the researcher
151
also compared the frequency distribution of industry certifications, by categories of the LUS
Community School and comparison schools. The researcher did not receive any data on industry
certification for High School B from the State Department of Education. This prevented a full
determination of whether there was a difference in frequency distribution, by categories, of both
comparison schools. Therefore, for comparison purposes to similar high schools, the LUS
Community School was only compared to High School A. Table 53 provides a side-by-side
comparison of the frequency distribution, by categories, of the 2011-2012 industry certifications
compared to the frequency distribution, by categories, of the 2015-2016 industry certifications at
the LUS Community School.
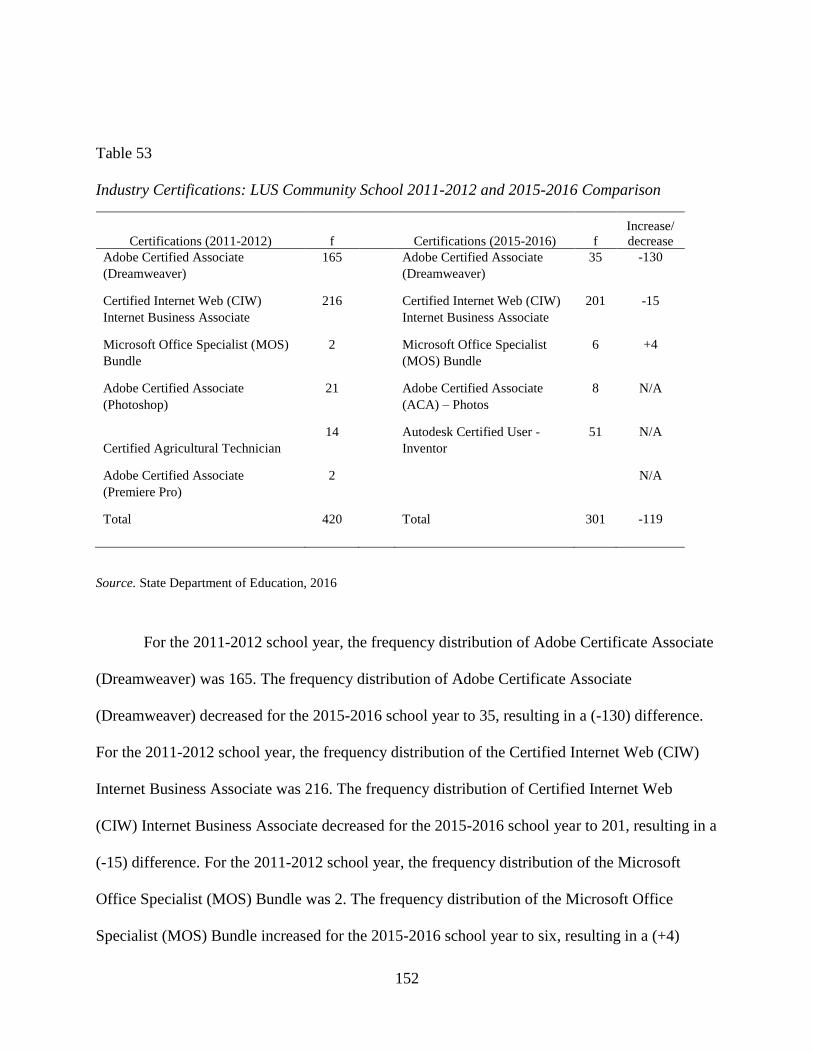
152
Table 53
Industry Certifications: LUS Community School 2011-2012 and 2015-2016 Comparison
Certifications (2011-2012) f Certifications (2015-2016) f
Increase/
decrease
Adobe Certified Associate
(Dreamweaver)
165
Adobe Certified Associate
(Dreamweaver)
35 -130
Certified Internet Web (CIW)
Internet Business Associate
216
Certified Internet Web (CIW)
Internet Business Associate
201 -15
Microsoft Office Specialist (MOS)
Bundle
2
Microsoft Office Specialist
(MOS) Bundle
6 +4
Adobe Certified Associate
(Photoshop)
21
Adobe Certified Associate
(ACA) – Photos
8 N/A
Certified Agricultural Technician
14
Autodesk Certified User -
Inventor
51 N/A
Adobe Certified Associate
(Premiere Pro)
2
N/A
Total 420
Total 301 -119
Source. State Department of Education, 2016
For the 2011-2012 school year, the frequency distribution of Adobe Certificate Associate
(Dreamweaver) was 165. The frequency distribution of Adobe Certificate Associate
(Dreamweaver) decreased for the 2015-2016 school year to 35, resulting in a (-130) difference.
For the 2011-2012 school year, the frequency distribution of the Certified Internet Web (CIW)
Internet Business Associate was 216. The frequency distribution of Certified Internet Web
(CIW) Internet Business Associate decreased for the 2015-2016 school year to 201, resulting in a
(-15) difference. For the 2011-2012 school year, the frequency distribution of the Microsoft
Office Specialist (MOS) Bundle was 2. The frequency distribution of the Microsoft Office
Specialist (MOS) Bundle increased for the 2015-2016 school year to six, resulting in a (+4)
153
difference. For comparison purposes, the LUS Community School only displayed frequency
distribution for both school years, 2011-2012 and 2015-2016, with the following certificates:
Adobe Certificate Associate (Dreamweaver), Certified Internet Web (CIW) Internet Business
Associate, and Microsoft Office Specialist (MOS) Bundle. For the 2011-2012 school year, the
frequency distribution of Adobe Certified Associate (Photoshop) was 21. For the 2011-2012
school year, the frequency distribution of Certified Agricultural Technician was 14. For the
2011-2012 school year, the frequency distribution of Adobe Certified Associate (Premiere Pro)
was 2.
The following certificate frequency distributions were reported for the 2011-2012 at the
LUS Community School but not for the 2015-2016 school year: Adobe Certified Associate
(Photoshop), Certified Agricultural Technician, and Adobe Certified Associate (Premiere Pro).
For 2015-2016, the frequency distribution of Adobe Certified Associate (ACA) – Photos was
eight. For 2015-2016, the frequency distribution of Autodesk Certified User –Inventor was 51.
During the 2011-2012 school year, the LUS Community School had a frequency of 420. During
the 2015-2015 school year, the LUS Community School had a frequency of 301. This resulted in
a decrease (-119) of frequencies when comparing the 2011-2012 industry certifications for the
school year to the 2015-2016 school year for the LUS Community School.
Table 54 displays data for industry certifications at the LUS Community School for the
2011-2012 by grade level and pass rates for the certification. During the 2011-2012 school year,
there were 420 industry certifications taken at the LUS Community School. Of the 420
certifications, 401 certifications were passed resulting in a 95% pass rate of all industry
certifications. During the 2011-2012 school year, 62 ninth-grade students took the Adobe
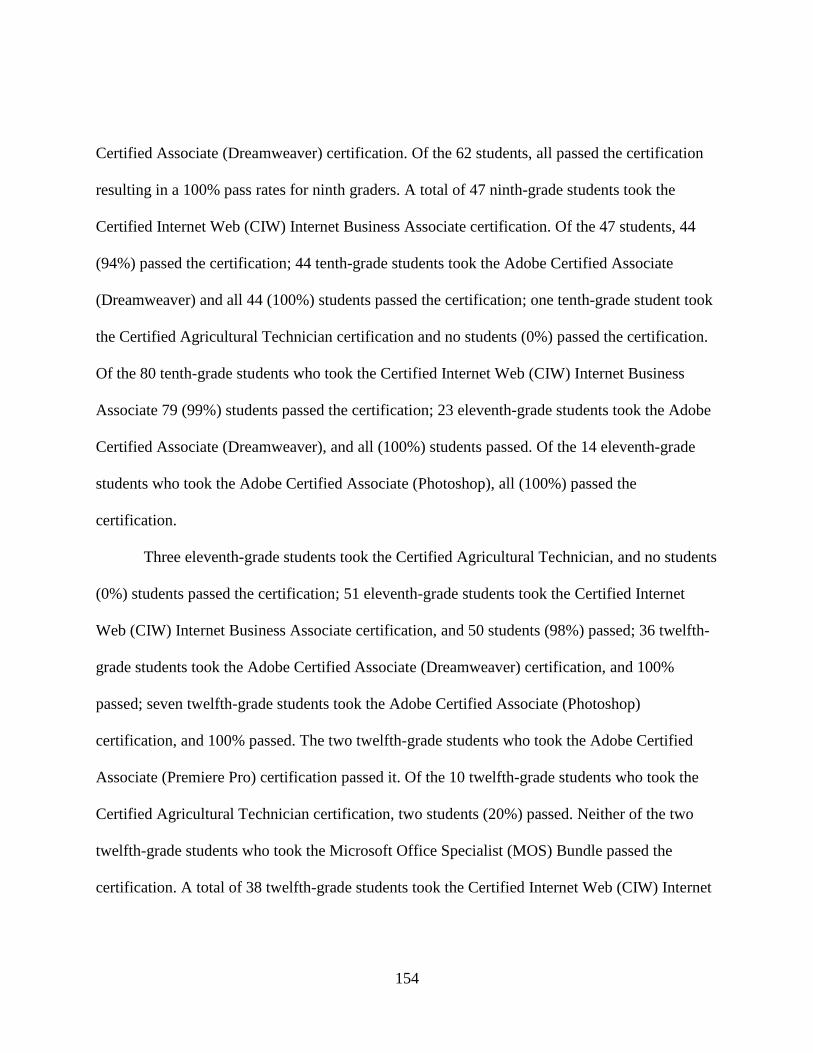
154
Certified Associate (Dreamweaver) certification. Of the 62 students, all passed the certification
resulting in a 100% pass rates for ninth graders. A total of 47 ninth-grade students took the
Certified Internet Web (CIW) Internet Business Associate certification. Of the 47 students, 44
(94%) passed the certification; 44 tenth-grade students took the Adobe Certified Associate
(Dreamweaver) and all 44 (100%) students passed the certification; one tenth-grade student took
the Certified Agricultural Technician certification and no students (0%) passed the certification.
Of the 80 tenth-grade students who took the Certified Internet Web (CIW) Internet Business
Associate 79 (99%) students passed the certification; 23 eleventh-grade students took the Adobe
Certified Associate (Dreamweaver), and all (100%) students passed. Of the 14 eleventh-grade
students who took the Adobe Certified Associate (Photoshop), all (100%) passed the
certification.
Three eleventh-grade students took the Certified Agricultural Technician, and no students
(0%) students passed the certification; 51 eleventh-grade students took the Certified Internet
Web (CIW) Internet Business Associate certification, and 50 students (98%) passed; 36 twelfth-
grade students took the Adobe Certified Associate (Dreamweaver) certification, and 100%
passed; seven twelfth-grade students took the Adobe Certified Associate (Photoshop)
certification, and 100% passed. The two twelfth-grade students who took the Adobe Certified
Associate (Premiere Pro) certification passed it. Of the 10 twelfth-grade students who took the
Certified Agricultural Technician certification, two students (20%) passed. Neither of the two
twelfth-grade students who took the Microsoft Office Specialist (MOS) Bundle passed the
certification. A total of 38 twelfth-grade students took the Certified Internet Web (CIW) Internet
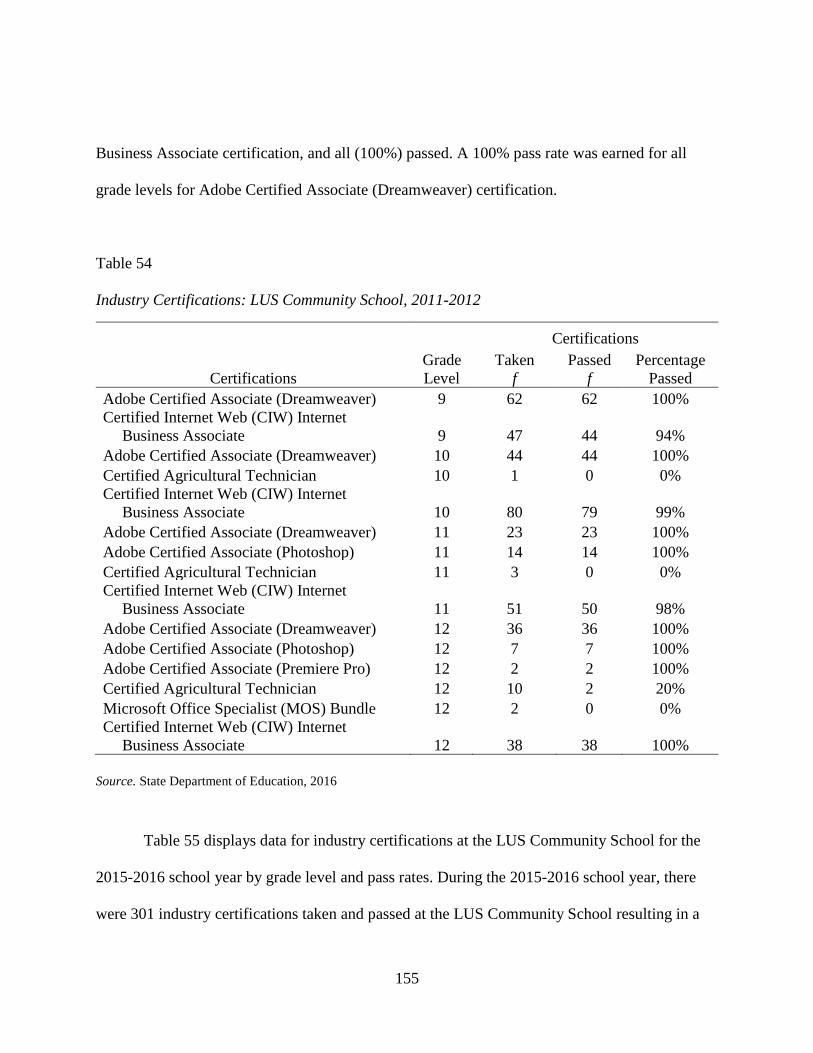
155
Business Associate certification, and all (100%) passed. A 100% pass rate was earned for all
grade levels for Adobe Certified Associate (Dreamweaver) certification.
Table 54
Industry Certifications: LUS Community School, 2011-2012
Certifications
Certifications
Grade
Level
Taken
f
Passed
f
Percentage
Passed
Adobe Certified Associate (Dreamweaver) 9 62 62 100%
Certified Internet Web (CIW) Internet
Business Associate 9 47 44 94%
Adobe Certified Associate (Dreamweaver) 10 44 44 100%
Certified Agricultural Technician 10 1 0 0%
Certified Internet Web (CIW) Internet
Business Associate 10 80 79 99%
Adobe Certified Associate (Dreamweaver) 11 23 23 100%
Adobe Certified Associate (Photoshop) 11 14 14 100%
Certified Agricultural Technician 11 3 0 0%
Certified Internet Web (CIW) Internet
Business Associate 11 51 50 98%
Adobe Certified Associate (Dreamweaver) 12 36 36 100%
Adobe Certified Associate (Photoshop) 12 7 7 100%
Adobe Certified Associate (Premiere Pro) 12 2 2 100%
Certified Agricultural Technician 12 10 2 20%
Microsoft Office Specialist (MOS) Bundle 12 2 0 0%
Certified Internet Web (CIW) Internet
Business Associate 12 38 38 100%
Source. State Department of Education, 2016
Table 55 displays data for industry certifications at the LUS Community School for the
2015-2016 school year by grade level and pass rates. During the 2015-2016 school year, there
were 301 industry certifications taken and passed at the LUS Community School resulting in a
156
100% pass rate of all industry certifications for the 2015-2016 school year. A total of 24 ninth-
grade students took and passed (100%) the Autodesk Certified User – Inventor. One ninth-grade
student took and passed the Adobe Certified Associate (ACA) – Dreamweaver. One ninth-grade
student took and passed the Microsoft Office Specialist (MOS) Bundle. A total of 84 ninth-grade
students took and passed the Certified Internet Web (CIW) Internet Business Associate
certification, and 17 tenth-grade students took and passed the Autodesk Certified User –
Inventor.
A total of 10 tenth-grade students took and passed the Adobe Certified Associate (ACA)
– Dreamweaver; two tenth-grade students took and passed the Adobe Certified Associate (ACA)
- Photos; two tenth-grade students took and passed the Microsoft Office Specialist (MOS)
Bundle certification; 42 tenth-grade students took and passed the Certified Internet Web (CIW)
Internet Business Associate certification. six eleventh-grade students took and passed the
Autodesk Certified User – Inventor; 15 eleventh-grade students took and passed the Adobe
Certified Associate (ACA) – Dreamweaver certification; three eleventh-grade students took and
passed the Adobe Certified Associate (ACA) – Photos; two eleventh-grade students took and
passed the Microsoft Office Specialist (MOS) Bundle certification; 40 eleventh-grade students
took and passed the Certified Internet Web (CIW) Internet Business Associate certification. For
twelfth-grade, four students took and passed the Autodesk Certified User – Inventor; nine
twelfth-grade students took and passed the Adobe Certified Associate (ACA) – Dreamweaver;
three twelfth-grade students took and passed the Adobe Certified Associate (ACA) – Photos
certification; two twelfth-grade student took and passed the Microsoft Office Specialist (MOS)
157
Bundle certification; 35 twelfth-grade students took and passed the Certified Internet Web (CIW)
Internet Business Associate certification.
Table 55
Industry Certifications: LUS Community School, 2015-2016
Certifications
Certifications
Grade
Level
Taken
f
Passed
f
Percentage
Passed
Autodesk Certified User -Inventor 9 24 24 100%
Adobe Certified Associate (ACA) –
Dreamweaver 9 1 1 100%
Microsoft Office Specialist (MOS) Bundle 9 1 1 100%
Certified Internet Web (CIW) Internet
Business Associate 9 84 84 100%
Autodesk Certified User -Inventor 10 17 17 100%
Adobe Certified Associate (ACA) –
Dreamweaver 10 10 10 100%
Adobe Certified Associate (ACA) – Photos 10 2 2 100%
Microsoft Office Specialist (MOS) Bundle 10 2 2 100%
Certified Internet Web (CIW) Internet
Business Associate 10 42 42 100%
Autodesk Certified User -Inventor 11 6 6 100%
Adobe Certified Associate (ACA) –
Dreamweaver 11 15 15 100%
Adobe Certified Associate (ACA) – Photos 11 3 3 100%
Microsoft Office Specialist (MOS) Bundle 11 2 2 100%
Certified Internet Web (CIW) Internet
Business Associate 11 40 40 100%
Autodesk Certified User -Inventor 12 4 4 100%
Adobe Certified Associate (ACA) –
Dreamweaver 12 9 9 100%
Adobe Certified Associate (ACA) – Photos 12 3 3 100%
Microsoft Office Specialist (MOS) Bundle 12 1 1 100%
Certified Internet Web (CIW) Internet
Business Associate 12 35 35 100%
Source. State Department of Education, 2016
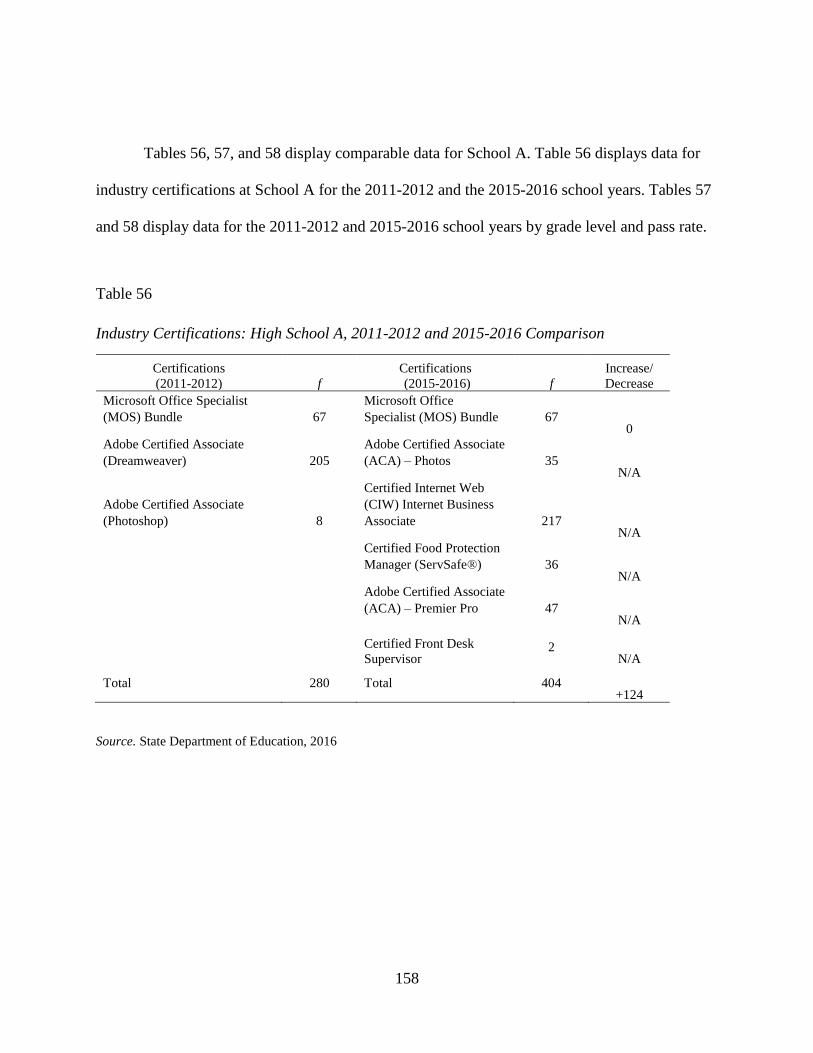
158
Tables 56, 57, and 58 display comparable data for School A. Table 56 displays data for
industry certifications at School A for the 2011-2012 and the 2015-2016 school years. Tables 57
and 58 display data for the 2011-2012 and 2015-2016 school years by grade level and pass rate.
Table 56
Industry Certifications: High School A, 2011-2012 and 2015-2016 Comparison
Certifications
(2011-2012) f
Certifications
(2015-2016) f
Increase/
Decrease
Microsoft Office Specialist
(MOS) Bundle 67
Microsoft Office
Specialist (MOS) Bundle 67 0
Adobe Certified Associate
(Dreamweaver) 205
Adobe Certified Associate
(ACA) – Photos 35 N/A
Adobe Certified Associate
(Photoshop) 8
Certified Internet Web
(CIW) Internet Business
Associate 217 N/A
Certified Food Protection
Manager (ServSafe®) 36 N/A
Adobe Certified Associate
(ACA) – Premier Pro 47 N/A
Certified Front Desk
Supervisor 2
N/A
Total 280 Total 404 +124
Source. State Department of Education, 2016
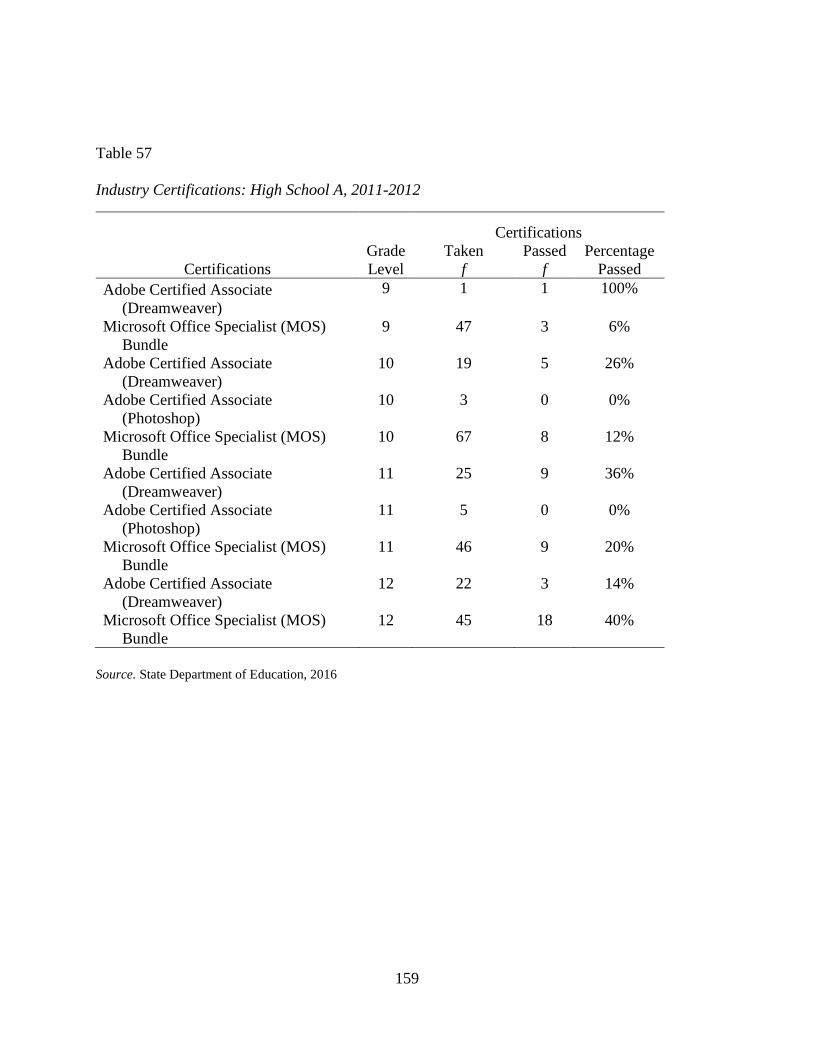
159
Table 57
Industry Certifications: High School A, 2011-2012
Certifications
Certifications
Grade
Level
Taken
f
Passed
f
Percentage
Passed
Adobe Certified Associate
(Dreamweaver)
9 1 1 100%
Microsoft Office Specialist (MOS)
Bundle
9 47 3 6%
Adobe Certified Associate
(Dreamweaver)
10 19 5 26%
Adobe Certified Associate
(Photoshop)
10 3 0 0%
Microsoft Office Specialist (MOS)
Bundle
10 67 8 12%
Adobe Certified Associate
(Dreamweaver)
11 25 9 36%
Adobe Certified Associate
(Photoshop)
11 5 0 0%
Microsoft Office Specialist (MOS)
Bundle
11 46 9 20%
Adobe Certified Associate
(Dreamweaver)
12 22 3 14%
Microsoft Office Specialist (MOS)
Bundle
12 45 18 40%
Source. State Department of Education, 2016
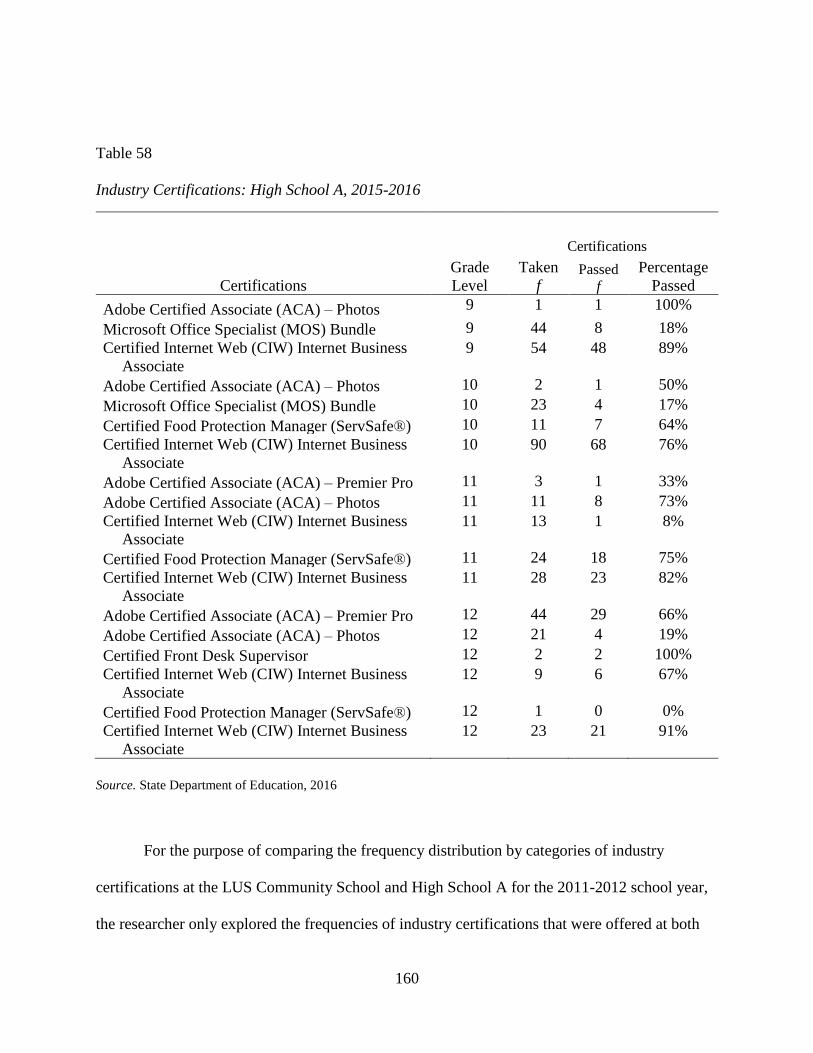
160
Table 58
Industry Certifications: High School A, 2015-2016
Certifications
Certifications
Grade
Level
Taken
f Passed
f
Percentage
Passed
Adobe Certified Associate (ACA) – Photos 9 1 1 100%
Microsoft Office Specialist (MOS) Bundle 9 44 8 18%
Certified Internet Web (CIW) Internet Business
Associate
9 54 48 89%
Adobe Certified Associate (ACA) – Photos 10 2 1 50%
Microsoft Office Specialist (MOS) Bundle 10 23 4 17%
Certified Food Protection Manager (ServSafe®) 10 11 7 64%
Certified Internet Web (CIW) Internet Business
Associate
10 90 68 76%
Adobe Certified Associate (ACA) – Premier Pro 11 3 1 33%
Adobe Certified Associate (ACA) – Photos 11 11 8 73%
Certified Internet Web (CIW) Internet Business
Associate
11 13 1 8%
Certified Food Protection Manager (ServSafe®) 11 24 18 75%
Certified Internet Web (CIW) Internet Business
Associate
11 28 23 82%
Adobe Certified Associate (ACA) – Premier Pro 12 44 29 66%
Adobe Certified Associate (ACA) – Photos 12 21 4 19%
Certified Front Desk Supervisor 12 2 2 100%
Certified Internet Web (CIW) Internet Business
Associate
12 9 6 67%
Certified Food Protection Manager (ServSafe®) 12 1 0 0%
Certified Internet Web (CIW) Internet Business
Associate
12 23 21 91%
Source. State Department of Education, 2016
For the purpose of comparing the frequency distribution by categories of industry
certifications at the LUS Community School and High School A for the 2011-2012 school year,
the researcher only explored the frequencies of industry certifications that were offered at both
161
schools. Certifications not offered at both schools were not included in the comparison. Table 59
provides a side-by-side displays of industry certifications for the LUS Community School and
High School A for the 2011-2012 school year. Industry certifications offered at both the LUS
Community School and High School A for the 2011-2012 school year were: Adobe Certified
Associate (Dreamweaver), Adobe Certified Associate (Photoshop) and Microsoft Office
Specialist (MOS) Bundle. Of the three compared certifications, students at the LUS Community
School had taken 181 industry certifications, 179 (98.9%) of which were passed. In comparison,
High School A students had taken 117 industry certifications, and 35 (29.9%) certifications were
passed. During the 2011-2012 school year, the frequency of industry certifications at LUS
Community School was 181, compared to a frequency of 117 (+64) at High School A
At the LUS Community School, 62 ninth-grade students (+61) took and passed the Adobe
Certified Associate (Dreamweaver) certification and one ninth-grade student took and passed the
Adobe Certified Associate (Dreamweaver) at High School A, resulting in a 100% pass rates for
Adobe Certified Associate (Dreamweaver) for ninth-grade students. A total of 44 tenth-grade
students (+25) took the Adobe Certified Associate (Dreamweaver) certification at the LUS
Community School, and 19 students took the Adobe Certified Associate (Dreamweaver)
certification at High School A. The pass rate for the LUS Community school was 100%
(-73.69%) as compared to 26.31% at High School A for Adobe Certified Associate
(Dreamweaver) for tenth-grade students. A total of 23 eleventh-grade LUS students (-2) was
compared to 25 students who took the Adobe Certified Associate (Dreamweaver) certification at
High School A. The pass rate for the LUS Community School was 100% (+64) as compared to
36% at High School A for Adobe Certified Associate (Dreamweaver) for eleventh-grade. 14
162
eleventh-grade students (+9) took the Adobe Certified Associate (Photoshop) at the LUS
Community School compared to five students at High School A. The pass rate for the LUS
Community School was 100% (+100%) as compared to the 0% at High School A for Adobe
Certified Associate (Photoshop) for eleventh-grade students. A total of 36 twelfth-grade students
(+14) took the Adobe Certified Associate (Dreamweaver) certification at the LUS Community
School compared to 22 students at High School A. The pass rate for the LUS Community School
was 100% (+86.36%) as compared to 13.64% at High School A for Adobe Certified Associate
(Dreamweaver) for twelfth-grade students. Two students took the Microsoft Office Specialist
(MOS) Bundle (-43) at the LUS Community School compared to 45 students at High School A.
The pass rate for the LUS Community School was 0% (-40%) as compared to 40% at High
School A for Microsoft Office Specialist (MOS) Bundle for twelfth-grade students.
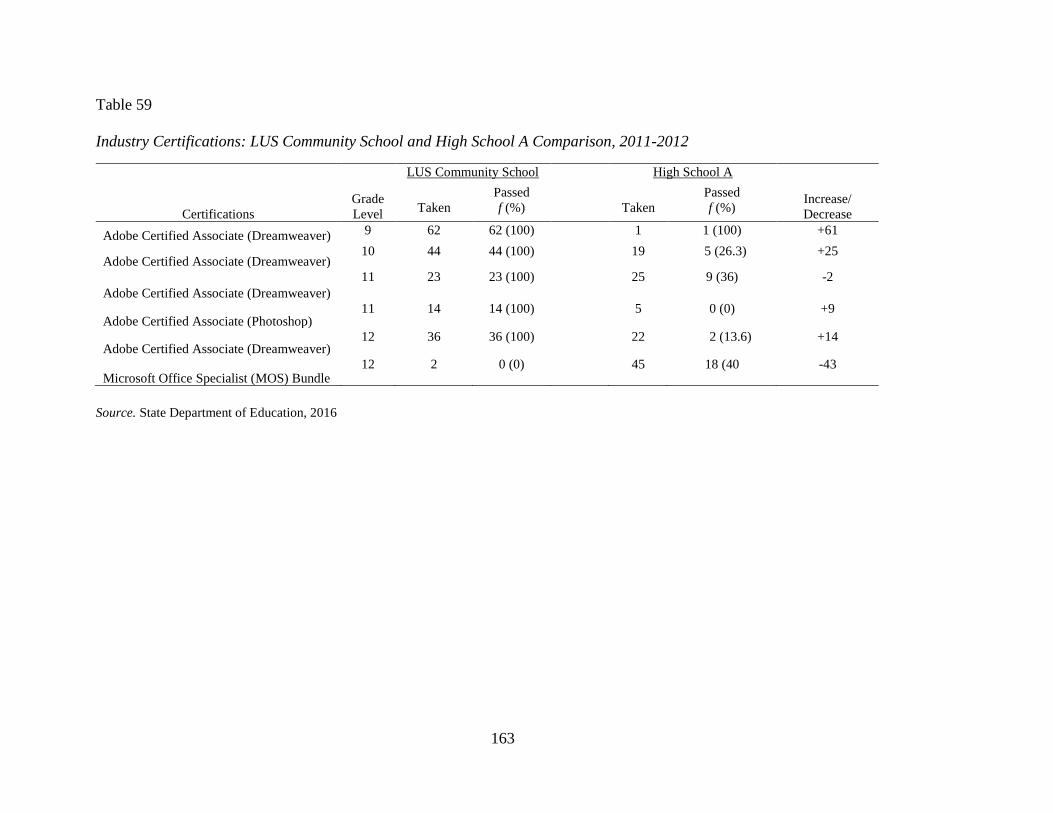
163
Table 59
Industry Certifications: LUS Community School and High School A Comparison, 2011-2012
LUS Community School High School A
Certifications
Grade
Level
Taken
Passed
f (%)
Taken
Passed
f (%) Increase/
Decrease
Adobe Certified Associate (Dreamweaver) 9 62 62 (100) 1 1 (100) +61
Adobe Certified Associate (Dreamweaver) 10 44 44 (100) 19 5 (26.3) +25
Adobe Certified Associate (Dreamweaver)
11 23 23 (100) 25 9 (36) -2
Adobe Certified Associate (Photoshop) 11 14 14 (100) 5 0 (0) +9
Adobe Certified Associate (Dreamweaver) 12 36 36 (100) 22 2 (13.6) +14
Microsoft Office Specialist (MOS) Bundle 12 2 0 (0) 45 18 (40 -43
Source. State Department of Education, 2016
164
For the purpose of examining the categories of industry certifications at the LUS
Community School and High School A for the 2015-2016 school year, the researcher only
explored the frequencies of industry certifications that were offered at both schools.
Certifications not offered at both schools were not included in the comparison. Table 60 provides
a side-by-side display of industry certification for the LUS Community School and High School
A for the 2015-2016 school year. Industry certification offered at both the LUS Community
School and High School A for the 2015-2016 school year were: Microsoft Office Specialist
(MOS) Bundle, Certified Internet Web (CIW) Internet Business Associate, and Adobe Certified
Associate (ACA) – Photos. Of the three compared certifications, there were 179 industry
certifications taken at the LUS Community School, of which 100% were passed. For High
School A, 286 industry certifications were taken, and 165 (57.7%) certifications were passed.
During the 2015-2016 school year, the industry certifications taken at LUS Community School
was 179, compared to 286 (-107) at High School A.
At the LUS Community School, one ninth-grade student (-43) took the Microsoft Office
Specialist (MOS) Bundle certification and 44 ninth-grade students took Microsoft Office
Specialist (MOS) Bundle certification at High School A. The pass rate for the LUS Community
School was 100% (+81.82%) as compared to 18.18% at High School A for Microsoft Office
Specialist (MOS) Bundle certification for ninth-grade students. A total of 84 ninth-grade students
(+30) took the Certified Internet Web (CIW) Internet Business Associate certification at the LUS
Community School, and 54 students took the Certified Internet Web (CIW) Internet Business
Associate certification at High School A. The pass rate for the LUS Community School was
100% (+11.11%) as compared to 88.89% at High School A for Certified Internet Web (CIW)
165
Internet Business Associate for ninth-grade students. There were two LUS Community School
tenth-grade students (0) compared to two students who took the Adobe Certified Associate
(ACA) – Photos certification at High School A. The pass rate for the LUS Community School
was 100% (+50) as compared to 50% at High School A Adobe Certified Associate (ACA) –
Photos certification for tenth-grade students. Two tenth-grade students (-21) took the Microsoft
Office Specialist (MOS) Bundle at the LUS Community School compared to 23 students at High
School A. The pass rate for the LUS Community School was 100% (+82.64%) as compared to
the 17.39% at High School A for Microsoft Office Specialist (MOS) Bundle for tenth-grade
students. A total of 42 tenth-grade students (-48) took the Certified Internet Web (CIW) Internet
Business Associate certification at the LUS Community School compared to 90 students at High
School A. The pass rate for the LUS Community School was 100% (+13.64%) as compared to
75.56% at High School A for Certified Internet Web (CIW) Internet Business Associate for
tenth-grade students.
Three eleventh-grade students (-8) took the Adobe Certified Associate (ACA) – Photos at
the LUS Community School as compared to 11 students at High School A. The pass rate for the
LUS Community School was 100% (+27.27%) as compared to 72.73% High School A for
Adobe Certified Associate (ACA) –Photos for eleventh-grade students. Two eleventh-grade
students (-11) took the Microsoft Office Specialist (MOS) Bundle as compared to 11 students at
High School A. The pass rate for the LUS Community School was 100% (+92.31) as compared
to 7.69% at High School A for Microsoft Office Specialist (MOS) Bundle for eleventh-grade
students. A total of 40 eleventh-grade students (+12) took the Certified Internet Web (CIW)
Internet Business Associate certification as compared to 28 students at High School A. The pass
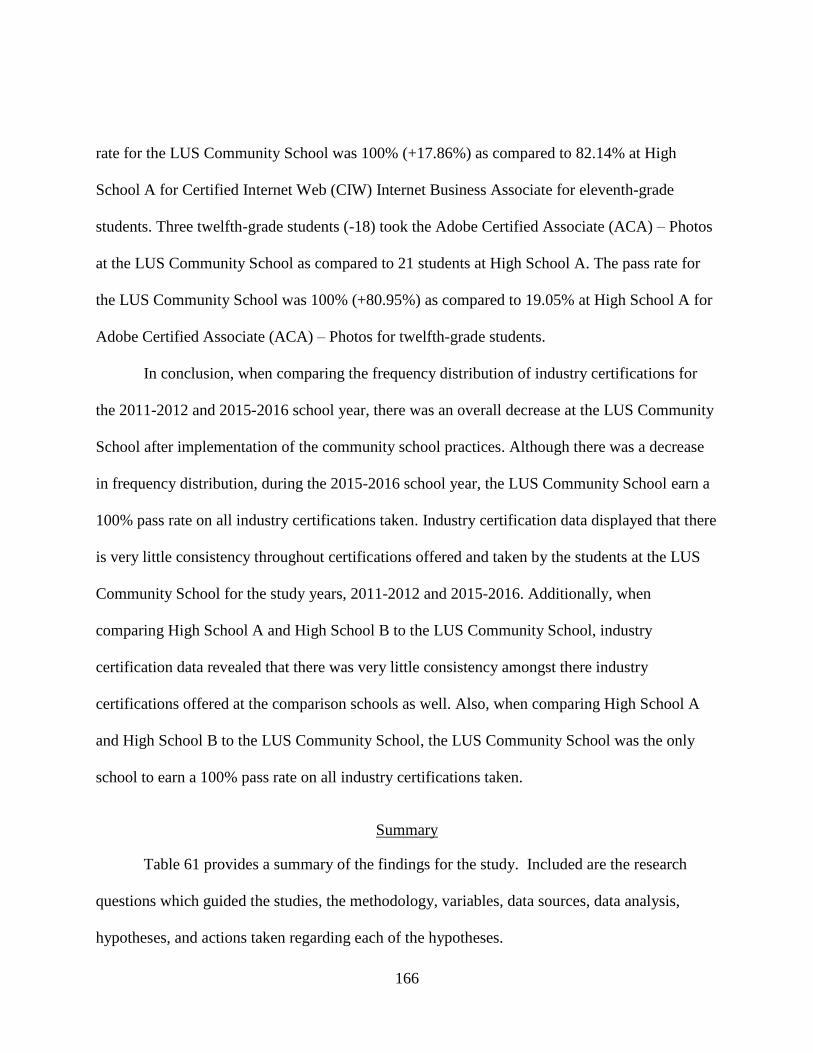
166
rate for the LUS Community School was 100% (+17.86%) as compared to 82.14% at High
School A for Certified Internet Web (CIW) Internet Business Associate for eleventh-grade
students. Three twelfth-grade students (-18) took the Adobe Certified Associate (ACA) – Photos
at the LUS Community School as compared to 21 students at High School A. The pass rate for
the LUS Community School was 100% (+80.95%) as compared to 19.05% at High School A for
Adobe Certified Associate (ACA) – Photos for twelfth-grade students.
In conclusion, when comparing the frequency distribution of industry certifications for
the 2011-2012 and 2015-2016 school year, there was an overall decrease at the LUS Community
School after implementation of the community school practices. Although there was a decrease
in frequency distribution, during the 2015-2016 school year, the LUS Community School earn a
100% pass rate on all industry certifications taken. Industry certification data displayed that there
is very little consistency throughout certifications offered and taken by the students at the LUS
Community School for the study years, 2011-2012 and 2015-2016. Additionally, when
comparing High School A and High School B to the LUS Community School, industry
certification data revealed that there was very little consistency amongst there industry
certifications offered at the comparison schools as well. Also, when comparing High School A
and High School B to the LUS Community School, the LUS Community School was the only
school to earn a 100% pass rate on all industry certifications taken.
Summary
Table 61 provides a summary of the findings for the study. Included are the research
questions which guided the studies, the methodology, variables, data sources, data analysis,
hypotheses, and actions taken regarding each of the hypotheses.
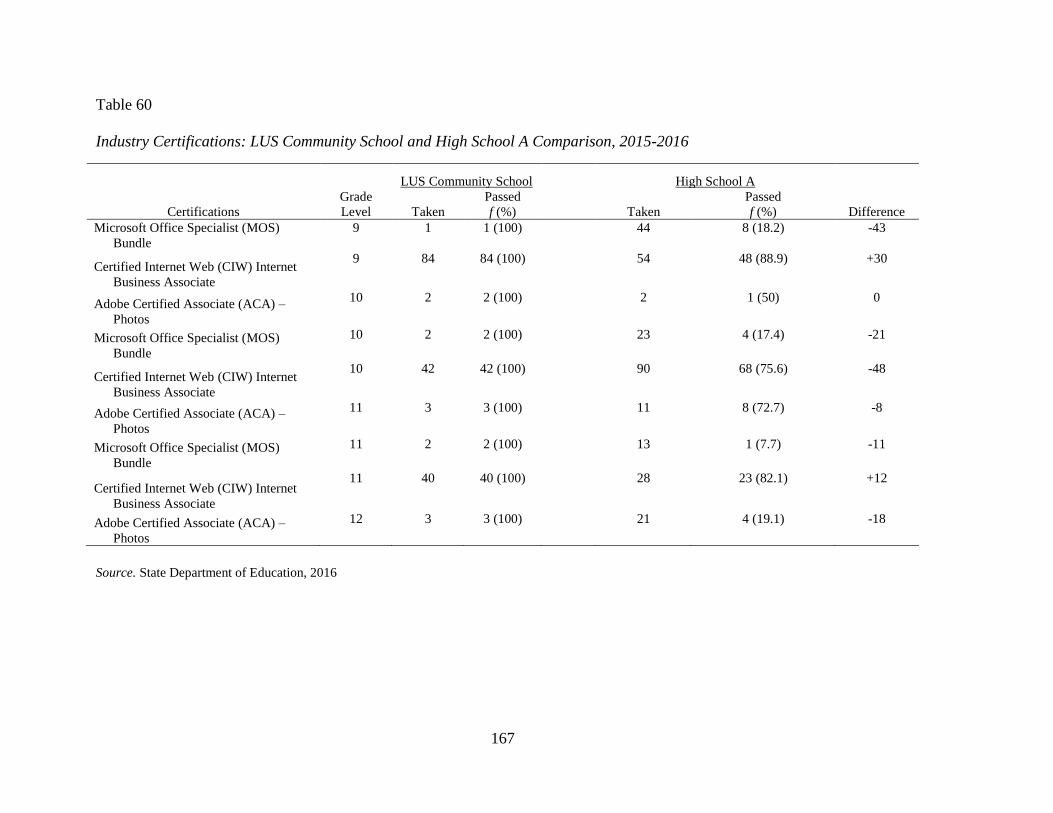
167
Table 60
Industry Certifications: LUS Community School and High School A Comparison, 2015-2016
LUS Community School
High School A
Certifications
Grade
Level
Taken
Passed
f (%)
Taken
Passed
f (%) Difference
Microsoft Office Specialist (MOS)
Bundle
9 1 1 (100) 44 8 (18.2) -43
Certified Internet Web (CIW) Internet
Business Associate
9 84 84 (100) 54 48 (88.9) +30
Adobe Certified Associate (ACA) –
Photos
10 2 2 (100) 2 1 (50) 0
Microsoft Office Specialist (MOS)
Bundle
10 2 2 (100) 23 4 (17.4) -21
Certified Internet Web (CIW) Internet
Business Associate
10 42 42 (100) 90 68 (75.6) -48
Adobe Certified Associate (ACA) –
Photos
11 3 3 (100) 11 8 (72.7) -8
Microsoft Office Specialist (MOS)
Bundle
11 2 2 (100) 13 1 (7.7) -11
Certified Internet Web (CIW) Internet
Business Associate
11 40 40 (100) 28 23 (82.1) +12
Adobe Certified Associate (ACA) –
Photos
12 3 3 (100) 21 4 (19.1) -18
Source. State Department of Education, 2016
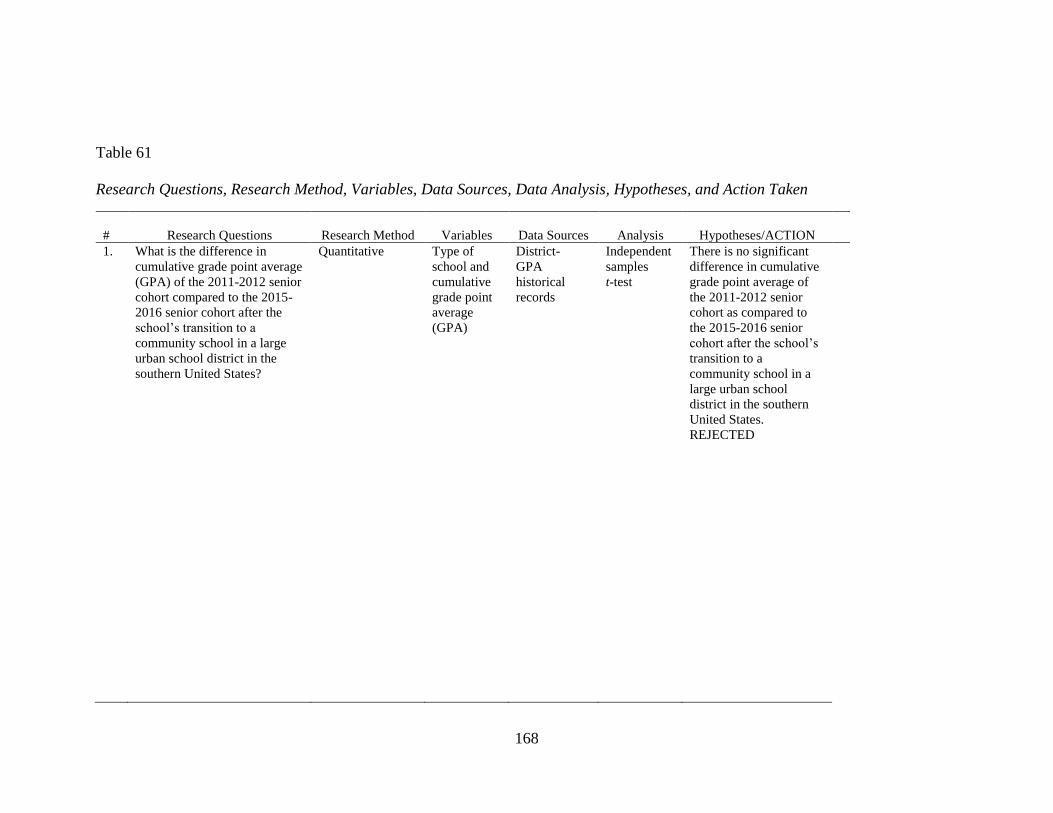
168
Table 61
Research Questions, Research Method, Variables, Data Sources, Data Analysis, Hypotheses, and Action Taken
#
Research Questions
Research Method
Variables
Data Sources
Analysis
Hypotheses/ACTION
1. What is the difference in
cumulative grade point average
(GPA) of the 2011-2012 senior
cohort compared to the 2015-
2016 senior cohort after the
school’s transition to a
community school in a large
urban school district in the
southern United States?
Quantitative Type of
school and
cumulative
grade point
average
(GPA)
District-
GPA
historical
records
Independent
samples
t-test
There is no significant
difference in cumulative
grade point average of
the 2011-2012 senior
cohort as compared to
the 2015-2016 senior
cohort after the school’s
transition to a
community school in a
large urban school
district in the southern
United States.
REJECTED
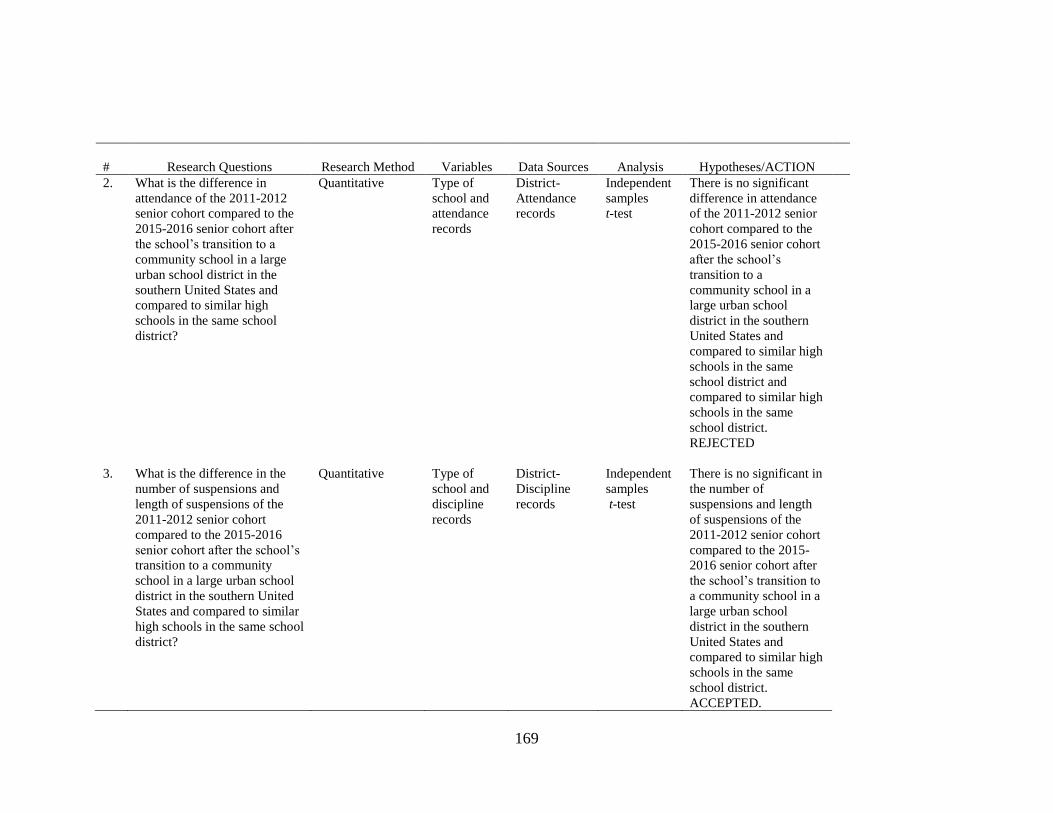
169
#
Research Questions
Research Method
Variables
Data Sources
Analysis
Hypotheses/ACTION
2. What is the difference in
attendance of the 2011-2012
senior cohort compared to the
2015-2016 senior cohort after
the school’s transition to a
community school in a large
urban school district in the
southern United States and
compared to similar high
schools in the same school
district?
Quantitative Type of
school and
attendance
records
District-
Attendance
records
Independent
samples
t-test
There is no significant
difference in attendance
of the 2011-2012 senior
cohort compared to the
2015-2016 senior cohort
after the school’s
transition to a
community school in a
large urban school
district in the southern
United States and
compared to similar high
schools in the same
school district and
compared to similar high
schools in the same
school district.
REJECTED
3. What is the difference in the
number of suspensions and
length of suspensions of the
2011-2012 senior cohort
compared to the 2015-2016
senior cohort after the school’s
transition to a community
school in a large urban school
district in the southern United
States and compared to similar
high schools in the same school
district?
Quantitative Type of
school and
discipline
records
District-
Discipline
records
Independent
samples
t-test
There is no significant in
the number of
suspensions and length
of suspensions of the
2011-2012 senior cohort
compared to the 2015-
2016 senior cohort after
the school’s transition to
a community school in a
large urban school
district in the southern
United States and
compared to similar high
schools in the same
school district.
ACCEPTED.
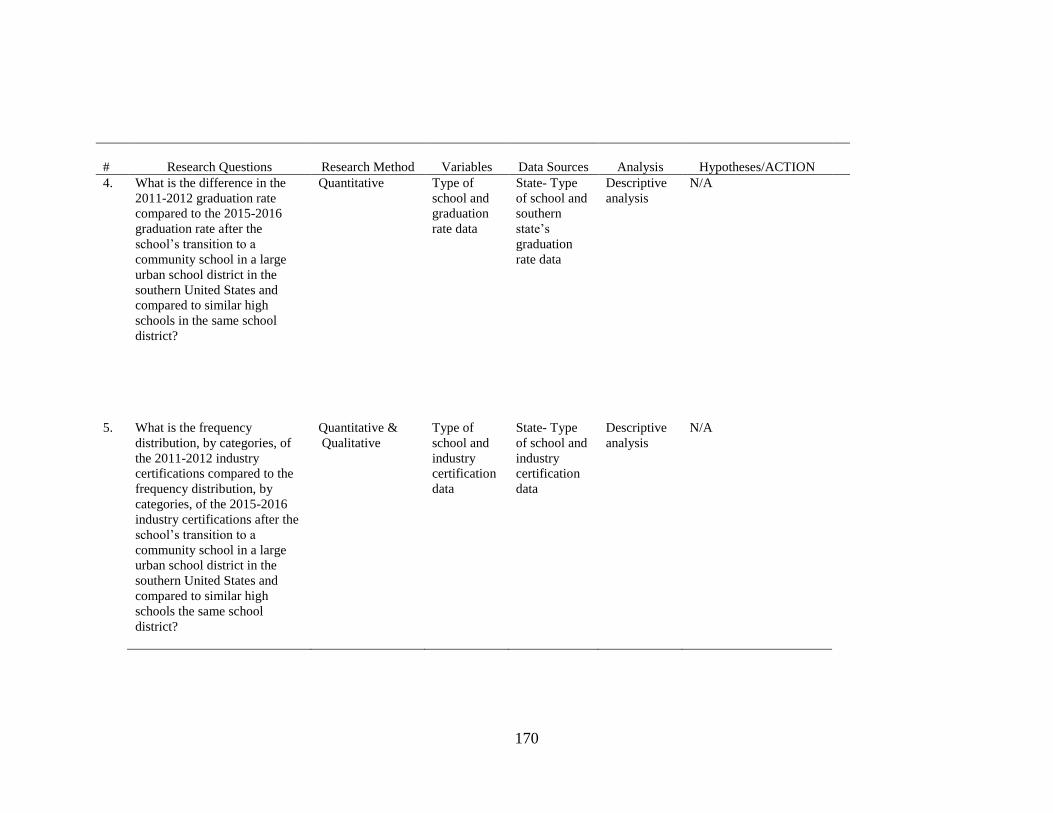
170
#
Research Questions
Research Method
Variables
Data Sources
Analysis
Hypotheses/ACTION
4. What is the difference in the
2011-2012 graduation rate
compared to the 2015-2016
graduation rate after the
school’s transition to a
community school in a large
urban school district in the
southern United States and
compared to similar high
schools in the same school
district?
Quantitative Type of
school and
graduation
rate data
State- Type
of school and
southern
state’s
graduation
rate data
Descriptive
analysis
N/A
5. What is the frequency
distribution, by categories, of
the 2011-2012 industry
certifications compared to the
frequency distribution, by
categories, of the 2015-2016
industry certifications after the
school’s transition to a
community school in a large
urban school district in the
southern United States and
compared to similar high
schools the same school
district?
Quantitative &
Qualitative
Type of
school and
industry
certification
data
State- Type
of school and
industry
certification
data
Descriptive
analysis
N/A
171
CHAPTER 5
SUMMARY, DISCUSSION, AND RECOMMENDATIONS
Introduction
This chapter provides a summary of findings from this study which were presented in
detail in Chapter 4 along with implications for policy and practice, and recommendations for
future studies. The information presented in the review of literature and various policies and
practices throughout the southern state and around the world supporting the community school
practices is also briefly discussed in this chapter. The information presented throughout this
study supports the need for supplemental resources to better assist students attending schools
located in urban school districts and the parents of these students. In this chapter, the researcher
also discusses the need for school districts to provide more culturally responsive support to
various minority student groups as it relates to student academic achievement and culturally
responsive professional development for educators.
Moreover, the researcher discusses the alternatives to out of school suspensions and the
impact these practices have on a student’s academic, social, and cognitive development. The
LUS School District has a variety of programs throughout the district focused on the
achievement of minority students, including a district-level office centered on the achievement of
minority students. According to the data analysis presented in Chapter 4, the LUS Community
School made improvements after implementation of the community school practices in various
areas. However, High School A and High School B, both traditional non-community schools
outperformed the LUS Community School in some areas. Although the community school
practices have been proven to be effective, the researcher recognizes that it is not realistic for the
LUS School District to transform every school in the district to a community school. However, it
172
is important for the school district to continue to provide individualized enrichment and
supplemental programs to each school based on the demographics, zoning, and individualized
and unique academic needs of the students the school serves.
Purpose and Problem
The purpose of this study was to investigate the impact of the community school
practices such as extended enrichment hours, character development, anger management,
counseling, tutoring, and mental and physical healthcare on student performance at a community
school in a large urban school district in the southern United States. The researcher examined the
community school practices and services as they related to the effectiveness and impact on
student performance outcomes. The findings offer beneficial information for schools and
stakeholders in similar southern settings as they consider adopting community school practices.
The problem posed in this study was to explore the effectiveness of the community
school practices and services used in a large urban school district in the southern United States.
In addition to analyzing the effectiveness of community school practices in a community school
in a large urban school district, the researcher also explored the performance of comparison high
schools not using the community school practices in the same large urban school district. These
practices included medical, dental, and vision health care, before and after school tutoring,
mentoring, anger management, character development, counseling, job coaching, and financial
literacy. Through the data collection and analysis conducted in this study, strengths or
deficiencies, particularly in the category of student performance, were identified.
173
Research Questions and Hypotheses
1. What is the difference in cumulative grade point average (GPA) of the 2011-2012 senior
cohort compared to the 2015-2016 senior cohort after the school’s transition to a
community school in a large urban school district in the southern United States?
H0: There is no significant difference in cumulative grade point average of the 2011-
2012 senior cohort as compared to the 2015-2016 senior cohort after the school’s
transition to a community school in a large urban school district in the southern
United States.
2. What is the difference in attendance of the 2011-2012 senior cohort compared to the
2015-2016 senior cohort after the school’s transition to a community school in a large
urban school district in the southern United States and compared to similar high
schools in the same school district?
H0: There is no significant difference in attendance of the 2011-2012 senior cohort
compared to the 2015-2016 senior cohort after the school’s transition to a community
school in a large urban school district in the southern United States and compared to
similar high schools in the same school district and compared to similar high schools
in the same school district.
3. What is the difference in the number of suspensions and length of suspensions of the
2011-2012 senior cohort compared to the 2015-2016 senior cohort after the school’s
transition to a community school in a large urban school district in the southern
United States and compared to similar high schools in the same school district?
174
H0: There is no significant difference in the number of suspensions and length of
suspensions of the 2011-2012 senior cohort compared to the 2015-2016 senior cohort
after the school’s transition to a community school in a large urban school district in
the southern United States and compared to similar high schools in the same school
district.
4. What is the difference in the 2011-2012 graduation rate compared to the 2015-2016
graduation rate after the school’s transition to a community school in a large urban
school district in the southern United States and compared to similar high schools in
the same school district?
The dependent variable for this question was graduation rate. The independent
variables for this question were traditional school and community school.
Descriptive analysis was used to identity differences between the two groups.
5. What is the frequency distribution, by categories, of the 2011-2012 industry
certifications compared to the frequency distribution, by categories, of the 2015-2016
industry certifications after the school’s transition to a community school in a large
urban school district in the southern United States and compared to similar high
schools the same school district?
The dependent variable for this question was industry certification. The independent
variables for this question were traditional school and community school.
Descriptive analysis was used to identity differences between the two groups.
175
Summary of the Findings
Findings were generated for the five research questions which guided the study. The
software package, Statistical Package for the Social Sciences (SPSS), version 24, 2016, was used
for the analysis of data. Independent t-tests were used in the analysis that led to rejecting the
hypotheses for the first three research questions, indicating that there were statistical differences
in student performance, attendance, and discipline, at the LUS Community School and
comparison schools for the years analyzed. Analysis of descriptive statistics was used to explore
the difference in graduation rate and frequency distribution of industry certifications. The first
research question explored student performance as it relates to cumulative grade point average
by courses of the senior cohort, before and after implementation of the community school
practices for the study years of 2011-2012 and 2015-2016. The next three questions explored the
attendance, discipline, and graduation rate of the senior cohort at the LUS School Community
before and after implementation of the community school practices and compared the school’s
data to two comparison high schools in the same district. The final research question explored
the frequency distribution, by categories of industry certifications of senior cohort at the LUS
Community School before and after implementation of the community school practices and two
comparison high schools in the same district. The data and findings indicated that the community
school practices had a positive impact in the majority of the areas on the sample selected for this
study. Some of the findings presented in this study were consistent with the review of literature.
The review of literature provided an overview of urban education and the impact that community
schools have on relationship building, student performance, mental, and physical development,
parental involvement and community involvement.
176
Findings from Research Question 1 revealed that the cumulative grade point average
(GPA) by course was higher for the 2015-2016 senior cohort than the 2011-2012 senior cohort at
the LUS Community School. A key component of community schools is to provide supplemental
enrichment programs and services such as after school tutoring to increase the academic
performance of students. The review of literature indicated that students who regularly
participate in after school enrichment programs have better grades and that tutoring is one of the
greatest methods of increasing student performance (After School Alliance, 2014, Burns et al.,
2004). However, when comparing the cumulative grade point average (GPA) by course of 2015-
2016 senior cohort at the LUS Community School to the comparison schools, both 2015-2016
senior cohorts at High School A and High School B outperformed the LUS Community School.
Findings from Research Question 2 revealed a higher percentage of attendance for the
2015-2016 senior cohort, which was after implementation of the community school practices
than the 2011-2012 senior cohort at the LUS Community School. Community schools provide an
array of mental and physical health services to minimize the struggles of students living in
poverty and aim to decrease the amount of unexcused absences. The review of literature
explored many of the challenges students attending urban schools experience. Living in poverty
is an intense struggle for many students attending low-performing or Title I schools in urban
areas. The research presented in the review of literature indicated that a high percentage of
students struggle with mental illness and do not have the necessary funding source to get proper
treatment and that these students are absent at higher rates (Gall et al., 2000). Moreover, students
living in poverty are at a higher risk of developing untreated physical health problems, such as
vision complications and tooth decay (Basch, 2011, Dye et al., 2014). Many students who
177
struggle with untreated illness and health problems are also at a higher risk of chronic
absenteeism. When comparing the percent attended of 2015-2016 senior cohort at the LUS
Community School to the comparison schools, High School A and High School B, the percent
attended was higher at the LUS Community School.
Findings from Research Question 3 revealed that the number of students suspended in the
2015-2016 senior cohort was higher than the number of students suspended in the 2011-2012.
The number of days suspended decreased in the following categories; 1 to 3 and 4 to 6 days
when comparing the 2015-2016 senior cohort to the 2011-2012 senior cohort. However, the
length of days in which students were suspended 7 to 9 days and 10 or more days increased for
the 2015-2016 senior cohort when compared to the 2011-2012 senior cohort. Additionally, the
mean suspensions at the LUS Community School was higher for the 2015-2016 cohort, after
implementation of the community school practices. When comparing the mean suspensions of
the 2015-2016 senior cohort at the LUS Community School to High School B, the number of
students suspended was higher at the LUS Community School and the mean suspensions was
greater. When comparing the mean suspensions and number of students suspended of the 2015-
2016 senior cohort to High School A, less than 10 suspensions were reported for the 2015-2016
senior cohort at High School A. Thus, indicating that no t-test were performed and suspensions
was greater at the LUS Community School.
When interpreting the results of the discipline data, overall student behavior, in regard to
suspensions did not improve at the LUS Community School when comparing the two senior
cohorts before and after the implementation of the community school practices. However, an
assumption by the researcher for this finding was that with the implementation of corrective
178
discipline services, such as mentoring, anger management, and a district-level initiative of
Restorative Justice that provides students with the cognitive ability to have better judgement
regarding conflict resolution, school administrators may have been less tolerant of behavioral
issues. Consequently, resulting in more suspensions.
The findings from Research Question 4 revealed that the graduation rate for the LUS
Community School was higher for the 2015-2016 school year, after implementation of the
community school practices than for the 2011-2012 school year, before implementation of the
community school practices. An additional observation by the researcher revealed that from
2012-2016, the LUS Community School had a continuous increase in graduation rate. When
comparing the graduation rate of the 2015-2016 senior cohort at the LUS Community School to
2015-2016 senior cohort at High School A, the graduation rate at High School A was higher.
When comparing the graduation rate of the 2015-2016 senior cohort at the LUS Community
School to the 2015-2016 graduation rate at High School B, the graduation rate at High School B
was higher.
The findings from Research Question 5 revealed that the number of industry
certifications was higher in 2011-2012 at the LUS Community School, pre implementation of the
community school practices than in 2015-2016. An assumption by the researcher for this finding
was that with the implementation of the community school practices, students were exposed to
more that will prepare them for the workforce or postsecondary education, (e.g., financial
literacy and mentoring). Thus, they did not necessarily rely solely on industry certifications for
this exposure and future opportunities. When comparing the frequency distribution of industry
certifications of the LUS Community School to High School A for the 2015-2016 school year,
179
the frequency distribution of industry certifications was higher at High School A. The researcher
did not receive any data on industry certification for High School B from the State Department of
Education.
When analyzing the frequency distribution, by categories of the industry certifications at
the LUS Community School, data revealed that for both the 2011-2012 and 2015-2016 school
years more than 200 students took the Certified Internet Web (CIW) Internet Business Associate
certification, which was the largest certification taken by students. The CIW Internet Business
Associate certification provides fundamental knowledge of vital technologies that can assist with
effective internet usage in the workforce. Further research revealed that schools are able to
receive Perkins funding for students to become CIW-certified, and students have the potential to
receive college credit with the certification (CIW, 2017).
Implications for Policy and Practice
Based on the finding in this study there are several implications that can be applied to
community schools and the LUS School District. The researcher collected data for the five areas
(student performance as it pertains to cumulative grade point average, attendance, discipline,
graduation rate, and industry certifications) involved in this study from the LUS School District
and the XDOE. Data analysis was conducted and findings and results were provided to the LUS
School District in the form of an executive summary. In order for the researcher to calculate the
sample’s cumulative grade point average (GPA), data were provided to the researcher by the
district as per course per student data. A total 28,556 courses were analyzed and sorted for the
2011-2012 school year; 13,108 for the community school in a large urban school district, 10,853
courses for High School A (Group 1) and 4,595 courses for High School B (Group 2). A total of
180
53,754 courses were analyzed and sorted for the 2015-2016 school year; 23,763 courses for LUS
Community School, 23,327 courses for High School A (Group 1) and 6,664 courses for High
School B (Group 2). The researcher devoted over 80 hours to the preparation of data for
statistical analysis using SPSS, version 24, 2016. This procedure of data collection and analysis
was laborious and heightened the risk of error in recording. The researcher was informed by the
LUS School District’s Office of Accountability, Research & Evaluation that individual student
cumulative grade point average (GPA) data were not available for research purposes. An
implication for the LUS School district is to create an effective data distribution of this
information would be time-saving, more efficient, and more accurate for future research
conducted with the LUS School District regarding a study sample’s cumulative grade point
average (GPA). Difficulty in analyzing data and data reporting was caused due to inconsistent
data received from the LUS School District.
The focus areas of this study were student performance which explored cumulative grade
point average and graduation rate, attendance, discipline, and industry certifications. The LUS
Community School offers their students a variety of health services that may have an impact on
attendance. Research presented in the review of literature indicated that students are often absent
and may experience academic challenges due to untreated health issues. The researcher sought to
explore the difference in attendance before and after implementation and of the community
school practices. Attendance data were provided to the researcher from the LUS School
District’s Office of Accountability, Research, and Evaluation. During the recording and analysis
of the attendance data, it was discovered that several students were reported to have been present
183 days out of the 180 day school calendar, heightening the risk of error in recording and
181
challenged reliability and validity. This was undoubtedly a result of human error when entering
attendance at the school-level. An implication for the LUS School District to assist in data
collection for future research and reporting, is to have more registrars and/or an attendance dean
for each grade level at each high school in the district. This would provide more reliability in the
presentation of the school district’s attendance data.
An additional implication in regard to attendance is increase efforts to address chronic
absenteeism throughout the district. While the percent attended was higher at the LUS
Community School for the 2015-2016 senior cohort, additional analysis of attendance provided
that more than 250 seniors in the 2015-2016 senior cohort missed 10 or more days of school.
Thus, indicating that chronic absenteeism is still prevalent in the school. Chronic absenteeism is
an issue impacting school districts throughout the U.S. According to the U.S. Department of
Education (2016) chronic absenteeism is highest in high school and roughly one in five students
in high school are chronically absent. Further research conducted by the USDOE provided that
roughly 20% of high school students, 12% of middle school students, and 11% of elementary
school students are chronically absent (U.S. Department of Education, 2016). During the primary
school years, elementary schools should be proactive in analyzing attendance data and
identifying trends and gaps to better address the issue in an effort to reduce the raising rates of
chronic absenteeism in middle and high school.
The LUS Community School offers a variety of cognitive development services to
students such as counseling, mentoring and character development. The researcher sought to
explore the impact that such programs would have, if any, on student discipline and overall
character development. The researcher submitted an initial request to the LUS School District’s
182
Office of Accountability, Research and Evaluation for discipline referral data in an effort to
analyze the level of discipline infractions and compare the severity and frequency of discipline
infractions and referrals. However, the initial request was not granted, and the researcher was
informed that there was not a uniform system of tracking discipline referral data at the district
level and that these data were not available for research purposes. The researcher was informed
that these data were more accessible at the individual school-level. As an alternative, the
researcher was provided with suspension data which outlined the number of suspensions and
days suspended.
For future data collection on discipline, such as discipline infraction levels, a more
uniform collection strategy is needed. Additionally, an option for collecting discipline data from
the LUS School District would be to grant the researcher permission to collect data directly from
the LUS School District Minority Achievement Office. The LUS School District’s Minority
Achievement Office spearheads the implementation and progress monitoring of Restorative
Justice practices throughout the district. According to the LUS School District’s website, the
goal of Restorative Justice is “to reduce the suspension rate by building a school culture that
focus on relationships, gives voice to all, engages in problem solving, enhances personal
responsibly, and empowers change and growth” (LUS School District, para. 2, 2017). Working
directly with this department would assist the researcher with more accurate data collection in
regard to discipline and in gaining a more in-depth understanding of the school district’s
incentives to decrease suspensions.
Another implication for the LUS School District is consistency and alignment of industry
certifications. A common 21st century incentive for K-12 education throughout the U.S. has been
183
to prepare students to be successful after high school. The transition from high school to post-
secondary and/or the workforce can be filled with anxiety for many students due to uncertainty, a
lack of resources, and a lack of proper guidance. Additionally, many school districts understand
that some students will opt to enter the workforce immediately after high school and opt-out of
postsecondary education. According to Data for Action (2014) “one-fourth of adults in the
United States have non-degree credentials, such as an information technology certificate, and
workers with non-degree credentials have higher earning than those without them” (p.1). With
this realization, students are provided with more opportunities to gain more 21st century skills
that are vital in today’s workforce.
The researcher sought to determine the difference, if any, in the frequency distribution of
industry certifications before and after implementation of the community school practices. The
researcher submitted an initial request for industry certification data in an effort to analyze at
what rate students were exposed to the opportunity to gain these 21st century skills. However, the
researcher was informed that the data were not available at the district-level. The LUS School
District’s Office of Accountability, Research and Evaluation informed the researcher that the
school district as a whole does not have an informal or a formal system of tracking industry
certifications and tracking is done at the school-level. The researcher had to rely on the State
Department of Education to provide industry certification data for the LUS Community School
and the comparison schools. Therefore, the researcher was unable to cross-reference the data for
accuracy and validity. For future data collection on industry certifications, a more uniform
system at the district level is needed. When interpreting the findings, it was also found that the
LUS Community School provided a very limited variety of industry certifications for their
184
students. In an effort to activate prior knowledge and engage students’ interest, the LUS
Community School should consider conducting a needs assessments of students’ interests and
aligning the industry certifications offered at the school with the results of the needs assessment.
Also, a more uniform system of industry certifications would also allow the school district to
determine if the industry certifications being offered at a select school meet the individualized
interests of the school’s population.
At the core of the community school’s rationale is establishing an effective community-
family-school partnership. The LUS Community School offers a variety of services for parents,
such as English for Speakers of Other Language (ESOL) and GED courses, financial literacy,
and parenting workshops. Therefore, the researcher sought to explore the impact of the
community school practices on parental and community involvement. The initial request was
made to the LUS School District to provide data on the quantity of parental and community
involvement before and after implementation of the community school practices. The researcher
was informed that there was no uniform system of tracking parental involvement outside of the
Parent Teacher Student Association (PTSA) data and membership rosters. The researcher
attempted to gather sign-in sheets for various school events and was not successful. As a result,
the researcher had to change the direction of the study due to lack of effective tracking of
parental and community involvement. This information was unavailable at the district-level. An
implication for the LUS School District and the LUS Community School is a more effective data
management system of tracking the volume of parental and community involvement across all
programs, services, and events at the school-level is needed to determine the areas of success of
the areas that need further improvement.
185
The findings and observations in this study offer a variety of implications for community
school practices and structure. The community school in this research provides anger
management courses to its students and various community schools throughout the U.S. provide
anger management and counseling as well. Research has proven that anger management courses
for both students and adults decreases aggressive behavior (DisGiuseppe & Tafrate, 2003). As
discussed in the literature review students living in urban areas face a variety of challenges and
negative issues outside the classroom. For community school policymakers, this study provides
insight into the impact of anger management. Community schools would greatly benefit the
students in which they serve by structuring, aligning, and delivering anger management sessions
to the current events happening locally and throughout the U.S. that may be impacting student
behavior. For example, providing strategies to students to adapting and dealing with racial
tensions, police-minority civilian relationships, respect for authority and government.
Another important implication for community school policymakers is the individualized
structure of parenting courses. Some community schools offer parenting courses in an effort to
equip parents with the necessary skillset to be champions for the success of their children. As
with anger management, community schools should align the structure and delivery of parenting
courses to meet the needs of the families in the particular community. Community school
stakeholders should work with district-level administrators to align parenting courses to include
topics directly related to key parenting issues, such as understanding ESE placement and
procedure, gifted education, district-wide discipline policies, and knowledge of standardized test
scores. Additionally, with the evolution of technology and impact that social media may have on
186
student behavior, addressing topics parenting topics such as decision-making, cyberbullying,
suicide awareness, and overall cyber security.
As discussed in the review of literature, the parent-school relationships depends greatly
on a variety of things, such as parents who do not have a high level of education feel intimidated
by school administrators due to their lack of understanding of things such as K-12 academic
terminology. The LUS School District provides Parent Academies, which are education fairs
typically held once a month on the weekend that provide parents with information to supplement
their child’s education. However, through effective collaboration between community school
stakeholders/personnel and district-level stakeholders, parents will have increased access to more
beneficial information on a more consistent basis. Research discussed in the literature review has
proven that high levels of parental involvement increases student success. Community schools
throughout the U.S. and abroad will greatly impact the success of students that they serve by
widening the variety of parenting courses being offered.
Another important implication for community school, policymakers as it relates to the
overall structure of community school, is to widen the lead-agency partnerships and funding
options to increase sustainability of community schools. The Coalition of Community Schools
(2016) has recognized the following models of community schools, Beacon Schools, The
Children’s Home Society community schools, Communities In Schools, Schools of the 21st
Century, and University-Assisted community schools (The Children’s Aid Society, 2011). The
Children’s Aid Society has been very instrumental in the development of community schools
since 1992 serving as a lead agency to service families and children in high needs areas (The
Children’s Aid Society, 2011). University-Assisted community schools engages universities as
187
lead partners and works to service the community at-large (Netter Center for Community
Partnerships, 2016). Some of the higher education institutes with models similar to the Netter
Center include the University of Central Florida and University of Mexico (The Children’s
Home Society, 2011). Community schools should continue to widen the partnerships of lead-
agencies to a variety of different organizations, such as faith-based organizations and more
physical and mental health agencies, such as hospitals, to bring a variety of services and
resources to students and their families. Additional implications for community schools include
adjustments to funding. Community school funding is contingent upon services offered through
the lead-agency partnerships and grants. Unfortunately, jeopardizing the sustainability and
longevity of community schools as grant funds are dispersed on a cycle and renewal is not
guaranteed.
Continuous Effort to Narrow the Achievement Gap for Hispanic Students
An observation by the researcher during the data collection phase revealed that during the
study years of this research, 2011-2012 through 2015-2016, the percentage of Hispanic graduates
at both the LUS Community School and the comparison schools in the same district increased
gradually each year. Discussion of the achievement gap has often been focused on the Black-
White divide for several reasons, such as historical academic segregation, and for many when
thinking of the minority achievement gap, Black students are the dominant race. However, it is
important for school leaders to focus attention on the Hispanic population of students and to
continue implementing strategies that contribute to their success and understanding their
challenges. Research conducted by the Hemphill and Vanneman (2011) indicated that “Hispanics
are the fastest-growing segment of the United States population” (p. 3), indicating that K-12
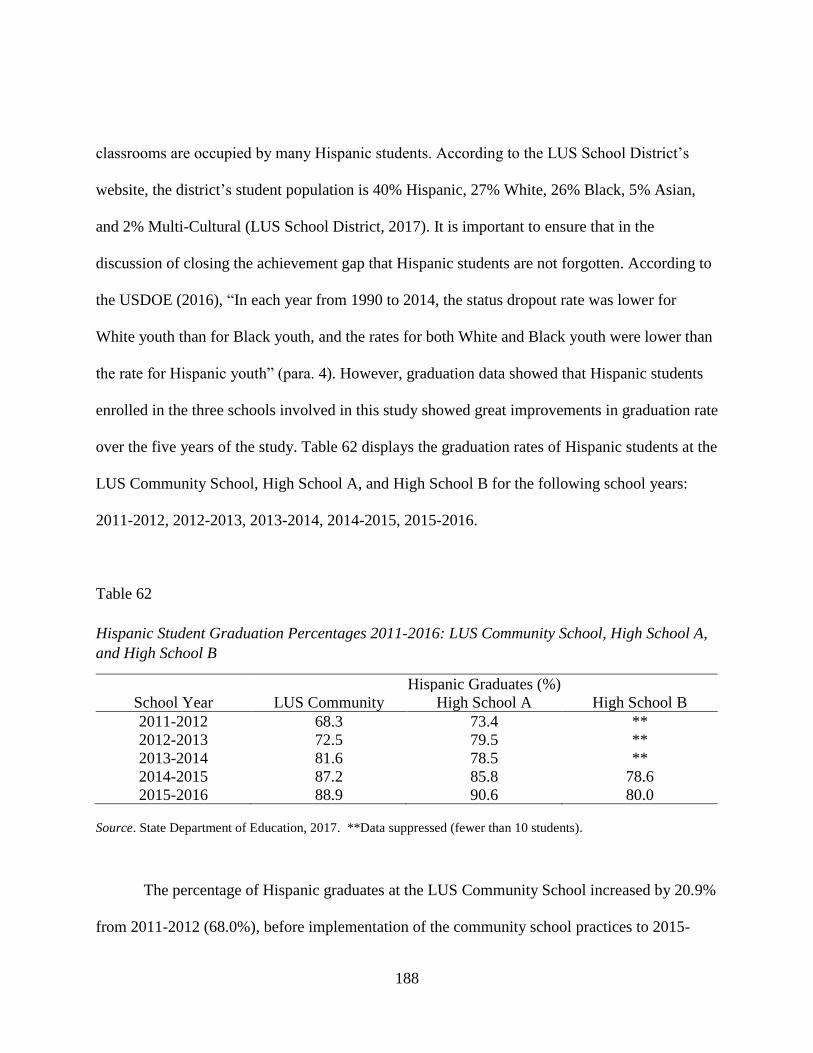
188
classrooms are occupied by many Hispanic students. According to the LUS School District’s
website, the district’s student population is 40% Hispanic, 27% White, 26% Black, 5% Asian,
and 2% Multi-Cultural (LUS School District, 2017). It is important to ensure that in the
discussion of closing the achievement gap that Hispanic students are not forgotten. According to
the USDOE (2016), “In each year from 1990 to 2014, the status dropout rate was lower for
White youth than for Black youth, and the rates for both White and Black youth were lower than
the rate for Hispanic youth” (para. 4). However, graduation data showed that Hispanic students
enrolled in the three schools involved in this study showed great improvements in graduation rate
over the five years of the study. Table 62 displays the graduation rates of Hispanic students at the
LUS Community School, High School A, and High School B for the following school years:
2011-2012, 2012-2013, 2013-2014, 2014-2015, 2015-2016.
Table 62
Hispanic Student Graduation Percentages 2011-2016: LUS Community School, High School A,
and High School B
Hispanic Graduates (%)
School Year LUS Community High School A High School B
2011-2012 68.3 73.4 **
2012-2013 72.5 79.5 **
2013-2014 81.6 78.5 **
2014-2015 87.2 85.8 78.6
2015-2016 88.9 90.6 80.0
Source. State Department of Education, 2017. **Data suppressed (fewer than 10 students).
The percentage of Hispanic graduates at the LUS Community School increased by 20.9%
from 2011-2012 (68.0%), before implementation of the community school practices to 2015-
189
2016 (88.9%), after implementation of the community school practices. Schools can use these
data to continue to create more individualized programs and provide direct assistance to the
Hispanic students that they serve. According to the LUS School District’s Minority Achievement
Office website, the department has a ‘Latinos in Action (LIA)’ initiative that aims to “Engage
Latino male and female students to improve themselves through, leadership, and service” (LUS
School District, para.1, 2017). However, the researcher was not able to access any further
information or data on the current school-level strategies being used to motivate Hispanic
students. Additionally, the researcher did not analyze student performance of the other 16 high
schools in the LUS School District and, therefore, was not able to generalize the findings to the
entire district. The researcher is not able to say with confidence that the increase in Hispanic
student graduation rate is a result of the district’s initiatives due to a lack of data accessibility on
this topic. Strategic planning and implementation of individualized enrichment programs
between key stakeholders, community members, school leaders, and parents will assist in
ensuring the continued success of Hispanic students at the LUS Community School and schools
throughout the district.
Continuous Efforts for School Turnaround and School Transformation
It was found that the LUS Community School made improvements in the areas of student
performance, attendance, and graduation rate after implementation of the community school
practices. It was also found that when comparing the community school to the comparison
schools, the comparison schools, without implementation of the community school practices
outperformed the LUS Community School in some areas. This provides evidence that it is
possible to impact student performance, attendance, discipline, and graduation rate and adopt
190
some of the community school practices, such as physical and mental health services, parental
engagement and education services, and anger management, at a school without full
transformation into a community school. The day-to-day operations of a traditional school are
already expensive, and additional funding and effective partnerships are needed for the operation
of a community school. It is important to note that school districts do not have the funding to
transform every school into a community school and/or open a community school in their school
districts. Thus, school turnaround and school transformation practices need to be considered as
viable alternatives to community schools (Communities for Excellent Public Schools, 2010; The
Federation for Community Schools, n.d.; Center for Mental Health in Schools, 2008).
As mentioned in the review of literature, a method to improve low performing schools is
to use one of the four federal turnaround models, the transformation model. School turnaround
includes replacing the principal, replacing at least 50% of the staff and implementing effective
comprehensive instructional reforms. School transformation requires replacement of the
principal with no requirement of staff replacement, providing professional development,
extending teacher planning time and providing more opportunities for community support
(Pallin, 2010). School turnaround outlines that within two years there should be a significant
improvement in student academic outcomes and there should be a plan of sustainability
implemented to raise and maintain achievement (Pallin, 2010). Implementing school
transformation and school turnaround strategies, such as additional supplemental resources and
additional funding, may increase student performance in both community schools and non-
community schools. However, both school turnaround and school transformation appear to be
reactive instead of proactive strategies as evidenced in community school practices. When
191
providing assistance to schools to contribute to student performance, it is important for districts
to be proactive with such services and assistance. The proactive decision to start this process
early and assist schools before they are failing and before schools are in jeopardy of closing
would be crucial to effective school sustainability and school transformation.
There are various transformation and turnaround strategies that can be implemented in
schools throughout the school district to achieve similar results as the LUS Community School.
These include designing the infrastructure for learning and transitioning to a competency-based
system. Yatso et al. (2012) suggested that, “Districts should create a turnaround office whose job
would be to remove barriers to successful transformation, and take responsibility for schools
implementing a well though-out, comprehensive, evidence-based vision of change” (p. 2). The
LUS School District has a department solely dedicated to the transformation of underperforming
schools in regard to a failing school grades. According to the LUS School District’s website, at
the time of the present study, the School Transformation Office was working with a total of 11
schools, nine elementary schools and two middle schools. However, no separate and/or
individualized attention was being dedicated to school transformation or intervention of high
schools in the district. Though no high schools in the district were deemed to be failing at the
moment, proactive implementation of supplemental programs will be key to student performance
and increasing high school graduation rates.
Furthermore, working towards removing the negative connotation that is attached to
school transformation and turnaround would be ideal for the LUS School District and districts
throughout the U.S. In regard to transformation policy and practice, the researcher suggests
viewing school transformation as an opportunity to transform a specific area of the school
192
without delaying assistance until the school is failing. Analyzing data will allow district-level
administrators to implement corrective programming at the school level. Additionally, the
researcher suggests that though understanding that the basics of school transformation reside in
academics, there are various factors within a school that impact student academic success that
can be individually transformed as well. Additionally, more attention should be provided to
students at various non-community schools with the opportunity to participate in more services
and programs offered at community schools, such as an on-site food pantry and health services.
According to 2016 updates to the LUS School District’s 2013-2014 Philanthropic
Strategic Plan, two of the school district’s partners were Orlando Health/Health Central and
Publix Super Markets Charities (LUS School District, 2014, 2016). Outlining the details of these
two partnerships to allow students more free medical care outside of the traditional school nurse
and back-to-school or athletics physical would impact student performance and provide each
student at every Title I school access to food during school breaks. These ideas, among many
others, present the idea of “differentiated transformation” and the implementation of more
“community school like practices”. School leaders, stakeholders and community members
should continuously work together to transform schools in the categories of academics, school
culture, community and parental support to meet the needs of all learners and their families.
The southern state adopted the community school model in various districts throughout
the state and is working towards passing federal legislation supporting community schools. In
2016, Senator Thompson sponsored a bill supporting community schools. SB 1246 is an act
requiring the “Department of Education to implement the Reigniting Education Achievement
with Coordinated Help (REACH) program as a public-private partnership in the lowest-
193
performing public schools” (The State Senate, p. 1, 2016). Turning these schools into community
schools was the planned approach to transform low-performing schools.
Recommendations for Future Studies
This study sought to determine if there was a difference in student performance,
attendance, discipline and before and after implementation of the community school practices for
the 2011-2012 and 2015-2016 school years. Additionally, the study was also conducted to
analyze the trends, if any, in graduation rate and frequency of industry certifications before and
after implementation of the community school practices. The study also compared the LUS
Community School to two like comparison schools to identify differences, if any, in the areas of
student performance, attendance, discipline, and graduation rate.
The following are suggested topics for further research:
1. This study was delimited to the senior cohorts of 2011-2012 and 2015-2016. Further
research should replicate this study by including the full student membership
population.
2. Further research should be conducted to investigate the impact of alternative
measures to out-of-school suspensions throughout the LUS School District.
3. Qualitative ex-post facto studies in the form of interviews and surveys should be
conducted to investigate students’ perspectives of the community school model and
practices as they relate to their performance and motivation.
4. Qualitative ex-post facto studies in the form of interviews and surveys should be
conducted to investigate parents’ perspectives of the community school model and
practices as it relates to student performance and motivation.
194
5. Qualitative ex-post facto studies in the form of interviews and surveys should be
conducted to investigate the parents’ perspectives of the community school model
and practices as it relates to the family-school relationship.
6. Further research should be conducted to investigate the level of parental involvement
before and after implementation of the community school practices at the same school
in this study.
7. Further research should be conducted to examine climate survey results before and
after implementation of the community school practices.
8. Further research should be conducted to investigate the performance of Hispanic
students at a community school compared to Hispanic students attending a traditional
school without the community school practices.
9. Further research should be conducted to explore the similarities in community school
practices and traditional school practices.
10. A longitudinal research study should be conducted to track industry certifications
earned by students and their postsecondary academic track and/or workforce path to
determine a correlation, if any.
11. Further research should be conducted to investigate the relationship between industry
certifications and technical schools in the same school district.
12. Further research should be conducted to investigate the school climate, school
culture, and teacher retention before and after implementation of the community
school practices.
195
13. Further research should be conducted to investigate the funding of community
schools as it relates to funding sources, longevity, and sustainability.
14. Further research should be conducted to investigate the governance and policies of
community schools when compared to traditional non-community schools.
15. Further research should be conducted to investigate the role of the community school
director.
16. Further research should be conducted to investigate the culturally responsive
professional development for teachers and administrators at urban community
schools.
17. Future studies should be conducted to investigate the practices and results of
community schools in the U.S. and community schools abroad.
Summary
The problem posed in this study was to determine the effectiveness of the community
school practices in a community school in a large urban school district before and after
implementation of the community school practices. Additionally, the study sought to compare
the LUS Community School to high schools not using the community school practices in the
same large urban school district. These practices included medical, dental, and vision health care,
before and after school tutoring, mentoring, anger management, character development,
counseling, job coaching, and financial literacy. The results of independent t-tests indicated that
there were statistically significant differences in student performance, in regard to cumulative
grade point average, discipline, and attendance for the years involved in this study. Additionally,
196
there was a difference in graduation rate and the frequency distribution, by categories of industry
certifications for the years involved in this study.
Although findings were applicable to the selected community school in the southern U.S.,
there is still much to be understood about community school practices in this region of the U.S.
and the perceptions of a community school from students, parents, community members, and all
of stakeholders involved. The researcher has included an extensive list of recommendations for
future studies that will, if explored, provide insight into these perceptions. Despite the model of
the school, whether a community school or a traditional school, there are key practices that must
be present to contribute to the success of students in the most vulnerable neighborhoods and
schools. Forming a strong parent-school-community relationship and emphasizing more
community based education will strengthened this bond and provide opportunities for students to
be strong academically and become skillful citizens.
Throughout the U.S., in various school districts and classrooms, there is a push for more
differentiated instruction within education; however, this same push for differentiation must be
aligned with the services provided to students in an effort to coach them to not only grow
academically, but mentally, socially, and physically. For many students, the task of simply
making it to school in the morning is very challenging due to possible untreated
illnesses/sickness, limited access to the proper nutrition in the morning, clean and wearable
clothing, taking care of younger siblings and a host of other barriers. It is important that when
these students are educated that false assumptions are not attached to them and that those
charged with guiding them do not ignore their challenges or place demands on those who are
being impacted by barriers outside of the classroom. Malcolm X once said, “Education is the
197
passport to the future, for tomorrow belongs to those who prepare for it today”. It is the
responsibility of educators to “stamp students’ passports” with the skillsets that will help break
down barriers they may be facing or will face in the future. Community schools throughout the
U.S. and abroad break down these barriers.

198
APPENDIX A
PERMISSION TO REPRODUCE FIGURE
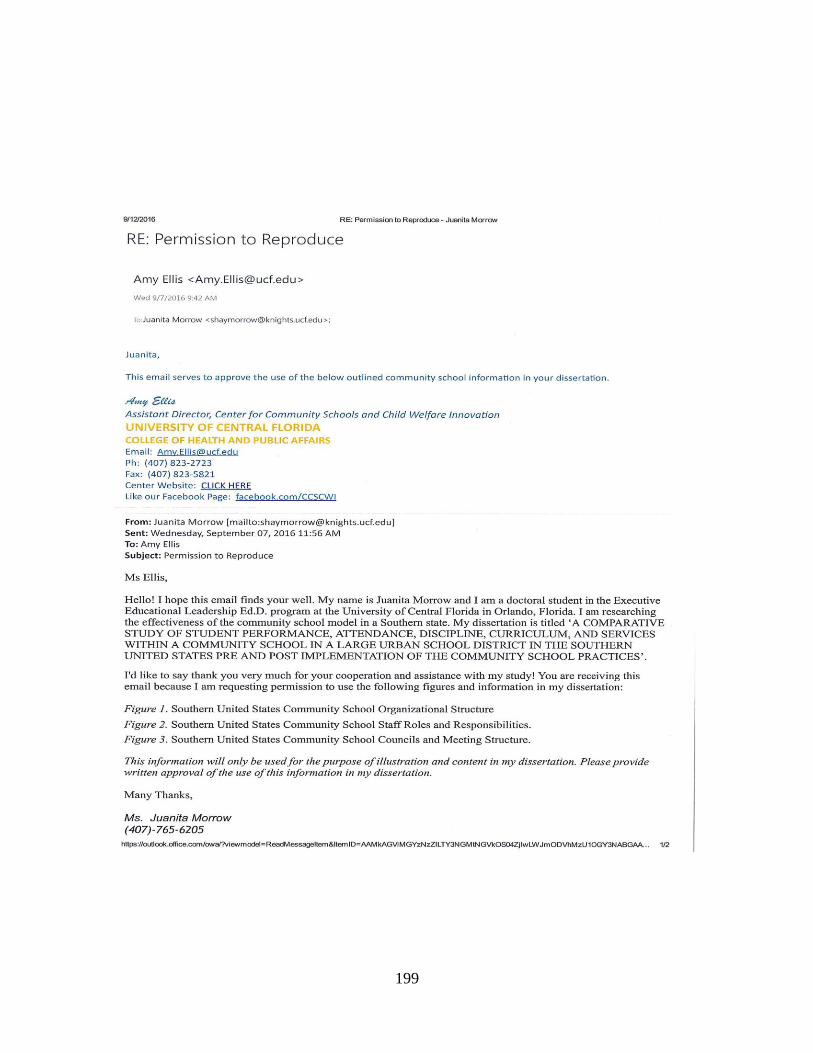
199

200
APPENDIX B
INSTITUTIONAL REVIEW BOARD APPROVAL
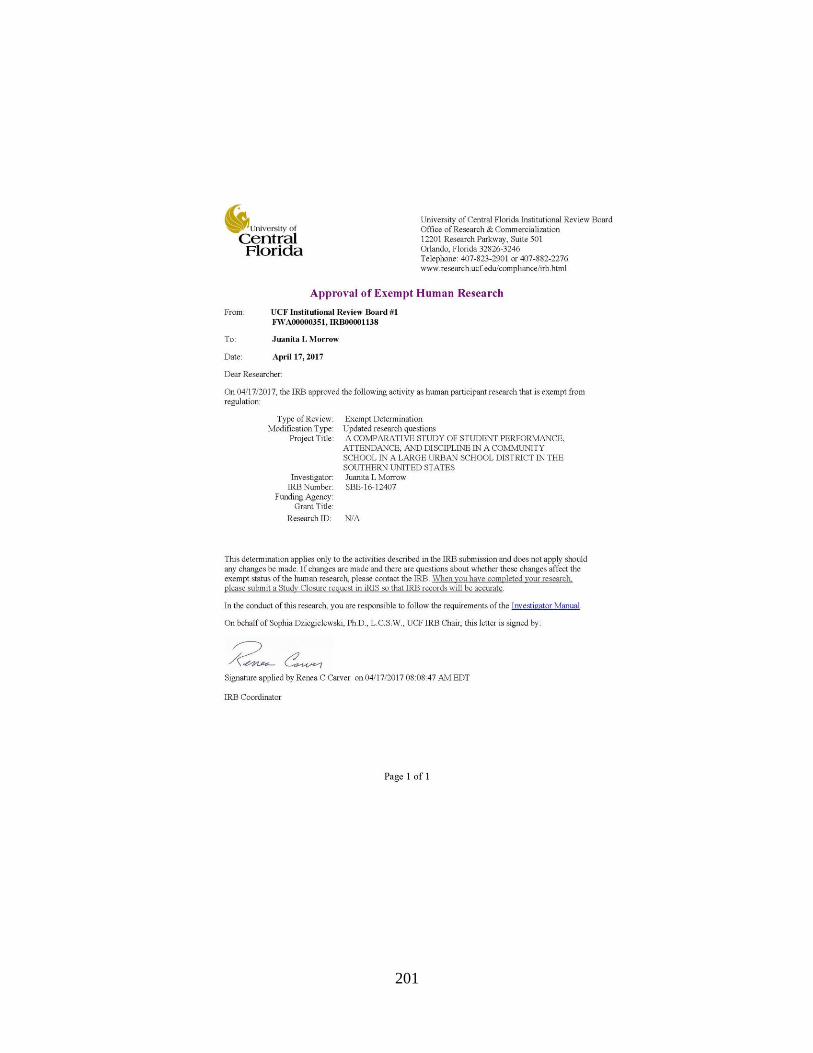
201
202
REFERENCES
A Broader, Bolder Approach to Education (n.d.). Statement: A broader, bolder approach to
education. Retrieved from http://www.boldapproach.org/statement.html
Abrams, L., & Gibbs, J.T. (2000). Planning for school change: School community collaboration
in an elementary school. Urban Education, 35(1), 79-103.
Afterschool Alert (2011). Quality Afterschool: Helping programs achieve it and strengthening
policies to support it. Issue Brief No. 47. Washington, DC: Afterschool Alliance.
Afterschool Alliance (2012). Afterschool: A key to successful parent engagement. MetLife
Foundation, Afterschool Alert, Issue brief No. 57. Retrieved from
www.afterschoolalliance.org
Afterschool Alliance (2014). 21st century community learning centers: Providing afterschool and
summer learning support to communities nationwide. Retrieved from
www.afterschoolalliance.org
Aiken, N.L., & Barbarin, O. (2008). Socioeconomic differences in reading trajectories: The
contribution of family, neighborhood, and school contexts. Journal of Educational
Psychology, 100, 235-251.
American Psychological Association. (2014). Socioeconomic status. Retrieved from
http://www.apa.org/topics/socioeconomic-status/index.asp
Anderson, K, & Emig, C. (2014). Integrated student supports: A summary of the evidence base
for policymakers. Child Trends. Retrieved from 2014-051SSWhitePaper3.pdf
203
Ashley, D. (2015). It’s about relationships: Creating positive school climates. American
Educator, Winter 2015-2016.
Ashley, J. & Burke, K. (n.d.). Implementing restorative justice: A guide for schools. The Illinois
Criminal Justice Information Authority.
Aspiazu, G.G., Bauer, S.C., & Spillet, M.D. (1998). Improving the academic performance of
Hispanic youth: A community education model. Bilingual Research Journal, 22(2), 1-20.
Axelroth, R. (2009). Raising graduation and college going rates: Community high school case
studies. Washington, DC: Coalition for Community Schools, Institute for Educational
Leadership.
Bandura, A. (2004). Health promotion by social cognitive means. Health Education and
Behavior, 31(2), 143-164.
Barajas, M.S. (2011). Academic achievement of children in single parent homes: A critical
review. The Hilltop Review, 5(1), 4.
Barth, R.S. (2006). Improving the relationships within the schoolhouse. Educational Leadership,
63(6), pp.8-13.
Basch, C. (2011). Healthier students are better learners: A missing link in school reforms to close
the achievement gap. Journal of School Health, 81(10).
Beers, H.W., Goodyknootz, B., Grim, E.L., Hanna, P., Seay, M.F., & Strand, R. (1953). The
fifty-second yearbook of the National Society for the Study of Education: Part II The
Community School. Chicago, IL.
204
Benson, L., Harkavy, I., Johanek, J., & Puckett, J. (2009). The enduring appeal of community
schools: Education has always been a community endeavor. American Educator 33(2),
22-29.
Berg, A., Melaville, A., & Blank, M.J. (2006). Community and family engagement: Principals
share what works. Washington, DC: Coalition for Community Schools. Retrieved from
http://www.communityschools.org/assets/1/assetmanager/communityandfamilyengageme
nt.pdf
Black, D. (2014). Why integration matters in schools. Education Week. 33(31), 29.
Blair, S.L., Blair, M.C.L, & Madama, A.B. (1999). Racial/Ethnic differences in high school
students’ academic performance: Understanding the interweave of social class and
ethnicity in the family context. Journal of Comparative Family Studies, 30, 539-555.
Blank, M. J. (2005). Building the community school movement: Vision, organization, and
leadership. New Directions for Youth Development, 2005(107), 99-104.
Blank, M., & Berg, A. (2006). All together now: Sharing the responsibility for the whole child. A
report for the Commission on the Whole Child convened by the ASCD, Alexandria, VA.
Blank, M.J., Jacobson, R., & Melaville, A. (2012). Achieving results through community school
partnerships: How district and community leaders are building effective, sustainable
relationships. Washington, DC: Center for American Progress.
Blank, M., Jacobson, R. & Pearson, S.J. (2009). A coordinated effort: Well-conducted
partnerships meet students’ academic, health, and social service needs. American
Educator.
205
Blank, M.J., Melaville, A., & Shah, B.P. (2003). Making the difference: Research and practice
in community schools. Coalition for Community Schools, Institute for Educational
Leadership.
Borman, G.D., & Dowling, N.M. (2008). Teacher attrition and retention: A meta-analytic and
narrative review of the research. Review of Educational Research, 78(3), 367-409.
Doi:10.3102/0034654308321455
Bowman, S., Pratt, C., Rennekamp, D., & Sektnan, M. (2010). Should we invest in parenting
education? The Ford Family Foundation’s Enhancing the Skills of Parents Program, II,
Oregon State University.
Braithwaite, J. (2004). Restorative justice: Theories and worries. Visiting Expert Papers, 123rd
International Senior Seminar, Resource Material Series, 63, p.47-56. Tokyo: United
Nation Asia and Far East Institute for the Prevention of Crime and the Treatment of
Offenders.
Brantlinger, E. (1991). Social class distinctions in adolescents’ report of problems and
punishment in school. Behavioral Disorders, 17, 36-46.
Bronfenbrenner, U. (1979). The ecology of human development: Experiments by nature and
design. Cambridge, MA: Harvard University Press.
Brooks, S.M. (2009). A case study of school-community alliances that rebuilt a community.
School Community Journal, 19(2), 59-80.
Brown, A. & Mediratta, K. (2015). Bringing everyone to the table to eradicate school disparities.
The Atlantic Philanthropies and Open Society Foundations, 42.
206
Bruns, E.J, Walker, J.S., Adams, J., Miles, P., Osher, T.W., Rast, J., VanDenBerg J.D. &
National Wraparound Initiative Advisory Group. (2004). Ten principles of the
wraparound process. Portland, OR: National Wraparound Initiative, Research and
Training Center on Family Support and Children’s Mental Health. Portland State
University.
Burns, M.K., Senesac, B.V., & Symington, T. (2004). The effectiveness of the HOSTS program
in improving the reading achievement of children at-risk for reading failure. Reading
Research and Instruction, 43(2), 87-103.
Cairney, T.H. (2000). Beyond the classroom walls: the rediscovery of the family and community
as partners in education. Educational Review, 52(2), 163-174.
Center, E., Rassen, E., & Gunderson, J. (n.d.). Leveling the playing field: Community schools
confront poverty to improve student success.
Center for community partnerships. (2016a). Retrieved from
https://www.cohpa.ucf.edu/community-partnerships/evans-community-school/
Center for Community Schools and Child Welfare Innovation. (2016b). Initiatives. Retrieved
from https://www.cohpa.ucf.edu/communityschools/initiatives/
Centers for Disease Control and Prevention (2014). Children’s oral health. Retrieved from
http://www.cdc.gov/OralHealth/children_adults/child.htm
Centers for Disease Control and Prevention (2014). Health and academic achievement.
Centers for Disease Control and Prevention. (2009). School connectedness: Strategies for
increasing protective factors among youth. Atlanta, GA: U.S. Department of Health and
Human Service.
207
Center for Mental Health in Schools. (2008). Community Schools: Working Toward Institutional
Transformation.
The Children’s Aid Society (2011). Building community schools: A guide for action. MetLife
Foundation.
Children’s Defense Fund (1975). School suspensions: Are they helping children? Cambridge,
MA: Washington Research Project.
Chung, Y. & Park, Y. (2014). The effects of financial education and networks on business
students’ financial literacy. American Journal of Business Education, 7(3).
CIW. (2017). High schools. Retrieved from https://www.ciwcertified.com/about-ciw/who-
teaches-ciw/high-schools.
Coalition for Community Schools. (2015). Vision, mission, principles and strategies, coalition
for community schools through 2020. Retrieved from
http://www.communityschools.org/about/mission.aspx?print=y.
Coalition for Community Schools. (2016a). State policy. Retrieved from
http://www.communityschools.org/policy_advocacy/state.aspx.
Coalition for Community Schools. (2016b). What is a community school? Retrieved from
http://www.communityschools.org/aboutschools/what_is_a_community_school.aspx
Coalition for Community Schools. (2017). Community schools: A whole-child framework for
school improvement. Retrieved
http://www.communityschools.org/assets/1/AssetManager/Community-Schools-A-
Whole-Child-Approach-to-School-Improvement1.pdf.
208
Coggshall, J., Lasagna, M., & Laine, S., (2009). Toward the structural transformation schools:
Innovations in staffing. Learning Point Associates.
Cohen, J. (2011). Jonathan Cohen on school climate: Engaging the whole village, teaching the
whole child. The Challenge, 16(4), 1-8.
Cohen, M. (2005). Reconsidering schools and the American welfare state. History of Education
Quarterly, 45(4), 511-537.
Cole, A.G. (2010). School-community partnerships and community-based education: A case
study of a novice program. The University of Pennsylvania Graduate School of
Education’s Online Urban Education Journal, 7(1), 15-26.
Communities for Excellent Public Schools. (2010). A proposal for sustainable school
transformation.
Cornell, D.G., & Sheras, P.L. (2006). Guidelines for responding to student threats of violence.
Boston: Sopris West Educational Services.
Crowson, R.L. (1998). Community empowerment and the public schools: Can educational
professional survive? Peabody Journal of Education, 73(1), 56-68.
Crowson, R.L. (2011). The study of bureaucracy in urban education: Bill Boyd on the
organizational dynamics of large-city school systems. Peabody Journal of Education,
86(4), 464-478.
Crowson, R.L., & Boyd, W.L. (1993). Coordinated services for children: Designing arks for
storms and seas unknown. American Journal of Education, 101(2), 140-179.
Crowson, R.L., & Boyd, W.L. (1996). Achieving coordinated school-linked services: Facilitating
utilization of the emerging knowledge base. Educational Policy, 10(2), 253-272.
209
Crowson, R.L., & Boyd, W.L. (2001). The new role of community development in educational
reform. Peabody Journal of Education, 76(2), 9-29.
Crowson, R.L., & Hinz, S.E. (2015). Community contexts up close: What does it mean to be
“legitimate” in today’s education policy environment? Peabody Journal of Education,
90(1), 178-289.
Darling-Hammond, L. (2010). The flat world and education: How America’s commitment to
equity will determine our future. New York: Teachers College Press.
Dehuff, P.A. (2013). Students’ wellbeing and sense of belonging: A qualitative student of
relationships and interactions in a small school district. Doctoral dissertation.
Washington State University.
Department of Education (2014). Extended schools criteria and funding formula. Extended
schools criteria and funding formula 2014/15. Retrieved from https://www.education-
ni.gov.uk/publications/extended-schools-criteria-and-funding-formula.
Data for Action (2014). Preparing students for jobs, ensuring student success in the workforce.
Data Quality Campaign: Using Data to Improve Student Achievement.
Dewey, J. 1897. My pedagogic creed. The School Journal, Volume LIV(3).
Dewey, J.1900. The school and society. Chicago, The University of Chicago.
Dewey, J. 1902. The child and the curriculum. Introd. Philip Jackson, Chicago: The University
of Chicago.
Dewey, J. 1916. Democracy and education. New York: Free, 1967.
Dewey, J. 1920. Reconstruction in philosophy. Boston: Beacon, 1962.
Dewey, J. 1938. Experience and education. New York: Collier, 1963.
210
Discrimination against students and employees in the Florida K-20 public education system
prohibited; equality of access required. Fla. Stat. § 100.05 (2015), Title XLVIII.
Retrieved from Online Sunshine
http://www.leg.state.fl.us/statutes/index.cfm?App_mode=Display_Statute&Search_String
DisGiuseppe, R. & Tafrate, R.C. (2003). Anger treatment for adults: A meta-analysis review.
Clinical Psychology: Science and Practice, 10(1), 70-84.
Doaks, S. (2014). An analysis of race and gender in select choice programs within Brevard
County Public Schools (Doctoral dissertation). University of Central Florida, Orlando,
FL. (Identifier: CFE0005325).
Downey, D.B., Von Hippel, P.T., & Hughes, M. (2008). Are “failing” schools really failing?
Using seasonal comparison to evaluate school effectiveness. Sociology of Education,
81(3), 242-270. Doi:10.1177/003804070808100302
Dragoset, L., Thomas, J., Herrmann, M., Deke, J., James-Burdumy, S., Graczewski, C., Boyle,
A., Upton, R., Tanenbaum, C., Giffin, J. (2017). School improvement grants:
Implementation and effectiveness: Executive Summary (NCEE 2017-4012). Washington,
DC: National Center for Education and Evaluation and Regional Assistance, Institute of
Education Sciences, U.S. Department of Education.
Dryfoos, J. (2002). Full-service community schools: Creating new institutions. Phi Delta
Kappan, 83(5), 393-399.
Dryfoos, J. (2005). Full-service community schools: A strategy-not a program. New Directions
for Youth Development, 107. Wiley
211
Dryfoos, J.G., & Maguire, S. (2002). Inside full-service community schools. Thousand Oaks,
CA: Corwin Press.
Dryfoos, J.G., Quinn, J., & Barkin, C. (2005). Community schools in action: Lessons from a
decade of practice. Oxford University Press: New York, New York.
DuBois, W. E. B. (1903). The talented tenth., from The Negro problem: A series of articles by
representative Negroes of To-Day. Retrieved from
http://teachingamericanhistory.org/library/document/the-talented-tenth/
Duncan, A. (2012, February 06). Fighting the wrong education battles. Speech presented at the
Askwith Forum. Harvard University Graduate School of Education Lecture Series in
Massachusetts, Cambridge. Retrieved from http://www.ed.gov/news/speeches/fighting-
wrong-education-battles
Dye, B., Xianfen, L., & Beltran-Anguilar, E. (2012). Selected oral health indicators in the
United States 2005-2008. NCHS Data Brief, no. 96. Hyattsville, MD: National Center for
Health Statistics, Centers for Disease Control and Prevention; 2012.
Ebersole, M., Kannahele-Mossman, H., & Kawakami, A. (2016). Culturally responsive teaching:
Examining teachers’ understandings and perspectives. Journal of Education and Training
Studies, 4(2).
Ediger, M. (2004). Evaluation of the community school concept. College Student Journal, 38(1).
Egalite, A. (2016). How family background influences student achieving: Can schools narrow
the gap? Education Next, 16(2).
Epstein, J.L, Coates, L., Salinas, K.C., Sanders, M.G., & Simon, B.S. (1997). School, family, and
community partnerships: Your handbook for action. Thousand Oaks, CA: Corwin Press.
212
Epstein, J.L. (2015). REL Mid-Atlantic educator effectiveness webinar series engaging families
in partnership programs to programs to promote student success Q & A for Dr. Joyce L.
Epstein on August 27, 2015. Bridge Events and Webinars, Supporting Education through
Research.
Epstein, J.L., Sanders, M.G., Sheldon, S., Simon, B.S., Salinas, K.C., Jansorn, N.R., Williams,
K.J. (2002). School, family, and community partnerships: Your handbook for action (2nd
ed.). Thousand Oaks, CA: Corwin.
Federation for Community Schools (n.d.). A community school transformation: A guide for
schools, districts, parents, and community members. Working together to improve
outcomes for students, families and communities.
Felner, R.D., Primavera, J., & Cauce, A.M. (1981). The impact of school transitions: A focus for
preventive efforts. American Journal of Community Psychology, 9(4), 449-459.
Ferebee, A. (2004). Childhood vision: Public challenges and opportunities. A policy brief.
Washington DC: Center for Health and Health Care in Schools, School of Public Health,
George Washington University Medical Center.
Ferrara, M.M. (2015). Parent Involvement facilitators: Unlocking social capital wealth. School
Community Journal, 25(1).
Finnigan, K.S., Bitter, D., & O’Day, (2009). Improving low-performing schools through external
assistance: Lesson from Chicago and California. Education Policy Analysis Archives,
17(7), 1-8.
The Florida Senate. SB 1246. General bill by Thompson. Retrieved from
https://www.flsenate.gov/Session/Bill/2016/1246/?Tab=BillText on 26, July 2016.
213
Florida Statute § 1000.05 (2015), Title XLVIII. Retrieved from Online Sunshine
http://www.leg.state.fl.us/Statutes/index.cfm?App_mode=Display_Statute&Search_Strin
g=&URL=1000-1099/1000/Sections/1000.05.html.
Florida’s Positive Behavior Support Project (2002). What is pbs? Retrieved from
http://flpbs.fmhi.usf.edu/whatispbs_def.cfm.
Frankel, J. Wallen, N. & Hyun, H. (2015, p.113). How to design and evaluate research in
education. (9th ed.). New York: McGraw-Hill.
Frey, A.J., Lingon, A., & Nelson, C.M. (2008). Positive behavior support: A call for leadership.
Children & Schools, 30, 5-14.
Fronius, T., Persson, H., Guckenburg, S., Hurley, N., & Petrosino, A. (2016). Restorative justice
in U.S. schools: A research review. West Ed. Justice & Prevention Research Center.
Gall, G., Pagano, M.E., Desmond, M.S., Perrin, J.M., & Murphy, J.M. (2000). Utility of
psychosocial screening at a school-based health center. The Journal of School Health,
70(7), 292-298.
Gallagher, K.S., Goodyear, R., Brewer, D.J., & Rueda, R. (2012). Urban education: A model for
leadership and policy. New York, NY. Routledge
Gehring, J. (2005). Dips in enrollment posing challenges for urban district. Education Week.
Retrieved from http://www.edweek.org/ew/articles/2005/03/02/25enrollment.h24.html.
Ghezzi, B. (2003). One friendship at a time. Christianity Today, 47,(8).
Glaser, B. G. (1998) Doing grounded theory: Issues and discussions. Mill Valley,
CA: The Sociology Press.
214
Gold, E. & Simon, E. (2002). Successful community organizing for school reform. Strong
Neighborhood, Strong Schools: The Indicators Project on Education Organizing.
Gorski, P. (2008). The myth of the culture of poverty. Educational Leadership 65(7), 32-36.
Gray, R. (2013). How can authentic community engagement be fostered through federal policy?
VUE, Annenberg Institute for School Reform.
Greever, S. (2014). Poverty in education: A literature review. Paper presented at Missouri State
University.
Griswold, M.R. (2011). Community schools: Catalyst for comprehensive neighborhood-based
initiatives. Theses and Dissertations. Paper 1738. University of Toledo.
Guin, K. (2004). Chronic teacher turnover in urban elementary schools. Educational Policy
Analysis Achieves, 12(42), 1-30.
H.R. 12650 (95th): Schools and Comprehensive Community Education Act. Retrieved on 09
December 2015 from https://www.govtrack.us/congress/bills/95/hr12650.
H.R. 3545 (111th) Congress, 1st session: Full-Service Community Schools Act of 2006. Retrieved
on 02 May 2016 from https://www.govtrack.us/congress/bills/111/hr3545/text/ih.
Hackfort, D. & Schwenkmezger, P. (1993). Anxiety. In R.N. Singer, M. Murphy & L.K. Tennant
(Eds.). Handbook of research on sport psychology, p. 328-364). New York: Macmillan.
Harkavy, I. & Blank, M. (2002). Community Schools: A vision of learning that goes beyond
testing. Education Week, 21(31), 1-5.
Haurin, D.R., Parcel, T.L., & Haurin, R.J. (2001). The impact of homeownership on child
outcomes. Low-Income Homeownership Working Paper Series. Joint Center for Housing
Studies of Harvard University.
215
Haycock, K. & Crawford, C. (2008). Closing the teacher quality gap. Educational Leadership,
65(7), 14-19.
Hemphill, F. C., and Vanneman, A. (2010). Achievement Gaps: How Hispanic and White
Students in Public Schools Perform in Mathematics and Reading on the National
Assessment of Educational Progress (NCES 2011-459). National Center for Education
Statistics, Institute of Education Sciences, U.S. Department of Education. Washington,
DC.
Herschback, D.R. (2001). The 1970s. Journal of Instructional Teacher Education, 39(1).
Horn, M.B., Freeland, J., & Butler, S. (2015). Schools as community hubs: Integrating support
services to drive education outcomes. Economic Studies at Brookings, 3.
Humensky, J., Kuwabara, S.A., Fogel, J., Wells, C., Goodwin, B., Van Voorhees, B.M. (2010).
Adolescents with depressive symptoms and their challenges with learning in school. The
Journal of School Nursing, 26(5), 377-392.
Huston, A,C., Duncan, G.J., Granger, R., Bos, J., McLoyd, V., Mistry, R., Crosby, D., Gibson,
C., Magnuson, K., Romich, J., & Ventura, A. (2001). Work-based antipoverty programs
for parents can enhance the school performance and social behavior of children. Child
Development, 72(1), 318-336.
Ingersoll, G.M., Scamman, J.R., & Eckerling, W.D. (1989). Geographic mobility and student
achievement level in an urban setting. Educational Evaluation and Policy Analysis,
11(2), 143-149.
216
Ingersoll, R.M. (2004). Why do high-poverty schools have difficulty staffing their classrooms
with qualified teachers. Washington DC: Center for American Progress and Institute for
American’s Future.
Ingersoll, R.M., & May, H. (2011). Recruitment, retention and the minority teacher shortage.
The Consortium for Policy Research in Education.
Jacobson, R. (2015). The state of community schools in New Jersey: A growing education and
health reform strategy. New Jersey Health Initiatives. The Coalition for Community
Schools at the Institute for Educational Leadership. Retrieved from
http://www.njhi.org/wp-content/uploads/2015/12/2015-12-15-NJHI-White-Paper-
Community-Schools-FINAL.pdf
Johnson, M.K., Cronsnoe, R., & Elder, G.H., Jr. (2001). Students’ attachment and academic
engagement: The role of race and ethnicity. Sociology of Education, 74, 318-340.
Jones, C.A. (n.d.). Uplifting the whole child: Using wraparound services to overcome social
barriers to learning. Massachusetts Budget and Policy Center and the Rennie Center for
Education Research & Policy.
Kera, S. (1997). New perspectives on mentoring. ERIC Digest.
King, L’Monique (2013). The Relevance and redefining of Du Bois’s Talented Tenth: Two
Centuries Later. Papers & Publications: Interdisciplinary Journal of Undergraduate
Research, (2)9.
King, Martin L., Jr. “I Have a Dream.” Speech. Lincoln Memorial, Washington, D.C. 28 August
1963. Michelson, R.A., Bottia, M., & Southworth, S. (2008). School choice: Evidence
and recommendations. Great Lakes Center for Education Research & Practice.
217
Klem, A.M. & Connell, J.P. (2004). Relationships matter: Linking teacher support to student
engagement and achievement. Journal of School Health, 74, 262-273.
Kochan, F. & Pascarelli, J. (2003). Mentoring as transformation: Initiating the dialogue. Global
Perspectives on Mentoring, 9-17.
Kochhar-Bryant, C. (2010). Effective collaboration for educating the whole child. Thousand
Oaks, CA: Sage.
Kutash, K., Duchnowski, A.J., & Lynn, N. (2006). School-based mental health: An empirical
guide for decision-makers. Tampa FL: University of South Florida, The Louis de la Parte
Florida Mental Health Institute, Department of Children & Family Studies, Research and
Training Center for Children’s Mental Health.
Lippman, L., Burns, S., McArthur, E., & National Center for Education Statistics (1996). Urban
Schools, The challenge of location and poverty. U.S. Department of Education: Office of
Educational Research and Improvement, NCES 96-184.
Lochman, J.E., Palardy, N.R., McElorey, H.K., Phillips, N., & Holmes, K.J. (n.d.). Anger
management interventions. Journal of Early and Intensive Behavior Intervention, 1(1), p.
47-55.
Luna, Elisa Cooper (2011). A case study of the full service community school model: School level
benefits in an urban, southern elementary school. (Doctoral dissertation). University of
Tennessee, Knoxville, TN.
LUS Community School (2016a). A community school. About us. Retrieved from
http://evanscommunityschool.org/about/
LUS Community School. (2016). Mission & vision. Retrieved from
218
http://evanscommunityschool.org/about/
LUS Community School. (2016). Programs. Retrieved from
http://evanscommunityschool.org/about/
LUS School District (2011-2012). Student code of conduct.
LUS School District (2015-2016). Student code of conduct.
LUS School District (2016). School choice services: High school magnet programs. Medical
Magnet, Jones High School. Retrieved from
https://www.ocps.net/cs/services/options/schoolchoice/MagnetPrograms/Pages/HighScho
olMagnetPrograms.aspx.
LUS School District (2014). Philanthropic strategic plan. Updated 2016. Retrieved from
https://www2.ocps.net/departments/foundation_for_o_c_p_s/philanthropic_development.
LUS School District (2017). General information. Retrieved from
https://www2.ocps.net/about_us/general_information.
LUS School District (2017). Restorative justice. Retrieved from
https://www2.ocps.net/departments/minority_achievement_office/restorative_justice/.
LUS School District (2017). Latinos in action. Retrieved from
https://www2.ocps.net/departments/minority_achievement_office/latinos_in_action/.
Lunenburg, F.C. (2010). Schools as open systems. Schooling, 1(1).
Maslow, A.H. (1943). A theory of human motivation. Psychological Review, 50(4), 370-396.
Maslow, A.H. (1954). Motivation and personality. New York, NY: Harper.
Mastergeorge, A., Paschall, K., Horstein, J., Ayoub, C., Swartz, M., & Singer, J. (2013). Positive
parent-child relationships. Understanding Family Engagement Outcomes: Research to
219
Practice Series. National Center on Parent, Family, and Community Engagement for the
Office of Head Start.
Maxwell, L. (2008). Student mobility in N.Y.C. Education Week, 27(32), 5.
Mayo Clinic Staff. (2011). Anger management. Retrieved from
www.mayoclinic.com/health/anger-management/MY00689.
McKnight, M. (2011). False choice. New Republic. Retrieved from
https://newrepublic.com/article/86710/school-vouchers-education-republicans.
McLeod, S. (2016). Maslow’s Hierarchy of Needs. Simply Psychology. Retrieved from
http://www.simplypsychology.org/maslow.html.
McMillian, J., & Reed, D. (1994). At risk and resiliency: Factors contributing to academic
success. Clearing House.
Mensah, M.K. & Kuranchie, A. (2013). Influence of parenting styles on the social development
of children. Academic Journal of Interdisciplinary Studies, 2(3).
Merikangas, K.R. (2010). Lifetime prevalence of mental disorders in U.S. adolescents: Results
from the National Comorbidity study-adolescent supplement (NCS-A). Journal of the
American Academy of Child and Adolescent Psychiatry, 49(10), 980-989.
Mickelson, R.A., Bottia, M., & Southworth, S. (2008). School choice and segregation by race,
class, and achievement. University of North Carolina at Charlotte, Education Policy
Research Unit.
Misner, P. J. (1938). A community educational center. In S. Everett (Ed.), The community school
(pp. 51-82). New York: D. Appleton-Century Co.
220
Momeni, P. (2015). The impact of full service community school programs on student success.
(Doctoral dissertation). California State University, Sacramento, CA.
Morehouse, Henry Lyman. “The Talent Tenth.” The Independent. 1896. Retrieved from
webdubois.org on 20 April 2016.
Mumthas, N.S., Munavvir, J., & Abdul Gafoor, K. (2014). Student and teacher perception of
disciplinary practices: Types, reasons, consequences and alternatives. Guru Journal of
Behavioral and Social Sciences, 2(4).
Naiditch, F. (n.d.). Reviewing urban education: Learning cycles and the pedagogy of possibility.
Curriculum and Teaching at Montclair State University.
National Alliance of Black School Educators & ILLIAD Project (2002). Addressing over-
presentation of African American students in special education. Arlington, VA: Council
for Exceptional Children, and Washington, DC: National Alliance of Black School
Educators.
National Association of School Psychologists. (2010). Self-efficacy: Helping children believe
they can succeed. Communique’ Handout, 39(3).
National Center for Education Statistics. (2006). Trends in the use of school choice 1993 to 2003.
National Household Education Surveys Program, Washington, D.C.
National Center for Education Statistics (2014). Fast facts, charter schools. Retrieved from
https://nces.ed.gov/fastfacts/display.asp?id=30.
The National Center for Victims of Crime. (2012). Action partnership on interventions for black
children exposed to violence and victimization: Black children exposed to violence and
victimization. Retrieved from https://victimsofcrime.org/our-programs/other-
221
projects/youth-initiative/interventions-for-black-children%27s-exposure-to-
violence/black-children-exposed-to-violence.
National School Climate Center, Center for Social and Emotional Education, and National
Center for Learning and Citizenship at Education Commission of the States (2008). The
school climate challenge: Narrowing the gap between school climate research and
school climate policy, practice guidelines and teacher education policy. Retrieved on
January 1, 2016, from http://www.ecs.org/html/projectsPartners/nclc/docs/schoo-climate-
challenge-web.pdf
National School Climate Council. (2007). The school climate challenge: Narrowing the gap
between school climate research and school climate policy, practice guidelines, and
teacher education policy. Retrieved from
http://www.schoolclimate.org/climate/documents/school-climate-challenge.pdf
Netter Center for Community Partnerships (2016). University-assisted community schools.
Retrieved from https://www.nettercenter.upenn.edu/programs/university-assisted-
community-schools.
Nicely, Tanna H. (2016). An examination of the community school model in an urban school
setting. (Doctoral dissertation). East Tennessee State University, Johnson City, TN.
NICHE (2017). Just the facts: Charter school statistics. Retrieved from
https://articles.niche.com/charter-school-statistics/.
Noel, J. (2010). Weaving teacher education into the fabric of urban schools and communities.
Journal of Urban Learning, Teaching, and Research, 4(12).
222
Noguera, P. (2003). City schools and the American dream: Reclaiming the promise of public
education. New York: Teachers College Press.
Orfield, G. (2009). Reviving the goal of an integrated society: A 21st century challenge. Los
Angeles, CA: Civil Rights Project/Proyecto Derechos Civiles.
Owens, I. (2010). Breaking the mold: Combining community schools with expanded learning
time to help educationally disadvantaged students. Washington, DC: Center for
American Progress.
Owens, R. G. & Valesky, T. (2011). Organizational behavior in education. 11th Edition.
Needham Heights: Allyn & Bacon.
Pallin, E. (2010). Evaluating school turnaround. Boston, MA: Mass Insight Education.
Payne, R. K. (2005). A framework for understanding poverty. (4th ed.). Process: Highlands, TX.
Pharrington, D.P., & Loeber, R. (200). Epidemiology of juvenile violence. Child and Adolescent
Psychiatric Clinics of North America, 9(4), 5-6).
Phillips, Sarah F. (2010). Honoring 15 years of the 21st century community learning centers
program: A policy-centered analysis, (pp.28-34). Afterschool Matters.
Pungello, E.P., Iruka, I.U., Dotterer, A.M., Mills-Koonce, R., & Reznick, J.S. (2009). The effects
of socionecomic status, race, and parenting on language development in early childhood.
Development Psychology, 45(2), 544.
Quinn, J. (2009). Community schools: A strategy, not a problem. National Education
Association, 15(2)
Ravitch, D. (2013). Reign of error: The hoax of the privatization movement and the danger to
America’s public schools. New York: Knopf.
223
Rice, M. & Howell, C. (2006). Differences in trait anger among children with varying levels of
anger expression patterns. Journal of Child and Adolescent Psychiatric Nursing, 19(2),
51-61.
Rich, M. (2012). Enrollment off in big districts, forcing layoffs. The New York Times. Retrieved
from http://www.nytimes.com/2012/07/24/education/largest-school-districts-see-steady-
drop-in-enrollment.html
Rochkind, J., Ott, A., Immerwhar, J., Doble, J., & Johnson, J. (2007). Lessons learned: New
teachers talked about their jobs, challenges, and long-range plans: A report from the
National Comprehensive Center for Teacher Quality and Public Agenda. New York:
Public Agenda.
Rogers-Chapman, M.F. & Darling-Hammond, L. (2013). Preparing 21st century citizens: The
role of work-based learning in linked learning. Stanford Center for Opportunity in
Education-Knowledge Brief.
Rothstein, R. (2013). Why our schools are segregated. Educational leadership. 70(8).
Rowe, D. (2009). Connecting academics to the real world. ACTE Research.
Rugg, H., Broudy, H., & Brubacher, J. (1960). John Dewey in perspective. Bulletin of the School
of Education: Indiana University. Division of Research and Field Services.
Russo, C.J. (2004). Brown v Board of Education at 50: An update on school desegregation in the
US. Education and the Law, 16(2-3), 183-189.
Santiago, E., Ferrara, J. & Quinn, J. (2012). Whole Child, Whole School: Applying theory to
practice in a community school. Lanhamn, MD: Rowman & Littefield.
Santich, K., & Postal, L. (2011, January 13). Grant to turn Evans high into a major community
224
hub. The Orlando Sentinel. Retrieved from parental-involvement-school-moves-
principal-david-christiansen.
Sedlak, M. W., & Schlossman, S. (1985). The public school and social services: Reassessing the
progressive legacy. Educational Theory, 35(4), 371-83.
Scafidi, B., Sjoquist, D.L., & Stinebrickner, T.R. (2007). Race, poverty, and teacher mobility.
Economics of Education Review, 26(2), 145-159.
Shi, L. (2014). Early identification of high-achieving, low-income student and their college
participation rates. Virginia Policy Review, 7(2), 23-32.
Shika, R., Reynolds, C.R., Graham, S., Sheras, P., Conoley, J.C., and Garcia-Vazquez, E. (2006).
Are zero tolerance policies effective in the schools? An evidentiary review and
recommendations. A report by the American Psychological Association Zero Tolerance
Task Force.
Siraj, H.H, Roslan, S.A., Hasan, N., Jin, T., & Othman, M. (2014). Stress and its association with
the academic performance of undergraduate fourth year medical students at Universiti
Kebangsaan Malaysia. The International Medical Journal Malaysia, 13(1).
Skiba, R. & Peterson, R. (2000). School discipline at a crossroads: From zero tolerance to early
response. Exceptional Children, 66, 335-346.
Skiba, R.J. & Losen, D.J. (2016). From reaction to prevention: Turning the page on school
discipline. American Educator.
Slap, G., Goodman, E., & Huang, B. (2001). Adoption as a risk factor for attempted suicide
during adolescence. Pediatrics, 108(2), E30.
225
Slavin, R. (2008). Perspectives on evidence-based research in education: What works?
Educational Researcher, 37, 5-14.
Smiley, A., Drake, J., & Sheehy, C. (2010). Blazing a new path: Collaborating towards best
practices in urban teacher education. Yearbook of Urban Learning, Teaching, and
Research.
Smith, T.K., Connolly, F., & Pryseski, C. (2014). Positive school climate: What is looks like and
how it happens. Nurturing positive school climate for student learning and professional
growth. Baltimore Education Research Consortium.
State Department of Education [SDOE]. (1992). DOE information data base requirements.
Volume 1: Automated student information system automated student data elements.
Element name: Grade Point Average State, Cumulative.
State Department of Education [SDOE]. (2013). Education information & accountability
services: data report. State high school cohort graduation rates and single-year dropout
rates, 2012-2013. Retrieved from www.fldoe.org
State Department of Education [SDOE]. (2015). Technical guide on procedures for reviewing
and updating the 2014-2015 cohort files for the four-year graduation rate. Retrieved
from http://www.fldoe.org/
State Department of Education [SDOE]. (2016). Accountability Rules, 2014-2015 school grades
simulation. Retrieved from http://www.fldoe.org/accountability/accountability-
reporting/accountability-rules.stml
226
State Department of Education. [SDOE]. (2016). Controlled open enrollment. Retrieved from
http://www.fldoe.org/schools/school-choice/other-school-choice-options/controlled-open-
enrollment.stml.
State Department of Education. [SDOE]. (2016). Industry certification. Retrieved from
http://www.fldoe.org/academics/career-adult-edu/industry-certification.
State Department of Education. [SDOE]. (2012). Technical guide on procedures for reviewing
and updating the 2011-2012 cohort files for the four-year graduation rates.
State Department of Education. [SDOE]. (2012). Stability rate by district, 2011-2012.
State Department of Education. [SDOE]. (2013). Stability rate by district, 2012-2013.
State Department of Education. [SDOE]. (2014). Stability rate by district, 2013-2014.
State Department of Education. [SDOE]. (2014). Stability rate by district/school, 2013-2014.
State Department of Education. [SDOE]. (2017). Graduation Cohort. Retrieved from
https://edstats.fldoe.org/.
State Department of Education. [SDOE]. (2017). Indictors Descriptions. Stability rate. Retrieved
from http://www.fldoe.org/accountability/data-sys/edu-info-accountability-
services/indicators-descriptions.stml.
State Education Association [SEA] (2016). Community schools. 2016 Florida Legislative
Session.
Strategic Management of Human Capital (SMHC) (2008). Taking human capital seriously.
Madison, WI: Strategic Management of Human Capital. Retrieved from www.smhc-
cpre.org/resources
227
Swerdlik, M.E., Reeder, G.D., & Bucy, J.E. (1999). Full-service schools: A partnership between
educators and professionals in medicine, mental health, and social services. NASSP
Bulletin, 83(611), 72-79.
Temple, J., & Reynolds, A.J. (2000). School mobility and achievement: Longitudinal findings
from an urban cohort. Journal of School Psychology, 37, 355-377.
Thomas, A.J., Carey, D., Prewitt, K., Romero, E., Richards, M., & Friedrich-Velsor, B. (2012).
African-American youth and exposure to community violence: Supporting change from
the inside. Journal for Social Action in Counseling and Psychology, 4(1).
Tinkler, B. (2002). A review of literature on Hispanic/Latino parent involvement in K-12
education. Retrieved from
http://www.huildassest.org/products/latinnoparentreport/latinoparetrept.htm.
U.S. Department of Education [USDOE]. (2016). Chronic absenteeism in the nation’s schools.
Retrieved from https://www2.ed.gov/datastory/chronicabsenteeism.html
U.S. Department of Education [USDOE]. (2011). History of the federal TRIO programs.
Retrieved from http://www2.ed.gov/about/offices/list/ope/trio/triohistory.html.
U.S. Department of Education [USDOE]. (2007). Mobilizing for evidence-based character
education. Retrieved from http://www2.ed.gov/programs/charactered/mobilizing.pdf
U.S. Department of Education [USDOE]. (2015). Full-service community schools program.
Retrieved from http://www2.ed.gov/programs/communityschools/index.html
U.S. Department of Education Office for Civil Rights (2014). Civil rights data collection, data
snapshot: School discipline for 2011-2012. Issue Brief, No. 1. Retrieved from
http://www.ocrdata.ed.gov.
228
U.S. Department of Education. [USDOE]. (2011). More Than 40% of low-income schools don't
get a fair share of state and local funds, Department of Education Research Finds.
Retrieved from http://www.ed.gov/news/press-releases/more-40-low-income-schools-
dont-get-fair-share-state-and-local-funds-department-education-research-finds.
U.S. Department of Education. (2016). School improvement grants. Program description.
Retrieved from https://www2.ed.gov/programs/sif/index.html
U.S. Department of Education, National Center for Education Statistics. (2016). The condition of
education 2016 (NCES 2016-144), Status Dropout Rates.
U.S. Department of the Treasury. (2007). Strategy for assuring financial empowerment.
Washington, D.C.
Vandell, D.L. & Shumow, L. (1999). After-school child care programs. The Future of Children,
9(2), 64-80.
Vega, D., Moore, J.L., & Miranda, A.H. (2015). Who really cares? Urban youth’s perceptions of
parental and programmatic support. School Community Journal, 25(1).
Vollmer, J. (2010). Schools cannot do it alone: Building public support for America’s public
schools. First Enlightenment Press. Fairfield, Iowa.
Warren, C. & Lessner, S. (2014). Who has family business? Exploring the role of empathy in
student-teacher interactions. Perspectives on Urban Education, 11(2).
Warren, M.R. (2005). Communities and schools: A new view of urban education reform.
Harvard Education Review, 75(2).
229
Watson, G.L., Sanders-Lawson, R.E., & McNeal, L. (2012). Understanding parental involvement
in American public education. International Journal of Humanities and Social Science,
2(19).
Wu, Y.L. (2016). Applying culturally responsive pedagogy to the vocational training of
immigrants. Journal of Education and Training Studies, 4(2).
Yatsko, S., Lake, R., Nelson, E., & Bowen, M. (2012). Tinkering toward transformation: A look
at Federal school improvement grant implementation. Center on Reinventing Public
Education University of Washington. Seattle, Washington.
Youth Development Institute (2016). Our approach. Retrieved from
http://www.ydinstitute.org/approach/
Youth Guidance. (2016). About B.A.M. Retrieved from https://www.youth-guidance.org/bam/#
Yull, D., Blitz, L.V., Thompson, T., & Murray, C. (2014). Can we talk? Using community-based
participatory action research to build family and school partnerships with families of
color. School Community Journal, 24(2).
Zaba, J. (2011). Children’s vision care in the 21st Century and its impact on education, literacy,
social issues, and the workplace: A call to action. Journal of Behavioral Optometry,
22(2), 39-41.
Zehr, H. (2002). The little book of restorative justice. Intercourse, PA: Good Books.