A Comparative Study of Credit Risk in Different Companies ...hrmars.com/admin/pics/581.pdf ·...
12
www.hrmars.com/journals 615 International Journal of Academic Research in Business and Social Sciences Volume 2, Issue 1 (2012) ISSN: 2222-6990 A Comparative Study of Credit Risk in Different Companies of Different Sectors in Pakistan Mahboob SHAH Institute of Management Sciences Kohat University of Science & technology Kohat, KPK, Pakistan Hafiz ULLAH Institute of Management Sciences Kohat University of Science & technology Kohat, KPK, Pakistan [email protected] Sana KHALID Institute of Management Sciences Kohat University of Science & technology Kohat, KPK, Pakistan ABSTRACT The corporate data used in this portion is taken from annual report of different companies in their respected sector. The data taken was of three year, from 2008-2010 of different company from seven different sectors, namely Textile, Cement, Fertilizer, Refinery, Chemical, Automobile and Electrical and Mechanical. After using data in the company annual report we have find different ratio which clearly indicate a company weak and strong point. The different ratio used in this analysis is return on asset ratio, quick ratio, current liabilities to total liabilities, and Total liabilities to total assets, total debt to total assets and interest coverage ratio. In corporate stress we find new interest coverage ratio after a supposed increase of 4% in interest expense, and in earning shock new interest coverage ratio by a supposed decrease of 25% in earning. In bank stress we find the effect of textile and cement sector on bank capital, NPLs, Provision and then find capital adequacy ratio, non performing loan ratio and return on asset ratio of bank and its increase decrease, if the sector are unable to pay its loan. KEY WORDS Credit Risk, Non Performing Loans, Earnings, Interest Rate JEL CODES E51, G24 1. Introduction Risk is the potential that a chosen action or activity (including the choice of inaction) will lead to a loss (an undesirable outcome). The notion implies that a choice having an influence on the outcome exists (or existed). Potential losses themselves may also be called "risks". Almost any human Endeavour carries some risk, but some are much more risky than others. For any bank the major risk is of its credit operations. The credit risk means the risk of loss of principal or loss of financial reward stemming from a borrower ’s failure or otherwise meets contractual obligations. Credit risk arises whenever a borrower is expecting to use future cash flows to pay a current debt. Investors are compensated for assuming credit risk by way of interest payments from the borrower or issuer of a debt obligation.
Transcript of A Comparative Study of Credit Risk in Different Companies ...hrmars.com/admin/pics/581.pdf ·...

www.hrmars.com/journals 615
International Journal of Academic Research in Business and Social Sciences Volume 2, Issue 1 (2012)
ISSN: 2222-6990
A Comparative Study of Credit Risk in Different Companies of Different Sectors in Pakistan
Mahboob SHAH Institute of Management Sciences Kohat University of Science & technology
Kohat, KPK, Pakistan
Hafiz ULLAH Institute of Management Sciences Kohat University of Science & technology
Kohat, KPK, Pakistan [email protected]
Sana KHALID Institute of Management Sciences Kohat University of Science & technology
Kohat, KPK, Pakistan
ABSTRACT The corporate data used in this portion is taken from annual report of different companies in their respected sector. The data taken was of three year, from 2008-2010 of different company from seven different sectors, namely Textile, Cement, Fertilizer, Refinery, Chemical, Automobile and Electrical and Mechanical. After using data in the company annual report we have find different ratio which clearly indicate a company weak and strong point. The different ratio used in this analysis is return on asset ratio, quick ratio, current liabilities to total liabilities, and Total liabilities to total assets, total debt to total assets and interest coverage ratio. In corporate stress we find new interest coverage ratio after a supposed increase of 4% in interest expense, and in earning shock new interest coverage ratio by a supposed decrease of 25% in earning. In bank stress we find the effect of textile and cement sector on bank capital, NPLs, Provision and then find capital adequacy ratio, non performing loan ratio and return on asset ratio of bank and its increase decrease, if the sector are unable to pay its loan.
KEY WORDS Credit Risk, Non Performing Loans, Earnings, Interest Rate
JEL CODES E51, G24
1. Introduction
Risk is the potential that a chosen action or activity (including the choice of inaction) will lead to a loss (an undesirable outcome). The notion implies that a choice having an influence on the outcome exists (or existed). Potential losses themselves may also be called "risks". Almost any human Endeavour carries some risk, but some are much more risky than others.
For any bank the major risk is of its credit operations. The credit risk means the risk of loss of principal or loss of financial reward stemming from a borrower’s failure or otherwise meets contractual obligations. Credit risk arises whenever a borrower is expecting to use future cash flows to pay a current debt. Investors are compensated for assuming credit risk by way of interest payments from the borrower or issuer of a debt obligation.

www.hrmars.com/journals 616
International Journal of Academic Research in Business and Social Sciences Volume 2, Issue 1 (2012)
ISSN: 2222-6990
In a bank’s portfolio, losses stem from outright default due to inability or unwillingness of a customer or counter party to meet commitments in relation to lending, trading, settlement and other financial transactions. Alternatively losses may result from reduction in portfolio value due to actual or perceived deterioration in credit quality. Credit risk emanates from a bank’s dealing with individuals, corporate, financial institutions or a sovereign. For most banks loans are the largest and most obvious source of credit risk; however, credit risk could stem from activities both on and off balance sheet.
Credit risk factors include various factors which may affect the ability of borrowers to repay loans in full as well as factors which affect the Bank’s ability to resolve non-performing loans. As a result of these factors, actual losses incurred toward the end of the problem debt recovery process may also affect the Bank’s capital adequacy.
Significant credit risk factors are as follows: 1. Non-performing loans; 2. Economic growth; 3. Sensitivity of the entertainment and tourism-related businesses; 4: Sensitivity of export businesses. The major and important part of our project is analysis of annual reports of different sectors.
Credit risk since arise from real sector for that we have taken the annual reports of different organizations which are enlisted in Karachi stock exchange and evaluate their performance by putting shocks on their interest expenses and their earnings, and analyzed the effects on a bank’s position in case of any default. What are the effects of it on banks equity and ROA.
In last we have given certain suggestions and recommendation about credit risk. Hope this report will be beneficial and helpful in an effective decision making.
2. Literature review
2.1. Credit risk
Credit risk is an investor's risk of loss arising from a borrower who does not make payments as promised. Such an event is called a default. Another term for credit risk is default risk.
Investor losses include lost principal and interest, decreased cash flow, and increased collection costs, which arise in a number of circumstances:
A consumer does not make a payment due on a mortgage loan, credit card, line of credit, or other loan;
A business does not make a payment due on a mortgage, credit card, line of credit, or other loan;
A business or consumer does not pay a trade invoice when due;
A business does not pay an employee's earned wages when due;
A business or government bond issuer does not make a payment on a coupon or principal payment when due;
An insolvent insurance company does not pay a policy obligation;
An insolvent bank won't return funds to a depositor;
A government grants bankruptcy protection to an insolvent consumer or business. While financial institutions have faced difficulties over the years for a multitude of reasons,
the major cause of serious banking problems continues to be directly related to lax credit standards for borrowers and counterparties, poor portfolio risk management, or a lack of attention to changes in economic or other circumstances that can lead to a deterioration in the credit standing of a bank's counterparties.

www.hrmars.com/journals 617
International Journal of Academic Research in Business and Social Sciences Volume 2, Issue 1 (2012)
ISSN: 2222-6990
Credit risk is most simply defined as the potential that a bank borrower or counterparty will fail to meet its obligations in accordance with agreed terms. The goal of credit risk management is to maximize a bank's risk-adjusted rate of return by maintaining credit risk exposure within acceptable parameters. Banks need to manage the credit risk inherent in the entire portfolio as well as the risk in individual credits or transactions. Banks should also consider the relationships between credit risk and other risks. The effective management of credit risk is a critical component of a comprehensive approach to risk management and essential to the long-term success of any banking organization.
For most banks, loans are the largest and most obvious source of credit risk; however, other sources of credit risk exist throughout the activities of a bank, including in the banking book and in the trading book, and both on and off the balance sheet. Banks are increasingly facing credit risk (or counterparty risk) in various financial instruments other than loans, including acceptances, interbank transactions, trade financing, foreign exchange transactions, financial futures, swaps, bonds, equities, options, and in the extension of commitments and guarantees, and the settlement of transactions.
Since exposure to credit risk continues to be the leading source of problems in banks world-wide, banks and their supervisors should be able to draw useful lessons from past experiences. Banks should now have a keen awareness of the need to identify, measure, monitor and control credit risk as well as to determine that they hold adequate capital against these risks and that they are adequately compensated for risks incurred. The Basel Committee is issuing this document in order to encourage banking supervisors globally to promote sound practices for managing credit risk. Although the principles contained in this paper are most clearly applicable to the business of lending, they should be applied to all activities where credit risk is present.
In a bank’s portfolio, losses stem from outright default due to inability or unwillingness of a customer or counter party to meet commitments in relation to lending, trading, settlement and other financial transactions. Alternatively losses may result from reduction in portfolio value due to actual or perceived deterioration in credit quality. Credit risk emanates from a bank’s dealing with individuals, corporate, financial institutions or a sovereign. For most banks, loans are the largest and most obvious source of credit risk; however, credit risk could stem from activities both on and off balance sheet:
In addition to direct accounting loss, credit risk should be viewed in the context of economic exposures.
This encompasses opportunity costs, transaction costs and expenses associated with a non -performing asset over and above the accounting loss.
Credit risk can be further sub-categorized on the basis of reasons of default.
For instance the default could be due to country in which there is exposure or problems in settlement of a transaction.
Credit risk not necessarily occurs in isolation. The same source that endangers credit risk for the institution may also expose it to other risk. For instance a bad portfolio may attract liquidity problem.

www.hrmars.com/journals 618
International Journal of Academic Research in Business and Social Sciences Volume 2, Issue 1 (2012)
ISSN: 2222-6990
2.2. Credit risk factors
Credit risk factors include various factors which may affect the ability of borrowers to repay loans in full as well as factors which affect the Bank’s ability to resolve non-performing loans. As a result of these factors, actual losses incurred toward the end of the problem debt recovery process may also affect the Bank’s capital adequacy.
Significant credit risk factors are as follows:
Non-performing loans;
Economic growth;
Sensitivity of the entertainment and tourism-related businesses;
Sensitivity of export businesses. 2.3. Profitability Ratio
Profitability ratios are used to assess a business' ability to generate earnings as compared to expenses over a specified time period. Profitability ratios are measures that indicate how well a firm is performing in terms of its ability to generate profit.
Some examples of profitability ratios are profit margin, return on assets and return on equity. It is important to note that a little bit of background knowledge is necessary in order to make relevant comparisons when analyzing these ratios.
For instances, some industries experience seasonality in their operations. The retail industry, for example, typically experiences higher revenues and earnings for the Christmas season. Therefore, it would not be too useful to compare a retailer's fourth-quarter profit margin with its first-quarter profit margin. On the other hand, comparing a retailer's fourth-quarter profit margin with the profit margin from the same period a year before would be far more informative.
2.4. Return on Assets
The Return on Assets of a company determines its ability to utilize the Assets employed in the company efficiently and effectively to earn a good return. The ratio measures the percentage of profits earned per dollar of Asset and thus is a measure of efficiency of the company in generating profits on its Assets. The formula:
assetsTotalprofitNet
assetsonReturn (1)
2.5. Liquidity Ratio
Liquidity ratio, expresses a company's ability to repay short-term creditors out of its total cash. The liquidity ratio is the result of dividing the total cash by short-term borrowings. It shows the number of times short-term liabilities are covered by cash. If the value is greater than 1.00, it means fully covered.
Common liquidity ratios include the current ratio, the quick ratio and the operating cash flow ratio. Different analysts consider different assets to be relevant in calculating liquidity. Some analysts will calculate only the sum of cash and equivalents divided by current liabilities because they feel that they are the most liquid assets, and would be the most likely to be used to cover short-term debts in an emergency.
A company's ability to turn short-term assets into cash to cover debts is of the utmost importance when creditors are seeking payment. Bankruptcy analysts and mortgage originators

www.hrmars.com/journals 619
International Journal of Academic Research in Business and Social Sciences Volume 2, Issue 1 (2012)
ISSN: 2222-6990
frequently use the liquidity ratios to determine whether a company will be able to continue as a going concern.
2.6. Explanation of Quick Ratio
Also called the Acid-Test Ratio, the current ratio compares all the Total Current Assets of a company to all the Total Current Liabilities just like the Current Ratio, but the Inventories are subtracted from the Current Assets. Why? Not every company can quickly convert its Inventories into cash in the event it had to pay all its Current Liabilities. Therefore, the Quick Ratio is a tougher way to test the company's ability to meet its current debt load. You can make the test even tougher by also subtracting off the Accounts Receivable and prepaid expenses. This will pretty much leave only the truly current and liquidable assets.
If a company you are analyzing looks good while testing it against the Current Ratio, then the Quick Ratio should be your next test to apply. Companies with steadily rising Inventories may look good with the Current Ratio, but will have a deteriorating effect on the Quick Ratio, since we subtract the Inventories out. The Quick Ratio rising over time is favorable. Formula:
sLiabi l i tieCurrentTotals)Inventorie-AssetsCurrent(Total
RQuick atio (2)
2.7. Leverage Ratio
Any ratio used to calculate the financial leverage of a company to get an idea of the company's methods of financing or to measure its ability to meet financial obligations. There are several different ratios, but the main factors looked at include debt, equity, assets and interest expenses.
A ratio used to measure a company's mix of operating costs, giving an idea of how changes in output will affect operating income. Fixed and variable costs are the two types of operating costs; depending on the company and the industry, the mix will differ.
Companies with high fixed costs, after reaching the breakeven point, see a greater increase in operating revenue when output is increased compared to companies with high variable costs. The reason for this is that the costs have already been incurred, so every sale after the breakeven transfers to the operating income. On the other hand, a high variable cost company sees little increase in operating income with additional output, because costs continue to be imputed into the outputs. The degree of operating leverage is the ratio used to calculate this mix and its effects on operating income.
2.8. Interest Coverage Ratio
A ratio used to determine how easily a company can pay interest on outstanding debt. The interest coverage ratio is calculated by dividing a company's earnings before interest and taxes (EBIT) of one period by the company's interest expenses of the same period. Formula:
ExpenseInterestEBIT
ratiocoverageInterest (3)
The lower the ratio, the more the company is burdened by debt expense. When a company's
interest coverage ratio is 1.5 or lower, its ability to meet interest expenses may be questionable.

www.hrmars.com/journals 620
International Journal of Academic Research in Business and Social Sciences Volume 2, Issue 1 (2012)
ISSN: 2222-6990
An interest coverage ratio below 1 indicates the company is not generating sufficient revenues to satisfy interest expenses.
2.9. Total Debt to Total Assets
A metric used to measure a company's financial risk by determining how much of the company's assets have been financed by debt. Calculated by adding short-term and long-term debt and then dividing by the company's total assets. Formula:
assetsTotaldebt)thermLongdebttherm(Short
ratioassetstoDebt
(4)
2.10. Current to Total Liabilities
The Current to Total Liabilities ratio measures the percentage of Total Current Liabilities to Total Liabilities, a useful measurement when reviewing a company's debt structure.
An increasing Current to Total Liabilities ratio is usually a negative sign, showing the company's proportion of Total Current Liabilities are increasing compared to its Total Liabilities. This ratio may vary by industry, but you also need to compare several companies in the same industry to get an understanding of the typical ratio value, and how different this ratio value can be between companies. Although an industry average for this ratio may exist, some companies in the same industry operate well with more Current Liabilities than others - a sign that this ratio is not the only means of reviewing a company's debt structure. Formula:
sl iabi l i tieTotalsl iabi l i tiecurrentTotal
sl iabi l i tietotaltoCurrent (5)
3. Research design
The corporate data used in this portion is taken from annual report of different companies in their respected sector. The data taken was of three year, from 2008-2010 of different company from seven different sectors, namely Textile, Cement, Fertilizer, Refinery, Chemical, Automobile and Electrical and Mechanical. After using data in the company annual report we have find different ratio which clearly indicate a company weak and strong point. The different ratio used in this analysis is return on asset ratio, quick ratio, current liabilities to total liabilities, and Total liabilities to total assets, total debt to total assets and interest coverage ratio.
In corporate stress we find new interest coverage ratio after a supposed increase of 4% in interest expense, and in earning shock new interest coverage ratio by a supposed decrease of 25% in earning.
In bank stress we find the effect of textile and cement sector on bank capital, NPLs, Provision and then find capital adequacy ratio, non performing loan ratio and return on asset ratio of bank and its increase decrease, if the sector are unable to pay its loan.

www.hrmars.com/journals 621
International Journal of Academic Research in Business and Social Sciences Volume 2, Issue 1 (2012)
ISSN: 2222-6990
4. Analysis and Interpretation
4.1. Altman Z-Score A predictive model created by Edward Altman in the 1960s. This model combines five
different financial ratios to determine the likelihood of bankruptcy amongst companies. Generally speaking, the lower the score, the higher the odds of bankruptcy. Companies with
Z-Scores above 3 are considered to be healthy and, therefore, unlikely to enter bankruptcy. Scores in between 1.8 and 3 lie in a grey area.
The formula may be used to predict the probability that a firm will go into bankruptcy within two years. Z-scores are used to predict corporate defaults and an easy-to-calculate control measure for the financial distress status of companies in academic studies. The Z-score uses multiple corporate income and balance sheet values to measure the financial health of a company.
The Z-score is a linear combination of four or five common business ratios, weighted by coefficients. The coefficients were estimated by identifying a set of firms which had declared bankruptcy and then collecting a matched sample of firms which had survived, with matching by industry and approximate size (assets).
Altman applied the statistical method of discriminate analysis to a dataset of publicly held manufacturers. The estimation was originally based on data from publicly held manufacturers, but has since been re-estimated based on other datasets for private manufacturing, non-manufacturing and service companies.
The original Z-score formula was as follows1: Z = 0.012T1 + 0.014T2 + 0.033T3 + 0.006T4 + 0.999T5 (6)
assetsTotalCapitalWorking
1T (7)
Measures liquid assets in relation to size of the company.
assetsTotalEarningsRetained
2T (8)
Measures profitability that reflects the company's age and earning power.
assetsTotalTaxesandinterestbeforeEarnings
3T (9)
Measures operating efficiency apart from tax and leveraging factors. It recognizes operating earnings as being important to long-term viability.
sLiabi l i tietotalof valueBookEquityof ValueMarket
4T (10)
Adds market dimension that can show up security price fluctuation as a possible red flag.
assetsTotalSales
5T (11)
Standard measure for total asset turnover (varies greatly from industry to industry). Altman found that the ratio profile for the bankrupt group fell at -0.25 avg, and for the non-
bankrupt group at +4.48 avg.
1 (Retrieved from http://en.wikipedia.org/wiki/Altman_Z-score, dated 07 august, 2011).
www.hrmars.com/journals 622
International Journal of Academic Research in Business and Social Sciences Volume 2, Issue 1 (2012)
ISSN: 2222-6990
Formula:
assetsTotal
earningsRetained
ratioQuicksl iabi l i tieTotal
valuestockTotal
assetsTotal
salesNetassetsTotal
earningsNetscore-zAltman
(12)
4.2. Shocks to Corporate Vulnerability
In this section we use corporate data to evaluate the impact of shocks on corporate ability to repay debt. The matrix of interest coverage ratio is used to see the impact on corporate vulnerability of shocks to corporate sector.
4.3. Interest Rate Shock
Here we investigate possible scenarios for interest rate shocks: increase in interest rates by 4%.this shock would directly affect corporate ability to repay their debts, and be reflected in the proportion of firms with interest coverage ratio below threshold level.
To evaluate the impact of shock the following procedure is adopted.
Calculate current imputed interest rate by dividing reported interest expense over estimated total debt.
Assume an increase in the imputed interest rate of 4%.
Recalculate new interest payment assuming increased interest rate (i.e. new interest payments equals new interest rate times total debt).
Recalculate new interest coverage ratio using new interest expense.
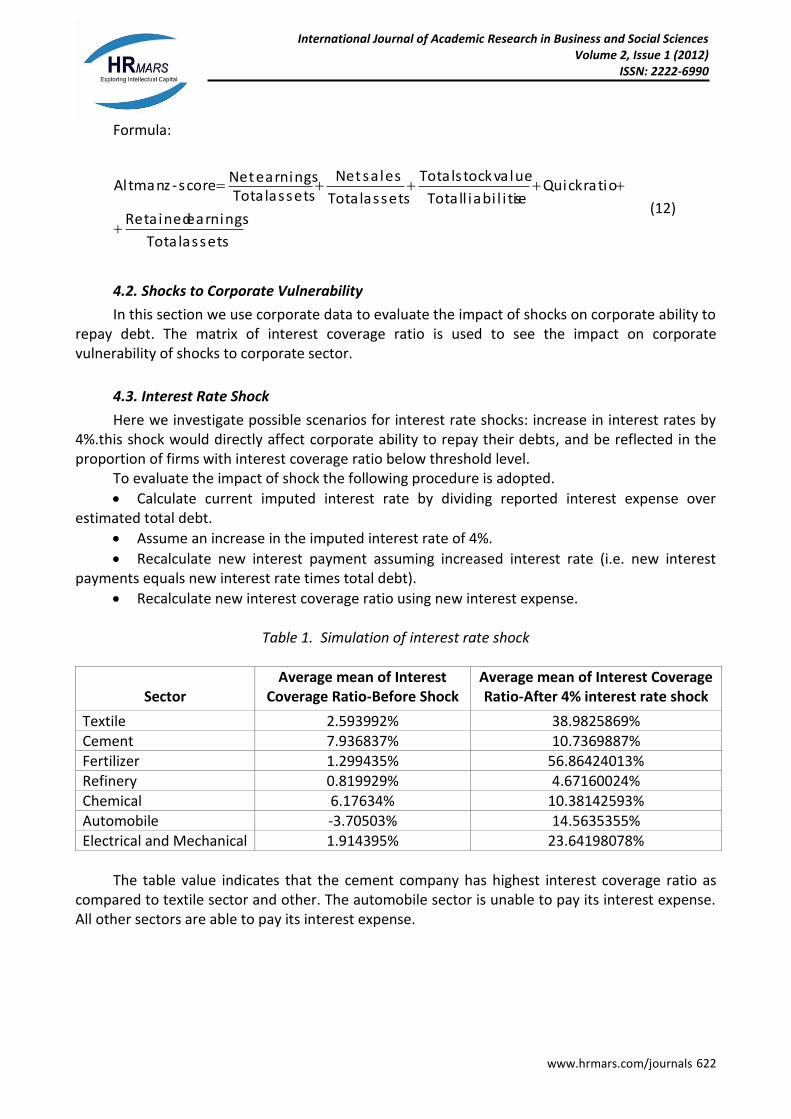
Table 1. Simulation of interest rate shock
Sector
Average mean of Interest Coverage Ratio-Before Shock
Average mean of Interest Coverage Ratio-After 4% interest rate shock
Textile 2.593992% 38.9825869% Cement 7.936837% 10.7369887% Fertilizer 1.299435% 56.86424013% Refinery 0.819929% 4.67160024% Chemical 6.17634% 10.38142593% Automobile -3.70503% 14.5635355% Electrical and Mechanical 1.914395% 23.64198078%
The table value indicates that the cement company has highest interest coverage ratio as
compared to textile sector and other. The automobile sector is unable to pay its interest expense. All other sectors are able to pay its interest expense.

www.hrmars.com/journals 623
International Journal of Academic Research in Business and Social Sciences Volume 2, Issue 1 (2012)
ISSN: 2222-6990
4.4. Shocks to Earnings
In addition to stressing the interest payment, corporate data allows for simulations and stress test of shocks to corporate earnings. The EBIT is the key ingredient in the calculation of interest coverage. Shocks to corporate earnings will be directly reflected in corporate ability to repay their debts.
We will develop scenarios for earning stress test: which is a decrease in earnings by 25%.the procedure for stressing the earning is as follows:
Assume a decrease in current EBIT of 25%.
Recalculate new interest coverage ratio using new EBIT with old interest expense.
Compare new interest coverage ratio for shocks scenarios of decreased earnings to old one.
Table 2. Simulation of Earnings shock
Sector
Interest Coverage ratio-Before Shock
Interest Coverage ratio-After Earning Shock
Textile 2.399538% 1.799654%
Cement 7.936837% 6.011121%
Fertilizer 1.299435% 0.974576%
Refinery 0.819929% 0.614947%
Chemical 0.484646% 0.363484%
Automobile -3.70503% -2.77877%
Electrical and mechanical 1.914395% 1.435796%
The table value indicates that with the decrease in earnings by 25%, the firm ability to pay
interest decrease. The table shows that interest coverage ratio of Textile sector is 1.7%, which indicate that this sector is able to pay its interest expense with a decrease of 25% in earning, because the value is greater than 1. The Cement sector has 6.01%; the cement sector can pay their interest expense with a decrease of 25% in earning, as the value is greater than 1. The Fertilizer sector has .97%, the Refinery sector has .61%, Chemical sector has .36%, Electrical and Mechanical sector has 1.43% Automobile sector has -2.77%. This indicate that fertilizer is unable to pay interest expense, refinery sector unable to pay its interest expense if earning decrease by 25%, chemical sector are unable to pay its interest expense, electrical and mechanical sector is able to pay and automobile is unable to pay its interest expense if earning decrease by 25%.
5. Conclusions
The result of the corporate stress tests suggests that both earning and interest rate have significant impacts on corporate vulnerability. The result of test shows that the Automobile sector will be negatively affected by shocks to interest rate or earnings. This stress test highlights the importance of assessment of corporate vulnerability and including it in bank stress test.
Bank Stress Test In bank stress test we analyze the effect of different corporate sector if they are unable to
pay its loan on different component of bank and the effects on it if the corporate sectors are unable to pay its full loan.
www.hrmars.com/journals 624
International Journal of Academic Research in Business and Social Sciences Volume 2, Issue 1 (2012)
ISSN: 2222-6990
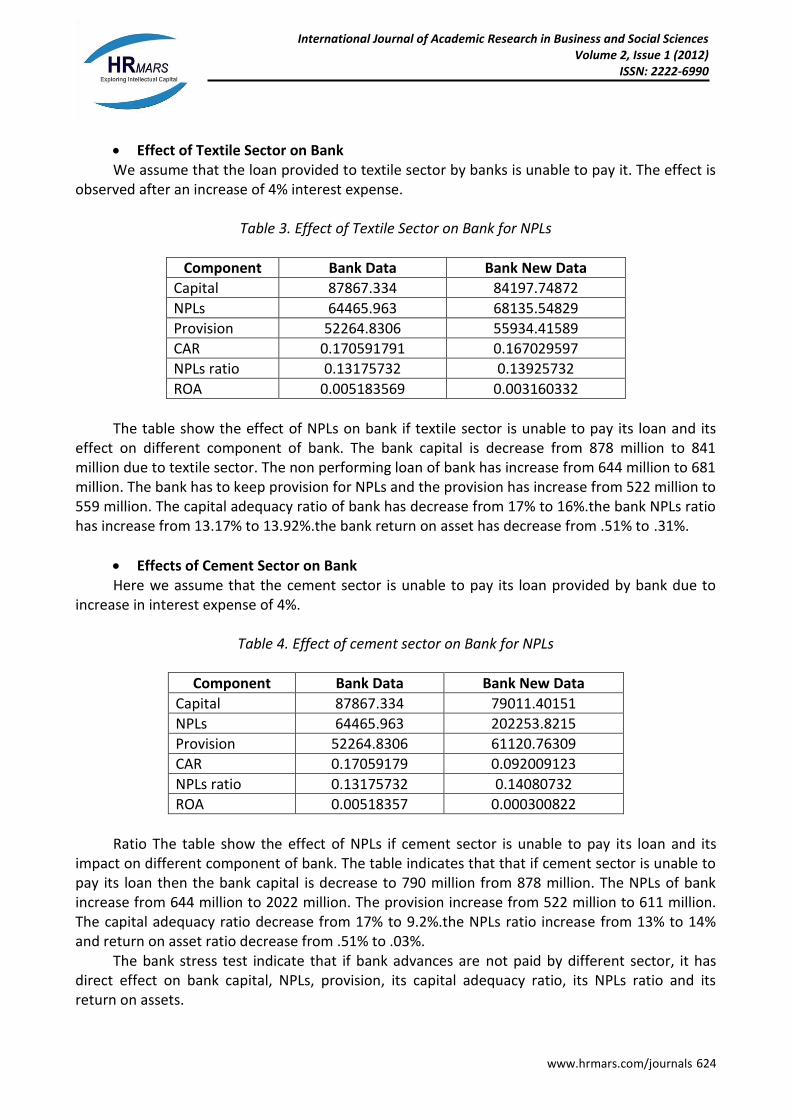
Effect of Textile Sector on Bank We assume that the loan provided to textile sector by banks is unable to pay it. The effect is
observed after an increase of 4% interest expense.
Table 3. Effect of Textile Sector on Bank for NPLs
Component Bank Data Bank New Data
Capital 87867.334 84197.74872
NPLs 64465.963 68135.54829
Provision 52264.8306 55934.41589
CAR 0.170591791 0.167029597
NPLs ratio 0.13175732 0.13925732
ROA 0.005183569 0.003160332
The table show the effect of NPLs on bank if textile sector is unable to pay its loan and its
effect on different component of bank. The bank capital is decrease from 878 million to 841 million due to textile sector. The non performing loan of bank has increase from 644 million to 681 million. The bank has to keep provision for NPLs and the provision has increase from 522 million to 559 million. The capital adequacy ratio of bank has decrease from 17% to 16%.the bank NPLs ratio has increase from 13.17% to 13.92%.the bank return on asset has decrease from .51% to .31%.
Effects of Cement Sector on Bank Here we assume that the cement sector is unable to pay its loan provided by bank due to
increase in interest expense of 4%.
Table 4. Effect of cement sector on Bank for NPLs
Component Bank Data Bank New Data
Capital 87867.334 79011.40151
NPLs 64465.963 202253.8215
Provision 52264.8306 61120.76309
CAR 0.17059179 0.092009123
NPLs ratio 0.13175732 0.14080732
ROA 0.00518357 0.000300822
Ratio The table show the effect of NPLs if cement sector is unable to pay its loan and its
impact on different component of bank. The table indicates that that if cement sector is unable to pay its loan then the bank capital is decrease to 790 million from 878 million. The NPLs of bank increase from 644 million to 2022 million. The provision increase from 522 million to 611 million. The capital adequacy ratio decrease from 17% to 9.2%.the NPLs ratio increase from 13% to 14% and return on asset ratio decrease from .51% to .03%.
The bank stress test indicate that if bank advances are not paid by different sector, it has direct effect on bank capital, NPLs, provision, its capital adequacy ratio, its NPLs ratio and its return on assets.

www.hrmars.com/journals 625
International Journal of Academic Research in Business and Social Sciences Volume 2, Issue 1 (2012)
ISSN: 2222-6990
6. Recommendation
The analysis of different sectors reports shows that the textile sector have negative impact on banks because of production factors like loss of cotton fields in flood .Recession, flood and electricity crisis effected it dangerously. So the government must have to take steps to boost this sector. The automobile sector has a production of 14.6% high then the last year which shows favorable demand condition in country. The bulk of sales were transacted on cash basis as bank financing remained marginal. Cement sector also have a profit of 674million in fy11 as compared to loss of 1.4billion last year. in overall terms, the industry’s sales declined by 7.1 percent YoY in Q3-FY11, and 8.7 percent YoY in Jul-May 2011. An increase in special excise duty (SED) from 1 percent to 2.5 percent in mid-March also added to the price. However, in the FY12 Budget, a complete withdrawal of SED and reduction in FED has been proposed.
FY11 proved to be another difficult year for Pakistan’s economy. Against the target of 4.5 percent, the country could post a growth of 2.4 percent – this was even weaker than the 3.9 percent achieved in FY10.
A slowdown in growth was anticipated since the country had suffered severe losses due to the devastation caused by the unprecedented floods in August 2010. In addition to major kharif crops, the allied industries, trading services, and export sectors were adversely affected. Furthermore, logistics, power infrastructure, and many industrial units were also damaged.
Unfavorable real economic condition suggests that the financial sector have to be robust enough to sustain these shocks and should limit the further contagion effect. For this the banks have to:
Diversify the loan port folio;
The financial performance of company/sector/industry should be properly evaluated before credit extension;
Due to increase in NPLs banks has to keep provision from its earning, which affects banking sector profit.

www.hrmars.com/journals 626
International Journal of Academic Research in Business and Social Sciences Volume 2, Issue 1 (2012)
ISSN: 2222-6990
References 1. Annual Reports Retrieved From, http://Www.Sbp.Org.Pk/Reports/Annual/Index.Htm , Dated 10th July
2011. 2. Attack Refinery, Retrieved From http://Www.Pacra.Com/Pressrel/Atrl_DGP12.Pdf, Dated 11th July
2011. 3. Best way, retrieved from, http://www.Pacra.Com/Pressrel/Best_DGP12.Pdf, Dated 10th August 2011. 4. Descon Chemicals, Retrieved From http://www.Pacra.Com/Pressrel/Dec_DGP12.Pdf, Dated 17th July
2011. 5. Dera Ghazi khan Cement, Retrieved From, http://www.Pacra.Com/Pressrel/Dgkc_DGP12.Pdf, Dated
01st August 2011. 6. Emco industries, Retrieved From, http://www.Pacra.Com/Pressrel/Emco_DGP12.Pdf, Dated 21st July
2011. 7. Engro, Retrieved From, http://www.Pacra.Com/Pressrel/Engro_DGP12.Pdf, Dated 3rd August 2011. 8. Financial Ratio, Retrieved From http://En.Wikipedia.Org/Wiki/Financial_Ratio, Dated 1st August
2011. 9. Google Search Engine, Retrieved From, www.google.com, Dated 7th August 2011. 10. Karachi Stock Exchange, Retrieved From Www.Kse.Com.Pk/Annual Reports, Dated 1st August
2011. 11. Mamma, retrieved from http://www.Mamma.Com/, Dated 8th August 2011. 12. Tribune, Retrieved from http://Tribune.Com.Pk/Business/, Dated 27th July 2011. 13. Saphire Textile Mills lit. Retrieved from, http://www.Pacra.Com/Pressrel/Sphire_DGP12.Pdf, Dated 1st
August 2011. 14. Scribed, Retrieved From www.Scribed.Com, Dated 4th August 2011. 15. Pakistan Credit Rating Agency, Retrieved From http://www.Pacra.Com/Pressrel/Anl_DGP12.Pdf,
Dated 4th August 2011. 16. State Bank of Pakistan Publications, Retrieved from http://Www.Sbp.Org.Pk/Publications/
C_Rating/Ratehist.Htm , Dated 7th August 2011.