A COMPARATIVE ANALYSIS OF THE IMPACT OF INVENTORY ...
102
1 A COMPARATIVE ANALYSIS OF THE IMPACT OF INVENTORY VALUATION METHODS ON FINANCIAL REPORT STATEMENT IN SOME MANUFACTURING COMPANIES IN ENUGU STATE BY MORGAN, ACCEPTANCE OKON ACC/2007/376 DEPARTMENT OF ACCOUNTANCY FACULTY OF MANAGEMENT AND SOCIAL SCIENCE CARITAS UNIVERSITY AMORJI-NIKE, ENUGU STATE AUGUST, 2012
Transcript of A COMPARATIVE ANALYSIS OF THE IMPACT OF INVENTORY ...
1
A COMPARATIVE ANALYSIS OF THE IMPACT OF INVENTORY VALUATION
METHODS ON FINANCIAL REPORT STATEMENT IN SOME MANUFACTURING
COMPANIES IN ENUGU STATE
BY
MORGAN, ACCEPTANCE OKON
ACC/2007/376
DEPARTMENT OF ACCOUNTANCY
FACULTY OF MANAGEMENT AND SOCIAL SCIENCE
CARITAS UNIVERSITY
AMORJI-NIKE, ENUGU STATE
AUGUST, 2012
2
TITLE PAGE
A COMPARATIVE ANALYSIS OF THE IMPACT OF INVENTORY VALUATION
METHODS ON FINANCIAL REPORT STATEMENT IN SOME MANUFACTURING
COMPANIES IN ENUGU STATE
BY
MORGAN ACCEPTANCE OKON
ACC/2007/376
A PROJECT SUBMITTED TO THE DEPARTMENT OF ACCOUNTANCY
FACULTY OF MANAGEMENT AND SOCIAL SCIENCE
CARITAS UNIVERSITY
AMORJI-NIKE, ENUGU STATE
IN PARTIAL FULFUILLMENT OF THE REQUIREMENTS FOR THE
AWARD OF BACHELOR OF SCIENCE (B.Sc.) DEGREE IN
ACCOUNTANCY
AUGUST, 2012.
3
APPROVAL PAGE
This is to certify that this project work titled “A comparative analysis of the impact
of inventory valuation methods on financial report statement in some
manufacturing companies in Enugu state”. Was written by ACCEPTANCE .O.
MORGAN with registration number ACC/2007/376 of the department of
Accountancy, Caritas University Amorji-Nike, Enugu State. In partial fulfillment of
the requirement for the award of a B.Sc. degree in Accountancy.
MR.OBANI DESMOND DATE
PROJECT SUPERVISOR
DR. OVUTE FRANK DATE
HEAD OF DEPARTMENT

4
EXTERNAL SUPERVISOR DATE

5
DEDICATION
This project work is dedicated to God Almighty for His immeasurable love
and faithfulness all through the course of this work and my academic pursuit.

6
ACKNOWLEDGEMENT
When kindness cannot be returned, it should be appreciated. A number of people
have helped to make this project research and writing a successful one. So their
kind deeds ought to be appreciated.
My most sincere gratitude goes to my supervisor MrObani Desmond who
took his time in the in-depth supervision of this work and who make sure that this
project came to a successful and smooth completion.
My profound gratitude also goes to my lecturers who have taught me over
the years. My HOD Dr. Frank Ovute, Mr P. Nsoke, Mr.Agu, Mr. E. Chinedu, Mr. J.
Ugwu, Prof.Nwadialor, Prof.Ihekuwaba, Mr.Ezeamama and many others whom I
did not mention. I am very grateful.
I cannot forget the immense contribution of my dear parents Engr. And Mrs
O. M. Umoren, my fiancé Emmanuel Chigeruand my siblings; Blessing, Kufre,
Juliana, Ukeme, Mboutidem, Inyene, Joseph and Miracle who worked tirelessly to
make sure my dreams were fulfilled; financially, spiritually and otherwise. Then
my most wonderful friends and course mates; Esther Ukaobasi, Ugochinyere,
Glory, PFCU family, Uche, Ngozi, Tina, Chika, Mercy, Raphael, Ifeanyi, most
especially and others, you will never be forgotten. And also my fiancé who stood
by me through all the years, above all I am grateful to God for keeping his words.
Thank you all and God bless you.
7
ABSTRACT
This research work was conducted on with special reference to the impact
inventoryvaluation methods has on financial report statements of manufacturing
companies. For a longtime now the Accounting profession has not been able to
come up with any particular technique or method to be used uniformly in valuing
inventory. This research work examined if the method used was as a result ofthe
prevailing economic circumstances. A survey research design was adopted for the
study; data collected weregotten from both the primary and secondary sources.
An infinite population of over 3000 was used and a finite population of 220. Three
hypotheses were tested at 5 percent level of significance. Tables and percentages
were employed to answer the questionnaires while the statistical regression
coefficient analysis and Z- test were used to test the hypotheses. It was found
amongst others that the prevailing economic parameter influences the decision of
choice of inventory valuation method used. The Accounting professional bodies
should try as much as possible to adopt a particular method of inventory
valuation and the weighted average method was recommended as a method that
can withstand any economic challenges

8
TABLE OF CONTENTS
TITLE PAGE…………………………………………….…………………i
APPROVAL PAGE………………………………………………………..ii
DEDICATION…………………………………………………..…………iii
ACKNOWLEDGMENTS…………………………………………….……iv
ABSTRACT………………………………………………………………...v
TABLE OF CONTENTS…………………………………………………..vi
CHAPTER ONE: INTRODUCTION
1.1 BACKGROUND OF STUDY………………………………………1
1.2 STATEMENT OF THE PROBLEM……………………………..…4
1.3 OBJECTIVES OF STUDY……………………………………….....5
1.4 RESEARCH QUESTIONS………………………………………….5
1.5 HYPOTHESES……………………………………………………...6
1.6 SIGNIFICANCE OF THE STUDY………………………………...7
1.7 SCOPE OF THE STUDY……………………………………..........8
1.8 LIMITATION OF THE STUDY.....................................................9
1.9 DEFINITION OF TERMS……………………………………..…..10
CHAPTER TWO:LITERATURE REVIEW
2.1 HISTORY PERSPECTIVE………………………………..………..13
2.2 THE PROBLEM OF INVENTORY MANAGEMENT………..…..14
2.3 INVENTORY VALUATION………………………………………..16
2.4 INVENTORY VALUATION METHODS…………………….……20
REFERENCE……….......................................................................37
9
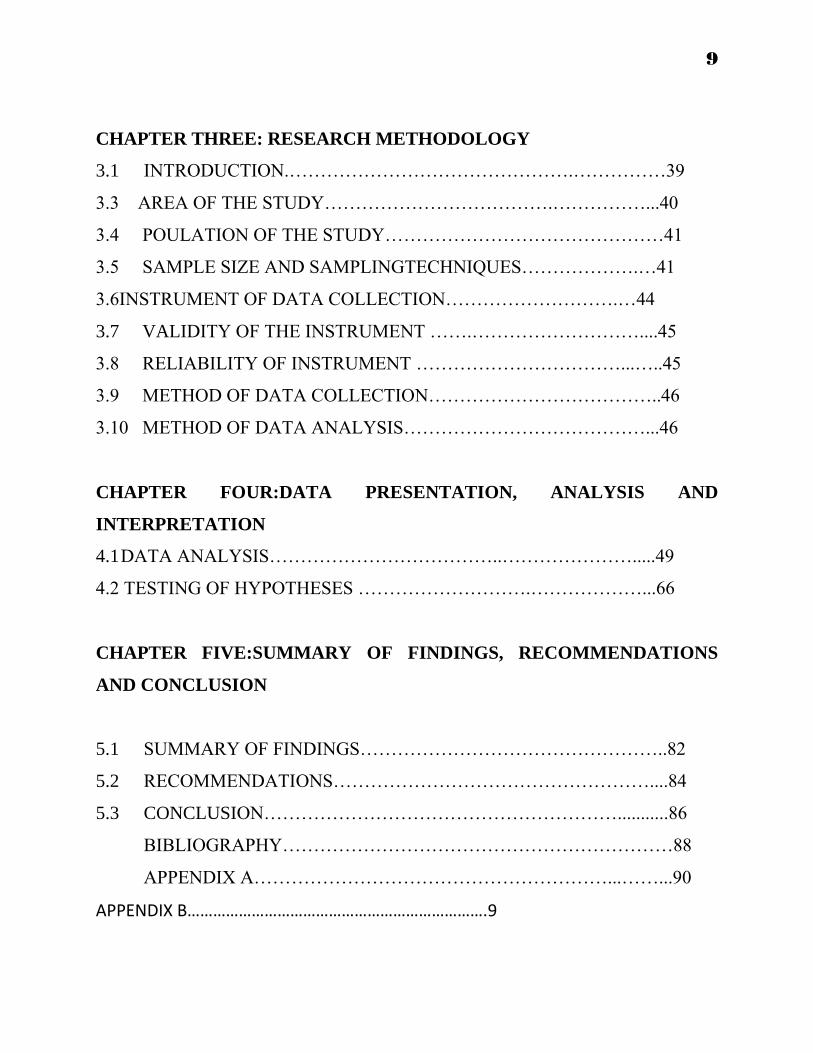
CHAPTER THREE: RESEARCH METHODOLOGY
3.1 INTRODUCTION.……………………………………….……………39
3.3 AREA OF THE STUDY……………………………….……………...40
3.4 POULATION OF THE STUDY………………………………………41
3.5 SAMPLE SIZE AND SAMPLINGTECHNIQUES……………….…41
3.6INSTRUMENT OF DATA COLLECTION……………………….…44
3.7 VALIDITY OF THE INSTRUMENT …….………………………....45
3.8 RELIABILITY OF INSTRUMENT ……………………………...…..45
3.9 METHOD OF DATA COLLECTION………………………………..46
3.10 METHOD OF DATA ANALYSIS…………………………………...46
CHAPTER FOUR:DATA PRESENTATION, ANALYSIS AND
INTERPRETATION
4.1 DATA ANALYSIS………………………………..………………….....49
4.2 TESTING OF HYPOTHESES ……………………….………………...66
CHAPTER FIVE:SUMMARY OF FINDINGS, RECOMMENDATIONS
AND CONCLUSION
5.1 SUMMARY OF FINDINGS…………………………………………..82
5.2 RECOMMENDATIONS……………………………………………....84
5.3 CONCLUSION…………………………………………………...........86
BIBLIOGRAPHY………………………………………………………88
APPENDIX A…………………………………………………...……...90
APPENDIX B…………………………………………………………….9

10
CHAPTER ONE
1.0 INTRODUCTION
1.1BACKGROUND OF THE STUDY
Inventory valuation allows companies to provide a monetary value for items
that make up their inventory (stock).
Inventories are usually the largest current asset of a business and are as
important as funds (cash). It is a form of fund tied up in assets (current assets). It‟s
proper or accurate measurement or valuation cannot be overlooked as it forms a
greater percentage of an enterprise‟s current assets in particular and a total asset in
general. For manufacturing companies, inventories usually represent
approximately 20 to 60 percent (%) of their assets. If inventory is not properly
valued, it may result that expenses and revenue may as well not be properly
matched and a company could make poor business decisions that will affect the
company‟s profit. It is essential the way assets are valued because it could be
attributable to the numerous benefits which an organization stands to gain by
keeping an accurately valued stock that meet shareholders needs, demands for
financial information and also the relevant specification of a particular
organization. However, it will be a waste of time if the record accuracy is poor.
11
Inventory in manufacturing company or concern comprises of the following
components:
Raw materials inventory
Work- in- progress (semi- finished goods) inventory
Finished goods inventory
These components show the relationship between production and sales, and
it enables an organization to offer better service to its customers at a reasonable
price.
However, the technique or method used in the valuation of inventories varies
and the values placed on inventories vary in time with the prevailing economic
parameters (inflation, deflation or static economy) and it can also be influenced by
the management policy of the organization. For instance, if the objective of an
enterprise is that of profit maximization, it may result to the use of a particular
method so as to disclose lower profit, thereby using excess fund at its disposal to
expand its operations. This type of organization may discard other methods of
valuing inventories in favour of the method that suit it objectives.
According to Nwoha (2006:69), no area of accounting has produced wider
difference in practice than the computation of amount at which inventories (stocks)
and work-in-progress as stated in financial account.

12
Inventory valuation method used by an enterprise is determined by a number
of reasons. These include inflation, differences in quantity discounts, frequent
changes in prices of commodity, buying from different suppliers and also the
nature of items or product. For instance a company that deals on perishable goods,
let‟s say a grocery store, prefers an inventory valuation method that recognizes the
out flow of goods that were first in stock. This arises as a result of the perish ability
of the items treated and the high turnover rate could also be accounted for this
choice of method FIFO (first-in, first-out). The level of the three component of the
inventory stated earlier differs among organizations depending on the nature and
volume of operation undertaken. Manufacturing companies have a high level of
raw material inventory and semi-finished goods inventory as it is found in the
grocery stores. Considering the large sums of money tied up in inventory as earlier
stated, Horngren and Foster (2004:756) pointed out that it is pertinent to have an
“information model” as a result of the obvious fact that if stock matters (receipts,
issues and controls) are not properly handled, it would go a long way to jeopardize
the financial status (liquidity) as well as the profitability position of the firm.
Hence, this research work is a step in the right direction to address and highlight
the role of account professional towards the achievement of choosing and adopting
appropriate inventory valuation methods for each group of industry.
13
1.2STATEMENT OF THE PROBLEMS
For a long time now the accounting profession has not been able to come up
with any particular techniques to be used uniformly in valuing inventories. Various
accounting bodies strongly recommend one method or the other. As each method
used has its effect on profits and closing inventory figures. This paves way to
differing tax assessments and brings about a situation whereby some organizations
are over assessed (overtaxed) while others are under assessed. This also bedevils
the comparability of one firm‟s performance with that of another though they may
be in the same line of business when an investor is attempting to invest his capital
in a firm.
However, each body or organization purports being consistent with the use
of certain valuation methods yet some companies adopt the method which gives
them advantage over any other recommended method or method accepted by the
Board of Internal Revenue, or Federal Board of Inland Revenue for tax assessment
purposes. The method adopted by the companies enables them to pay less tax to
the government. The problem in achieving a statutory consensus compliance
method in the administration of inventory valuation by Nigerian manufacturing
industry has persisted. An appropriate forum of diverse accounting professional
bodies is required to reach a consensus on the issues of choosing and adopting
appropriate inventory valuation methods for each group of industry. Hence, this
14
research work is a step in the right direction to address the role of accounting
professional towards the achievement of the objective.
1.3OBJECTIVES OF THE STUDY
The aim of this research work includes the following:
1. To determine whether inventory valuation methods have any impact on the
assessable income tax of Nigerian manufacturing company.
2. To ascertain whether the prevailing economic parameters influences the
inventory valuation method used by Nigerian manufacturing company.
3. To determine whether variances in inventory valuation methods affect
financial reporting positions of Nigerian manufacturing company.
4. To provide an acceptable basis for valuing inventory on hand.
5. To evaluate certain limiting factors faced by accountants in inventory
valuation.
6. To make recommendations based on findings.
1.4 RESEARCH QUESTIONS
The following questions are formulated for the purpose of this study;
1. Does an inventory valuation method have any impact on the assessable
income tax of Nigerian manufacturing company?

15
2. What influence does the prevailing economic parameter have on the
inventory valuation method used by Nigerian manufacturing company?
3. To what extent does the variance in inventory valuation method affect
financial reporting positions of Nigerian manufacturing companies?
1.5 HYPOTHESES
The following hypotheses are formulated to help achieve the purpose of the
study:
HYPOTHESIS ONE
H0: inventory valuation methods do not have any impact on the assessable income
tax of Nigerian manufacturing companies.
H1: inventory valuation methods have an impact on the assessable income tax of
Nigerian manufacturing companies.
HYPOTHESIS TWO
H0: the prevailing economic parameters do not influence the inventory valuation
methods used by Nigerian manufacturing companies.
H1: The prevailing economic parameter influences the inventory valuation methods
used by Nigerian manufacturing companies.

16
HYPOTHESIS THREE
H0: the variance in inventory valuation methods does not affect financial reporting
positions of Nigerian manufacturing companies.
H1: the variances in inventory valuation methods affect financial reporting
positions of Nigerian manufacturing companies.
1.6SIGNIFICANCE OF THE STUDY
The proper valuation of stock (inventory) cannot be over looked. This
research work is significant in the following ways:
1. It will determine if inventory valuation methods play any significant role in
ensuring the firms accountability.
2. It will determine the role of account department of a firm‟s inventory
valuation.
3. It will x-ray what true and fair means with regard to inventory valuation.
4. It will determine the causes of misrepresentation of true and fair view of
financial statement of firms and usher useful suggestions to stop the practice.
5. It will offer useful suggestions towards making the store manager more
efficient in preparing or advancing adequate data that will lend credibility to
a true and fair view of a firms operation and financial statement.
17
6. It shall serve as an aid to companies that want to change their methods but
are unable to identify the impact of the different methods on their financial
statements under prevailing economic situation.
7. It will be meaningful to other researchers and business for it will serve as
reference material and the recommendation will be very useful for
organizations that have problems in their application of inventory valuation
methods.
1.7SCOPE OF THE STUDY
This research work will be limited to the use of questionnaire and oral
interview where appropriate and to a review of related literature (relevant books,
journals, etc.) that would provide adequate and lasting solution to the problem of
inventory valuation. Data collection will be restricted to three manufacturing
companies which are Emenite limited, Innoson industrial and technical company
limited and Alo aluminum manufacturing company all in Enugu state.
Furthermore, the study is equally limited to the study of the impact of the
different methods on inventory valuation on company‟s financial statement with
particular reference to its effect on:
Tax assessable profits on companies.
Amount of tax payable by firms under the different methods,
18
The cost of goods sold value reported under the methods,
Closing stock values reported under these methods,
The decision of the potential and actual investors in the companies based on
available divisible profits.
1.8LIMITATIONS OF THE STUDY
In carrying out this research project, the researcher encounters problems
which may be attributed to;
1. Unreliable or irrelevant information obtained from oral interviews. This was
based on the degree of the respondent‟s truthfulness in answering the
questions asked during the oral interview. Some respondent thought the
research was to expose their company and thus were unwilling to give
adequate and relevant information.
2. As a result of time the researcher was restricted to just the LIFO (Last-In,
First-Out), FIFO (First-In, First-Out) and the WAM (Weighted Average
method) of inventory valuation.
3. The researcher encountered the problem of not getting back all the
questionnaires administered to respondents for responses.
19
1.9DEFINITION OF TERMS
A. INVENTORY
This is also known as stock. These are assets held for sale in the ordinary
course of business, in the process of production for such sale; or in the form of
materials or supplies to be consumed in the production process or in rendering of
services.
B. FINANCIAL STATEMENTS
These are statements produced at the end of accounting periods, such as
income statement, cash flow and statement of financial position. They are reports
which summarize the financial position. They are reports which summarize the
financial position and operating results of a business.
C. CONSISTENCY IN INVENTORY VALUATION
This is an accounting standard which demands for the use of the same
method of inventory pricing (valuation) from year to year, with full disclosure of
the effect of any change in method to enhance the comparability of financial
statements presented in the annual report.
D. MANUFACTURING COMPANIES
These are establishments that combine men, materials and machinery in an
effective manner with the aim of producing goods for human consumption and also
to make profit for the on going of the business.

20
E. BUFFER STOCK
It is an additional inventory held in excess of that needed to meet normal
demand and which leads to avoidance of stock out. It could also be referred to as
safety stock.
F. WORK- IN- PROGRESS
This is part of a manufacturer‟s inventory that is in the production process
and has not yet been completed and transferred to the finished goods inventory.
G. STOCK OUT
This refers to when the stores department of a manufacturing company, or a
store runs out of a type of stock before the next order arrives.
H. ASSESSABLE INCOME
This is the amount of income (after charging expenses against the gross
income) from each source in the year immediately preceding the year of
assessment.
21
REFERENCES
Omolehinwa, E. O (2011).Coping with Cost Accounting (2nd
Edition) Pumark
Nigeria Ltd.
Adeniyi, A.A(2009).Cost Accounting; A managerial approach. El –Toda ventures
ltd.
Horngren,E.T(1982).Cost Accounting. A managerial emphasis (5th
Edition)
London: Prentice hall.
Lucy, T (1984). Costing; An instructional manual,Eastheigh Hants: D. P
publications
Nweze, A. U (2004).Quantitative approachto management accounting (3rd
Edition) Enugu: Computer edge publishers.
22
CHAPTER TWO
2.0 LITERATURE REVIEW
2.1 HISTORICAL PERSPECTIVE
Inventory problems are as old as history itself; but it was the turn of the 17th
century that attempts were made to employ analytical techniques in studying these
problems.
The initial impetus for the use of mathematical methods in inventory
analysis seems to have been supplied by the simultaneous growth of manufacturing
industries and the various branches of engineering, especially industrial
engineering. The real need for analysis was first recognized in industries that had a
combination of production scheduling problems.
It was not until after world war 11 that the management sciences and
operation research emerged and detailed attention was focused on the stochastic
nature of inventory problems. However, it is fascinating to observe that economists
were not the first to take active interest in inventory problems even though
inventory plays a cardinal role in the study of dynamic economic behavior. The
possible reason advanced for this lack of interest is probably inherent in the fact
that economists were concentrating their attention mainly on static equilibrium
models. In recent times some economist and mathematicians have taken keen
23
interest in inventory models. They have not been particularly concerned with
immediate practical application. Instead they have been interested in the models
because of their mathematical properties and economic interpretations.
2.2 THE PROBLEM OF INVENTORY MANAGEMENT
The method to be used in inventory valuation has been the perennial
problem that is prevalent with all organizations. Organizations maintain and keep
adequate inventory for a number of reasons. Fundamentally, it may be
economically impossible or unsound to have goods manufactured or supplied in a
given system precisely at the time the demand for it occurs.
Without inventory, customers will have to wait until the orders were met
from a source external to the client firm or such orders may be delayed until
production has been undertaken. In most cases, customers do not wait for this
delay in production or supply and what happens is that the customers looks for
alternative source of supply which means the loss of that customer either
temporarily or permanently and the loss of the profit on the sale with its spill over
effect.
In some cases, organizations may deem it necessary to hold a good number
of inventories when it is absolutely certain there is a likely possibility of an upward

24
shift in material input or supply prices. The organization on the other hand may
keep lower inventories when it anticipate a decrease in material or supply prices.
It is pertinent to indicate that in retail concerns, inventories are maintained in
order to have various goods on display but still attract potential customers. There is
this ascertaintion thatvarieties of goods on display to customers help to boost sales
and profit. In practice, raw materials are purchased in large quantities in order to
reduce cost associated with purchasing to obtain a favorable price, minimize
handling and transportation cost. Inventory is of enormous economic benefits to
organizations. However, the valuation of inventory has been a common problem in
most organization.
According to Doug Brinlee (2006:379) he said that a successful business
relies on many factors, one of which is a reliable inventory management system.
Inventory management problems can interfere with a company profits and
customer service. They can cost a business more money and lead to an excess of
inventory over stock that is difficult to move. Most of these problems are usually
due to poor inventory processes and out of date system. They are a number of
problems that can cause havoc with inventory management. Some happen more
frequently than others. Here are some of the more common problems with
inventory system:
25
Unqualified employees in charge of inventory.
Using a measure of performance for their business that is too narrow.
Unrealistic business plan for a business for the future.
Not identifying shortage ahead of time.
Too much “distressed stock” in inventory
Items in stock getting misplaced
Not keeping up with the rising price of raw materials, etc
2.3 INVENTORY VALUATION
In an attempt to examine what inventory valuation is all about, it is proper to
begin with what inventory is:
The term‟ inventory” may call to mind the bottles on a liquor store shelf or a
lot full of cars awaiting sale. Those are both inventory, but the definition is
broader. Simply put, for accounting purposes anything that will be ultimately sold
and whether it is a raw material or finished good is considered inventory.
According to Frank Wood and Alan Sangster (2008:743) inventory are
goods in which the business normally deals that are held with intention of resale.
They may be finished goods, partly finished goods or raw materials awaiting
convention into finished goods which will then be sold.

26
According to international financial reporting standard (IFRS), inventories are
assets
Held for sales in the ordinary course of business,
In the process of production for such sale; or
In the form of materials or supplies to be consumed in the production
process or in the rendering of services. Inventories encompass goods
purchased and held for resale including, for example, merchandize purchase
by retailer and held for resale, or land and other property held for resale.
Inventories also encompass finished goods produced, or work in progress
being produced, by the entity and include materials and supplies awaiting
use in the production process. In the case of the service provider, inventories
include the cost of service, as described in international accounting standard
(IAS) 2paragraphs 19, for which the entity has not yet recognized the related
revenue.
The sale of merchandise (finished product) is the primary source of revenue for
most business enterprise.
According to Walter (2009:67) inventory consist of goods held for resale of
consumers, partially completed goods in production, materials and supplies used in
production. Inventory items are acquired and sold continuously in merchandising
27
business or acquired, placed in production, converted into finished product and
sold in a manufacturing business.
According to the Farlex financial dictionary (2012) , inventory valuation in
accounting is any way to estimate and report how much a company‟s inventory is
worth. It is pertinent to note therefore that accounting valuation is not the same as
market valuation, but it consists of a selection of accounting principles appropriate
to a particular asset and their application, production cannot flow smoothly without
having inventories- raw materials, work in progress, finished goods and supplies.
David L. Scott (2007:105) also looked at inventory valuation as the cost
assigned to inventory for the purpose of establishing its current value. Inventory
valuation is determined according to the basis by which a firm assumes inventory
units are sold. If the first unit acquired are assumed to be the first unit sold (FIFO),
costs of the last unit purchased are used for valuing inventory remaining in stock.
Conversely, if the last unit acquired are assumed to be the first unit sold (LIFO) the
cost of the first unit purchased are used for valuing the inventory remaining in
stock.
The two most significant functions in accounting for inventory according to
Walter et al (2009:78) consist of determining the quantity of goods to be included
in inventory and determining the appropriate cost of inventory on hand. The first
28
function involves stock taking while the second refers to the valuation of
inventory.
The primary basis of accounting for inventory is cost which by definition is
the price or consideration given to acquire an asset. In inventory valuation, cost
refers to the sum of the applicable expenditures and charges directly incurred in
bringing an article to its existing condition or location.
Depending on the character and composition of the inventory, the rule of
“cost or market, whichever is lower” may properly be applied either directly to
each item or to the total of the inventory. The method should be that which most
clearly reflects periodic income. In practice however, the physical flow of goods
frequently do not correspond to the chosen method by the accountant to record the
flow of assets. A situation where the flow of inventory seldom arises except in the
case of specific identification method in inventory costing. Hence, it was asserted
by Walter et al[2010: 112 ]that the assumed flow of cost to be used in assigning
cost to inventory and goods sold need not conform with the physical flow of good.
The question of which physical units of identical goods that were sold and which
remain in inventory is not of any particular importance in the accounting of income
determination.

29
The frequent movement of physical items into and out of inventory and its
corresponding changes in units cost complicates the accounting for inventory and
cost of goods sold. At the end of a financial year, the accountant apportions the
total cost between the between the current operating period and the future; the later
are placed in an asset account .Inventory is subject to physical deterioration and
damage, decline in value due to changing market conditions. it therefore requires
careful control if needed goods are to be on hand in good condition when they are
require, and if excessive stocks are to be avoided.
Walter et al[2010:85]further stated that is „‟the major objective of objective
of accounting for inventories is the proper determination of income through the
process of matching appropriate costs against revenues. The major objective in
selecting a method should be to choose the one which under normal circumstances
reflects periodic income and cost.
2.4 INVENTORY VALUATION METHODS.
There are many methods of methods of valuing inventory. Generally, the
objective of inventory valuation techniques are to provide an acceptable basis for
valuing inventory on hand, to assist in the accurate determination of product cost
and to ascertain the cost of materials issued to production on a consistent and
realistic basis. All methods of inventory valuation are based on cost principle no

30
matter which method is deemed as applicable to a forms situation. In selecting an
inventory costing model, cost is matched with revenue and on ideal choice is the
method most clearly reflects periodic income.
In costing, raw materials usage is conventionally defined as the opening stock of
raw materials[M1] plus purchase during the period [M2] less closing stocks of raw
materials [M3].Thus raw materials usage [RMU]is:RMU=M1+M2-M3
This is however referred to as inventory difference method. Nevertheless, the
above equation incorporated leakage of materials through losses and damages
cause distortions in performance evaluation and comparison.
There exists a diversity of views on the methods adopted in amongfinancial
accountant and cost accountants. The financial accountants cost accountants adopts
methods such as
Average price method.
Cost price method.
o First-in-first out [FIFO].
o Last –in-first out [LIFO].
Market price [Replacement price].
Base stock.
Next-in-first-out.

31
Latest purchase price.
Highest-in, First out.
Specific identification.
According to Peter Asukwo[1990:90] “There is always a discrepancy between
the stocks figure in the cost account and the one in the financial account” .However
we shall adopt the cost accountants techniques in the course of this story.
2.4.1 AVERAGE PRICE.
Under the average method we have:
1. Simple average price.
2. Moving average price.
3. Weighted average price.
2.4.1 SIMPLE AVERAGE PRICE.
This is defined by CIMA as “A price which is calculated by dividing
the total of the materials in the stock from which the material to be priced could be
drawn, by the number of prices used in total‟‟ It is an average price of the costs in
stock irrespective of the quantities involved. The lot which is exhausted is
excluded in computing the average price. Materials are not therefore changed out
at actual cost, so a profit or loss may be incurred merely by adopting this price.

32
This method pays no regard to relative quantities held at each price; therefore just a
few [little] can be said in favour of it. This method should only be used when
prices do not fluctuate very much and the stock value is very small.
Despite the fact that simple average price is easy to compute, it is misleading and
can give very false issue and valuation figures.
2.4.2 WEIGHTED AVERAGE PRICE.
According to CIMA“This is the price which is calculated by dividing the total
cost of material to be priced by the total quantity of materials in that stock”.
This is the most often used average price method which assumes that every
batch taken from the store room consists of uniform quantities from each supply in
stock at the time of issue. The method determines the unit price by dividing the
total cost of materials in stock by the total quantity of materials outstanding.
This method uses a weightedaverage cost per inventory unit in assigning
cost to units sold and to inventory. A weightedaverage cost of goods available for
sale is recalculated at the time of each purchase. Notice that the most current
average cost is used to calculate the cost of each sale. Weighted average will
produce different results under a perpetual other than a periodic inventory system.

33
Larson and Miller [1992:402] stated that weighted average price is an
inventory pricing system in which the unit prices of the of the beginning and of
each purchase are weighted by number of units in the beginning inventory and
each purchase .The total of these amounts is then divided by the total number of
the ending inventory of the units that were sold.
The benefits according to the use of this method include:
1. Simplicity in operation.
2. It does not lead to unrealized profits or losses.
3. According to Asukwo [1990:108]. “This method was recommended by
international accounting standard[IAS 2]and the statement of accounting
standard [SAS4] for the determination of historical cost of inventories.
4. The benefit of minimizing the effects of rapid price fluctuation, thereby
showing the remaining stock at cost price.
2.4.3 MOVING AVERAGE.
This is a modified form of the weighted average method or technique. It is
employed in a perpetual inventory record system in order to compute the unit price
at which materials could be issued, this method divides the total cost of material of
a particular class by the number of unit on hand to arrive at the price. Under the
method, the average unit cost is recomputed each time stock or purchase of new

34
materials is received subsequently, any issue is then made at the unit cost until
another receipt of stock necessitates the computation of a unit cost.
Moving average is a cost flow assumption used in perpetual inventory
system, new weighted average is computed each time goods are purchased. This
method is more cumber some to opera than other average costing methods to due
to the fact that it demands accurate track records of costs and quantities each time
stock is receive.
2.4.4 COST PRICE
They include
1. First-in-First out[FIFO].
2. Last-in-First out [LIFO]
2.4.4.1. FIRST IN FIRST OUT [FIFO]
In this method stocks are issued in strict chronological order. That is the
oldest materials are issued first and are issued at the rate at which they were
received.
In other words materials in the store are issued according to their order of
receipts into the store. Where there are opening stocks, they are treated as if there
35
were issued first then the unit from the first purchase issued next. This method is
not suitable in times of rising prices and inflation.
This is because issue price of materials to production will be low while the
cost of replacement of materials will be high. This will in turn charge a lower cost
of goods sold to income statement.
This method follows the principle that items in the beginning inventory or
materials purchased first are presumed to be charged to production first, therefore
the items from the earliest purchase are issued next and so on. Thus all items left in
the closing stock are deemed to have come from the most recent purchase, whereas
those issued to production are from the earliest purchase.
Eyisi (2003:24)stated that this method is based on the based on the
assumption that the oldest purchased goods are sold or issued out first and that
most recently purchased goods are the closing stock balance. First-in-First- Out
(FIFO)methods assigns to the issued [transferred]out stocks from the stores.
Hence the closing stock is measured by the costs of the units most recently
acquired. The advantage of this method is that, it is assumed that cost of materials
issued out in time of deflation reflects the previous stocks (material) acquired at a
lower price.

36
According to the Farlex Financial dictionary (2012), First-in, First-out
(FIFO) method is an accounting procedure for identifying the order in which items
are used or sold. With FIFO, the oldest remaining items are assumed to have been
sold first. During a period of inflation this tends to keep cost low for accounting
purposes. It results in higher reported profits and a greater tax liability, however.
This method is most suitable in valuing agricultural products which are
perishable and subject to a fairly speedy deterioration as time elapses. Also, it
maybe used by Grocery stores which deals on items with high level of
perishability. Also, this method checks material obsolescence, avoidable waste and
deterioration. The method ensures that materials issued are at cost and therefore
avoids unrealized profit or losses which may arise from a random issue of
materials. And it is also a representative of current prices and thereby avoiding the
use of outdated prices in valuing closing stock.
This method is an actual cost system and it is acceptable to SAS 4. This
method is also accepted by the Board of Inland Revenue for tax assessment
purposes in the word of Eyisi ( 2003:25) the disadvantage is that higher tax is paid
as higher profit is been measured due to lesser cost at initial stage of purchase;
which is issued out. This method is acceptable to inland revenue and is
recommended by SSAP 9.

37
2.4.4.2 LAST – IN – FIRST – OUT (LIFO )
This is a method of inventory valuation base on the assumption that the
goods purchase most recently(the last in) are sold or used first (the first out). The
remaining items are assumed to have been purchased at successively earlier
periods. In this method, value of the inventory at the end of an accounting period is
based on the value of items purchased earliest. During periods of high inflation
rate, the last in first out (LIFO) method yield lower value of the ending inventory,
higher cost of goods sold, a lower gross profit ( hence lower taxable income) than
that yielded by the application of the first in first out (FIFO) method. During
prolong inflationary periods, however LIFO method can seriously understate the
value of inventory because the cost of replacing it would be much higher than the
value shown in account.
This method is also referred to as at first in last out (FILO) which is define
as method of inventory valuation base on the assumption that goods are sold or
used in the opposite chronological order in which they are bought. Hence, the cost
of goods purchase first is the cost of goods sold last. To visualize this, it may easier
to consider inventory to be a stake of plates. The first plate added (first in) will
stay at the bottom of the stack as long as new plate added on top. In times of rising
prices the FILO method record the sale of the most recent items first. FILO is the
same as the last in first out (LIFO) accounting method.
38
Consequently, the unit cost of beginning inventory and the earliest purchases
are incorporated in the ending inventory figure. Hence, ending cost is measured at
the oldest cost where as the production cost is measured at the newest unit cost.
Larson and miller (1992;424) noted that one argument for the use of LIFO is
base on the fact that a going concern most replace the inventory items in sales.
When goods are sold replacement are purchased. According to this point of view a
correct matching of cost with revenue requires matching replacement cost with
sales that make the replacement necessary. Although the cost of the most recent
purchase is not quite the same as replacement cost, they are close approximations
of replacement costs. Because LIFO assigns the most recent purchase costs to
income statement, LIFO (compared to FIFO and weighted average) comes closest
to matching replacement cost with revenues. The LIFO method is suitable in terms
of rising prices because materials issued are price at the price of the latest available
consignment in the store which is closely related to the current price level whereas
FIFO method is useful when prices of materials are falling.
Eyisi, S A (2003:25) stated that this method is the opposite of FIFO. In this
method stocks issued out are priced last in purchased goods. The assumption here
is that the issued out material is assumed to be last in purchased (received) goods.
As the result of the above, the closing stock unit are valued at the oldest unit goods
available. This method is useful during the time of inflation; as materials acquired

39
previously or which are valued at the current price of recently purchased goods.ie.
at a lesser price assumed to be valued at the most recent price of purchased of
goods. Under this method cost are matched with income and product cost is based
on current prices and as such could be said to be more realistic.
The Advantages of LIFO includes the following;
It ensures that issues are close to current economic value stock.
Valuation of stock balance is usually very conservative.
Materials are issued at cost price and therefore, no profit or loss will result
by using this method.
This method also have Disadvantage and they include:
Since the goods are issued out based on the current stocks received, the
oldest materials are left in stock and this exposes them to the risk of loss
through pilferage ,obsolescence, deterioration and spoilage.
It makes comparison between two jobs or contracts difficult when the
materials issued in the two jobs were valued using different methods.
It is administratively cumbersome because it requires the recording system
to keep track of batches.
40
2.4.3 MARKET PRICE (REPLACEMENT PRICE)
This is the system of pricing all material issues at the market price at the
time of issue. This method is also referred to as replacement price. While this may
be desirable for specific purpose, it is very difficult in practice to obtain current
cost for each item in stock and where revised price list are available, the risk of
revaluing the entire stock each time a change takes place enormous. Hence, the
method is most suitable for business that take large quantities of materials in
advance of requirements in order to obtain cheap prices; the benefit of which will
not be passed to the customer.
The advantages of this method are
The result of good or poor buying is disclosed.
It keeps costs in line with current prices
Materials are charged to production at the most current and realistic price;
such that if there is any full in price of materials the accompanying loss must be
accepted.
Its disadvantages are:
1) A great deal of work is involved in obtaining information and keeping the
market price up to date.

41
2) The method departs from cost; consequently, confusing elements are
introduced into the cost accounts.
3) During inflation, the stock balance may be overstated when prices are falling
and large sum has to be written off to reduce it to market value.
4) Substantial differences may arise on the store records and dealing with this
tends to complicate the casting system unnecessarily.
2.4.4 BASE STOCK
This method uses the assumption that each establishment maintains a
minimum quantity of material in stock such minimum quantity is known as safety,
buffer or base and this should be used only when an emergency arises.
According to Eyisi, S.A(2003:27), this method assumes that initial
purchased material would provide buffer (i.e base)stock and the store ledger (i.e
means buffer material are seen to be existing in the company store)at any point in
time.
The base is created out of the first consignment of the materials purchased and,
therefore, it is always valued at the cost price of the first batch and is carried
forward as fixed asset. The base stock method is not an independent method of
pricing issues but works with some other methods, such as LIFO, FIFO, etc. Any
quantity over and above the base stock is issued in accordance with the other

42
method which is used in conjunction with this method. like LIFO method, this
method is completely rejected by the SAS 4.
2.4.5 NEXT IN FIRST OUT
Under the next in, first out, stock is valued at the price estimated for the
next purchase. The price is similar to the replacement price unless the next
order will not be placed for sometime.
2.4.6 LATEST PURCHASE PRICE
In this method, the value of closing stock is determined by applying the
cost of the latest item purchase to the number of units on hand.
2.4.7 HIGHEST IN, FIRST OUT
In this method, issues are valued at the highest price paid for a batch until
stock of that batch is exhausted and so on. This method is very hectic to
administer and in comparison with other methods, it has the effect of
overstating production cost and understating ending inventory. It is pertinent to
however stress that the method of pricing inventory issues employed by any
form will depend on the circumstances of the business and on the nature of the
materials involved. A good inventory accounting system enables the provision
of relevant inventory data and information to management in determining the
43
value attributable to inventory at the end of the financial period. Stock valuation
when appropriately carried out gives a true and fair view of the value and
quantity of stock with respect to the relevant period.
Accountants give useful advice concerning estimates of the amount and the
quantity of stock and work in progress during a given period. The major
problem in maintaining accurate accounting records or inventory management
is the constant fluctuation in prices of materials and labour incorporated in
product or inventory costs.
2.4.8 SPECIFIC IDENTIFICATION
This method is used for non standardized items. Unlike standardized items
(items of stock in regular use), these materials do not loose their identity when
placed in the stores because each material has unique specifications, for
example, electric motors.
In specific identification the buying price (purchase price) of each item is
specifically identified so that the actual price of the item is issued to production.
This implies that each batch of material supplied retains its unique identity; as a
result, it is easy to issue out materials to jobs at actual invoice price. Similarly,
it offers a great degree of ease in determination of closing stock figures; as
44
closing stock is valued by adding the costs of those items remaining on hand
during the relevant period.
To effectively operate this method, it is worthwhile to record the batch
numbers on the stores requisition card and to keep a running balance of each
batch on the stock ledger card. This is accomplished by simply adding the cost
price of each unit of stock as identified and recorded whenever an issue is
made. This technique might be possible for a firm handling small numbers of
items or where each batch of items purchased retains its separate identity even
when it is mixed up with other batches. The specific identification method
could be applied to an automobile retailer who deals on expensive and
sophisticated spare parts, automobiles, etc. however, this method is
impracticable and onerous when a manufacturing concern deals on a good
number of items and as a result the identity of individual item is lost. This
technique is methodical when identical items are involved. Practical
consideration makes specific identification inappropriate in most cases.
According to Monwuba (1995:23), the specific identification method is
tedious and impracticable where a large number of different items of materials
change frequently. However, this method of valuing material issues is useful
when materials are purchased for a specific job order.
45
This method requires a business to identify each unit of merchandize with
the unit cost and retain that identification until the inventory is sold. Once a
specific inventory item is sold, the cost of the unit is assigned to cost of goods
sold. Specific identification requires tedious record keeping and is typically
only used for inventory of uniquely identifiable goods that have fairly high per
unit cost (example fine jewelry, automobiles, etc). This method allows investors
to reduce or offset capital gains by picking a specific lot of securities to be used
as basis for sale.

46
REFERENCES
Ekwe, M. E (2003).An Insight into Costing. Enugu; Two Way Printers Nigeria
Enekwe, C. I (2010).Basic Fundamentals in Accounting.Volume Two. Enugu;
Providence Press Nig. Limited
Eyisi, S.A (2003).Cost Accounting Theories and Practice.Enugu; Ayi- Best
Publishers.
Frankwood& Alan Sangster. (2008): Business Accounting (11th
Edition) IFRS
Edition. Harlow: Pearson Education Ltd Publication.
Horngren, C. T & George Foster .(2011). Cost Accounting.A Managerial Emphasis
(14th
Edition). London: Prentice Hall.
Karen, W. B (2012).Managerial Accounting (3rd
Edition). London: Prentice Hall
Larson, K. D, etal. (2002). Fundamental Accounting Principles. Ryerson: McGraw
– Hill.
Lucy, T .(2003).Management Accounting. Great Britain: DP Publications.
Monwubba, A. O (1995): Principles and Practice of Cost Accounting. Enugu: B-
Teks Publishers.

47
Nwoha, C .(1995).Advanced Financial Accounting.Enugu; Valson W. A Press Ltd
Okwo, I. M .(2003). Cost Accounting. Enugu; Computer Edge Publishers
Omelehinwa, E. O (2011): Coping With Cost Accounting (2nd
Edition). Pumark
Publishers, Nigeria.
Peter, C. B et al. (2009). Introduction to Managerial Accounting; McGraw- Hill/
Irwin
Walter, et al .(2009). Managerial Accounting (2nd
Edition). London; Prentice Hall
JOURNALS
Journal of Academy of Business and Economic (2010). Volume 10, Source Issue:3;
Int‟l Academy of Business and Economics Publications.

48
CHAPTER THREE
3.0 RESEARCH METHODOLOGY
3.1 INTRODUCTION
In this chapter, the issue that would be considered are as follows:
Research design, area of the study, population of the study, sample size and
sampling techniques instrument of data collection, validity of instrument ,
reliability of the instrument, method of data collection and method of data analysis.
3.2 RESEARCH DESIGN
This research work consists of a survey research design. For the purpose of
carrying out a sound analysis and then arriving at a reasonable conclusion, this
work entails the collection of data using both the primary and secondary sources of
data collection.
3.2.1 PRIMARY SOURCES
The primary data used for this research work were gotten from the
companies used as a case study in this research work and this was done through the
use of questionnaire and oral interview.
49
3.2.2 SECONDARY SOURCES
The secondary data were extracted from textbooks and other related
materials which included journals, internet browsing. To assist the researcher to
tend credibility to facts, as well as the authenticity of this work the following
libraries were used in the course of this research work.
Enugu state library
Caritas university library
Data collected during this work were restricted to experts in the area of my
interest and standard textbooks that are internationally recognized and accepted.
Citations were made where appropriate.
3.3 AREA OF THE STUDY
The area of study for this research work includes: Emenite limited located at
No. 7 old Abakaliki road, Emene; AloAluminum manufacturing company limited,
located at Enugu – Abakaliki road, opposite mobile station by port – Harcourt
express way, innoson technical and industrial company limited, located at plot 11
Enugu / Abakeliki express way, Emene industrial layout, Enugu north, Enugu, all
in Enugu state.
50
3.4 POPULATION OF THE STUDY
The population for this study consisted of 3 selected manufacturing
companies which are Innosontechnical and industrial company limited, Emenite
limited, Alo aluminum manufacturing company limited all in Enugu state. The
infinite population of this study which consists of all workers of the 3 companies
were over 3000. But the population which shall be considered in the course of this
work (finite population) is 220 which consist of accountants, directors, managers,
and stake holders of the 3 companiesput together.
3.5 SAMPLE SIZE AND SAMPLING TECHNIQUE
Sample is a small group of element or subject drawn from a definite or specified
population.
Sampling involves the process by which the subject or object of the
observation is drawn from a large sect and studied in other to make references
about the characteristics of the large population. Simple random sampling
technique was used to select the participants. This every member of the population
had an equal chance of being selected.
The sample sized was statistically determined using “Taro Yamane”
formular
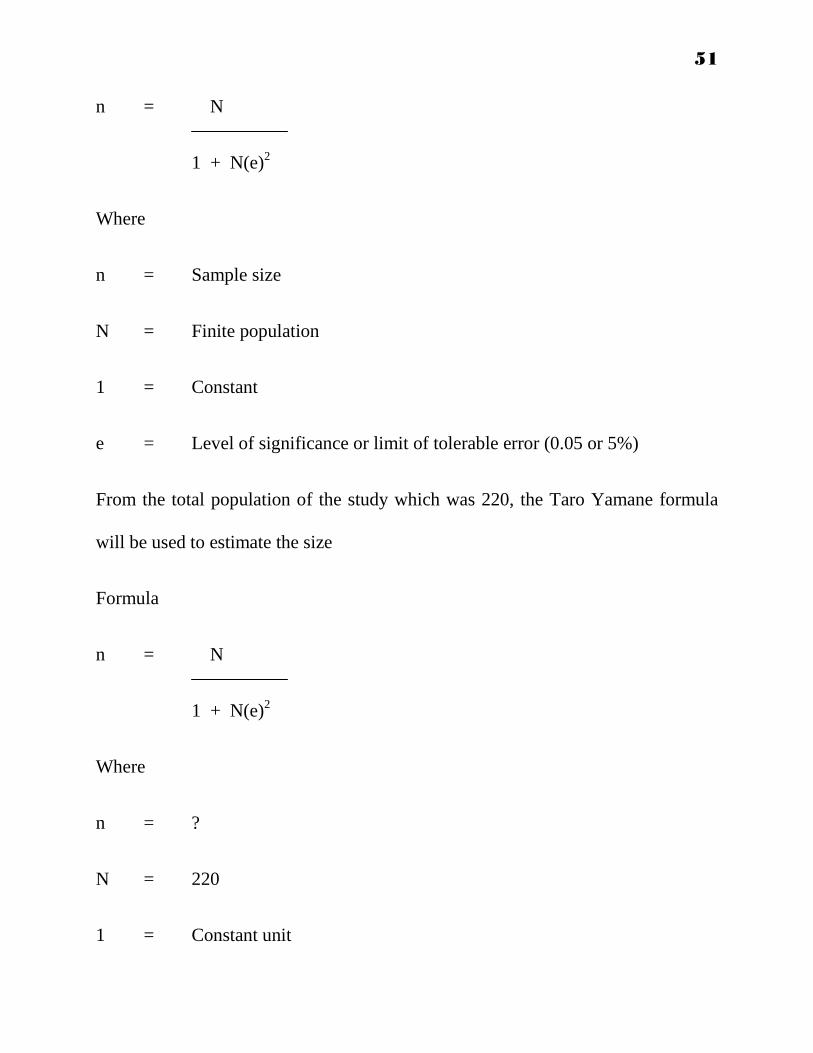
51
n = N
1 + N(e)2
Where
n = Sample size
N = Finite population
1 = Constant
e = Level of significance or limit of tolerable error (0.05 or 5%)
From the total population of the study which was 220, the Taro Yamane formula
will be used to estimate the size
Formula
n = N
1 + N(e)2
Where
n = ?
N = 220
1 = Constant unit

52
e = 0.05
n = 220
1+220(0.05)2
n = 220
1+220(0.0025)
n = 220
1+0.55
n = 220
1.55
n = 141.9 Ω 142
therefore out of the population of 220, 142 was gotten as a sample size.

53
Below is a table showing the sample size of the 3 companies.
Companies Accountant Directors Managers Stakeholder Marketers Total
Innoson 12 6 11 7 8 44
Emenite 16 8 15 8 8 55
Alo
aluminum
13 6 11 6 7 43
Total 41 20 37 21 23 142
Sourced: survey 2012
3.6 INSTRUMENT OF DATA COLLECTION
The instrument used for this research were personal interview and use of
questionnaire. Personal interviews had to do with asking questions order to gather
required information that is centered on this study. It involved going from one
respondent to another.
Questionnaires involved presenting some relevant questions in respect to the
research work. The questions in the questionnaire were primarily framed and
revolved around the three (3) hypotheses that are meant for this research. They
were prepared cautiously to ensure that questions will not be misunderstood by the
respondents.
54
3.7 VALIDITY OF THE INSTRUMENT
According to Anyanwu (2000), validity refers to the degree to which a
measuring instrument measures what it is designed to measure.
The face validity was carried out by giving questionnaires to supervisor who
went through the questions drafted and made appropriate suggestions and
corrections that helped meet the validity and this brought the items on the
questionnaire to 12 out of the initial 17 that was drafted.
The content validity was also carried out by my supervisor, lecturers and
experts in the field to ensure that the research work was in line with what it is
actually talking about and this was done by going through the written work before
completion and was approved valid.
3.8 RELIABILITY OF INSTRUMENT
This is a test or measure of the extent to which a research instrument will
yield the same results under the same conditions, that is the consistency of the
work.
For the reliability of the instrument a pilot survey was carried out to test the
questionnaires that were distributed on a similar sample from the criteria for the
selection of subject met by the subject.
55
3.9 METHOD OF DATA COLLECTION
Questionnaires were administered directly by the researcher by the help of
the management to respondents that are staffs of the selected companies. The
researcher ensured that there was no double issuance of questionnaires so as to
avoid loss of questionnaires. The questionnaires were left with the respondents so
as to allow for privacy.
3.10 METHOD OF DATA ANALYSIS
In the study of this work, all the questionnaires retrieved were scrutinized
and analyzed based on simple percentages. Tables were used where necessary to
avoid rough presentation of information (data) and after this, the hypotheses
formulated were tested with the “regression co efficient analysis” method and also
the Z – test was used.
The regression co –efficient analysis method was adopted for this research
because the researcher talked on the “impact of inventory valuation methods has
on the financial report statements of manufacturing companies.
The regression co – efficient formular is stated thus:
b = X1Y1 – nxy
X12 – nX
2
56
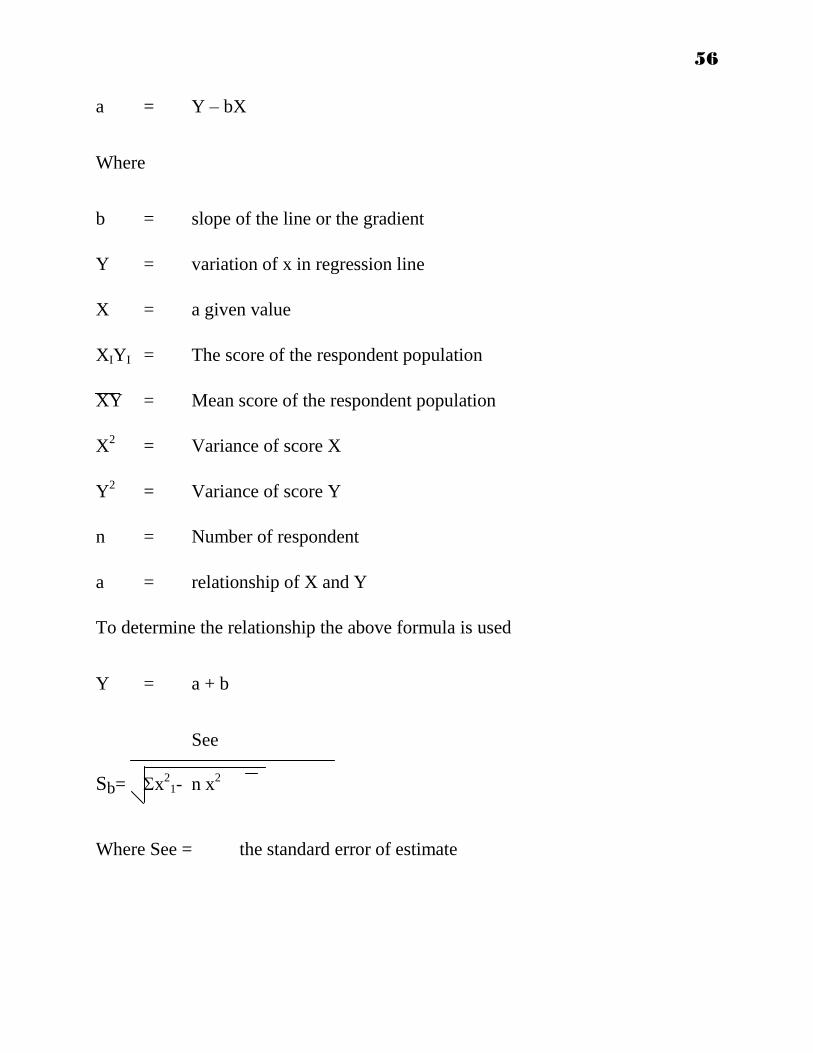
a = Y – bX
Where
b = slope of the line or the gradient
Y = variation of x in regression line
X = a given value
XIYI = The score of the respondent population
XY = Mean score of the respondent population
X2 = Variance of score X
Y2 = Variance of score Y
n = Number of respondent
a = relationship of X and Y
To determine the relationship the above formula is used
Y = a + b
See
Sb= x21- n x
2
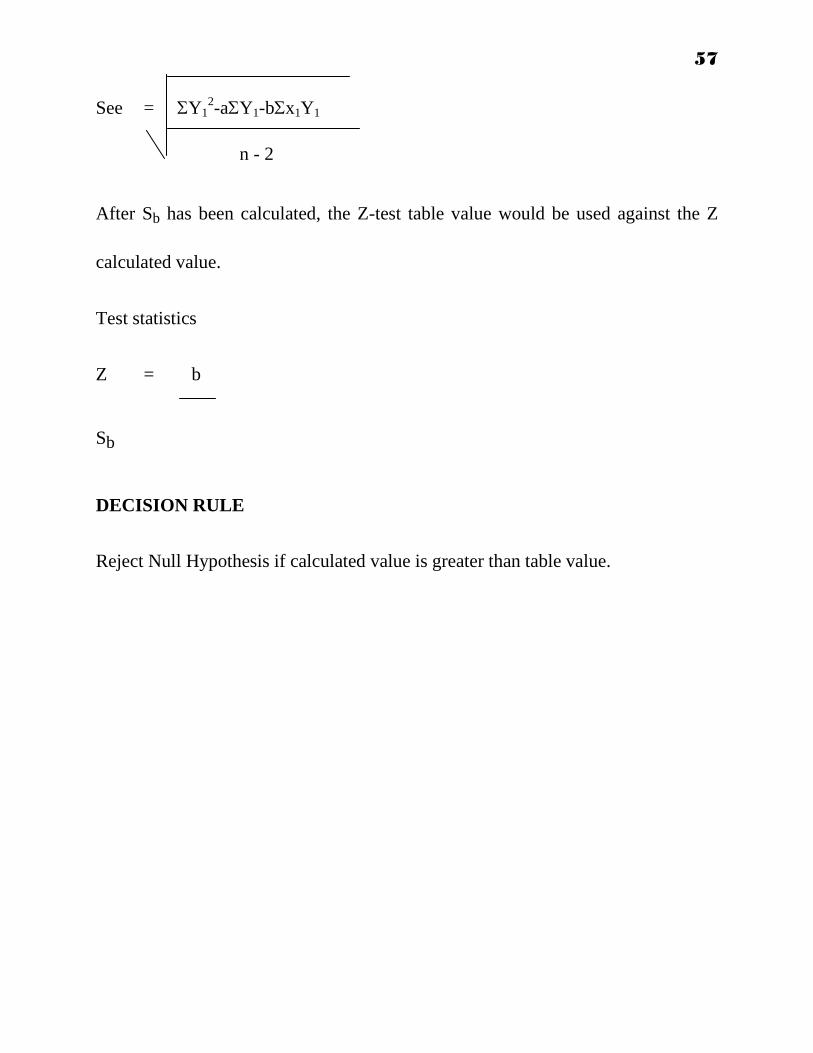
Where See = the standard error of estimate
57
See = Y12-aY1-bx1Y1
n - 2
After Sb has been calculated, the Z-test table value would be used against the Z
calculated value.
Test statistics
Z = b
Sb
DECISION RULE
Reject Null Hypothesis if calculated value is greater than table value.

58
CHAPTER FOUR
4.0 DATA PRESENTATION, ANALYSIS AND INTERPRETATION
In this chapter, efforts shall be geared towards analyzing those questions, the
response of which bear or rest directly on the main focus of this study. Most of the
data collected were analyzed and presented in a tabular form for easy and clearer
understanding of the analysis.
4.1 DATA ANALYSIS
In this study a total number of 142 questionnaires were distributed to
respondents which represents 100%, out of which 128 representing 90% were
recovered while 14 representing 10% were not recovered. 8 representing 6% of the
128 were invalid and discarded. Therefore the total number of questionnaire
presented and analyzed where 120.
Table 4.1.1
Questionnaires Observations Percentage %
No issued 142 100%
Recovered 128 90%
Un recovered 14 10%
Invalid & Discarded 8 6%
Valid 120

59
From the table above it can be seen that only 120 questionnaires recovered were
valid therefore the analysis will be done based on this figure.
QUESTION ONE
Inventory valuation method does not have any impact on the assessable
income tax of your company.
Table 4.1.2
RESPONDENT AGREED DISADREED TOTAL %AGREED %DISAGREED
Accountants 11 20 31 35% 65%
Directors 10 21 31 32% 68%
Managers 6 14 20 30% 70%
Stakeholders 7 13 20 35% 65%
Marketers 6 12 18 33% 67%
TOTAL 40 80 120
In analyzing the responses of the respondent, in the statement made above, 40
respondents which includes (Accountants, Managers, Directors, Stakeholders and
Marketers) agreed with the statement while 80 disagreed.

60
QUESTION TWO
Economic parameters (inflation, deflation and static economy) has no effect on the
choice of inventory valuation method used in a firm.
Table 4.1.3
RESPONDENT AGREED DISAGREED TOTAL %AGREED %DISAGREED
Accountants 11 20 31 35% 65%
Directors 7 13 20 35% 65%
Managers 13 18 31 42% 58%
Stakeholders 9 11 20 45% 55%
Marketers 7 11 18 39% 61%
Total 47 73 120
From the table above 47 respondents agreed to the question asked and 73
respondents disagreed.

61
QUESTION THREE
The use of different methods in a firm has no effect on the financial report
statement.
Table 4.1.4
RESPONDENT AGREED DISADREED TOTAL %AGREED %DISAGREED
Accountants 11 20 31 35% 65%
Directors 6 14 20 30% 70%
Managers 13 18 31 42% 58%
Stakeholders 8 12 20 40% 60%
Marketers 7 11 18 39% 61%
TOTAL 45 75 120
The above table shows that 45 respondents agreed to the question and 75
respondents disagreed.

62
QUESTION FOUR
A firm should be inconsistent with the application of inventory valuation methods
adopted for comparism of financial statement.
Table 4.1.5
RESPONDENT AGREED DISADREED TOTAL %AGREED %DISAGREED
Accountants 9 22 31 29% 71%
Directors 7 13 20 35% 65%
Managers 11 20 31 35% 65%
Stakeholders 7 13 20 35% 65%
Marketers 7 11 18 39% 61%
Total 41 79 120
From the question asked above and responses given by the respondents, the table
shows that 41 respondents agreed ton the question while 79 respondents disagreed.
63
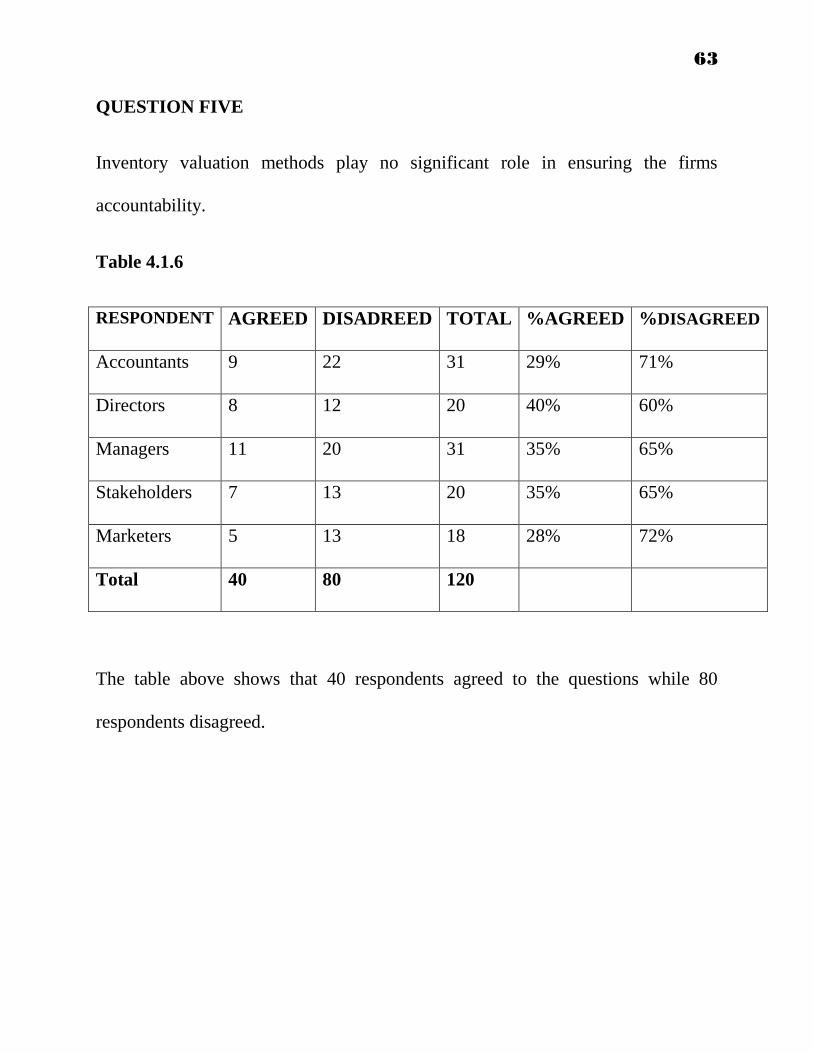
QUESTION FIVE
Inventory valuation methods play no significant role in ensuring the firms
accountability.
Table 4.1.6
RESPONDENT AGREED DISADREED TOTAL %AGREED %DISAGREED
Accountants 9 22 31 29% 71%
Directors 8 12 20 40% 60%
Managers 11 20 31 35% 65%
Stakeholders 7 13 20 35% 65%
Marketers 5 13 18 28% 72%
Total 40 80 120
The table above shows that 40 respondents agreed to the questions while 80
respondents disagreed.
64
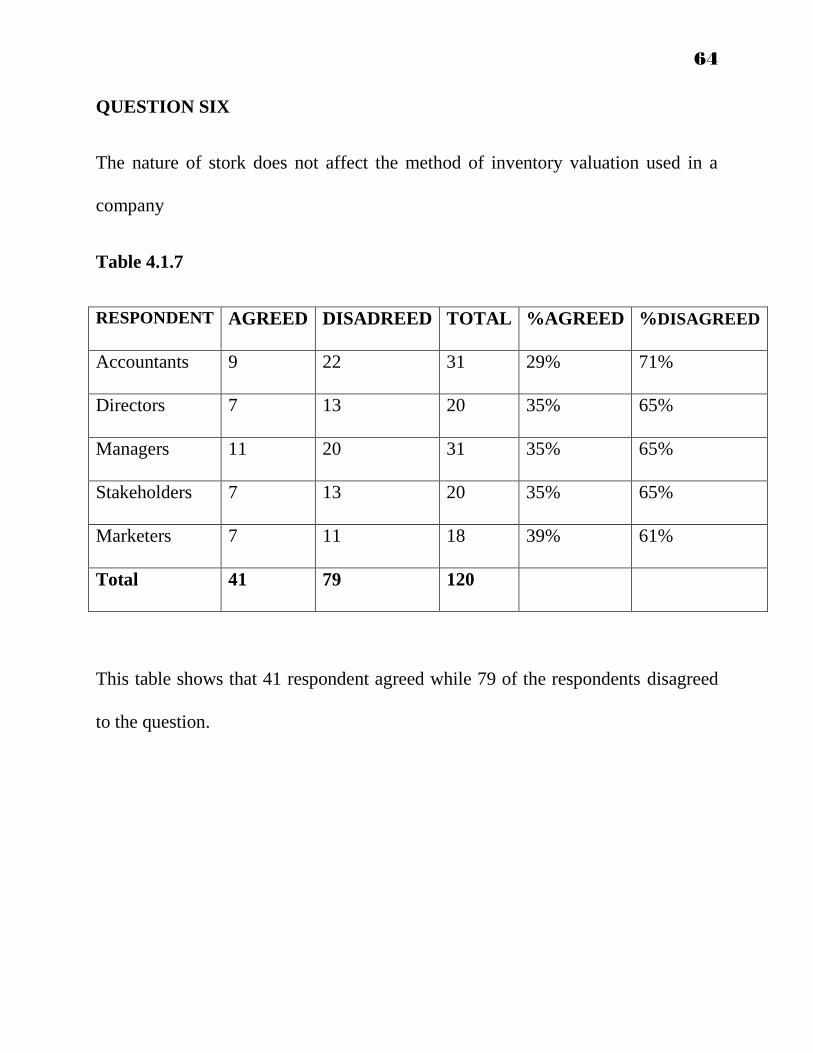
QUESTION SIX
The nature of stork does not affect the method of inventory valuation used in a
company
Table 4.1.7
RESPONDENT AGREED DISADREED TOTAL %AGREED %DISAGREED
Accountants 9 22 31 29% 71%
Directors 7 13 20 35% 65%
Managers 11 20 31 35% 65%
Stakeholders 7 13 20 35% 65%
Marketers 7 11 18 39% 61%
Total 41 79 120
This table shows that 41 respondent agreed while 79 of the respondents disagreed
to the question.
65
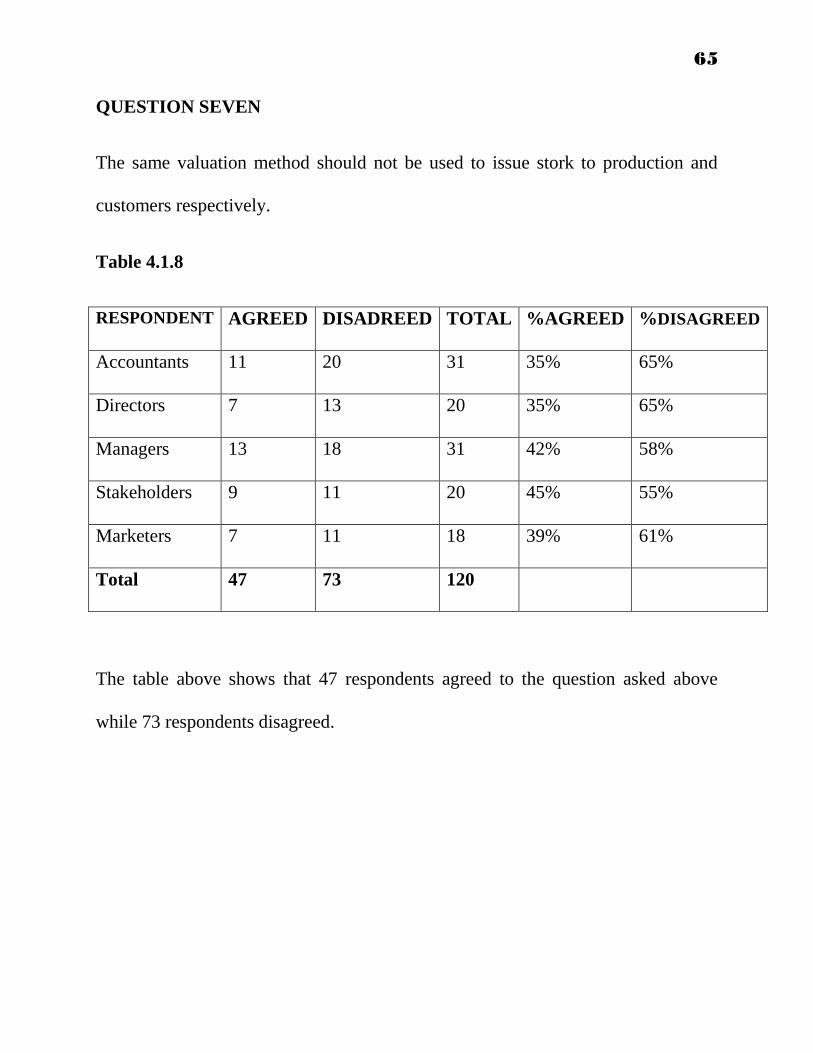
QUESTION SEVEN
The same valuation method should not be used to issue stork to production and
customers respectively.
Table 4.1.8
RESPONDENT AGREED DISADREED TOTAL %AGREED %DISAGREED
Accountants 11 20 31 35% 65%
Directors 7 13 20 35% 65%
Managers 13 18 31 42% 58%
Stakeholders 9 11 20 45% 55%
Marketers 7 11 18 39% 61%
Total 47 73 120
The table above shows that 47 respondents agreed to the question asked above
while 73 respondents disagreed.
66
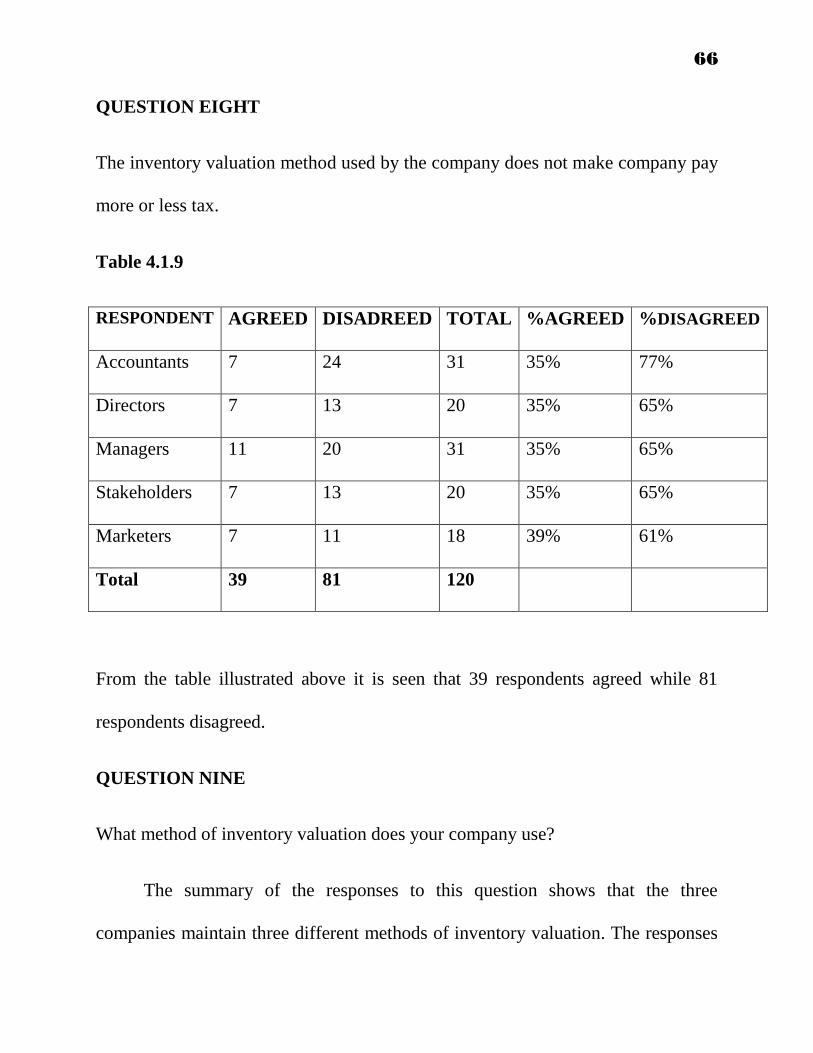
QUESTION EIGHT
The inventory valuation method used by the company does not make company pay
more or less tax.
Table 4.1.9
RESPONDENT AGREED DISADREED TOTAL %AGREED %DISAGREED
Accountants 7 24 31 35% 77%
Directors 7 13 20 35% 65%
Managers 11 20 31 35% 65%
Stakeholders 7 13 20 35% 65%
Marketers 7 11 18 39% 61%
Total 39 81 120
From the table illustrated above it is seen that 39 respondents agreed while 81
respondents disagreed.
QUESTION NINE
What method of inventory valuation does your company use?
The summary of the responses to this question shows that the three
companies maintain three different methods of inventory valuation. The responses
67
shows that Innoson technical and industrial company limited uses the average price
method, Emenite limited uses the first – in – first – out method (FIFO) while Alo
aluminum uses the last – in – first – out (LIFO) method.
QUESTION TEN
Is there any method(3) you know which is/ are recommended by the relevant tax
authority?
From the summary gotten from the responses by the respondent it is evident that
first – in –first – out method and average cost method are recommended by
international accounting standard (IAS) 2 and statement of standard accounting
principle (SSAP) 9.
QUESTION ELEVEN
Is there any regulatory body or legislation imposing any identifiable
method?
The summary of responses gotten from the respondents shows that there is no body
that is imposing any identifiable method of inventory valuation.

68
QUESTION TWELVE
What do you recommend generally to help improve and give adequate
attention to inventory valuation method is companies?
From the summary of responses gotten from the respondents, it could be said that
any inventory valuation used by a firm should not be that which yields more gain
to the tax authorities and bring losses to the firm.
A more practical illustration shall be examined below to test the validity of these
responses. We shall take on instance, considering the following three
manufacturing companies used as case study in this research work.
Innoson technical and industrial company limited, Emenite limited and Alo
Aluminum. These three companies are into manufacturing but value their
inventories using weighted average method, FIFO and LIFO method respectively.
The following data relate to the operations of each of these companies for
the year ended 30th June 20x2. It shows consignments of materials received and
their issuances to customers as sales.
July 1, 20x2: inventory at beginning 500 units @ ₦50/unit
July 10, 20x1: received 6000 units @ ₦55/unit
August 5, 20x1: received 4000 units @ ₦60/unit

69
September 12, 20x1: issued to customers 6000 units
October 11, 20x1: received 10000 units @ ₦70/unit
November 8, 20x1: received 9000 units @ ₦75.50/unit
February 2, 20x2: issued 7500 units
March 4, 20x2: received 5000 units @ ₦80/unit
May 24, 20x2: issued to customers 11,500 units
June 10, 20x2: issued to customers 4000 units
Additional information: ₦
Turn over 3,560,000
Depreciation 165,000
Income from other sources 80,000
Admin expenses 100,000
Tax rate 30%
We wish to find out the impact of each method on the financial statement through
the closing balance values.
70
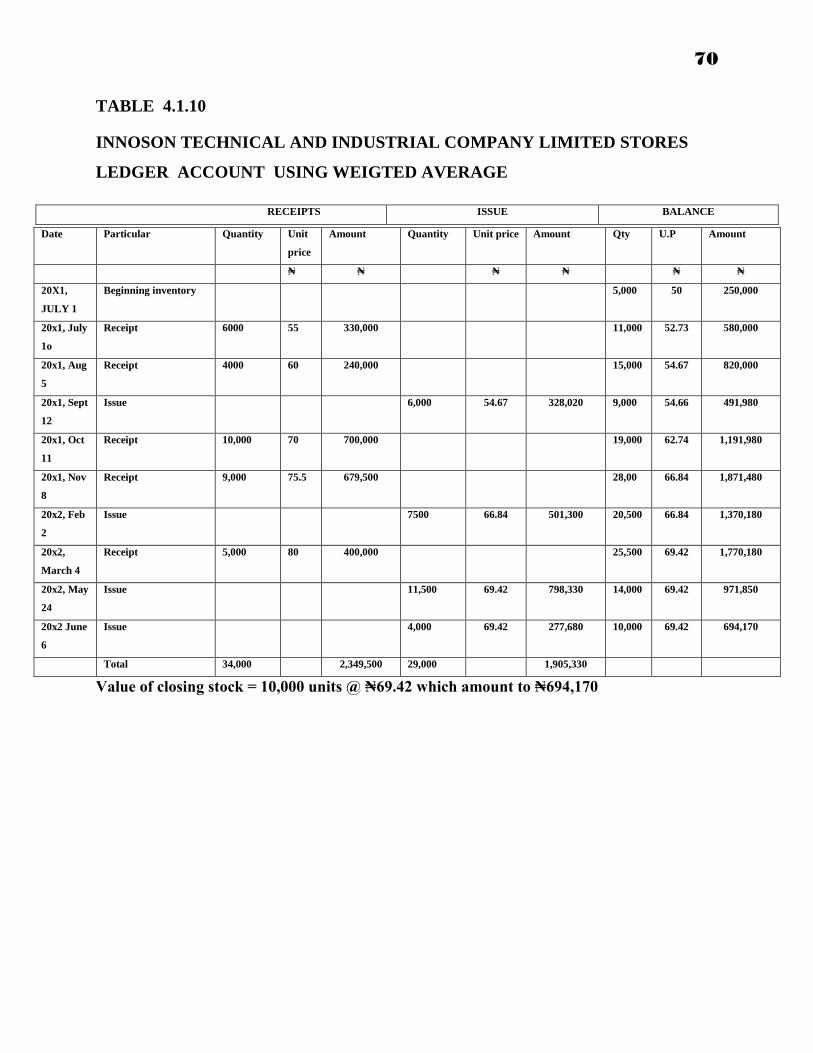
TABLE 4.1.10
INNOSON TECHNICAL AND INDUSTRIAL COMPANY LIMITED STORES
LEDGER ACCOUNT USING WEIGTED AVERAGE
RECEIPTS ISSUE BALANCE
Value of closing stock = 10,000 units @ ₦69.42 which amount to ₦694,170
Date Particular Quantity Unit
price
Amount Quantity Unit price Amount Qty U.P Amount
₦ ₦ ₦ ₦ ₦ ₦
20X1,
JULY 1
Beginning inventory 5,000 50 250,000
20x1, July
1o
Receipt 6000 55 330,000 11,000 52.73 580,000
20x1, Aug
5
Receipt 4000 60 240,000 15,000 54.67 820,000
20x1, Sept
12
Issue 6,000 54.67 328,020 9,000 54.66 491,980
20x1, Oct
11
Receipt 10,000 70 700,000 19,000 62.74 1,191,980
20x1, Nov
8
Receipt 9,000 75.5 679,500 28,00 66.84 1,871,480
20x2, Feb
2
Issue 7500 66.84 501,300 20,500 66.84 1,370,180
20x2,
March 4
Receipt 5,000 80 400,000 25,500 69.42 1,770,180
20x2, May
24
Issue 11,500 69.42 798,330 14,000 69.42 971,850
20x2 June
6
Issue 4,000 69.42 277,680 10,000 69.42 694,170
Total 34,000 2,349,500 29,000 1,905,330
71
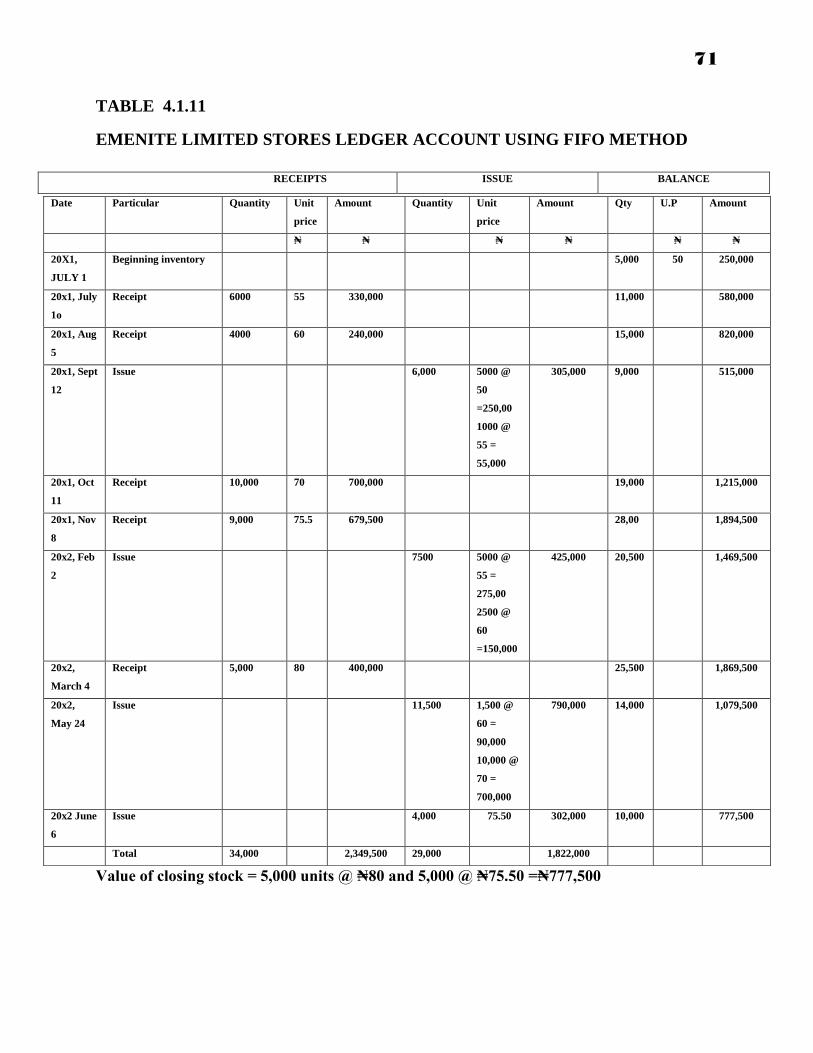
TABLE 4.1.11
EMENITE LIMITED STORES LEDGER ACCOUNT USING FIFO METHOD
RECEIPTS ISSUE BALANCE
Value of closing stock = 5,000 units @ ₦80 and 5,000 @ ₦75.50 =₦777,500
Date Particular Quantity Unit
price
Amount Quantity Unit
price
Amount Qty U.P Amount
₦ ₦ ₦ ₦ ₦ ₦
20X1,
JULY 1
Beginning inventory 5,000 50 250,000
20x1, July
1o
Receipt 6000 55 330,000 11,000 580,000
20x1, Aug
5
Receipt 4000 60 240,000 15,000 820,000
20x1, Sept
12
Issue 6,000 5000 @
50
=250,00
1000 @
55 =
55,000
305,000 9,000 515,000
20x1, Oct
11
Receipt 10,000 70 700,000 19,000 1,215,000
20x1, Nov
8
Receipt 9,000 75.5 679,500 28,00 1,894,500
20x2, Feb
2
Issue 7500 5000 @
55 =
275,00
2500 @
60
=150,000
425,000 20,500 1,469,500
20x2,
March 4
Receipt 5,000 80 400,000 25,500 1,869,500
20x2,
May 24
Issue 11,500 1,500 @
60 =
90,000
10,000 @
70 =
700,000
790,000 14,000 1,079,500
20x2 June
6
Issue 4,000 75.50 302,000 10,000 777,500
Total 34,000 2,349,500 29,000 1,822,000
72
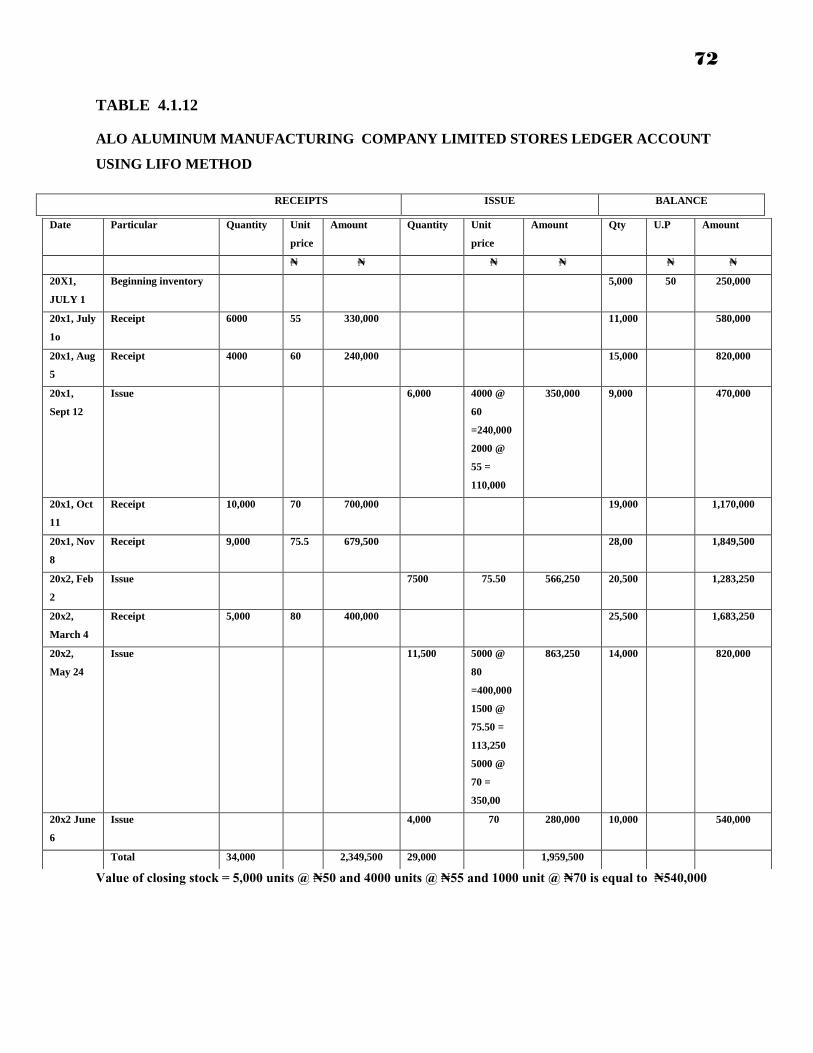
TABLE 4.1.12
ALO ALUMINUM MANUFACTURING COMPANY LIMITED STORES LEDGER ACCOUNT
USING LIFO METHOD
RECEIPTS ISSUE BALANCE
Value of closing stock = 5,000 units @ ₦50 and 4000 units @ ₦55 and 1000 unit @ ₦70 is equal to ₦540,000
Date Particular Quantity Unit
price
Amount Quantity Unit
price
Amount Qty U.P Amount
₦ ₦ ₦ ₦ ₦ ₦
20X1,
JULY 1
Beginning inventory 5,000 50 250,000
20x1, July
1o
Receipt 6000 55 330,000 11,000 580,000
20x1, Aug
5
Receipt 4000 60 240,000 15,000 820,000
20x1,
Sept 12
Issue 6,000 4000 @
60
=240,000
2000 @
55 =
110,000
350,000 9,000 470,000
20x1, Oct
11
Receipt 10,000 70 700,000 19,000 1,170,000
20x1, Nov
8
Receipt 9,000 75.5 679,500 28,00 1,849,500
20x2, Feb
2
Issue 7500 75.50 566,250 20,500 1,283,250
20x2,
March 4
Receipt 5,000 80 400,000 25,500 1,683,250
20x2,
May 24
Issue 11,500 5000 @
80
=400,000
1500 @
75.50 =
113,250
5000 @
70 =
350,00
863,250 14,000 820,000
20x2 June
6
Issue 4,000 70 280,000 10,000 540,000
Total 34,000 2,349,500 29,000 1,959,500

73
Table 4.1.13 THE IMPACT OF THE DIFFFERENT INVENTORY
VALUATION METHODS ON THE FIRMS FINANCIAL REPORT
STATEMENT (INCOME STATEMENT). COMPARATIVE INCOME
STATEMENT FOR THE YEAR ENDED 30TH
JUNE 20X2
PARTICULAR
INNOSON TECH EMENITE ALO
Turn over(sales)
Less: cost of goods
sold:
Opening inventory
Add: purchases
COGAS
Less: closing
inventory
COGS
Gross profit
Add: other
incomes
Less: expenses
Depreciation
Admin expenses
Net profit before
tax
Less: tax @ 30%
Net profit after tax
₦
3,560,000
250,000
2,349,000
2599500
(694170)
1,905,330
1,654,670
80,000
1,734,670
(165,000)
(100,000)
1,469,670
(440,901)
1028769
₦
3,560,000
250,000
2,349,000
2599500
(777,500)
1,822,000
1,738,000
80,000
1,818,000
(165,000)
(100,000)
1,553,000
(465,900)
1,087,100
₦
3,560,000
250,000
2,349,000
2599500
(540,000)
2,059,500
1,500,500
80,000
1,580,500
(165,000)
(100,000)
1,315,500
(394,650)
920,850
The analysis done above has shown different values for closing inventory,
cost of goods sold, assessable profit (profit before tax) and the taxation of these
companies as well as their profit after tax.
74
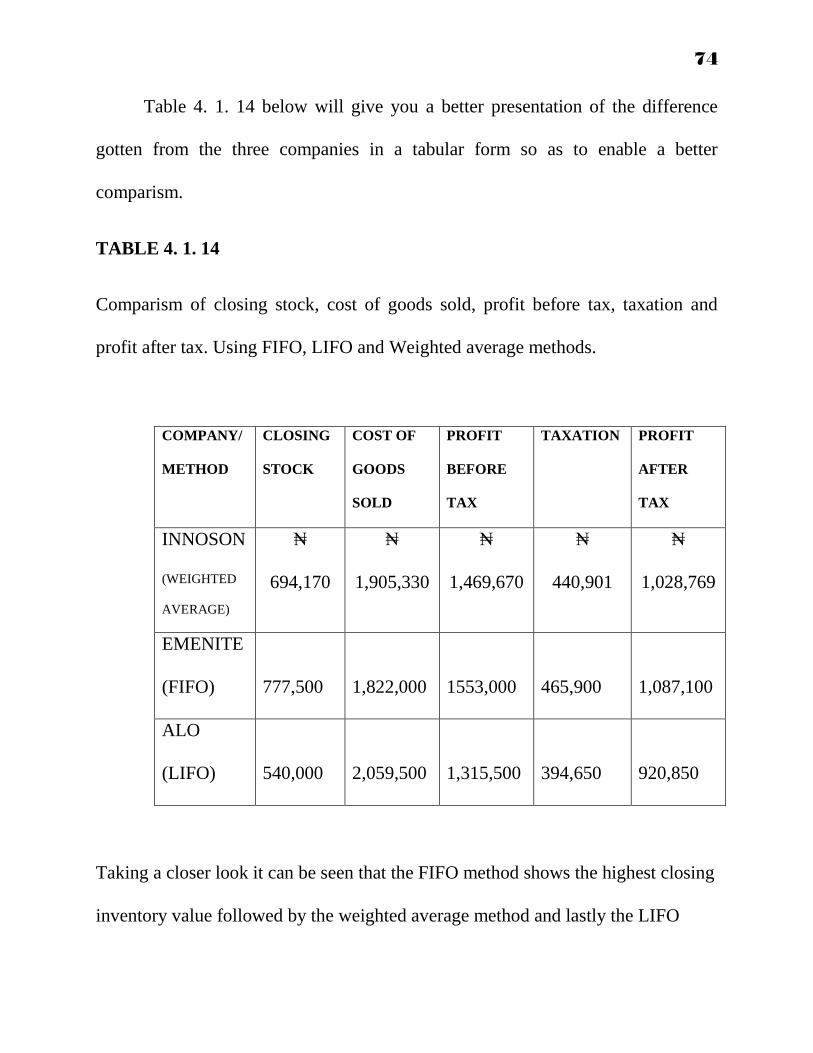
Table 4. 1. 14 below will give you a better presentation of the difference
gotten from the three companies in a tabular form so as to enable a better
comparism.
TABLE 4. 1. 14
Comparism of closing stock, cost of goods sold, profit before tax, taxation and
profit after tax. Using FIFO, LIFO and Weighted average methods.
COMPANY/
METHOD
CLOSING
STOCK
COST OF
GOODS
SOLD
PROFIT
BEFORE
TAX
TAXATION PROFIT
AFTER
TAX
INNOSON
(WEIGHTED
AVERAGE)
₦
694,170
₦
1,905,330
₦
1,469,670
₦
440,901
₦
1,028,769
EMENITE
(FIFO)
777,500
1,822,000
1553,000
465,900
1,087,100
ALO
(LIFO)
540,000
2,059,500
1,315,500
394,650
920,850
Taking a closer look it can be seen that the FIFO method shows the highest closing
inventory value followed by the weighted average method and lastly the LIFO
75
method. These will inversely result in the cost of goods sold for FIFO being the
lowest, followed by weighted and then LIFO method being the highest. With these
values the profit before tax will take the same direction with the closing stock
values. That is, with a high cost of goods sold, the LIFO method will report the
lowest profit figure before tax whereas the FIFO method which has the lowest cost
of goods sold will report the highest profit before tax figure. The weighted average
method still maintains the middle profit before tax.
Finally, the company taxation as well as the profit after tax for the
companies is highest using FIFO and lowest using LIFO method while the
weighted average is still in between both levels.
4.2 TESTING OF HYPOTHESES
To carry out this study successfully, the following three (3) hypothesis
formulated in the previous chapter (chapter one) of this research work shall be
examined by subjecting them to some statistical test using the regression co-
efficient analysis. This is to determine the validity or otherwise of the hypothesis
HYPOTHESIS ONE
HO: Inventory valuation methods do not have any impact on the assessable
income tax of Nigerian manufacturing companies.

76
H1: Inventory valuation method has an impact on the assessable income tax of
Nigerian manufacturing companies.
To test this hypothesis, the researcher used the responses on question one.
The data collected are presented on a table below.
Table 4.2.1
RESPODENTS XI YI XI2 YI
2 XIYI
ACCOUNTANTS 11 20 121 400 220
MANAGERS 10 21 100 441 210
DIRECTORS 6 14 36 196 84
STAKEHOLDERS 7 13 49 169 91
MARKETERS 6 12 36 144 72
TOTAL ∑ ∑ ∑ ∑ ∑
X = 40
5 = 8
Y = 80
5 = 16

77
Formular:
b = X1Y1 – nXIYI
X12 – nXI
2
a = Y – bX
b = 677 – 5(8)(16)
342 - 5(8)2
b = 677 – 640
342 – 5(64)
b = 677 – 640
342 – 320
b = 37
22
b =1.68
a= 16 – 1.68(8)
a= 16 – 13.44
a= 2.56
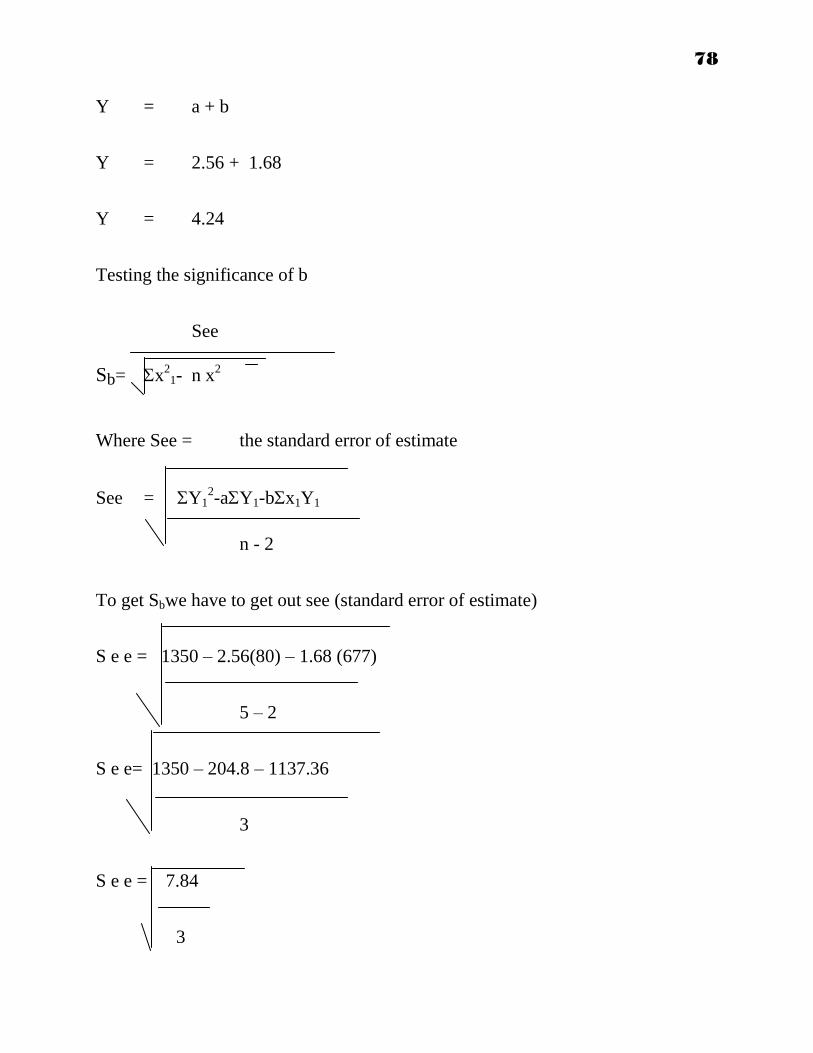
78
Y = a + b
Y = 2.56 + 1.68
Y = 4.24
Testing the significance of b
See
Sb= x21- n x
2
Where See = the standard error of estimate
See = Y12-aY1-bx1Y1
n - 2
To get Sbwe have to get out see (standard error of estimate)
S e e = 1350 – 2.56(80) – 1.68 (677)
5 – 2
S e e= 1350 – 204.8 – 1137.36
3
S e e = 7.84
3

79
S e e = 2.613
S e e = 1.617
1.617
Sb= 342 – 5(8)2
1.617
Sb= 342 – 5(64)
1.617
Sb= 342 – 320
1.617
Sb= 22
Sb = 1.617
4.69
Sb = 0.35
:. Z test = b
Sb

80
= 1.68
0.35
= 4.8
Critical value of Z table as 3 degree of 5% level of significance is 0.9989
DECISION RULE:
Calculated value = 4.8
Table value = 0.9989
0.9989 < 4.8. therefore we reject the null hypothesis (Ho). This means that
inventory valuation methods has an impact on the assessable income tax of Nigeria
manufacturing companies.
HYPOTHESIS TWO
HO2: The prevailing Economic parameters does not influence the inventory
valuation methods used by Nigeria manufacturing companies.

81
H12: The prevailing Economic parameters influences the inventory valuation
methods used by Nigeria manufacturing companies.
To test this hypothesis, the researcher used the responses on question two. The data
collected are presented on the table below
Table 4.2.1
RESPODENTS XI YI XI2 YI
2 XIYI
ACCOUNTANTS 11 20 121 400 220
MANAGERS 7 13 49 169 91
DIRECTORS 13 18 169 324 234
STAKEHOLDERS 9 11 81 121 99
MARKETERS 7 11 49 121 77
TOTAL ∑ 47 ∑ ∑ 469 ∑ 1135 ∑
X = 47
5 = 9.4
Y = 73
5 = 14.6
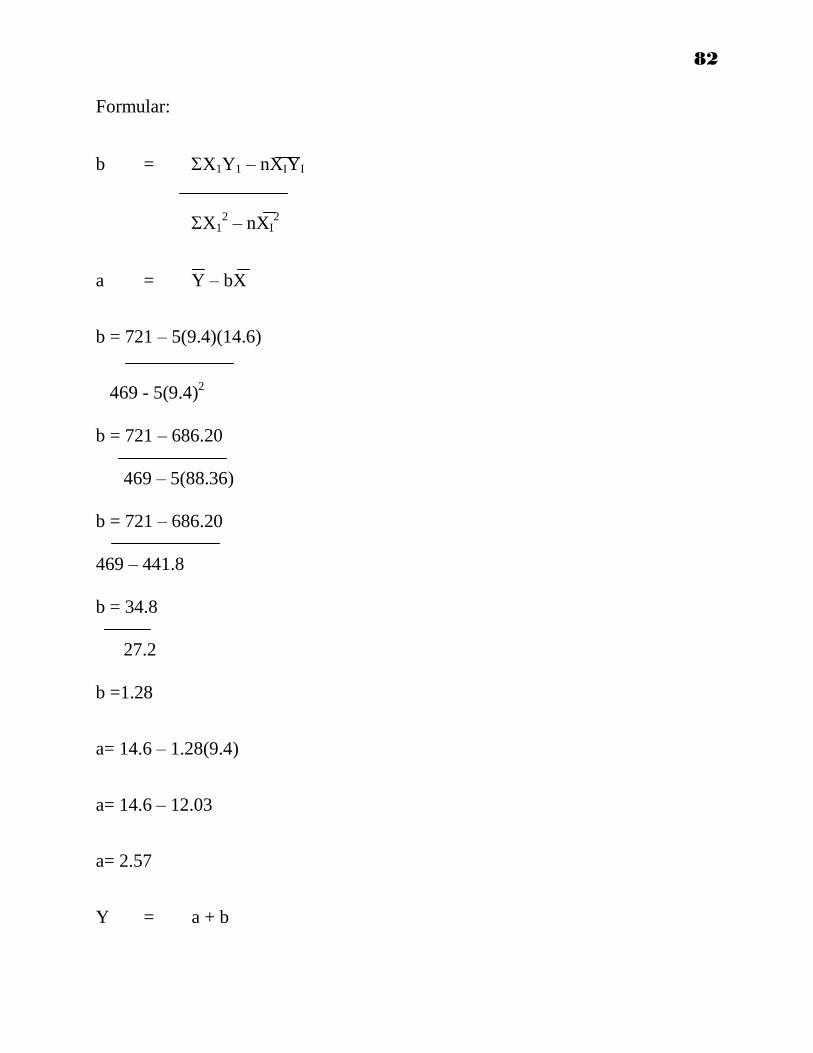
82
Formular:
b = X1Y1 – nXIYI
X12 – nXI
2
a = Y – bX
b = 721 – 5(9.4)(14.6)
469 - 5(9.4)2
b = 721 – 686.20
469 – 5(88.36)
b = 721 – 686.20
469 – 441.8
b = 34.8
27.2
b =1.28
a= 14.6 – 1.28(9.4)
a= 14.6 – 12.03
a= 2.57
Y = a + b
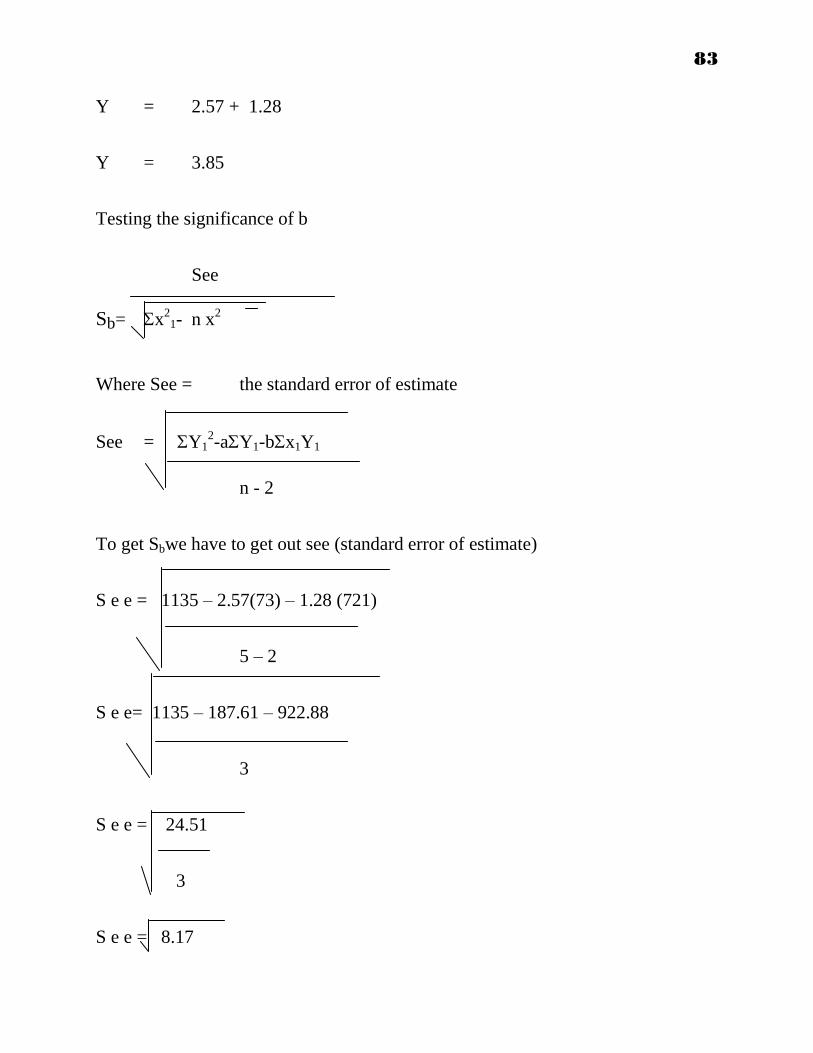
83
Y = 2.57 + 1.28
Y = 3.85
Testing the significance of b
See
Sb= x21- n x
2
Where See = the standard error of estimate
See = Y12-aY1-bx1Y1
n - 2
To get Sbwe have to get out see (standard error of estimate)
S e e = 1135 – 2.57(73) – 1.28 (721)
5 – 2
S e e= 1135 – 187.61 – 922.88
3
S e e = 24.51
3
S e e = 8.17
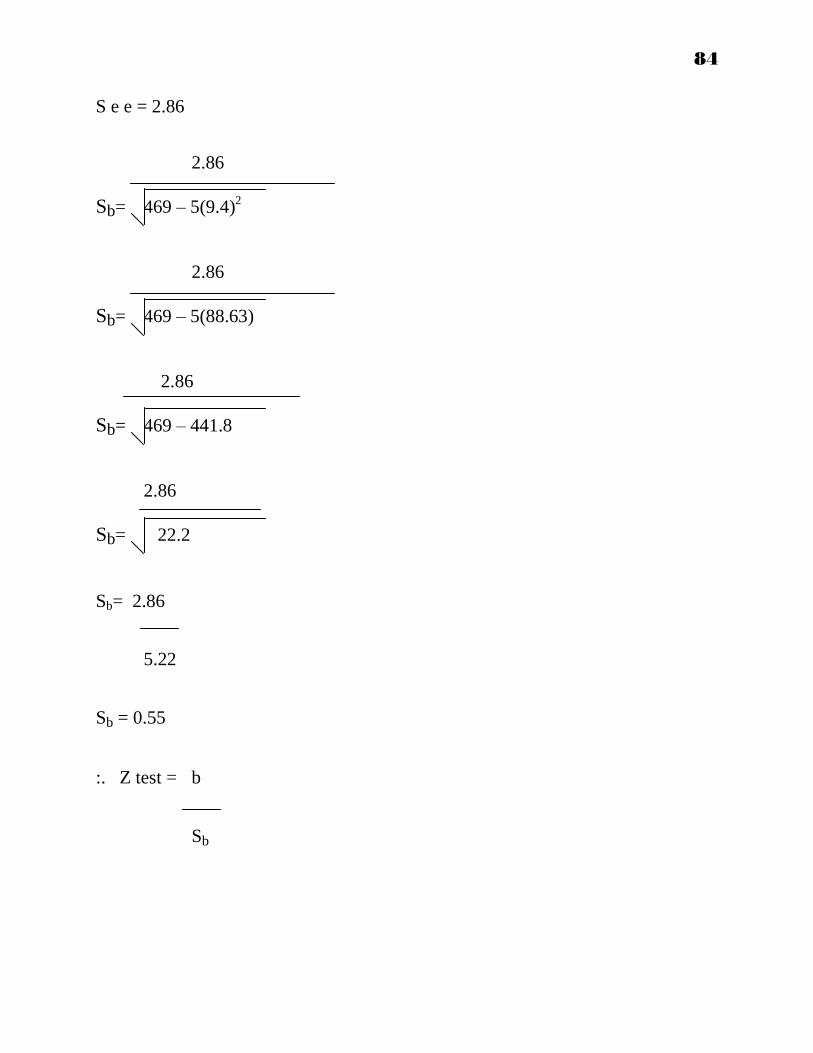
84
S e e = 2.86
2.86
Sb= 469 – 5(9.4)2
2.86
Sb= 469 – 5(88.63)
2.86
Sb= 469 – 441.8
2.86
Sb= 22.2
Sb= 2.86
5.22
Sb = 0.55
:. Z test = b
Sb

85
= 1.28
0.55
= 2.33
Critical value of Z table as 3 degree of 5% level of significance is 0.9989
DECISION RULE:
Calculated value = 2.33
Table value = 0.9989
0.9989 < 2.33 therefore we reject the null hypothesis (Ho). This means that the
prevailing economic parameters influences the inventory valuation methods used
by Nigeria manufacturing companies.
HYPOTHESIS THREE
H03: The variances in inventory valuation methods dose not affect financial
reporting positions of Nigerian manufacturing companies.
H13: The variances in inventory valuation methods affects financial reporting
positions of Nigerian manufacturing companies.
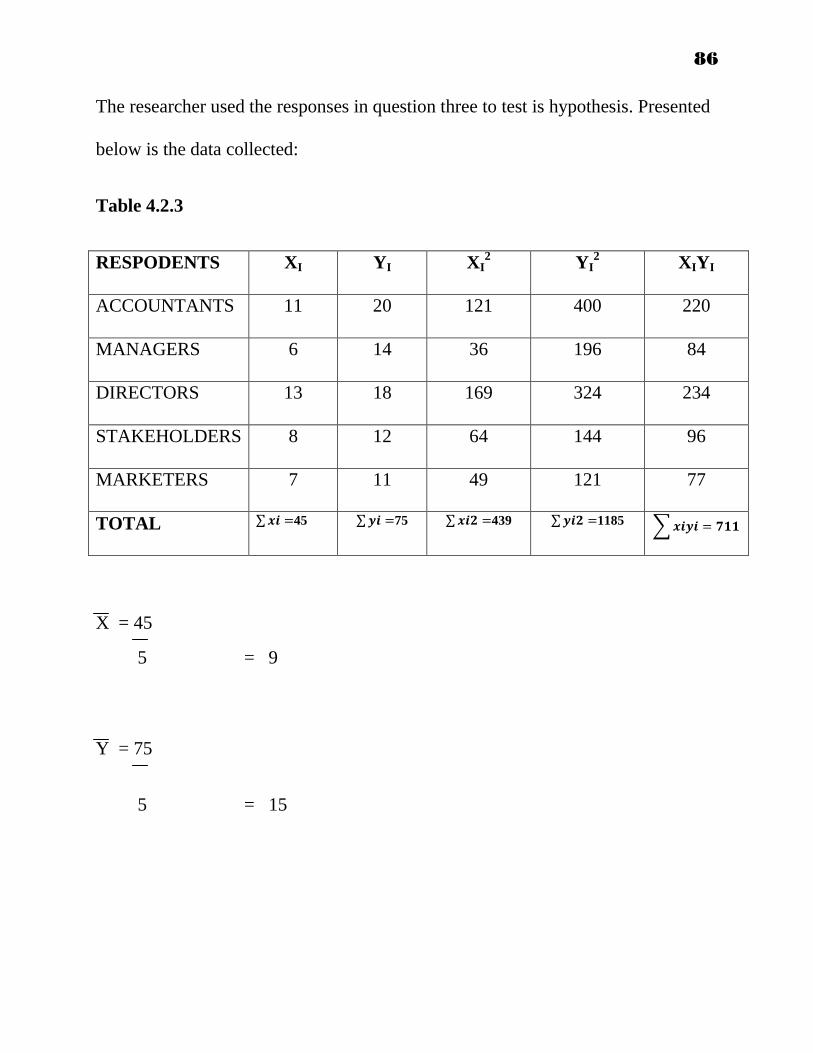
86
The researcher used the responses in question three to test is hypothesis. Presented
below is the data collected:
Table 4.2.3
RESPODENTS XI YI XI2 YI
2 XIYI
ACCOUNTANTS 11 20 121 400 220
MANAGERS 6 14 36 196 84
DIRECTORS 13 18 169 324 234
STAKEHOLDERS 8 12 64 144 96
MARKETERS 7 11 49 121 77
TOTAL ∑ 45 ∑ 75 ∑ 439 ∑ 1185 ∑
X = 45
5 = 9
Y = 75
5 = 15
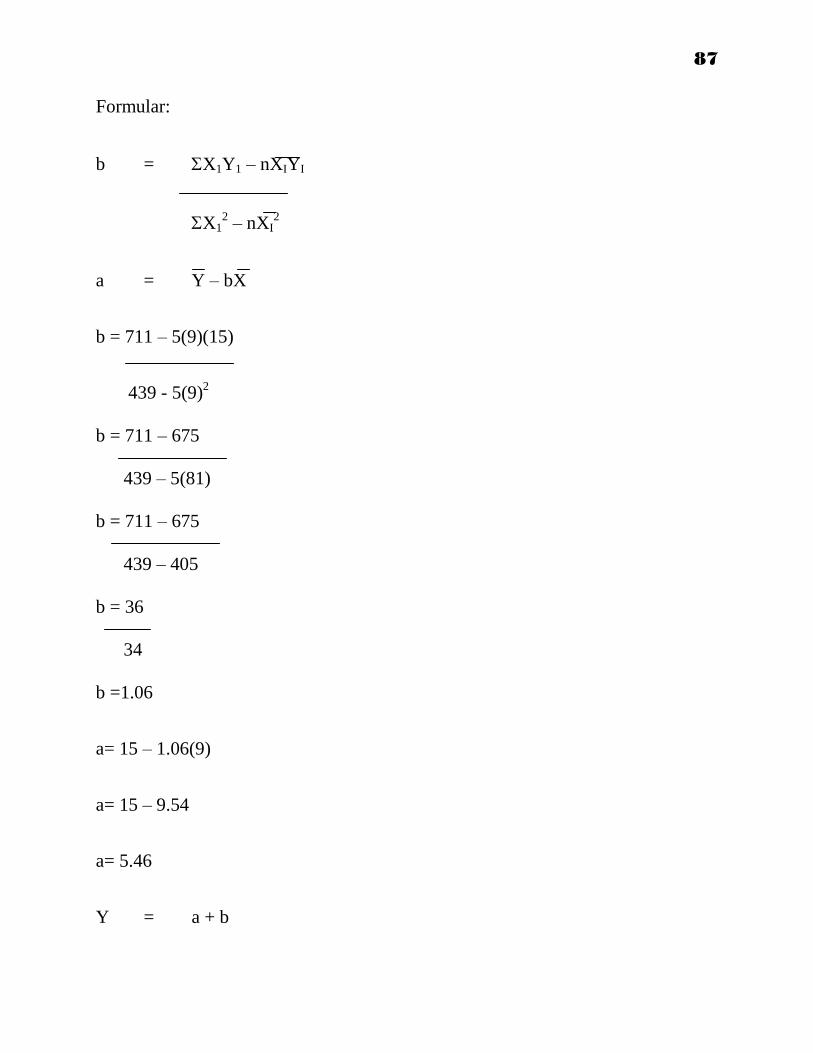
87
Formular:
b = X1Y1 – nXIYI
X12 – nXI
2
a = Y – bX
b = 711 – 5(9)(15)
439 - 5(9)2
b = 711 – 675
439 – 5(81)
b = 711 – 675
439 – 405
b = 36
34
b =1.06
a= 15 – 1.06(9)
a= 15 – 9.54
a= 5.46
Y = a + b

88
Y = 5.46 + 1.06
Y = 6.52
Testing the significance of b
See
Sb= x21- n x
2
Where See = the standard error of estimate
See = Y12-aY1-bx1Y1
n - 2
To get Sbwe have to get out see (standard error of estimate)
S e e = 1185 – 5.46(75) – 1.06 (711)
5 – 2
S e e= 1185 – 409.5 – 753.66
3
S e e = 21.84
3
S e e = 7.28

89
S e e = 2.7
2.7
Sb= 439 – 5(9)2
2.7
Sb= 439 – 5(81)
2.7
Sb= 439 – 405
2.7
Sb= 34
Sb = 2.7
5.83
Sb = 0.46
:. Z test = b
Sb
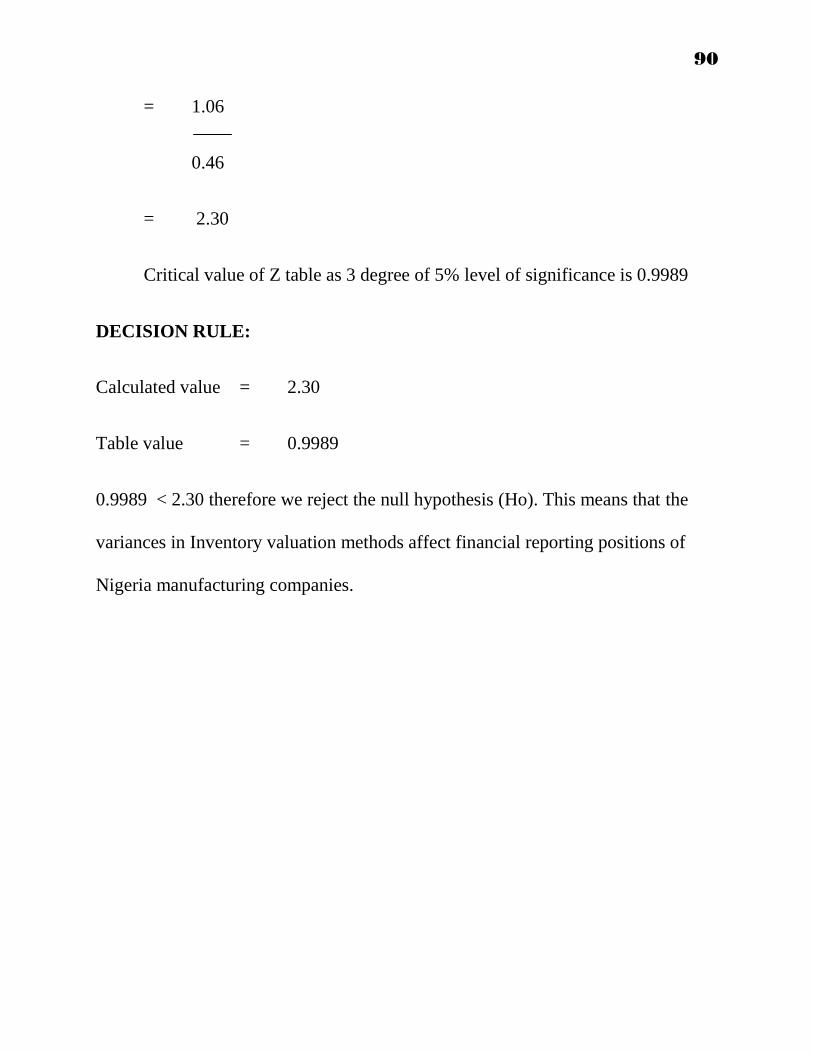
90
= 1.06
0.46
= 2.30
Critical value of Z table as 3 degree of 5% level of significance is 0.9989
DECISION RULE:
Calculated value = 2.30
Table value = 0.9989
0.9989 < 2.30 therefore we reject the null hypothesis (Ho). This means that the
variances in Inventory valuation methods affect financial reporting positions of
Nigeria manufacturing companies.
91
CHAPTER FIVE
SUMMARY OF FINDINGS, RECOMMENDATIONS AND CONCLUSION
5.1 SUMMARY OF FINDINGS
From the outcome of the analysis and interpretation as they relate to the
questions in the questionnaire for this study and also as they relate to the testing of
hypothesis, the following findings were made and summarized as follows:
1. The responses received to research questions one, five and eight established
the fact that inventory valuation methods has an impact on the financial statement.
From the responses given by the respondents it was gotten that it has a high
significance.
2. It was also discovered from the responses to question nine in the
questionnaire that firms are allowed to choose their own method of inventory
valuation as far as such methods will be consistent and does not conflict with the
provision of any known Nigerian or international legislation in accounting, or
conflict with stock valuation generally accepted for the purposes.
3. The researcher also discovered that the Last-In-First-Out method is more
suitable in inflationary market conditions. This is due to the fact that the higher
costs of recent purchases are charged to operations thus reducing the profit figure
reported.
92
4. The researcher discovered that the weighted average price method has a
hybrid effect in charging material cost of stock to operations. The FIFO on the
other hand overstates profit figure during periods of inflationary market trends
thereby resulting in high taxes. It therefore does not adequately incorporate the
prevailing market condition and hence profit reported under FIFO method cannot
be relied upon by investors in arriving at a viable investment decision.
5. The researcher also discovered that the weighted average price method leads
to unrealized profit or loss as they are charged to production at an average cost but
the FIFO and LIFO methods charge cost of inventories at actual cost and does not
give rise to unrealized profit or loss in periods of inflation or depressed market
situation.
6. We also discovered that the prevailing market situation plays a lot of role or
impact on the value of ending stock. If an economy is experiencing an inflationary
market situation, the different methods will result in ending stock having different
values. Also if it is in a depressed economy, the opposite of what is observed under
FIFO will be seen under LIFO. This variation in closing stock values will affect the
profit before tax, tax paid to government and amount of profit available for
shareholder (profit after tax)
93
5.2 RECOMMENDATIONS
There are several factors that make the application of a particular method of
inventory valuation impossible, and the need for consistency in a particular method
in order to enhance comparism of achievement attained in a period with that of the
previous periods.
Therefore the SAS 4 issued by the NASB seeks to bridge the gap that subsists
in the use of diverse inventory valuation methods by setting a standard for the
valuation and presentation of items of stock in the context of historical cost
conventions. This Nigeria accounting standard board (NASB) however selects
some method to be used in evaluating inventory and those selected methods are
applicable under certain situations.
As noted earlier, the FIFO method is good for tax purposes during inflationary
periods while the LIFO method is good for tax purposes for tax purposes during
periods of falling prices.
Nevertheless, the average price method which is a midway between LIFO,
FIFO and the standard price method could be more realistic in face of modern
economic trends. The average method will also have the benefit of acting as an
equalizer between factor inputs costs and factor outputs value so that tax authority
do not exploit the business unnecessarily. Therefore, there would be a balance

94
between the benefits accruing to the tax authority and the owners of a firm without
either of the party being better or worst off at the expense of the other.
Another justification for recommending the weighted average method is on
the ground that the method tends to smoothen price fluctuations, thus making input
cost of products appear realistic.
As a result of the fact that the use of diverse method of inventory valuation
and reporting gives rise to wide disparity in the financial results of a companies
operations, it is recommended that financial statement disclose in the notes to the
accounts the method applied, and any change from the previous method used. This
recommendation is in accordance with SAS 1and SAS 4.
We finally recommended the use of the weighted average method of valuing
inventory. The reason being that, it does not give rise to any unrealized profit and it
will enhance uniformity in presentation of a true and fair view of the statement of
affairs and to highlight the hybrid effect of other methods such as standard price,
LIFO and FIFO methods.
The accountancy professional bodies and accounting regulatory authorities are
hereby called upon to examine critically the issue of using the average price
method as the acceptable stock valuation model.

95
5.3 CONCLUSION
This research work was directed towards a comparative analysis or review of
the different inventory valuation methods and their impact on the financial
statements. The findings amongst other things reveal that factor such as custom of
the firm, auditor‟s advice to client, taxation, convenience, nature of stock, lack of
relevant information, etc might influence the decision regarding the choice of a
method.
This decision will vary depending on the opinion or attitude of those who are
responsible for valuing inventory in a company or enterprise.
It is pertinent to assert that pending the general acceptance and adoption of
the researcher‟s recommendation by the Nigerian Accounting Standard Board and
other Accounting Professional Standard making bodies, that any method of
valuation could be applied. The reason being that there is no one universally
accepted method of inventory valuation yet.
Furthermore, the over- riding consideration in a choice of method in all
circumstances is the need to give a “true and fair view” of a state of affairs of an
entity. It is therefore very important for organizations to be consistent in the
application of a specific method from time to time unless changes in circumstances
have prevented such consistency; however where there is a change from a

96
particular method to another, the disclosure of such change of method is of
paramount importance.
Finally, the Accounting professional bodies should put the recommendation
of making weighted average method of inventory valuation a recommended
method for manufacturing companies into consideration in an attempt to evolve an
acceptable and more realistic method of valuing inventories.

97
BIBLIOGRAPHY
Adeniyi, A. A. (2009).Cost Accounting; A managerial Approach. El- Toda
Ventures Ltd.
Anyibo, C. I .(1999).Cost and Marginal Accounting.Enugu; Hugolex Publication.
Ekwe, M. E .(2003).An Insight into Costing.Enugu; Two Way Printers Nigeria.
Enekwe, C. I.(2010).Basic Fundamentals in Accounting. Volume Two. Enugu;
Providence Press Nig. Limited
Eyisi, S.A .(2003).Cost Accounting Theories and Practice.Enugu; Ayi- Best
Publishers.
Frankwood& Alan Sangster.(2008).Business Accounting (11th Edition) IFRS
Edition.Harlow : Pearson Education Ltd Publication.
Horngren, C. T & George Foster .(2011). Cost Accounting;A Managerial Emphasis
(14th
Edition). London: Prentice Hall.
Karen, W. B. (2012).Managerial Accounting (3rd
Edition). London: Prentice Hall
Larson, K. D, et al.(2002).Fundamental Accounting Principles. Ryerson: McGraw
– Hill.

98
Lucy, T (2003).Management Accounting.Great Britain: DP Publications.
Monwubba, A. O. (1995).Principles and Practice of Cost Accounting.Enugu : B-
Teks Publishers
Nweze, A. U (2004).Quantitative Approach to Management Accounting (3rd
Edition). Enugu: Computer Edge Publishers.
Nwoha,C .(1995).Advanced Financial Accounting.Enugu; Valson W. A Press Ltd
Okwo, I. M (2003).Cost Accounting. Enugu; Computer Edge Publishers
Omelehinwa, E. O .(2011).Coping With Cost Accounting (2nd
Edition).Pumark
Publishers, Nigeria.
Peter, C. B et al. (2009):.Introduction to Managerial Accounting: McGraw- Hill/
Irwin
Walter, et al (2009.Managerial Accounting (2nd
Edition). London ; Prentice Hall
JOURNALS
Journal of Academy of Business and Economic (2010). Volume 10, Source Issue:3;
Int‟l Academy of Business and Economics Publications.
99
APPENDIX A
DEPARTMENT OF ACCOUNTANCY
CARITAS UNIVERSITY
AMORJI- NIKE
P. M. B 01784
EMENE
ENUGU STATE
Dear Respondent,
I am an undergraduate student of the above named institution. I am
undertaking a research on the topic “Inventory valuation methods in manufacturing
companies. A comparative analysis of the impact on financial report statement”. A
case study of some manufacturing companies in Enugu State. The research work is
for the partial fulfillment of the award of Bachelor of Science (B. Sc.).
Please be assured of your anonymity as the information provided by you will
be treated in the strictest confidence.
I shall be very grateful if you give answers to the attached questionnaire to
the best of your knowledge. Thanks for your co-operation.
Yours faithfully,
MORGAN, ACCEPTANCE OKON
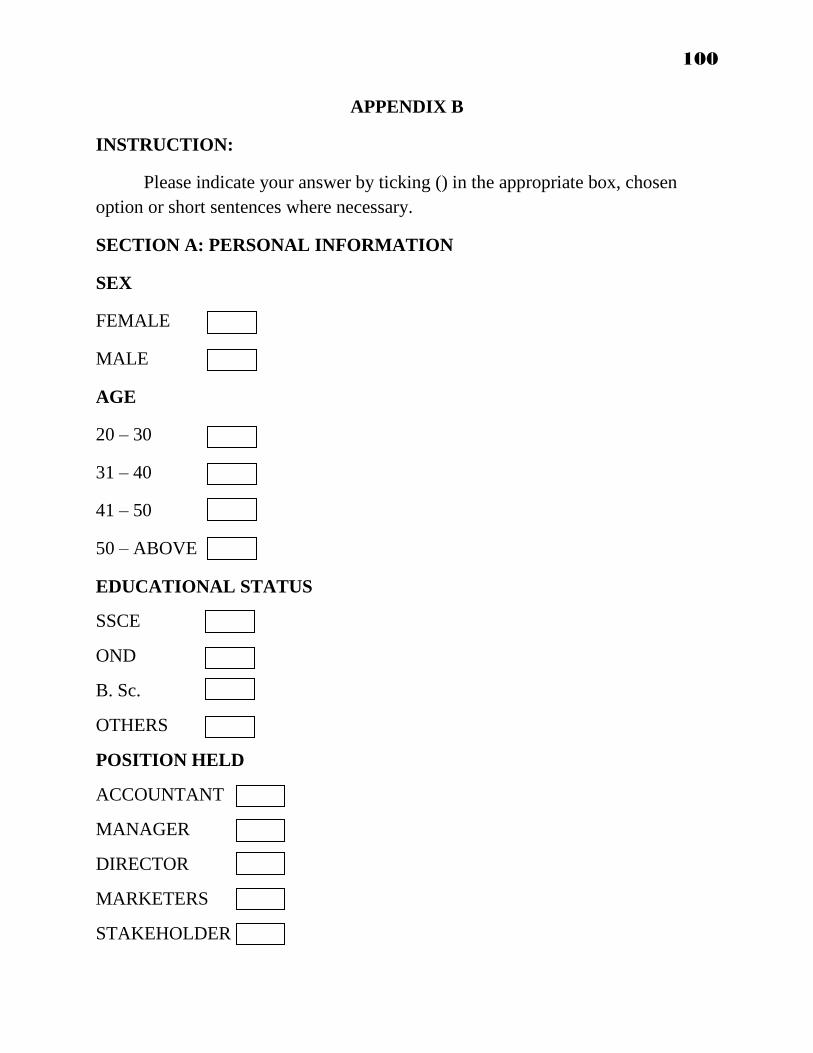
100
APPENDIX B
INSTRUCTION:
Please indicate your answer by ticking () in the appropriate box, chosen
option or short sentences where necessary.
SECTION A: PERSONAL INFORMATION
SEX
FEMALE
MALE
AGE
20 – 30
31 – 40
41 – 50
50 – ABOVE
EDUCATIONAL STATUS
SSCE
OND
B. Sc.
OTHERS
POSITION HELD
ACCOUNTANT
MANAGER
DIRECTOR
MARKETERS
STAKEHOLDER
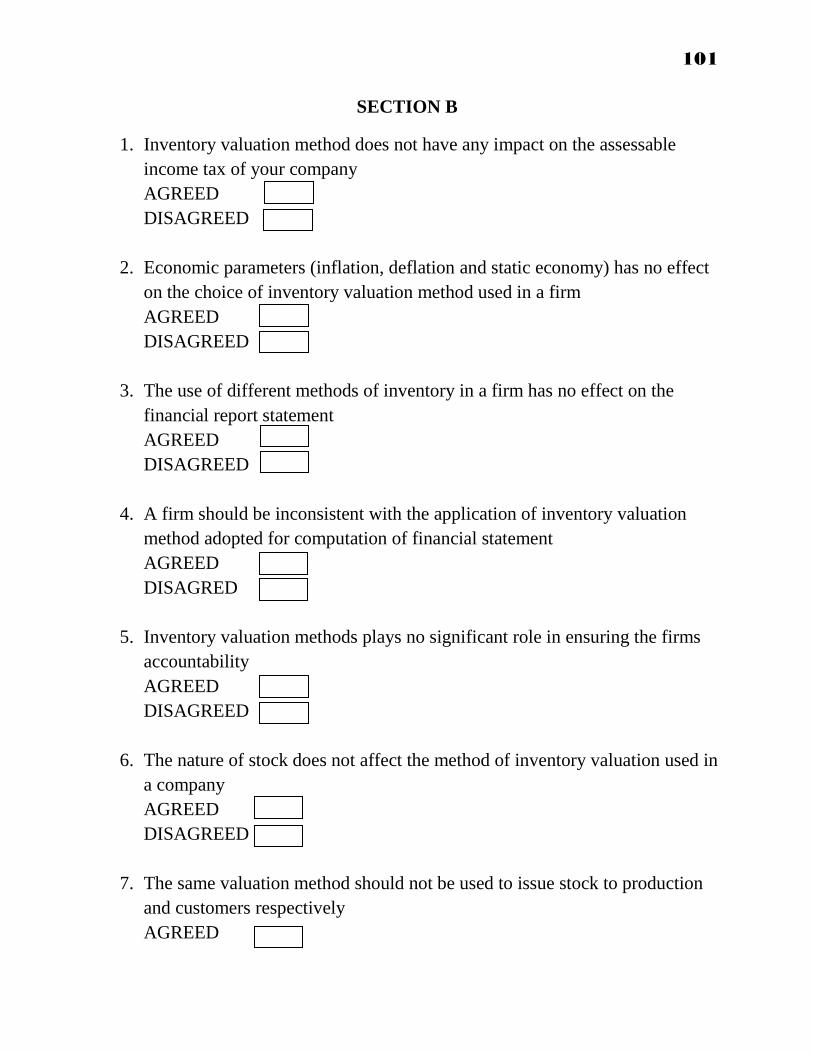
101
SECTION B
1. Inventory valuation method does not have any impact on the assessable
income tax of your company
AGREED
DISAGREED
2. Economic parameters (inflation, deflation and static economy) has no effect
on the choice of inventory valuation method used in a firm
AGREED
DISAGREED
3. The use of different methods of inventory in a firm has no effect on the
financial report statement
AGREED
DISAGREED
4. A firm should be inconsistent with the application of inventory valuation
method adopted for computation of financial statement
AGREED
DISAGRED
5. Inventory valuation methods plays no significant role in ensuring the firms
accountability
AGREED
DISAGREED
6. The nature of stock does not affect the method of inventory valuation used in
a company
AGREED
DISAGREED
7. The same valuation method should not be used to issue stock to production
and customers respectively
AGREED
102
DISAGREED
8. The inventory valuation method used by the company does not pay more or
less on tax
AGREED
DISAGREED
9. What method of inventory valuation does your company use?
10. Is there any method(s) you know which is/are recommended by the relevant
tax authority?
11. Is there any regulatory body or legislation imposing any identifiable
method?
12. What do you recommend generally to help improve and give adequate
attention to inventory valuation method in companies?