A Comparative Analysis of the Factors for Fostering Innovation in Brics
21
ASCI Journal of Management 41(1): 1–20 Copyright © 2011 Administrative Staff College of India Nirmalya Bagchi * A Comparative Analysis of the Factors for Fostering Innovation in BRICS Countries from 1995 to 2009 Abstract Recent studies have proved that innovation in a country improves its growth potential. The experience of Japan, Taiwan and other East Asian economies show that given the right interventions and availability of a suitable eco system, developing countries can catch up on technology and innovation. The BRICS countries are often regarded as the next set of emerging economies that are likely to tread a innovation driven high growth trajectory. The paper analyzes the input and output factors for fostering innovation in BRICS countries in 3 time periods; 1995–2002, 2003–2007, 2008–2009 and reports the results. Introduction Every nation seeks prosperity and well being. Contemporary literature on the topic suggests that though there is no unanimity on the choice of measure, more or less everyone agrees that the income, is an important indicator of material well being. Natural quest then is to identify the factors causing income growth. Recent studies have reopened this issue and have acknowledged that income growth cannot be explained only in terms of growth in capital and labour and that adequate emphasis should be placed on enriching human capital, innovation and technological progress. However, it is not easy for a developing country to catch up on technology and innovation with advanced countries. Sustained efforts and suitable interventions are often required. The experience of East Asian economies (particularly South Korea and Singapore) show that given the right interventions and availability of a suitable eco system, developing countries can catch up on technology and innovation. It is widely believed that the next set of countries, after the East Asian economies, that have potential to report a sustained high growth, coupled with high rate of technological progress and innovation are the fast growing countries - Brazil, Russia, India, China and South Africa (BRICS). These countries have indeed shown early signs of successfully leveraging technology. Together they accounted for about 17% of the global GDP in 2010. The high growth rate and the progress made by these countries in such high technology areas as ICT, pharmaceuticals, automobiles, and aerospace calls for a critical examination of the innovations and its structure in these countries. * Associate Professor, Administrative Staff College of India, Bella Vista, Raj Bhavan Road, Hyderabad 500082. Email: [email protected]
-
Upload
vineet-harit -
Category
Documents
-
view
220 -
download
3
Transcript of A Comparative Analysis of the Factors for Fostering Innovation in Brics

ASCI Journal of Management 41(1): 1–20
Copyright © 2011 Administrative Staff College of India
Nirmalya Bagchi*
A Comparative Analysis of the Factors for FosteringInnovation in BRICS Countries from 1995 to 2009
Abstract
Recent studies have proved that innovation in a country improves its growth potential. Theexperience of Japan, Taiwan and other East Asian economies show that given the rightinterventions and availability of a suitable eco system, developing countries can catch up ontechnology and innovation. The BRICS countries are often regarded as the next set of emergingeconomies that are likely to tread a innovation driven high growth trajectory. The paperanalyzes the input and output factors for fostering innovation in BRICS countries in 3 timeperiods; 1995–2002, 2003–2007, 2008–2009 and reports the results.
Introduction
Every nation seeks prosperity and well being. Contemporary literature on the topic suggeststhat though there is no unanimity on the choice of measure, more or less everyone agrees thatthe income, is an important indicator of material well being. Natural quest then is to identifythe factors causing income growth. Recent studies have reopened this issue and haveacknowledged that income growth cannot be explained only in terms of growth in capital andlabour and that adequate emphasis should be placed on enriching human capital, innovationand technological progress. However, it is not easy for a developing country to catch up ontechnology and innovation with advanced countries. Sustained efforts and suitable interventionsare often required. The experience of East Asian economies (particularly South Korea andSingapore) show that given the right interventions and availability of a suitable eco system,developing countries can catch up on technology and innovation.
It is widely believed that the next set of countries, after the East Asian economies, that havepotential to report a sustained high growth, coupled with high rate of technological progressand innovation are the fast growing countries - Brazil, Russia, India, China and South Africa(BRICS). These countries have indeed shown early signs of successfully leveraging technology.Together they accounted for about 17% of the global GDP in 2010. The high growth rate andthe progress made by these countries in such high technology areas as ICT, pharmaceuticals,automobiles, and aerospace calls for a critical examination of the innovations and its structurein these countries.
* Associate Professor, Administrative Staff College of India, Bella Vista, Raj Bhavan Road,Hyderabad 500082. Email: [email protected]

2 ASCI Journal of Management 41(1) September 2011
This paper is an attempt at analyzing some of the critical factors that help in fostering innovationin BRICS countries. Following introduction in section 1, a brief review of literature is presentedin section 2. Section 3 deals with research methodology adopted and datasets on which theanalysis of the paper is based and a brief overview of innovations in BRICS is presented insection 4. A critical analysis of the various factors necessary for innovation in BRICS countriesis elaborated in section 5. Discussion and conclusions are presented in section 6.
A brief review of literature
The study of economics has always focused on income growth even during the early days ofcapitalism. Production of surplus and its reinvestment in the economy for accelerating thegrowth rate of surplus had intuitively been considered as the basic issue for income growththat brings about material well being, right from the time of the Physiocrats1. However, recentstudies2 have given rise to a body of literature, which are sometimes clubbed together as thenew growth theories (Romer, 1990; Lucas 1988). These studies indicate that human capitaland technological progress3 (and innovations thereof) should be given adequate importance.Moreover, technological progress should also yield more innovations in a country for bettergrowth or else the technical edge developed by one country may be used by another for itscommercial exploitation. In his seminal works, Schumpeter (1938, 1939) has laid the foundation4
for the important role of innovation for economic growth and development.
1 The classical tradition developed from Adam Smith through Ricardo and John Stuart Mill, as alsoKarl Marx to some extent, had a deeper insight into the problem. In some way or other they dealtupon the relation between consumption, savings and investments while analyzing the sources ofsurplus and it’s recycling in the production process so that income growth leading to materialprosperity is attained. Technological progress and the constraint of diminishing return on land coupledwith the consumption behavior of the society has also been discussed at length while deliberatingupon the issues related to growth and stagnation or the stationary state. The absence of balancebetween savings and investment, in as much as the forces of savings are independent of the forcesbehind investment decisions, has been pointed out as the problem in the short run by John MaynardKeynes and a plethora of literature in the area of macroeconomic theory has been developed out ofit. The growth theory following the Keynesian reasoning as developed by Harrod and an alternativetheory mainly based on (non Keynesian) argument as proposed by Solow then ruled the world ofgrowth theory for a considerable time. Some other practitioners in the field had added the issue oftechnological progress that might cause a parametric shift in the production function to thesetheories.
2 The received wisdom in the theory of growth faced a serious challenge during 1970s and 1980swhen it was proved by the growth experience of some of the newly industrialized countries that thebasic assumption that capital and labor constitute the only building blocks of such theories should bereconsidered. Growth, as the experience suggested, does depend on savings and investments translatedin terms of capital and labor; but there is an added factor, which has a powerful contribution toincome growth. The conventional theories would hardly account for this factor and therefore theymarginalized it as ‘residual’.
3 Gerschenkron (1962) was the first to study the linkage between growth, development andtechnological progress. He pointed out the difficulties and challenges of developing countries tryingto catch up with developed countries, technologically.
4 Schumpeter (1938) identified a list of 5 types of innovation and his 2 volume thesis (Schumpeter,1939) identified the positive role played by innovation in an economy.

Bagchi Innovation in BRICS Countries 3
However, attaining technological progress for a developing country is not easy. It requiressustained and focused efforts from government and non government entities. The East Asianeconomies and Japan are probably the only examples of countries that have focused on attaininghigh growth through technological progress and innovation and have successfully achievedit. The evidence from the East Asian economies (Wade, 1990; Kim, 1980, 1997) and Japan(Johnson, 1982) point to the conscious efforts made in those countries by various entitiestowards developing technology and innovation capability and thereby attaining high growth.Kim (1997) after analyzing the South Korean experience posited that technological progress,and the innovation thereof, was a moving target and a country needs to continuously keep upefforts to remain at the cutting edge. Technological capability, he opines, is not attained justby achieving an edge in R&D but in the application of R&D and its commercial exploitation.Lall (1992) stresses the need for national technological capability, financial strength, highereducation, managerial capability, foreign technology acquisition for achieving high growththrough technological progress.
A more comprehensive approach of a national innovation system was first conceptualized byFreeman (1987) and later the concept has been refined (Freeman, 1995; Lundvall, 1988, 1992;Nelson, 1993; and Edquist, 1997). Many countries have a formal policy towards their nationalinnovation system and make continuous efforts in improving the innovation capacity. (Suarez-Villa, 1990; Griliches 1990; Trajtenberg, 1990).
Even when all stakeholders are making efforts to improve the technological and innovativecapacity of countries, one needs to continuously measure and monitor the effects of suchinterventions. The key to understanding the effectiveness of innovation improving interventionsis in identifying what to measure. The problems of measuring innovation capacity and assessingnational innovation systems have been dealt with by many scholars (Kravchenko, 2011; Lundvall,2007; Zhu, 2003; Freeman 2009) and there is no unanimity on a single set of metrics formeasuring innovation capacity. Aubert (2006) developed a set of 17 indicators for measuringthe effectiveness of a country’s innovation capacity. OECD (2005, 2006) also lays down thebroad criteria for measuring the innovation maturity of a country. Even though some modelsand measures are available for developed countries, they are prone to errors when measuringinnovation in developing countries. Moreover, innovation is a non linear process. Findingdirect relationships between input factors and output factors for innovation is a delicate task.
Articles in popular global press (The Economist, 2010; The New York Times, 2007) and aplethora of evidence based analysis and reports (Baskaran 2010; Ayyagari, 2006; Hu, 2008;UNESCO 2010, WIPO 2011) give an interesting account of innovations happening in emergingmarkets. Understandably, there is a lot of interest in innovations in emerging markets, but notmuch has been done in analyzing it, though with a few exceptions. (Intarakumnerd ; Choi,2011; Tiwari, 2011; Tseng 2009). Even less is known about the innovations from BRICS countriesand their comparative performance in building innovation capacity. However, the increasingimportance of both India and China in the field of R&D (King, 2004) is acknowledged in manycircles. In terms of FDI in R&D (UNCTAD, 2005), some of the BRICS countries perform well.
Comparative performance of BRICS countries both in terms of input and output factors ofinnovation is long overdue. This paper is an attempt to understand the performance of BRICScountries in building innovation capacity.

4 ASCI Journal of Management 41(1) September 2011
Methodology
The objective of this paper is to analyze (inter country comparison) some of the factors forimproving innovation in BRICS countries. The factors that are critically analyzed are thefollowing:
1. Total expenditure on R&D,2. Business expenditure on R&D,3. High-Tech exports,4. Total R&D personnel in business enterprise5. Total R&D personnel nationwide,6. Scientific Articles (Scientific articles published by origin of author),7. Number of patent applications filed for residents and non residents,8. Number of patents granted to residents,9. Total public expenditure on education per capita.
Factors 1, 2, 4, 5 and 9 may be considered as input factors and the rest (3, 6, 7 and 8) as output factors.
The factors of innovation in a (BRICS) country are each analyzed after aggregating data intothree time period. The first period is from 1995 to 2002, which represents a period of stabilityand low fluctuations for BRICS countries in which there is not much inter country differencein either the GDP or in other variables that influence innovation. This period is being referredto as ‘pre – high growth phase’. The second period is from 2003 to 2007, which represents aperiod before the financial crisis in which the BRICS countries show an almost exponentialgrowth in many variables that influence innovation. This is defined as the ‘high growth phase’in this paper and represents the most fruitful period in terms of the indicators for innovation inBRICS countries. The last period is 2008–2009, which represents the post financial crisis period.We are keen to understand the influence of the recent financial crisis on factors of innovationin BRICS. This despite the fact that we can only get possible early, trends in the two yearsafter the crisis.
Each factor is analyzed in aggregate form for the three time periods with inter BRICS countrycomparisons so that we may get some insight into the innovation trajectories of these countries.
Dataset
The entire dataset for the paper has been drawn from the following sources;
1. IMD Competitiveness Online (1995–2010)2. WIPO Statistics3. UNCTAD, FDI/TNC database (www.unctad.org/fdistatistics).4. NASDAQ database (www.nasdaq.com)
Innovation in BRICS
BRICS countries represent high growth economies which are showing similar trend of progressdespite spreading across four different continents. Together they accounted for about 17 percentof the world’s GDP in 2010 (see figure 1) BRICS as a block has also been active in internationalnegotiations at different fora, from climate change to WTO, and have acquired clout with otherdeveloping countries through trade ties. High growth of these countries even when the rest ofthe world is reeling in the global financial crisis is also a pointer to the inherent strengths of

Bagchi Innovation in BRICS Countries 5
these economies. For example, during and after the global financial crisis, both China andIndia keptup nearly double digits growth rates. Brazil is also showing a similar trend.
Figure 1: Percentage share of world GDP in market pricesin 2010 - BRICS and Rest of the World
Source: IMD World Competitiveness Online 1995–2011
Figure 2, shows the pattern of the movement of GDP from 1995 to 2010. It is evident that allthe BRICS countries show an upward yoy trend in their GDP values. Even the GDP (PPP) alsoshow a significant upward trend. All the BRICS countries are showing a robust upward trendin their GDP and given that the rest of the world is reeling from the aftershocks of the globalfinancial crisis. The growth of the BRICS countries should be juxtaposed with the crisis that isstill affecting large parts of the developed world (like the Euro zone crisis), to get a real pictureof the resilience of these economies. They have big domestic markets; follow policies thatpromote liberalization; attract huge amounts of FDI; have a fairly developed domestic R&Dsector with sufficient technical manpower; and are not dependent only on commodity cyclesfor growth. In short, they may blossom into developed countries in a few decades if the trendscontinue.
Figure 2: GDP in US Dollar Billions of BRICS countries from 1995–2010
Source: IMD Competitiveness Online (1995–2010)

6 ASCI Journal of Management 41(1) September 2011
BRICS countries are not only growing fast but are also growing on the strength of theirtechnological and innovation prowess. As figure 3 depicts, most of the BRICS countries havea healthy high technology export as a percentage of total manufactured goods exports, which,in the case of China is very high, touching the 30% mark. This clearly indicates that not onlyare the BRICS countries growing fast but they are growing on the strength of their technologicalprowess.
Figure 3: High technology exports as a percentage of total exports
Source: IMD Competitiveness Online (1995–2010)
BRICS countries are also showing early signs of innovation driven growth (UNESCO, 2010).
These countries have been successful in a lot of high technology and innovation driven industries
like commercial aviation (Brazil), fighter aircraft (China, India, Russia), ICT (India), composites
(India, Russia, China), sustainable technologies (Brazil), electronics and semiconductor devices
(China), speciality chemicals (China, India), and automobiles (China, India, South Africa). Of
the top 50 PCT applicants in the business organizations category, two were from BRICS
(WIPO, 2011); Huawei and ZTE.
Some of the notable innovations from the BRICS countries are automobiles (like the small
passenger car Nano) from Tata Motors in India, Embraer ERJ 190 a commercial jet aircraft from
Embraer-Empresa Brasileira de Aeronautica, Brazil, the ICT service companies of India, notably
Infosys, Tata Consultancy Services, Wipro, Mahindra Satyam, generic drug companies in India
who implement process innovation, military aircraft companies in Russia like Mikoyan (formerly
Mikoyan-and-Gurevich Design Bureau), Sukhoi Company (JSC), Yak Aircraft Corporation (formerly
A.S. Yakovlev Design Bureau JSC), Ilyushin Design Bureau, telecom electronics devices from
the telecom companies like Huawei and ZTE in China, IT companies like Baidu in China and
speciality chemical companies in China.
The BRICS countries also have a large number of companies listed in global stock markets like
NASDAQ which mostly lists new economy companies. In fact, the BRICS countries together
have 214 listed companies in NASDAQ with a combined market capitalization US $ 237
billion.

Bagchi Innovation in BRICS Countries 7
Table 1: Number, market capitalization and major industry sectorsof NASDAQ listed companies from BRICS countries.
Country Number of Market capitalization of Listed companies mainlyNASDAQ the NASDAQ listed from the industry sector
listed companies in August 2011companies (in US $ billion)
Brazil 21 104 Oil and Gas, Telecom, Aerospace,Banking
Russia — — —
India 11 40 Telecom, Pharmaceuticals, EDP,Banking
China 173 78 Software, Pharmaceuticals, Telecom,Semiconductor, Business Services,Aerospace, Automobile, EDP,Banking, Oil and Gas, Construction
South Africa 9 17 Precious Metals, Oil and Gas
Source: NASDAQ database http://www.nasdaq.com
Level and quality of education in BRICS countries is also fairly good. India has consistentlybeen a major contributor in science papers from the early 70’s, while Russia is well known andrecognized for its quality of technical education. Brazil is also well recognized as a countrythat produces good quality science professionals. In recent decades, China has made specialefforts to improve its standing in developing high quality scientific and technical talent in thecountry and the output factors like scientific papers and patents indicate that it has beensuccessful in its endeavor. The figure 4 below shows the percentage of total first universitydegrees in science and engineering in BRICS countries from 1997 to 2008.
Figure 4: Percentage of total first university degrees inscience and engineering in BRICS from 1997–2008
Source: IMD Competitiveness Online (1995–2010)
%

8 ASCI Journal of Management 41(1) September 2011
At least two of the BRICS countries have a very impressive 25% of the population that hasattained at least tertiary education (for people between 24 and 35 years of age). The values forBrazil and India are just above 10% in the last few years. This points to a large pool of qualifiedand trained manpower who can be then moulded for innovation.
Figure 5: Percentage of population that has attained at leasttertiary education (25-34 years age group) in BRICS countries.
Source: IMD Competitiveness Online (1995–2010)
Thus, we can see that BRICS countries have all the right ingredients for innovation drivengrowth. Even though there may be intra BRICS differences within factors of innovation, it canbe safely said that these countries are already showing signs of attaining that goal. However,the pace at which each BRICS country will attain innovation driven development and growthwill be different. China is much ahead of the rest of the pack and South Africa seems to belagging behind. India, Russia and Brazil seem to be in the same orbit and are likely to showsimilar progress even though the domains in which they excel would different. Also themedian age of Indian population is 25.5 years, which will work to its advantage in the years tocome. Russia on the other hand is an aging population.
In per capita measures like total R&D personnel in business per capita or patent applicationsper capita, BRICS countries fare well (figure 6 and figure 7). However, BRICS do not postuniform results and there is some inter country differences.

Bagchi Innovation in BRICS Countries 9
Figure 6: Total R&D personnel in business per capita in FTE per 100 people
Figure 7: Patent applications per capitaNumber of applications filed per 100,000 inhabitants
Analysis
Now let us analyze some of the factors for fostering innovation in any country. We shallanalyze the data in aggregate form in three time periods for total expenditure on R&D, businessexpenditure on R&D, high-technology exports, total R&D personnel in business enterprise (in

10 ASCI Journal of Management 41(1) September 2011
full-time equivalent thousands), total R&D personnel nationwide, scientific articles publishedby origin of author, number of patent applications filed for residents and non residents,number of patents granted to residents, and total public expenditure on education per capita(in US Dollar per capita).
Pre High Growth Phase (1995–2002)
In this phase, the BRICS countries show a stable rate of GDP growth. The table 2 given belowlists the mean values (of each BRICS country) for each indicator in this phase. This phase ischaracterized by stable values for most indicators.
Table 2: Means of indicators that fosterinnovation in the pre high growth phase
Mean of Mean of Mean of Mean of Mean of Mean of Mean of Mean of Mean ofTotal Business Scientific Number of Number of High Tech Total R&D Total R&D Total public
Expenditure Expenditure articles patents applications Exports personnel in personnel expenditureon R&D on R&D published granted filed for (in US Dollar business nationwide on education
(in US Dollar (in US Dollar by origin to residents Millions) enterprises (in FTE per capitaMillions) Millions) of author residents and non from (in FTE thousands) in US Dollar
From from from from residents 2000–2002 thousands) from per capita1995–2002 1995–2002 1995–2002 1997–2002 from from 1995–2002 from
2000–2002 1995–2002 1995–2002
Brazil 6167.76 2238.01 6155.283 513.125 16867.33 4638.34 81.49 121.75 143.3112
China 8626.43 4677.97 17424.98 3259.333 65196 42111.42 416.26 859.69 26.4368
Mainland
India 3177.12 662.63 10415.77 539.4444 10186.67 1498.15 72.23 278.84 15.54853
Russia 3230.70 2292.35 16854.87 18895.83 33245 3469.82 652.40 1041.98 66.36507
South Africa 931.67 499.84 2265.183 4211.5 913.02 8.48 21.33 198.4933
Expenditure on R&D
Two indicators fall in this category, total expenditure on R&D and business expenditure onR&D. Data is available for both indicators from 1995 to 2002 and the mean values are calculatedfor this period for both the indicators. In this phase China and India show an upward trend fortotal expenditure on R&D, while Brazil, and South Africa show a marginal decline and Russiashows a recovery after a decline in the late 90’s. China shows a much greater rate of increaseas it had head start ahead of others in 1995 (4175.34 US $ million) with a value lower thanBrazil (US $ million 6285.40). In 2002 however, China was much ahead (more than four times)at US $ 84932.60 million while Brazil was at US $ 19531.58 million. During this period (on anaverage) the share of Brazil, China, India, Russia and South Africa to the total of BRICS for thisindicator has been 28%, 39%, 14%, 15%, 04% respectively. In the case of business expenditureon R&D, India and South Africa fare very badly during this period and show a very marginalincrease, while China already shows an exponential increase. Brazil is showing an upwardmovement while Russia decline, in the late 90’s and then recovers in the early 2000’s. Duringthis period (on an average) the share of Brazil, China, India, Russia and South Africa to thetotal of BRICS for this indicator has been 22%, 45%, 06%, 22%, 05% respectively. FromUS $ 1823.64 million in 1995, China increases business expenditure on R&D to US $ 9517.94million in 2002; an increase of 421%, while the increase for Brazil and India is only 77% and56% respectively.

Bagchi Innovation in BRICS Countries 11
R&D Personnel
Two indicators fall in this category, total R&D personnel in business enterprises (‘000 FTE) and
total R&D personnel nationwide (FTE ‘000). Data is available for both indicators from 1995 to
2002 and the mean is calculated for this period for both the indicators. The total R&D personnel
in business enterprises in Full-Time equivalents (in FTE ‘000) for the period 1995–2002 shows
that China posts a rapid increase in this period and Russia posts a rapid decline. India, Brazil
post similar values and remain almost flat for the entire period, while South Africa posts a
marginal increase. Again the growth posted by China in this indictor mirrors the other indicators
for the country. In fact, in 1995 China had 317.5 (in FTE thousands) total R&D personnel in
business enterprises and in 2002 that number goes up to 601.3.
Expenditure on Education per capita
The expenditure on education per capita from 1995 to 2002 shows a decline for Brazil and
South Africa and a robust increase by Russia. China and India also show modest increase. A
big gap exists between the groups Brazil-South Africa-Russia and India-China. China in this
indicator does not show an exponential increase in spending. During this period (on an average)
the share of Brazil, China, India, Russia and South Africa to the total of BRICS for this indicator
has been 32%, 06%, 03%, 15%, 44% respectively.
Patents
Two indicators fall in this category, number of patents granted to residents (data available
from 1997–2002) and number of applications filed for residents and non residents (data available
from 2000–2002). Mean is calculated for both indicators for the period that data is available.
Number of applications filed for residents and non residents show an upward trend for China.
The rest of the BRICS countries post results with neither an increase nor decrease. Also, China
is at a much higher level than the rest. During this period (on an average) the share of Brazil,
China, India, Russia and South Africa to the total of BRICS for this indicator has been 13%,
50%, 08%, 26%, 03% respectively. With regard to number of patents granted to residents,
Russia posts values that are mush higher than the rest of the BRICS countries, but shows a
decline, while China shows an increasing trend. Brazil and India post similar results. For this
indicator, China goes up from 1531 in 1997 to 5813 in 2002, and Russia comes down from
25616 in 1997 to 14454.33 in 2002. During this period (on an average) the share of Brazil, China,
India, Russia and South Africa to the total of BRICS for this indicator has been 02%, 14%, 02%,
81%, 0% respectively.
Scientific Articles
All BRICS countries with the exception of Russia show an increasing trend in terms of scientific
articles published by origin of author. China is of course showing a rapid growth in this
indicator while Brazil, India and South Africa are showing a stable rate of modest growth in
the number of articles. During this period (on an average) the share of Brazil, China, India,
Russia and South Africa to the total of BRICS for this indicator has been 12%, 33%, 20%, 32%,
04% respectively.

12 ASCI Journal of Management 41(1) September 2011
High Tech Exports
High Tech Exports (in US $ Million) is one indicator in which the difference between Chinaand the rest of the BRICS countries is very evident. China posts values of 24195.41 in 1998 forthis indicator and in 2002 posts a value of 68181.62. The nearest BRICS country to China in1998 is Brazil which posts a value of 2544.22 and 5350.79 in 2002. So China is several timesahead of the others on this indicator. However, we must also admit that not all high technologyexports maybe innovative.
Figure 8: Share (Ratio of means) of the BRICS countries as per the9 indicators in the pre high growth phase
High Growth Phase (2003–2007)
This period is characterized by high growth in GDP in the BRICS countries and in highgrowth of the indicators that foster innovation. China’s share amongst BRICS increases in thisperiod enormously. This is also the period immediately before the global financial crisis. Mostemerging markets including BRICS countries performed very well in this period.

Bagchi Innovation in BRICS Countries 13
Table 3: Means of indicators that foster innovationin the high growth phase
Mean of Mean of Mean of Mean of Mean of Mean of Mean of Mean of Mean ofTotal Business 1997–2002 Number of Number of High Tech Total R&D Total R&D Total public
Expenditure Expenditure Scientific patent patents Exports personnel in personnel expenditureon R&D on R&D articles applications granted (in US Dollar business nationwide on education
(in US Dollar (in US Dollar published filed for to resident Millions) enterprises (in FTE per capitaMillions) Millions) by residents and 2003– from (in FTE thousands) in US Dollar(2003– (2003– origin of non residents 2007 (2003– thousands) (2003– per capita2007) 2007) author 2003-2007 2007) (2003–2007) 2007) 2003–2007
Brazil 9078.94 4360.009 10096.82 20576 245 7212.43 77.07 244.16 226.8233
(0.16) (0.12) (0.12) (0.08) (0.01) (0.03) (0.05) (0.08) (0.29)
China 31737.87 21985.52 42319.5 172938 16685.33 218313.67 882.13 1370.17 45.65232
Mainland (0.54) (0.62) (0.50) (0.67) (0.46) (0.93) (0.55) (0.46) (0.06)
India 6388.52 1740.437 15080.04 23748.4 905.3333 3445.35 87.25 391.15 22.28471
(0.11) (0.05) (0.18) (0.09) (0.02) (0.01) (0.05) (0.13) (0.03)
Russia 9125.02 6086.296 14400.96 34888.6 18555.93 4529.54 541.52 934.69 216.768
(0.16) (0.17) (0.17) (0.13) (0.51) (0.02) (0.34) (0.31) (0.27)
South Africa 2100.60 1076.314 2473.4 7450.4 1516.73 11.54 29.13 280.4863
(0.04) (0.03) (0.03) (0.03) (0.01) (0.01) (0.01) (0.35)
Expenditure on R&D
The total expenditure on R&D indicator shows an exponential increase in the case of Chinaand a rapid pace of increase for Brazil and Russia with India close behind. South Africa alsoshows an upward trend. During this period (on an average) the share of Brazil, China, India,Russia and South Africa to the total of BRICS for this indicator has been 16%, 54%, 11%, 16%,04% respectively. Business expenditure on R&D also shows robust growth for all BRICS countries,but China shows an exponential growth followed by Russia, Brazil, India and South Africa.During this period (on an average) the share of Brazil, China, India, Russia and South Africa tothe total of BRICS for this indicator has been 12%, 62%, 05%, 17%, 03% respectively.
R&D Personnel
Total R&D personnel in business enterprise for China is growing exponentially in this periodbut for Russia, the trend is downward, Brazil, India and South Africa show no growth inexpenditure. China’s increase in expenditure is very high. It rises from 656.1 FTE thousands in2003 to 1186.75 FTE thousands in 2007, while for Russia, it reduces from 592.63 in 2003 to507.42 in 2007. During this period (on an average) the share of Brazil, China, India, Russia andSouth Africa to the total of BRICS for this indicator has been 05%, 55%, 05%, 34%, 01%respectively. Total R&D personnel nationwide tell a similar tale. China posts exponential growthin this indicator while Russia shows a decline. Brazil, India and South Africa show marginalincrease. During this period (on an average) the share of Brazil, China, India, Russia and SouthAfrica to the total of BRICS for this indicator has been 08%, 46%, 13%, 31%, 01% respectively.
Expenditure on Education per capita
The total public expenditure on education per capita for this period shows a somewhat differentpattern than the other indicators. South Africa, Brazil and Russia post exponential growth on

14 ASCI Journal of Management 41(1) September 2011
this indicator, while China and India fall far behind. During this period (on an average) theshare of Brazil, China, India, Russia and South Africa to the total of BRICS for this indicator hasbeen 29%, 06%, 03%, 27%, 35% respectively. However, one must point out that the per capitavalue for India and China are low due to their huge population and in absolute terms thedifference may not be as glaring.
Patents
Number of patents granted to residents in this period is showing exponential growth for Chinaand is showing a decline for Russia. Brazil, and India show only very marginal growth innumbers. During this period (on an average) the share of Brazil, China, India, Russia and SouthAfrica to the total of BRICS for this indicator has been 01%, 46%, 02%, 51%, 0% respectively. Inthe indicator, number of patent applications filed for residents and non residents, again Chinais far ahead of the rest of the BRICS countries. While in 2007, China show a number of 245161,Brazil reports only 21825. During this period (on an average) the share of Brazil, China, India,Russia and South Africa to the total of BRICS for this indicator has been 08%, 67%, 09%, 13%,03% respectively.
Scientific Articles
In scientific articles published by origin of author, China shows an upward trend along withIndia and Brazil. Russia shows a decline and South Africa shows no growth. During thisperiod (on an average) the share of Brazil, China, India, Russia and South Africa to the total ofBRICS for this indicator has been 12%, 50%, 18%, 17%, 03% respectively.
High Tech Exports
High technology exports show exponential growth for China. Even though the rest of theBRICS countries also post modest growth figures, they pale in comparison to China. The shareof China amongst other BRICS countries is about 93%. During this period (on an average) theshare of Brazil, China, India, Russia and South Africa to the total of BRICS for this indicator hasbeen 03%, 93%, 01%, 02%, 01% respectively.

Bagchi Innovation in BRICS Countries 15
Figure 9: Share (Ratio of means) of the BRICS countriesas per the 9 indicators in the high growth phase
Post Financial Crisis Period (2008–2009)
This represents the post global financial crisis period, in which several economies have beenthough a downturn. Developed countries like the US and most parts of Europe show signs ofrecession and the tremors of this crisis continue to rattle the emerging markets, BRICS noexception.

16 ASCI Journal of Management 41(1) September 2011
Table 4: Means of different indicators that foster innovationin the post financial crisis period
Mean of Mean of Mean of Mean of Mean of Mean of Mean of Mean of Mean ofTotal Business Scientific Number of Number of High Tech Total R&D Total R&D Total public
Expenditure Expenditure articles patents applications Exports personnel in personnel expenditureon R&D on R&D published granted filed for (in US business nationwide on education
(in US Dollar (in US Dollar by to residents Dollar enterprise (in FTE per capitaMillions) Millions) origin of residents and non Millions) (in FTE thousands) in US Dollar(2008– (2008– author 2008– residents (2008– thousands) (2008– per capita2009) 2009) 2008–2009 2009 2008–2009 2009) (2008–2009) 2009) 2008–2009
Brazil 19013.42 9038.272 233.50 9443.74 79.35 397.72 410.8772
(0.15) (0.11) (0.004) — (0.02) (0.04) (0.08) (0.31)
China 75681.36 55429.53 41256.33 302205.5 364819.61 1521.45 2128.2 116.4136
Mainland (0.61) (0.70) (0.659) (0.78) (0.94) (0.74) (0.46) (0.09)
India 10136.29 3040.888 36812 8320.36 37.1652
(0.08) (0.04) (0.09) (0.02) — (0.03)
Russia 16325.76 10230.14 21135.67 40206.5 4841.44 466.13 859.357 441.2807
(0.13) (0.13) (0.337) (0.10) (0.01) (0.23) (0.31) (0.33)
South Africa 2546.96 1377.569 10191 1714.50 31.077 326.2912
(0.02) (0.02) (0.03) (0.00) - (0.01) (0.24)
Expenditure on R&D
Two indicators fall in this category, total expenditure on R&D (in US Dollar Millions) andbusiness expenditure on R&D (in US Dollar Millions). Data is available for both indicators from2008 to 2009 and the mean is calculated for this period for both the indicators. Total expenditureon R&D for China continues to increase exponentially flowed by Brazil, Russia, India andSouth Africa. The signs of any effect of the financial crisis are not evident from the expendituresof the BRICS countries. During this period (on an average) the share of Brazil, China, India,Russia and South Africa to the total of BRICS for this indicator has been 15%, 61%, 08%, 13%,02% respectively. Business expenditure on R&D is increasing for China in this period butshows a dip in the case of Brazil and Russia. During this period (on an average) the share ofBrazil, China, India, Russia and South Africa to the total of BRICS for this indicator has been11%, 70%, 04%, 13%, 02% respectively. Some dip is noticed in this indicator that may beattributed to the global financial crisis.
R&D Personnel
Two indicators fall in this category, total R&D personnel in business enterprises (in FTEthousands) and total R&D personnel nationwide (in FTE thousands). Data is available for bothindicators from 2008 to 2009 and the mean is calculated for this period for both the indicators.China shows no sign any slowdown and continues to post upward trend in total R&D personnelin business enterprise. Russia, and Brazil show a dip in this indicator for this period whichmay be attributed to the financial crisis. During this period (on an average) the share of Brazil,China, India, Russia and South Africa to the total of BRICS for this indicator has been 04%,74%, 0%, 23%, 0% respectively. The case of total R&D personnel nationwide is similar withChina showing increasing trend and the rest showing a dip. During this period (on an average)the share of Brazil, China, India, Russia and South Africa to the total of BRICS for this indicatorhas been 08%, 46%, 0%, 31%, 01% respectively.

Bagchi Innovation in BRICS Countries 17
Expenditure on Education per capita
China and India continue to increase their spending on education without any indication of adip brought about by the events of the financial crisis, but the other 3 countries that werehaving very high values in this indicator show dips. Thus total public expenditure on educationper capita shows some effect of the financial crisis. During this period (on an average) theshare of Brazil, China, India, Russia and South Africa to the total of BRICS for this indicator hasbeen 31%, 09%, 03%, 33%, 24% respectively.
Patents
Patents granted to residents show increasing trend for China and a decline for Russia. Duringthis period (on an average) the share of Brazil, China, India, Russia and South Africa to thetotal of BRICS for this indicator has been 004%, 65%, 0%, 33%, 0% respectively. Number ofpatent applications filed for residents and non residents in the case of China is showing anincreasing trend and China is way ahead of the rest of the BRICS countries. During this period(on an average) the share of Brazil, China, India, Russia and South Africa to the total of BRICSfor this indicator has been 0%, 78%, 09%, 10%, 03% respectively.
Scientific Articles
Sufficient data is not available for this period.
High Tech Exports
China again plays a dominant role in this indicator in this time period. During this period (onan average) the share of Brazil, China, India, Russia and South Africa to the total of BRICS forthis indicator has been 02%, 94%, 02%, 01%, 0% respectively. China is way ahead of the othersin this indicator and is unaffected by the global financial crisis.
18 ASCI Journal of Management 41(1) September 2011
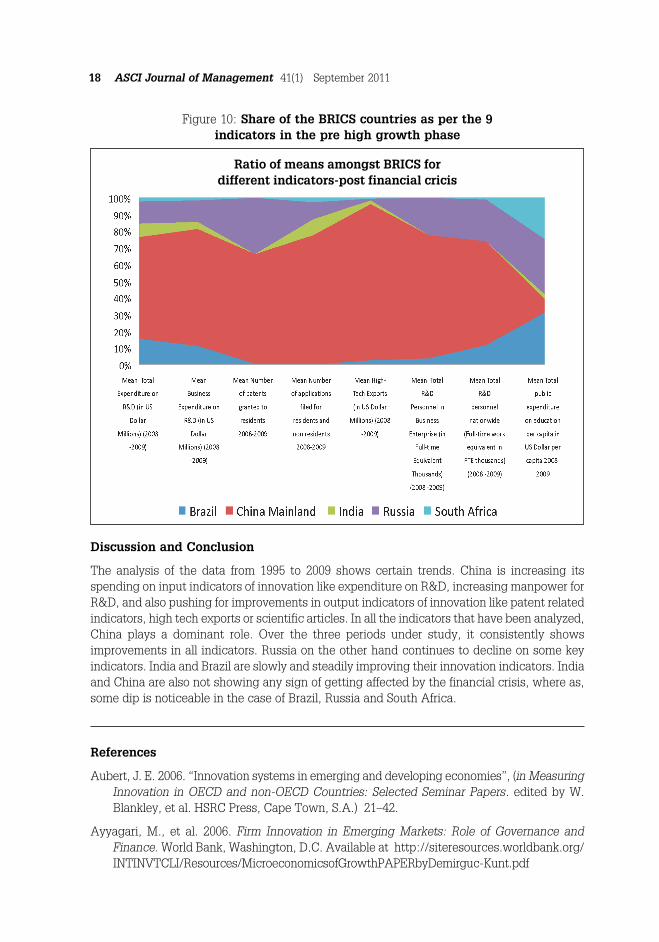
Figure 10: Share of the BRICS countries as per the 9indicators in the pre high growth phase
Discussion and Conclusion
The analysis of the data from 1995 to 2009 shows certain trends. China is increasing itsspending on input indicators of innovation like expenditure on R&D, increasing manpower forR&D, and also pushing for improvements in output indicators of innovation like patent relatedindicators, high tech exports or scientific articles. In all the indicators that have been analyzed,China plays a dominant role. Over the three periods under study, it consistently showsimprovements in all indicators. Russia on the other hand continues to decline on some keyindicators. India and Brazil are slowly and steadily improving their innovation indicators. Indiaand China are also not showing any sign of getting affected by the financial crisis, where as,some dip is noticeable in the case of Brazil, Russia and South Africa.
References
Aubert, J. E. 2006. “Innovation systems in emerging and developing economies”, (in MeasuringInnovation in OECD and non-OECD Countries: Selected Seminar Papers. edited by W.Blankley, et al. HSRC Press, Cape Town, S.A.) 21–42.
Ayyagari, M., et al. 2006. Firm Innovation in Emerging Markets: Role of Governance andFinance. World Bank, Washington, D.C. Available at http://siteresources.worldbank.org/INTINVTCLI/Resources/MicroeconomicsofGrowthPAPERbyDemirguc-Kunt.pdf
Ratio of means amongst BRICS fordifferent indicators-post financial cricis

Bagchi Innovation in BRICS Countries 19
Baskaran, A., and M. Muchie. 2010 . Can the Relative Strength of the National Systems ofInnovation Mitigate the Severity of the Global Recession on the BRICS?, Institute forEconomic Research on Innovation, Tshwane University of Technology, Pretoria. SA.
Choi, S. B., S. H. Lee, and C. Williams. 2011. “Ownership and firm innovation in a transitioneconomy: Evidence from China”. Research Policy, 40(3), 441-452
Edquist, C. (Ed). 1997. Systems of Innovation: Technologies, Institutions and Organisations,Pinter, London.
Freeman, C. 1982 .Technological infrastructure and international competitiveness, Draft papersubmitted to the OECD Ad hoc-group on Science, Technology and Competitiveness.(mimeo) Available at http://redesist.ie.ufrj.br/globelics/pdfs/GLOBELICS_0079_Freeman.pdf
Freeman, C. 1987. Technology Policy and Economic Performance: Lessons from Japan. Pinter,London
Freeman, C. 1995. “The National Innovation Systems in historical perspective”. CambridgeJournal of Economics, 19(1), 5-24.
Freeman, C., and L. Soete. 2009. “Developing science, technology and innovation indicators:What we can learn from the past”, Research Policy, 38(4), 583-589
Gerschenkron, A. 1962. Economic Backwardness in Historical Perspective. Belknap Press,Cambridge, MA.
Griliches, Z, 1990. “Patent Statistics as Economic Indicators: A Survey”. Journal of EconomicLiterature, 28(4), 1661-1707.
Hu, M.C., and J. A. Mathews. 2008. “China’s national innovative capacity”. Research Policy,37,1465–1479.
Intarakumnerd, P. and C. Chaminade. 2007. “Strategy versus Practice in Innovation SystemPolicy: the Case of Thailand”. Asian Journal of Technology Innovation, 15(2), 197-213.
Johnson, C.A. 1982. MITI and the Japanese Miracle: The Growth Of Industrial Policy, 1925–1975, Stanford University Press, Stanford.
Kim, L. 1980. “Stages of development of industrial technology in a developing country: amodel”. Research Policy, 9(3), 254–277.
Kim, L.1997. Imitation to Innovation: The Dynamics of Korea’s Technological Learning. HarvardBusiness School Press, Boston, MA.
King, D.A. 2004.”The scientific impact of nations; What different countries get for their researchspending”. Nature, 430, 311-316
Kravchenko, N. A. 2011. “The problem of measuring and assessing national innovation systems”.Problems of Economic Transition, 53(9), 61–73.
Lall, S. 1992. “Technological capabilities and industrialization”. World Development, 20, 165–186.
Lucas, R. E. 1988. On the Mechanics of Economic Development. Journal of Monetary Economics,22, 3-42.

20 ASCI Journal of Management 41(1) September 2011
Lundvall, B. A. 1988. “Innovations as in Interactive Process: From User-Producer Interaction tothe National System of Innovation” (in Technical Change and Economic Theory, edited byG. Dosi . London, Printer)
Lundvall, B. A. (Ed). 1992. National Systems of Innovation: Towards a theory of innovation andinteractive learning. Pinter, London.
Nelson, R.R. 1993. National Innovation Systems: a Comparative Analysis. Oxford UniversityPress, New York.
Romer, P.M. 1990. “Endogenous technological change”. Journal of Political Economy, 98 (5 )71–102.
Schumpeter, J.A. 1938. The Theory of Economic Development. Harvard University Press,Cambridge, MA.
Schumpeter, J.A. 1939. Business Cycles: A Theoretical, Historical and Statistical Analysis ofthe Capitalist Process, Vols. I & II. McGraw-Hill, New York.
Suarez-Villa, L. 1990. “Invention, Inventive Learning and Innovative Capacity”. BehavioralScience, 35(4), 290-310
The Economist. 2010. “The world turned upside down”, The Economist, 15 April.
Zachary, G. P. 2007. “When it comes to innovation, geography is destiny”, The New YorkTimes, 11 Feb.
Tiwari, R., and C. Herstatt. 2011 . Lead Market Factors for Global Innovation: Emerging Evidencefrom India. Avaialble at http://www.global-innovation.net/publications/PDF/Working_Paper_61.pdf
Trajtenberg, M. 1990. “Product Innovations, Price Indices and the (Mis)Measurement of EconomicPerformance,” NBER Working Papers 3261, National Bureau of Economic Research,Washington, D.C.
Tseng, C. Y. 2009. Technological innovation in the BRIC economies. Industrial Research InstituteInc. 0895-6308/09
UNCTAD. 2005. World Investment Report: Transnational Corporations and theInternationalization of R&D. United Nations, New York.
UNESCO. 2010. UNESCO Science Report: The current status of science around the world,UNESCO, Paris.
Wade, R. 1990. Governing the Market: Economic Theory and the Role of Government in EastAsian Industrialization. Princeton University Press, Princeton.
WIPO. 2011. The International Patent System – PCT Yearly Review: Developments andPerformance in 2010. Available at http://www.wipo.int/pct/en/activity/pct_2010.pdf
OECD. 2005. Oslo Manual: Guidelines for Collecting and Interpreting Innovation Data (3rd Ed.).OECD, Paris.
OECD. 2006. OECD Reviews of Innovation Policy: Switzerland. OECD, Paris.

Copyright of ASCI Journal of Management is the property of Administrative Staff College and its content may
not be copied or emailed to multiple sites or posted to a listserv without the copyright holder's express written
permission. However, users may print, download, or email articles for individual use.


![[AW]policy BRICS - ITD · กลุ่มประเทศ brics จะก่อให้เกิดประโยชน์ทางเศรษฐกิจกับไทย”](https://static.fdocuments.net/doc/165x107/5eb6589d95ac763ff45c6af5/awpolicy-brics-aaaaaaaaaaa-brics-aaaaaafaaaaaaaaaaaaaaoeaaaaaaaaaaaaaaaaaa.jpg)