
A Common Mechanism for Illusory and Occluded Object Completion
11
Journal of Experimental Psychology: Human Perception and Performance 1998, Vol 24, No. 3,859-869 Copyright 1998 by the American Psychological Association, Inc. 0096-1523/9843.00 A Common Mechanism for Illusory and Occluded Object Completion Philip J. Kellman and Carol Yin University of California, Los Angeles Thomas R Shipley Temple University New phenomena and results are reported that implicate a common contour interpolation mechanism in illusory and occluded (modal and amodal) object completion. In 3 experiments, a speeded classification task was used to study novel quasimodal displays in which occluded and illusory contours join. Results showed the same advantages in speed and accuracy over control displays for quasimodal, illusory, and occluded displays. The implications of quasimodal displays, along with another new display type in which contour linkages must precede determination of modal or amodal appearance, are considered. These logical considerations and empirical results suggest that amodal and modal completion depend on a common underlying mechanism that connects edges across gaps. A number of visual phenomena share the property that boundaries and shape are perceived in locations where no local information is present. These gaps in the projected boundaries and surfaces of objects often go unnoticed because of visual completion processes that deliver represen- tations of complete boundaries, whole objects, and continu- ous surfaces. Some examples are partly occluded objects, illusory objects, some cases of apparent transparency, and spontaneously splitting objects (SSOs). For the central figure seen in each example in Figure 1, the four displays are equivalent in terms of the contours and gaps given in the stimulus. These visual phenomena have often been consid- ered to be manifestations of different processes. Michotte, Thines, and Crabbe (1964), emphasizing differences in their phenomenology, divided completion processes into two types. Objects that are completed modally have a sensory presence in the areas that lack local specification. In the illusory figure in Figure Ib, for example, one can note the apparent lightness of the completed surface or answer a question about whether that surface has a small blue spot on it. (It does not.) In cases of amodal completion, one perceives or registers unspecified parts of objects, but these do not have a sensory presence. In Figure la, the black parts are perceived as connecting behind the occluder, but this connection is hidden. One would not be able to answer the Philip I. Kellman and Carol Yin, Department of Psychology, University of California, Los Angeles; Thomas F. Shipley, Depart- ment of Psychology, Temple University. Carol Yin is now at Computation and Neural Systems, Division of Biology, California Institute of Technology. Portions of this research were presented at the annual meeting of the Association for Research in Vision and Ophthalmology, May 1995. We gratefully acknowledge support from National Science Foundation Research Grants SBR 9496112 and SBR 9396309. We thank Barton Anderson, Joseph Lappin, Robert Shapley, and an anonymous reviewer for helpful comments and suggestions, and we thank Paras Doshi and Shannon White for assistance in data collection. Correspondence concerning this article should be addressed to Philip J. Kellman, Department of Psychology, University of California, 405 Hilgard Avenue, Los Angeles, California 90024- 1563. Electronic mail may be sent to [email protected]. question about the presence of a blue spot in the middle of the partly occluded object in Figure la. Another way of making the distinction is that a modally completed edge or surface is the nearest edge or surface to the observer in a particular visual direction, whereas an amodally completed edge or surface is not (i.e., it is located behind some nearer surface). Differences in their phenomenal appearances have led to different explanations for these phenomena. Illusory con- tours have usually been explained in terms of basic sensory mechanisms either at the retina (Brigner & Gallagher, 1974; Jory & Day, 1979) or in early cortical visual areas (von der Heydt, Peterhans, & Baumgartner, 1984). Completion of partly occluded contours and objects has sometimes been considered to be more cognitive in origin, perhaps not explainable by truly sensory or perceptual mechanisms at all (Gregory, 1977; Rock, 1987). Some theorists, however, have viewed both kinds of phenomena in terms of autonomous perceptual mechanisms (Kanizsa, 1979; Michotte et al., 1964) or cognitively oriented approaches to perception (Rock, 1987). Several investigators have proposed that boundaries and surfaces play complementary roles in completion: Bound- aries are interpolated across gaps, and surface qualities (e.g., lightness and color) fill in within completed boundaries (Grossberg & Mingolla, 1985; Kellman & Shipley, 1991; Yarbus, 1967; Yin, Kellman, & Shipley, 1997). Earlier we proposed that amodal and modal boundary completion depend on a common underlying process (Kellman & Loukides, 1987; Kellman & Shipley, 1991; Shipley & Kellman, 1992). Some definitions and concepts may be helpful in understanding this claim. The parts of boundaries signaled by differences in luminance, chromaticity, texture, depth, or motion we cal\ physically specified boundaries. By interpolated boundaries we mean perceived contours that do not have local physical specification, that is, those that are created by the visual system. The claim that a common mechanism completes boundaries in the phenomenologi- cally different cases described above we call the identity hypothesis (Shipley & Kellman, 1992). On this hypothesis, the differences between modal and amodal phenomena have 859
Transcript of A Common Mechanism for Illusory and Occluded Object Completion

Journal of Experimental Psychology:Human Perception and Performance1998, Vol 24, No. 3,859-869
Copyright 1998 by the American Psychological Association, Inc.0096-1523/9843.00
A Common Mechanism for Illusory and Occluded Object Completion
Philip J. Kellman and Carol YinUniversity of California, Los Angeles
Thomas R ShipleyTemple University
New phenomena and results are reported that implicate a common contour interpolationmechanism in illusory and occluded (modal and amodal) object completion. In 3 experiments,a speeded classification task was used to study novel quasimodal displays in which occludedand illusory contours join. Results showed the same advantages in speed and accuracy overcontrol displays for quasimodal, illusory, and occluded displays. The implications ofquasimodal displays, along with another new display type in which contour linkages mustprecede determination of modal or amodal appearance, are considered. These logicalconsiderations and empirical results suggest that amodal and modal completion depend on acommon underlying mechanism that connects edges across gaps.
A number of visual phenomena share the property that
boundaries and shape are perceived in locations where no
local information is present. These gaps in the projected
boundaries and surfaces of objects often go unnoticed
because of visual completion processes that deliver represen-
tations of complete boundaries, whole objects, and continu-
ous surfaces. Some examples are partly occluded objects,
illusory objects, some cases of apparent transparency, and
spontaneously splitting objects (SSOs). For the central
figure seen in each example in Figure 1, the four displays are
equivalent in terms of the contours and gaps given in the
stimulus. These visual phenomena have often been consid-
ered to be manifestations of different processes. Michotte,
Thines, and Crabbe (1964), emphasizing differences in their
phenomenology, divided completion processes into two
types. Objects that are completed modally have a sensory
presence in the areas that lack local specification. In the
illusory figure in Figure Ib, for example, one can note the
apparent lightness of the completed surface or answer a
question about whether that surface has a small blue spot on
it. (It does not.) In cases of amodal completion, one
perceives or registers unspecified parts of objects, but these
do not have a sensory presence. In Figure la, the black parts
are perceived as connecting behind the occluder, but this
connection is hidden. One would not be able to answer the
Philip I. Kellman and Carol Yin, Department of Psychology,University of California, Los Angeles; Thomas F. Shipley, Depart-ment of Psychology, Temple University. Carol Yin is now atComputation and Neural Systems, Division of Biology, CaliforniaInstitute of Technology.
Portions of this research were presented at the annual meeting ofthe Association for Research in Vision and Ophthalmology, May1995. We gratefully acknowledge support from National ScienceFoundation Research Grants SBR 9496112 and SBR 9396309.
We thank Barton Anderson, Joseph Lappin, Robert Shapley, andan anonymous reviewer for helpful comments and suggestions, andwe thank Paras Doshi and Shannon White for assistance in datacollection.
Correspondence concerning this article should be addressed toPhilip J. Kellman, Department of Psychology, University ofCalifornia, 405 Hilgard Avenue, Los Angeles, California 90024-1563. Electronic mail may be sent to [email protected].
question about the presence of a blue spot in the middle of
the partly occluded object in Figure la. Another way of
making the distinction is that a modally completed edge or
surface is the nearest edge or surface to the observer in a
particular visual direction, whereas an amodally completed
edge or surface is not (i.e., it is located behind some nearer
surface).
Differences in their phenomenal appearances have led to
different explanations for these phenomena. Illusory con-
tours have usually been explained in terms of basic sensory
mechanisms either at the retina (Brigner & Gallagher, 1974;
Jory & Day, 1979) or in early cortical visual areas (von der
Heydt, Peterhans, & Baumgartner, 1984). Completion of
partly occluded contours and objects has sometimes been
considered to be more cognitive in origin, perhaps not
explainable by truly sensory or perceptual mechanisms at all
(Gregory, 1977; Rock, 1987). Some theorists, however, have
viewed both kinds of phenomena in terms of autonomous
perceptual mechanisms (Kanizsa, 1979; Michotte et al.,
1964) or cognitively oriented approaches to perception
(Rock, 1987).
Several investigators have proposed that boundaries and
surfaces play complementary roles in completion: Bound-
aries are interpolated across gaps, and surface qualities (e.g.,
lightness and color) fill in within completed boundaries
(Grossberg & Mingolla, 1985; Kellman & Shipley, 1991;
Yarbus, 1967; Yin, Kellman, & Shipley, 1997). Earlier we
proposed that amodal and modal boundary completion
depend on a common underlying process (Kellman &
Loukides, 1987; Kellman & Shipley, 1991; Shipley &
Kellman, 1992). Some definitions and concepts may be
helpful in understanding this claim. The parts of boundaries
signaled by differences in luminance, chromaticity, texture,
depth, or motion we cal\ physically specified boundaries. By
interpolated boundaries we mean perceived contours that do
not have local physical specification, that is, those that are
created by the visual system. The claim that a common
mechanism completes boundaries in the phenomenologi-
cally different cases described above we call the identity
hypothesis (Shipley & Kellman, 1992). On this hypothesis,
the differences between modal and amodal phenomena have
859

860 KELLMAN, YIN, AND SHIPLEY
(d)
Figure 1. Equivalent object completion displays with differingappearances: (a) partly occluded object, (b) illusory object, (c)transparent illusory object, (d) spontaneously splitting object. Alldisplays have identical contours except those shown with dottedmarkings.
to do with whether interpolated boundaries are in front of orbehind other surfaces and not with the mechanisms thatinterpolate boundaries. The depth relations determiningphenomenal appearance depend on depth information in thescene.
Support for a common mechanism in illusory and oc-cluded object perception has come from three sources. Onesource involves arguments based on certain bistable dis-plays, invariably involving weak or absent depth orderinformation among visible surfaces. Figure 2 shows anexample of an SSO. There are several interesting features ofthis display. First, it appears to segregate into two objects,despite consisting of a single, physically homogeneousregion. This segregation has been explained in terms ofproperties of the boundary interpolation process (Kellman &Shipley, 1991). With prolonged viewing, another property isevident. The depth ordering of the two objects switches.Sometimes the vertical object is on top (nearer the observer),and sometimes the horizontal object is on top.
If modal and amodal completion are taken to nameseparate visual processes, this depth reversal is a complexprocess indeed. The object seen on top is modally com-pleted, whereas the other is amodally completed. When thereversal occurs, the object previously completed modallyceases to be completed that way and now becomes amodallycompleted. With perfect complementarity the other objectundergoes the reverse change. One would need an explana-tion of the boundary formation process in modal completion,the parallel process in amodal completion, and some expla-nation of their linkage.
A simpler hypothesis is that there are not two interpola-tion processes here, but only one. The differing appearances
of the two objects formed depend on their ordering in depth.The display in Figure 2 lacks information specifying depthorder. Despite its absence (or despite the information forequal depths given by oculomotor, stereoscopic, and motioncues), the visual system appears to obey a constraint that oneobject or the other must appear in front. Which objectappears nearer shifts across time. Depth reversals under suchcircumstances are characteristic of other perceptual phenom-ena, such as the Schrodinger staircase or reversible figure-ground displays. These changes of depth order in SSOdisplays do not alter interpolated boundaries or shapes ofcompleted objects. The same bounded objects appear in thedisplay, but their positions have changed.
Besides the simplicity of the identity hypothesis, two sortsof experimental evidence have been offered in its support.Using perceptual report measures, Shipley and Kellman(1992) tested a large sample of randomly generated illusoryobjects and corresponding partly occluded objects. Fordisplays having the same physically specified edges, magni-tude ratings of contour clarity in illusory contour displaysnearly perfectly predicted ratings of perceived unity inocclusion displays.
More recently, a method based on objective performancehas provided support for the identity hypothesis (Ringach &Shapley, 1996; Shapley & Ringach, 1994). Ringach andShapley used displays like those shown in Figure 3. Alldisplays were made of identical illusory contour or occludedcontour inducing elements, rotated around their centers tocreate displays whose middles were "fat" or "thin," asshown in Figure 3a and 3b, respectively. Amount of rotationof the elements was varied. On each trial, a display waspresented briefly, and participants classified it as fat or thin.
Ringach and Shapley (1996) reported that accuracy fordifferent degrees of rotation showed the same patterns foroccluded (amodally completed) and illusory (modally com-pleted) figures. Both kinds of figures produced performancesuperior to that of a control group. In the control group,elements were reflected around vertical axes to disruptfigural completion. (The concavity in each three-quartercircle faced outward.) Displays could still be judged,however, as fat or thin on the basis of the same
Figure 2. Bistable spontaneously splitting object display. (Re-drawn from Kellman & Shipley, 1991.)

ILLUSORY AND OCCLUDED OBJECT COMPLETION 861
information about local element rotation that was availablein the displays of illusory and occluded objects. Ringach andShapley argued that the lower performance in the controlgroup indicates that performance on this task is facilitated byglobal figural completion. The results in the ngural comple-tion conditions supported the notion that a single mechanismproduces both kinds of contour interpolation.
There have been, however, some claims of an asymmetryin edge interpolation. For example, Anderson and Julesz(1995) reported an asymmetry in the stability of interpola-tion of a horizontal bar, depending on whether stereoscopicdepth information places the endpoints of the horizontal barnearer or farther than a vertical bar. In the former case, thebar may appear modally completed in front of the vertical ormay take on a different ("bent") appearance. In the lattercase, there is only one appearance—a straight continuationof the horizontal bar. It is not clear how readily the bentpercept is seen in the less stable case. Nakayama andShimojo (1990,1992) informally presented the same displayto several hundred observers and reported that "only a tinyminority" observed the horizontal bar as being bent (Na-kayama & Shimojo, 1992, p. 1358). Although the differencein stability may indicate some difference in how boundaryinterpolation works in the two cases, it may instead involveinteractions of depth spreading along the horizontal bound-ary, boundary interpolation, and attentional scrutiny.
Evidence consistent with the identity hypothesis does notrule out the idea that separate but similar mechanismsproduce illusory and occluded contours. Our purpose in thisarticle is to introduce new logical and empirical consider-ations that place the identity hypothesis on firmer ground.Specifically, we present a new class of display in whichillusory and occluded contours join. Second, we test figuralcompletion in this new class of displays and compare it withcompletion performance in illusory and occluded object
(a) (b)
CO(c) (d)
Figure 4. A quasimodal display in which modally and atnodallycompleted contours join. The white, tubular object is completedacross four gaps: In the upper right, it has partly occluded surfaces,and in the lower left, it has illusory surfaces. In the other twolocations, a quasimodal connection (part occluded, part illusory)occurs.
displays. Third, we introduce another new type of displayand consider some earlier phenomena to demonstrate thatthere are cases in which contour completion must precededetermination of whether the completed boundaries andsurfaces are illusory (modal) or occluded (amodal). Theselogical and empirical considerations implicate a commoncontour completion process that is neither modal nor amodalbut that underlies both of these types of contour completion.
Experiment 1
Consider the display shown in Figure 4. Some of thecompleted contours connect a modal (illusory) portion andan amodal (occluded) portion. Logically, the existence ofsuch connections suggests that amodal and modal comple-tion are not separate processes. One reason is that theamodal and modal parts of the contour are able to connect. Amore important reason is that this connection occurs indisplays that do not fulfill the requirements for interpolationof either illusory or occluded contours. Illusory contoursordinarily begin and end with illusory contour inducingelements, and completed occluded contours begin and end attwo visible contours on opposite sides of an occluder.1 Onthe assumption that illusory contour and occluded contourcompletion derive from separate mechanisms, no edgecompletion should occur across the upper left and lowerright gaps in Figure 4 because they do not fulfill the requiredconditions for either mechanism to operate. Put morepositively, if interpolation occurs between an illusory con-
Figure 3. Stimuli used by Ringach and Shapley (1996): (a) fatillusory object, (b) thin illusory object, (c) fat partly occludedobject, (d) thin partly occluded object.
'We distinguish between amodal completion of a boundary,which requires visible anchors at both ends of the boundary, andamodal continuation, in which a contour of a single visible partmay appear to continue through a T junction behind a surface to anindefinite endpoint (Kanizsa, 1979; Shimojo & Nakayama, 1990).Our argument clearly involves completion: There are no examplesin which amodal continuation (from a single visible part) aloneleads to a boundary or surface emerging on the other side of anoccluder. A related point is that the continuation process does notseem to occur for single illusory contour elements.
862 KELLMAN, YIN, AND SHIPLEY
tour inducer and an occluded contour inducer, it suggests
that a single interpolation process can accept concurrently
these two types of contour anchors as inputs. Thus, the
completed boundaries and figures are neither strictly modal
nor atnodal. They are both, or neither, or perhaps quasimodal.
It remains to be shown, however, that figural completion
actually occurs in quasimodal displays. Although we might
claim that the reader can verify this by looking at an
example, a stronger form of evidence would be to show that
such quasimodal displays have similar effects on speeded
performance as do other acknowledged examples of figural
completion. Moreover, if a single completion mechanism
governs occluded, illusory, and quasimodal displays, we
would predict similar patterns of performance for the three
kinds of displays.
To test these hypotheses, we used a version of the fat-thin
task developed by Ringach and Shapley (1996). We used
three classes of displays: illusory, occluded, and quasimodal.
Four amounts of rotation were used: 2°, 3°, 4°, or 8° of
rotation of the corner elements around their centers. Dis-
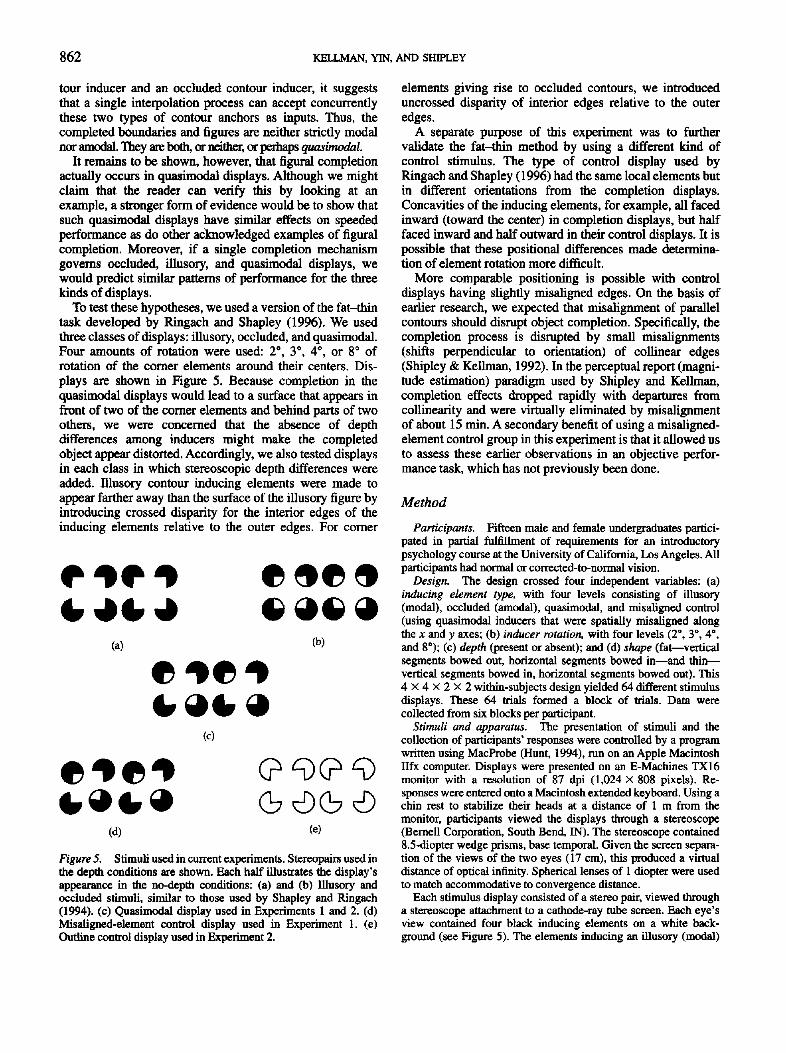
plays are shown in Figure 5. Because completion in the
quasimodal displays would lead to a surface that appears in
front of two of the corner elements and behind parts of two
others, we were concerned that the absence of depth
differences among inducers might make the completed
object appear distorted. Accordingly, we also tested displays
in each class in which stereoscopic depth differences were
added. Illusory contour inducing elements were made to
appear farther away than the surface of the illusory figure by
introducing crossed disparity for the interior edges of the
inducing elements relative to the outer edges. For comer
(c)
(d) (e)
Figure S. Stimuli used in current experiments. Stereopairs used inthe depth conditions are shown. Each half illustrates the display'sappearance in the no-depth conditions: (a) and (b) Illusory andoccluded stimuli, similar to those used by Shapley and Ringach(1994). (c) Quasimodal display used in Experiments 1 and 2. (d)Misaligned-element control display used in Experiment 1. (e)Outline control display used in Experiment 2.
elements giving rise to occluded contours, we introduced
uncrossed disparity of ulterior edges relative to the outer
edges.
A separate purpose of this experiment was to further
validate the fat-thin method by using a different kind of
control stimulus. The type of control display used by
Ringach and Shapley (1996) had the same local elements but
in different orientations from the completion displays.
Concavities of the inducing elements, for example, all faced
inward (toward the center) in completion displays, but half
faced inward and half outward in their control displays. It is
possible that these positional differences made determina-
tion of element rotation more difficult.
More comparable positioning is possible with control
displays having slightly misaligned edges. On the basis of
earlier research, we expected that misalignment of parallel
contours should disrupt object completion. Specifically, the
completion process is disrupted by small misalignments
(shifts perpendicular to orientation) of collinear edges
(Shipley & Kellman, 1992). In the perceptual report (magni-
tude estimation) paradigm used by Shipley and Kellman,
completion effects dropped rapidly with departures from
collinearity and were virtually eliminated by misalignment
of about 15 min. A secondary benefit of using a misaligned-
element control group in this experiment is that it allowed us
to assess these earlier observations in an objective perfor-
mance task, which has not previously been done.
Method
Participants. Fifteen male and female undergraduates partici-pated in partial fulfillment of requirements for an introductorypsychology course at the University of California, Los Angeles. Allparticipants had normal or corrected-to-normal vision.
Design. The design crossed four independent variables: (a)inducing element type, with four levels consisting of illusory(modal), occluded (amodal), quasimodal, and misaligned control(using quasimodal inducers that were spatially misaligned alongthe x and y axes; (b) inducer rotation, with four levels (2°, 3°, 4°,and 8°); (c) depth (present or absent); and (d) shape (fat—verticalsegments bowed out, horizontal segments bowed in—and thin—vertical segments bowed in, horizontal segments bowed out). This4 X 4 X 2 X 2 within-subjects design yielded 64 different stimulusdisplays. These 64 trials formed a block of trials. Data werecollected from six blocks per participant.
Stimuli and apparatus. The presentation of stimuli and thecollection of participants' responses were controlled by a programwritten using MacProbe (Hunt, 1994), run on an Apple MacintoshIlfx computer. Displays were presented on an E-Machines TX16monitor with a resolution of 87 dpi (1,024 X 808 pixels). Re-sponses were entered onto a Macintosh extended keyboard. Using achin rest to stabilize their heads at a distance of 1 m from themonitor, participants viewed the displays through a stereoscope(Bernell Corporation, South Bend, IN). The stereoscope contained8.5-diopter wedge prisms, base temporal. Given the screen separa-tion of the views of the two eyes (17 cm), this produced a virtualdistance of optical infinity. Spherical lenses of 1 diopter were usedto match accommodative to convergence distance.
Each stimulus display consisted of a stereo pair, viewed througha stereoscope attachment to a cathode-ray tube screen. Each eye'sview contained four black inducing elements on a white back-ground (see Figure 5). The elements inducing an illusory (modal)

ILLUSORY AND OCCLUDED OBJECT COMPLETION 863
figure were black three-quarter disks. The elements inducing an
occluded (amodal) figure were the black three-quarter disks with a
black line (5.82 min thick) completing the perimeter of the circle.The elements inducing the quasimodal display were both modaland amodal inducing elements, with two of each type placed along
opposite diagonals. All inducing elements subtended 1.6° of visualangle, with the entire display of four elements subtending 4°. Theratio of the visible edge length to the entire edge length (support
ratio) was 0.65.Half of the displays incorporated depth information congruent
with the type of figure induced: In the illusory (modal) display, thecentral illusory figure was placed in front of the inducing elementswith a binocular disparity of 3.88 min. In the occluded display, the
central occluded figure was placed behind die inducing elements bythe same amount. The disparity between inducing elements andtheir central figure was preserved in the quasimodal display so thatthe illusory inducing elements were placed 3.88 min behind thecentral figure, and the occluded inducing elements were placed3.88 min in front of the central figure. The remaining half of thedisplays did not contain stereoscopic disparity differences; thesame image was presented to each eye.
The misaligned-element controls were created by taking aquasimodal figure and shifting the inducing elements in the upperleft and the lower right toward the center of the induced figure
11.64 min vertically and 11.64 min horizontally.For all display types, the inducing elements were rotated 2°, 3°,
4°, and 8° to form potential figures that were either thin—bowed inalong the vertical axis and bowed out along the horizontal axis—or
fat—bowed out along the vertical axis and bowed in along the
horizontal axis.Procedure. Participants were told to decide whether me shape
they perceived was "thin, where the [vertical] sides were bowed in,
or fat, where the [vertical] sides were bowed out." These instruc-tions were accompanied with hand gestures sketching vertical sidesbowing in and bowing out. Participants were also told that someshapes would be slightly misaligned and that they were to perform
the task as best they could in those cases. Participants were asked torespond as quickly and as accurately as possible by pressing withtheir right index finger the 9 key on the keypad for fat responsesand with their left index finger the q key on the keyboard for thinresponses. The two keys were relabeled F and T as appropriate.
Before starting the practice trials, participants were asked toview stereoscopically a display showing a square frame, subtend-ing 4.64°, containing two black dots, with diameters subtending38.81 min. One dot was placed behind the depth of the frame, theother in front, with a horizontal disparity of 3.88 min. Participantswere asked if they could determine which of the two dots wascloser to them. Participants who were unable to see stereoscopicdepth were given credit and did not participate further in thisexperiment. Throughout all the experiments, less than 5% of theparticipant pool was excused at this point.
Participants then began a block containing all 64 trials aspractice trials. Data from the practice block were not included inthe statistical analyses. As an additional test of stereo vision,participants were asked if they could see the depth information inthe practice trials before they continued further. Participants thenran an additional six blocks of trials. All trials were randomizedwithin a block before each iteration. Participants received feedbackabout their performance by means of an auditory "incorrect"signal.
Each participant performed the experiment individually in aroom with standard fluorescent illumination.
Results
Accuracy was high (averaging 98% correct) and did not
differ reliably across groups. Reaction times (RTs; correct
responses only) for each display type are shown in Figure 6
as a function of angle of rotation. Increasing rotation angle
led to shorter RTs. The patterns for the illusory object,
occluded object, and quasimodal displays appear virtually
identical; the control group showed slower responding by
about 200 ms (roughly 25%) at all rotation angles.
These observations were confirmed by the analyses. A 2
(depth) X 4 (inducer rotation) X 4 (inducing element type)
repeated-measures analysis of variance (ANOVA) found
effects of inducer rotation, F (3, 42) = 9.01, p < .001, and
inducing element type, F(3, 42) = 11.34, p < .0001. There
was no main effect of depth (F < 1), nor were there any
interactions involving this factor. In subsequent analyses,
data were collapsed across depth. There was no reliable
interaction of display type and rotation (F < 1).
Planned comparisons showed that the main effect of
inducing element type was due to slower responding to the
misaligned-element control displays, F(l, 14) = 12.28, p <
.005, whereas pairwise comparisons of other conditions did
not reach significance. A test for interacting contrasts found
that this pattern of results did not differ with inducer rotation
The inducer rotation effect, tested with pairwise compari-
sons, found RTs to be significantly different between all
conditions. Reaction times increased as inducer rotation
increased.
Discussion
The results of Experiment 1 indicate that displays known
to induce object completion produce a performance advan-
tage relative to a control group in which completion was
disrupted. Using a slightly different version of Ringach and
Shapley's (1996) classification task and a different type of
1,050
1,000
I «<>! 900
P 850
S 800
I ?5°IE 700
2 3 4 8
ELEMENT ROTATION (d*g)
Figure 6. Reaction times (in milliseconds) in Experiment 1 foreach display type, plotted as function of inducer-element rotation.Error bars show ± 1 SE of the mean.

864 KELLMAN, YIN, AND SHIPLEY
control display, we confirmed their findings. Our results alsoindicate no differences in the processing of illusory andoccluded displays, providing further support for the identityhypothesis (Kellman & Shipley, 1991).
Disruption of object completion by misalignment ofparallel contours (control group) confirms the model ofcontour relatability put forth by Kellman and Shipley(1991). Although the present experiment tested only a singlevalue of misalignment (about 11.64 min), disruption of theobject completion effect was substantial. The result providesevidence from performance data that fits well with earlierperceptual report results (Shipley & Kellman, 1992).
The most important result of Experiment 1, however, isthe finding that quasimodal displays showed the samepatterns of performance as did illusory and occluded dis-plays. These results confirm the phenomenological observa-tion that quasimodal displays support object completion.The finding that illusory boundaries and surfaces canconnect with occluded ones is a novel and stronger kind ofevidence supporting a unitary completion process ratherthan separate processes for completing objects that appearbehind or in front of other objects. Object completion occursin displays that are neither amodal nor modal (or bothamodal and modal).
Experiment 2
The findings of Experiment 1 were consistent with thehypotheses that (a) figural completion produces a perfor-mance advantage in the fat-thin discrimination task and (b)completion in displays having different appearances is theresult of a common underlying mechanism. It remainspossible, however, that performance differences found be-tween completion and control displays in this study did notdepend on figural completion. Perhaps misalignment of theelements made the processing of their rotations moredifficult. Likewise, in Ringach and Shapley's (1996) dis-plays, perhaps reversing element orientation caused distrac-tion or otherwise reduced performance. An ideal controlgroup would be one in which the boundaries relevant to thefat-thin detection task could be kept in identical positions inexperimental and control groups. In Experiment 2 we soughtto eliminate ambiguity about the cause of performanceadvantages in this task by testing control displays withcontours in identical positions to those in the experimentaldisplays.
To compare displays that should and should not showfigural completion effects while keeping visible contours inthe same location, we used illusory contour-type displaysmade of outline inducing elements. Elusory contours areweak or absent in displays made of outline inducers(Kanizsa, 1979; Kellman & Shipley, 1991).
Method
Participants. Fifteen male and female undergraduates partici-
pated in partial fulfillment of requirements for an introductory
psychology course at the University of California, Los Angeles. All
participants had normal or corrected-to-normal vision, and none
had participated in the previous experiment.
Design and stimuli. The same four independent variables from
Experiment 1 were crossed. The only change in design was in the
type of control displays. Instead of using misaligned-element
controls, we used outline versions of the illusory object inducers.
This 4 X 4 X 2 X 2 within-subjects design yielded 64 different
stimulus displays. These 64 trials formed a block of trials.
Apparatus and procedure. The apparatus and procedure were
the same as those in Experiment 1. Participants ran one block of 64
trials as practice and six blocks in the experiment.
Results
The main results are shown in Figure 7. Illusory object,
occluded object, and quasimodal displays showed similarpatterns of performance. Reaction times for the outlinecontrol displays were slower, on the order of 100 ms, at eachrotation angle. A 2 (depth) X 4 (inducer rotation) X 4
(inducing element type) repeated-measures ANOVA con-firmed these observations. There were reliable main effectsof inducing element type and inducer rotation, Fs(3, 42) =14.52 and 7.60, respectively, ps < .0001. There were nomain effects or interactions involving depth; data in subse-quent analyses were collapsed across this variable. Therewas an interaction of inducing element type and inducerrotation,F(9,126) = 2.70,p < .01.
Pairwise comparisons on the main effect of inducerrotation showed that RTs in the 2° rotation condition werereliably (a = .05) slower than in the 3° inducer condition.Responses times in the 3° and 4° conditions did not differ(F < 1). Responses times were reliably slower in the 4° thanin the 8° condition.
The Inducer Type X Rotation interaction, which was notfound in Experiment 1, was explored in two ways. Thecombined data from the completion groups (illusory, oc-cluded, and quasimodal) were compared with the outlinecontrol group in a 2 (inducer type) X 4 (rotation) ANOVA.The completion groups were faster than the outline controlgroup, F(l, 14) = 18.45,p < .001, but the magnitude of thisdifference decreased with inducer rotation, F(3,42) = 3.19,
950
900
850
800
750-
700
650
600
550
03 4 a
ELEMENT ROTATION (dag)
Figure 7. Reaction times (in milliseconds) in Experiment 2 for
each display type, plotted as function of inducer-element rotation.
Error bars show ± 1 SE of the mean.

ILLUSORY AND OCCLUDED OBJECT COMPLETION 865
p < .05, as tested by the Inducer Type X Rotationinteraction. Post hoc comparisons showed that this interac-tion was due to a greater difference between control andcompletion conditions when the inducers were rotated 2°than when inducers were rotated 8°, F(l, 14) = 7.02, p <.02. The difference between control and test conditions forthe 3° and 8° rotations was marginally significant, F(l, 14) =3.47, .05<p<.W.
To check for possible differences within the completiongroups, a 3 (inducer type: illusory, occluded, quasimodal) X4 (rotation) ANOVA was carried out with the controlcondition removed. There was no main effect of inducer type(F < 1), a main effect of inducer rotation, F(3, 42) = 6.91,p < .001, and a reliable interaction, F(6, 84) = 2.36, p <.05. Post hoc (simple effects) tests following up this 3 X 4interaction found an interaction only between quasimodaland illusory conditions, F(3,42) = 3.13, p < .05. Individualcomparisons between quasimodal and illusory conditions ateach rotation showed no reliable (p < .05) differences, allFs(l, 14) < 2.32, ps > .14, and a marginally significantdifference only at the 3° rotation, F(l, 14) = 3.43,p < .10.Individual comparisons between all possible pairs of comple-tion conditions at all rotations showed no other reliabledifferences.
A final analysis compared performance in the controlconditions of Experiments 1 and 2. A 2 (experiment) X 4(rotation) ANOVA showed no main effect of experiment,F(l, 28) = 2.10 (ns), a reliable main effect of inducerrotation, F(3, 84) = 7.19, p < .0002, and no interaction
Discussion
The results of Experiment 2 generally mirror those ofExperiment 1. Quasimodal, illusory, and occluded displayswere all processed similarly, whereas the outline controldisplays were processed more slowly. An exception was themarginal superiority of quasimodal over illusory displays atthe 3° rotation. Because this effect is isolated, weak, and didnot appear with the identical displays in Experiment 1, weare inclined to consider it a statistical fluke.
This experiment bolsters the interpretation that objectcompletion produces the performance differences in thisparadigm. Comparison of completion displays with outlinedisplays fulfills the important criterion of preserving thelocations of the contours providing local information for thediscrimination task. The present results also confirm earlierclaims that outline inducing elements do not produceillusory contours and figures (Kanizsa, 1979; Kelhnan &Shipley, 1991). To our knowledge, the present result is thefirst experimental evidence for this claim derived fromspeeded performance rather than from perceptual reportmeasures.
The lack of any difference in performance in the twocontrol conditions used in Experiments 1 and 2 suggests thatparticipants may have used a similar process to detectelement rotation in the two cases.
Experiment 3
There is a final reservation to consider, however. It ispossible that contour processing in outline displays is slowerthan in filled displays. If so, this difference could haveproduced the performance difference in Experiment 2. Ifthere is no true object completion advantage in this task,then, conspiratorial as it might seem, the different controldisplays in Experiments 1 and 2 (and in Ringach &Shapley's, 1996, experiments) might have each slowedperformance for separate reasons. Evidence against theslower—or different—processing of outline displays wouldmore convincingly establish the source of the performanceadvantage as object completion. To this end, we carried outExperiment 3.
In this experiment, a single illusory contour inducingelement was used in the classification task. This element wasan outline element on half the trials and a filled element onthe other half. If contours in outline displays are processedmore slowly than in filled ones, then we would expect to findfaster classification of filled displays. If, however, the effectin Experiment 2 was truly due to object completion, wewould expect to find no difference in speed of classifyingsingle elements.
A second motivation for Experiment 3 was to test one ideaabout processing in the control groups of Experiments 1 and2. In the absence of figure! completion, participants mayperform the classification task by detecting orientationinformation in a single element. If performance with a singleoutline element shows the same pattern as that of the outlinecontrol group in Experiment 2, the outcome would supportthe idea that the task was performed in the control groupwithout using interelement relationships (in contrast to thecompletion groups).
Method
Participants. Fifteen male and female undergraduates partici-
pated in partial fulfillment of requirements for an introductory
psychology course at the University of California, Los Angeles. All
participants had normal or corrected vision, and none had partici-
pated in the previous experiments.
Design. The variables of element type (filled or outline), shape
(fat or thin), and inducer rotation (2°, 3°, 4°, and 8°) were fully
crossed in a within-subjects design. This yielded 16 trials, which
composed a block of trials. Participants ran 1 block of 16 trials for
practice, and then 10 additional blocks for the experiment.
Stimuli and apparatus. The stimuli were created by using only
the inducing element in the bottom left of the illusory and outline
displays from Experiment 2. No disparity information was pre-
sented. Each display consisted of the inducing element presented in
the center of the screen. Stimuli were presented on a Mitsubishi 20
in. (0.51 m) DiamondVision monitor, controlled by a MacProbe
program running on a PowerMacintosh 7100.
Procedure. Participants were seated 1 m from the monitor and,
as in Experiments 1 and 2, were told they were to decide whether
the shape they perceived was fat or thin. Examples of fat and thin
figures were shown. Participants were then told that this shape
judgment could be made using only part of the display, namely the
bottom-left portion of the display. The experimenter then covered
all of the display except the inducing element in the lower left and

866 KELLMAN, YIN, AND SHIPLEY
indicated the correct response of "fat" when the single element was
tilted to the left and "thin" when it was tilted to the right. Other
details of the procedure were identical to those of the previous
experiments.
Results
The main results are shown in Figure 8. There was nodifference in performance for outline and filled single-element displays. A 4 (inducer rotation) X 2 (inducingelement type: outline or filled) repeated-measures ANOVAshowed a reliable main effect of inducer rotation, F(3,42) =33.79, p < .001, but no effect of inducing element type(F < 1). There was no reliable interaction.
Pairwise comparisons showed that the inducer rotationeffect was similar to that found in Experiment 2: Reactiontimes generally decreased as inducer rotation increased, withthe exception that rotations of 3° and 4° showed no RTdifference (F < 1).
The single elements in the filled condition of this experi-ment were identical to elements used in Experiment 1 in themisaligned-element control condition. The single elementsin the outline condition of this experiment were identical toelements used in the outline control condition of Experiment2. To test the interpretation that in the noncompletionconditions of Experiments 1 and 2, participants used localorientation information from single elements, we comparedperformance on the single-element filled displays to thefour-element, filled, misaligned displays of Experiment 1,and we compared the single-element outline displays withthe four-element, outline displays used in the control condi-tion of Experiment 2. For the single versus multiple-misaligned elements, a 2 (experiment) X 4 (rotation)ANOVA showed a main effect of rotation, F(3,84) = 9.70, p< .0001, no reliable main effect of experiment, F(l, 28) =2.35 (ns), and no interaction (F < 1). For the single versusmultiple-outline element displays, a 2 (experiment) X 4(rotation) ANOVA showed a main effect of rotation, F(3,84)= 27.55, p < .0001, no reliable main effect of experiment(F < 1), and no interaction (F < 1).
9501
9°°850
800
750
700
O-"3 4 e
ELEMENT ROTATION (deg)
Figure 8. Reaction times (in milliseconds) in Experiment 3 for
filled and outline single-element displays. Error bars show ± 1 SE
of the mean.
Discussion
The results of Experiment 3 clarify the interpretation ofExperiment 2. Individual outline elements were processedsimilarly to filled ones. Therefore, the effect of the outlinecontrol displays in Experiment 2 was not likely caused bysome generally slower processing of outline edges relativeto edges of filled areas. Participants' slower performance onoutline displays in Experiment 2 indicates an object comple-tion advantage for quasimodal, illusory, and occluded dis-plays. The object completion process that produces thisadvantage is not engaged by outlined elements.
Comparisons of processing between Experiment 3 andearlier control conditions showed no reliable differences,suggesting that in the noncompletion conditions, partici-pants' responses are based on local element orientationinformation. This must have been the case in Experiment 3,in which only a single element was presented on each trial.The close correspondence of response patterns between thesingle outline element in Experiment 3 and the outlinedisplays in Experiment 2 suggests that participants did notuse any interelement relationships in performing the task incontrol conditions, in contrast to the completion conditions.
General Discussion
These experiments support several general conclusions.First, the data strengthen the evidence that the fat-thinclassification task detects processing advantages producedby object completion (Ringach & Shapley, 1996). Previousresearch showed this advantage primarily with respect toone kind of control display: Two inducing elements weremirror-reversed to disrupt completion (Ringach & Shapley,1996). In another experiment, additional lines were inter-posed to interfere with completion. Almost any controlcondition taken in isolation is susceptible to alternativeinterpretations. For example, the mirror-image manipulationchanges the positions of some display contours, which mayhave unknown effects on processing. One particular changeis that it orients the concavities in two elements outward,disrupting completion but also making it harder for a viewerto imagine a figure enclosed by the elements. In themisaligned-element control condition of Experiment 1, allconcavities remained inward toward a central region. In theoutline control condition of Experiment 2, element contoursmatched the locations in the completion displays. A possiblealternative explanation, based on speed of processing, forperformance with outline controls was ruled out by Experi-ment 3.
These additional controls implicate object completion asthe cause of the performance advantage. In every conditionof every experiment, the correct response could be deter-mined from the orientation of two perpendicular edges inany single element. Performance across conditions, how-ever, showed a clear pattern of variation. Illusory, occluded,and quasimodal object displays were processed faster thandisplays that should have disrupted object completion.
Second, the identity hypothesis is supported in two waysby these experiments. Illusory and occluded object displays

ILLUSORY AND OCCLUDED OBJECT COMPLETION 867
were always processed similarly, replicating earlier resultssuggesting common underlying mechanisms. What is more,tests of a new class of displays showed that illusory contoursand occluded contours can join. The joining occurs underconditions that fulfill neither the requirements for illusorycontour completion alone nor occluded contour completionalone. Thus, the completed boundaries and figures areneither strictly modal nor amodal. They are both, or neither,or perhaps quasimodal. The existence of quasimodal dis-plays argues against the notion that edge formation can beseparated into separate processes of modal and amodalcompletion. The fact that quasimodal displays are processedsimilarly to pure illusory and occluded displays providesobjective evidence for completion in these new displays andis consistent with their dependence on the same mechanismsthat produce occluded and illusory edges.
Other phenomena provide related logical arguments thatedge completion occurs in situations that cannot be classi-fied as modal or amodal. Consider the display shown inFigure 9. (This stereopair should be free-fused or viewed ina stereoscope. The discussion below assumes free-fusing bycrossing the eyes; all of the effects should occur foruncrossed viewing, but the depths are reversed.) A horizon-tal white bar is visible, slanted in depth around a verticalaxis. It can be seen that the left end of the bar is nearest, theright end farthest, and the depth positions along the barchange smoothly from left to right. Most interesting is theappearance of visual interpolation along the bar. It hasillusory contours (modal completion) between the leftcircular element and the middle of the center circularelement. It then passes behind the right edge of the centerelement and becomes occluded (amodal completion) by thesurrounding surface before appearing through a circularwindow on the right.
This display is constructed so that no depth information isgiven for the bar except at its ends. Crossed disparity placesthe left end closest to the viewer and the right end farthest.How do the remaining parts of the bar take on positions indepth? Part of the answer is not mysterious: Within anobject, depth can "spread" between endpoints (Gillam,Chambers, & Russo, 1988; Nakayama, Shimojo, & Silver-
ceo cc*(a)
Figure 10. A spontaneously splitting object that illustrates theFetter (1965) effect. Despite homogeneous surface quality, thedisplay is seen as containing two separate objects. The Fetter effectrefers to the following: Where regions of the two objects cross, theone having shorter interpolated boundaries appears in front(Redrawn from Kanizsa, 1979.)
man, 1989).2 The instructive part of this example is theinteraction between object completion and depth position-ing. Depth does not spread to all points of the white surface:It spreads within the object's interpolated contours. Thismeans that object completion must occur before the interme-diate positions assume their perceived depth values. Yet theappearance of the completed contours and surfaces asamodal (occluded) or modal (illusory) depends on thesedepth values. Therefore, it makes no sense to attribute part ofthe boundary interpolation here to an amodal completionprocess and part to a modal completion process. Theinterpolation process logically precedes the determinationof modal or amodal character.
Similar considerations apply to interpolation of the bound-aries of the middle circular element It has an occludedcontour boundary cm UK left and an illusory contour boundary onthe right. These apparent positions depend on the depthpositions of parts of the interpolated horizontal bar.3
Although the example we have just discussed is new,there is a well-known phenomenon that suggests the sameexplanation. Figure 10 shows a type of display discoveredby Fetter (1965) and discussed by Kanizsa (1979). Itinvolves SSOs, in which homogeneous regions appear tosplit into two segregated objects. Fetter noticed that whenthe interpolated boundaries of the two objects cross, there isa rule that governs which appears in front and which behind.The interpolated boundary that traverses the smaller gaptends to appear modally (in front), whereas the boundarythat traverses the larger gap appears amodally (behind). The
Figure 9. (a) Display in which contour interpolation must pre-cede determination of modal or amodal appearance. Free-fuse bycrossing the eyes, (b) Top view of the perceived 3-D arrangementin (a).
2We avoid the commonly used term disparity spreading becauseit is perceived depth that spreads, not the stimulus informationgiven by retinal disparities.
3With prolonged viewing, a different appearance may be noted.The bar may appear to attach to the edge of the middle circularelement This appearance may reflect some depth-spreading compe-tition from the middle element, and it appears to depend on wherethe observer fixates. We focus here on the immediate appearance ofthe display. We thank Barton Anderson for pointing out thealternative appearance as well as for useful discussions of depthspreading.

868 KELLMAN, YIN, AND SHIPLEY
logical implication is similar to mat in the example above.
The computation that determines depth ordering here compares
the length of interpolated boundaries. It would appear, therefore,
that interpolated boundaries must be registered before their
appearance as modal or amodal can be determined
It is important to avert a possible misunderstanding. These
examples hi which depth ordering logically must occur after
boundary interpolation are rare. It does not appear that depth
ordering is in general determined after boundary interpola-
tion. It can be when displays (or display parts) have poorly
specified depth to begin with or when the depth of certain
surfaces is roughly the same. In many ordinary viewing
situations, depth information about the positions of parts of
objects is unambiguous. Such depth information provides an
input to the unit formation process (Kellman & Shipley,
1992), and indeed, differences in depth may prevent other-
wise relatable object parts from joining perceptually (Kell-
man, Machado, Shipley, & Li, 1996; Kellman & Shipley,
1991). Also, the 3-D positions of other contours and surfaces
may influence the strength of completion (Anderson &
Julesz, 1995; Nakayama et al., 1989). Although this point
has perhaps been underemphasized, in our model of bound-
ary interpolation (Kellman & Shipley, 1991, 1992) depth is
involved both at the beginning and at the end of the process.
On the input side, depth relations are an important compo-
nent of edge relatability, which determines edge interpola-
tion. After interpolation occurs, final depth adjustments may
occur as a result of new (interpolated) boundaries and
surface regions (Kellman & Shipley, 1991,1992).
The logical impact of the new type of display (Figure 9)
and Fetter-effect displays, then, is not that interpolation must
always precede depth positioning but that it does sometimes.
The fact that completion mechanisms can operate on objects
whose final depth order will be determined later, as a
consequence of completion, precludes the notion that comple-
tion itself is modal or amodal. Likewise, the existence of
quasimodal displays, which engage completion mechanisms
similarly to occluded and illusory object displays, makes the
same point in a different way. This conclusion rests on
interpreting the terms amodal and modal (Michotte et al.,
1964) as referring to the appearance, specifically the depth
order, of perceived edges and surfaces. A modally completed
surface is the nearest to the observer in its visual direction,
whereas an amodally completed one is not—some other
surface is in front. The logical point we are making is that
this final appearance cannot be used to individuate two
processes of completion. It is of course possible that there
are multiple completion processes in the visual system and
that they involve various neural mechanisms. But individuat-
ing these processes and mechanisms has to be done on some
bases other than their ultimate modal or amodal appearance.
The findings and analyses indicating that edge completion
can precede the determination of modal or amodal appear-
ance in the final percept supports a common component in
the generation of illusory and occluded objects. Not all
aspects of these completion phenomena may be common,
however. For example, the time required for initial registra-
tion of the visible parts of displays may differ (Ringach &
Shapley, 1996, Experiment 6). There is also some contro-
versy as to whether illusory contour displays and occlusion
displays have similar effects in visual search. Davis and
Driver (1994) reported that illusory figure displays can be
detected without focal attention (RT was roughly constant
across distractor-set size), whereas displays with an addi-
tional line drawn in, much like the occlusion displays used hi
our experiments, required focal attention (RT increased with
distractor-set size). Earlier, Grabowecky and Treisman (1989)
reported that illusory contour displays also required serial
search. The Davis and Driver paradigm was unique in that
all elements first appeared as solid circles and then trans-
formed. It is possible that "pop-out" in the illusory contour
displays could have been mediated by information other
than the presence of an illusory form. Perhaps participants
were detecting the presence of smooth curves along the
exterior of the display. Because the distractors were inducing
elements that faced outwards, such regions only occurred
when the illusory figure was present. This basis for discrimi-
nation was unavailable in the control conditions in which all
displays were completely bounded by circles. Unfortunately,
these issues make it hard to tell whether there is truly any
difference between illusory and occluded figures in visual
search. In any case, a difference in visual search could reflect
differences in the way attention handles the outputs of object
formation rather than differences in the formation processes
themselves. Specifically, surfaces that end up being the nearest in
their visual direction (modal) may be more likely to attract
attention than those that end up in a further depth layer.
At the physiological level, results by Peterhans and von
der Heydt (1991) suggest that certain V2 cells are stimulated
when then- receptive fields fall within the gaps of illusory
contour displays, but this does not occur for a display with
additional lines drawn in. This interesting result may suggest
that although the interpolation process is similar across
different displays, the actual neural mechanisms differ. It is
difficult, however, to interpret with much confidence the
function of single neural responses. Although these V2 cells
could be computing illusory contours, they could be doing
numerous other things. Also, controversy persists about the
requirements that must be met to claim that a stimulus falls
outside of a cell's receptive field (Bock & Goode, 1994).
If there are differences in neural coding, our results pose
some interesting questions: How are quasimodal displays
encoded? What neural mechanisms operate in displays in
which the occluded or illusory status of an edge is deter-
mined after interpolation of the edge? These questions will
be important in guiding further research on what different
completion phenomena do and do not have in common. Our
results suggest, on empirical and logical grounds, that
despite their differing phenomenology, illusory and oc-cluded (modal and amodal) object completion depend on a
common process of edge interpolation.
References
Anderson, B. L., & Julesz, B. (1995). A theoretical analysis ofillusory contour formation in stereopsis. Psychological Review,102, 705-743.
Bock, G. R., & Goode, J. A. (1994). Higher-order processing in thevisual system. Chichester, England: Wiley.

ILLUSORY AND OCCLUDED OBJECT COMPLETION 869
Brigner, W. C., & Gallagher, M. B. (1974). Subjective contour:Apparent depth or simultaneous brightness contrast? Perceptualand Motor Skills, 38, 1047-1053.
Davis, G., & Driver, ]. (1994). Parallel detection of Kanizsasubjective figures in the human visual system. Nature, 371,791-793.
Gillam, B., Chambers, D., & Russo, T. (1988). Postfusional latencyin stereoscopic slant perception and the primitives of stereopsis.Journal of Experimental Psychology: Human Perception andPerformance, 14, 163-175.
Grabowecky, M., & Treisman, A. (1989). Attention and fixation insubjective contour perception. Investigative Ophthalmology &Visual Science Abstracts, 50(3), 457.
Gregory, R. (1977). Vision with isoluminant color contrast: 1. Aprojection technique and observation. Perception, 6, 113-119.
Grossberg, S.. & Mingolla, E. (1985). Neural dynamics of formperception: Boundary completion, illusory figures, and neoncolor spreading. Psychological Review, 92, 173-211.
Hunt, S. M. J. (1994). MacProbe: A Macintosh-based experiment-er's workstation for the cognitive sciences. Behavior ResearchMethods, Instruments, <fe Computers, 26, 345—351.
Jory, M., & Day, R. (1979). The relationship between brightnesscontrast and illusory contours. Perception, 8, 3-9.
Kanizsa, G. (1979). Organization in vision. New York: Praeger.Kellman, P., & Loukides, M. (1987). An object perception ap-
proach to static and kinetic subjective contours. In S. Petty &G. E. Meyer (Eds.), The perception of illusory contours (pp.151-164). New York: Springer-Verlag.
Kellman, P. J., Machado, L., Shipley, T. R, & Li, C. C. (1996). 3-Ddeterminants of object completion. Investigative Ophthalmology& Visual Science Abstracts, 37(3), 685.
Kellman, P. J., & Shipley, T. F. (1991). A theory of visualinterpolation in object perception. Cognitive Psychology, 23,141-221.
Kellman, P. J., & Shipley, T. F. (1992). Perceiving objects acrossgaps in space and time. Current Directions in PsychologicalScience, 1,193-199.
Michotte, A., Thines, G., & Crabbe, G. (1964). Les complementsamodaux des structures perceptives [Amodal complements ofperceptual structures]. In Studio psychologies. Louvain, Bel-gium: Publications Universitaires de Louvain.
Nakayama, K., & Shimojo, S. (1990). Toward a neural understand-
ing of visual surface representation. Cold Spring Harbor Sympo-sia on Quantitative Biology, 55, 911-924.
Nakayama, K., & Shimojo, S. (1992, September). Experiencingand perceiving visual surfaces. Science, 257,1357-1363.
Nakayama, K., Shimojo, S., & Silverman, G. (1989). Stereoscopicdepth: Its relation to image segmentation, grouping, and therecognition of occluded objects. Perception, 18, 55-68.
Peterhans, E., & von der Heydt, R. (1991). Subjective contours:Bridging the gap between psychophysics and physiology. TrendsinNeurosciences, 14(3), 112-119.
Fetter, G. (1965). Nuove ricerche sperimentali sulla totalizzazionepercettiva. Rivista di Psicologia, 50, 213-227.
Ringach, D. L., & Shapley, R. (1996). Spatial and temporalproperties of illusory contours and amodal boundary completion.Vision Research, 36, 3037-3050.
Rock, I. (1987). A problem solving approach to illusory contours.In S. Petty & G. E. Meyer (Eds.), The perception of illusorycontours (pp. 62-70). New York: Springer-Verlag.
Shapley, R., & Ringach, D. L. (1994). Similar mechanisms forillusory contours and amodal completion. Investigative Ophthal-mology and Visual Science Abstracts, 35(4), 1491.
Shimojo, S., & Nakayama, K. (1990). Amodal representation ofoccluded surfaces: Role of invisible stimuli in apparent motioncorrespondence. Perception, 19, 285-299.
Shipley, T. F., & Kellman, P. J. (1992). Perception of partlyoccluded objects and illusory figures: Evidence for an identityhypothesis. Journal of Experimental Psychology: Human Percep-tion and Performance, 18, 106-120.
von der Heydt, R., Peterhans, E., & Baumgartner, G. (1984, June).Illusory contours and cortical neuron responses. Science, 224,1260-1262.
Yarbus, A. L. (1967). Eye movements and vision. New York:Plenum Press.
Yin, C., Kellman, P. J., & Shipley, T. F. (1997). Surface completioncomplements boundary interpolation in the visual integration ofpartly occluded objects. Perception, 26, 1459-1479.
Received December 17, 1995Revision received November 22,1996
Accepted April 1,1997