
A commentary on “The greenhouse- gas - Cornell University
17
1 23 Climatic Change An Interdisciplinary, International Journal Devoted to the Description, Causes and Implications of Climatic Change ISSN 0165-0009 Climatic Change DOI 10.1007/s10584-011-0333-0 A commentary on “The greenhouse- gas footprint of natural gas in shale formations” by R.W. Howarth, R. Santoro, and Anthony Ingraffea Lawrence M. Cathles, Larry Brown, Milton Taam & Andrew Hunter
Transcript of A commentary on “The greenhouse- gas - Cornell University

1 23
Climatic ChangeAn Interdisciplinary, InternationalJournal Devoted to the Description,Causes and Implications of ClimaticChange ISSN 0165-0009 Climatic ChangeDOI 10.1007/s10584-011-0333-0
A commentary on “The greenhouse-gas footprint of natural gas in shaleformations” by R.W. Howarth, R. Santoro,and Anthony Ingraffea
Lawrence M. Cathles, Larry Brown,Milton Taam & Andrew Hunter

1 23
Your article is published under the Creative
Commons Attribution Non-Commercial
license which allows users to read, copy,
distribute and make derivative works for
noncommercial purposes from the material,
as long as the author of the original work is
cited. All commercial rights are exclusively
held by Springer Science + Business Media.
You may self-archive this article on your own
website, an institutional repository or funder’s
repository and make it publicly available
immediately.
COMMENTARY
A commentary on “The greenhouse-gas footprintof natural gas in shale formations” by R.W. Howarth,R. Santoro, and Anthony Ingraffea
Lawrence M. Cathles III & Larry Brown & Milton Taam &
Andrew Hunter
Received: 20 June 2011 /Accepted: 21 October 2011# The Author(s) 2011. This article is published with open access at Springerlink.com
Abstract Natural gas is widely considered to be an environmentally cleaner fuel than coalbecause it does not produce detrimental by-products such as sulfur, mercury, ash andparticulates and because it provides twice the energy per unit of weight with half the carbonfootprint during combustion. These points are not in dispute. However, in their recentpublication in Climatic Change Letters, Howarth et al. (2011) report that their life-cycleevaluation of shale gas drilling suggests that shale gas has a larger GHG footprint than coaland that this larger footprint “undercuts the logic of its use as a bridging fuel over thecoming decades”. We argue here that their analysis is seriously flawed in that theysignificantly overestimate the fugitive emissions associated with unconventional gasextraction, undervalue the contribution of “green technologies” to reducing those emissionsto a level approaching that of conventional gas, base their comparison between gas and coalon heat rather than electricity generation (almost the sole use of coal), and assume a timeinterval over which to compute the relative climate impact of gas compared to coal thatdoes not capture the contrast between the long residence time of CO2 and the shortresidence time of methane in the atmosphere. High leakage rates, a short methane GWP,and comparison in terms of heat content are the inappropriate bases upon which Howarth etal. ground their claim that gas could be twice as bad as coal in its greenhouse impact. Usingmore reasonable leakage rates and bases of comparison, shale gas has a GHG footprint thatis half and perhaps a third that of coal.
Climatic ChangeDOI 10.1007/s10584-011-0333-0
Electronic supplementary material The online version of this article (doi:10.1007/s10584-011-0333-0)contains supplementary material, which is available to authorized users.
L. M. Cathles III : L. Brown (*)Department of Earth and Atmospheric Sciences, Cornell University, Ithaca, NY 14853, USAe-mail: [email protected]
M. TaamElectric Software, Inc, Caroline, NY, USA
A. HunterDepartment of Chemical and Biological Engineering, Cornell University, Ithaca, NY 14853, USA
Natural gas is widely considered to be an environmentally cleaner fuel than coal because itdoes not produce detrimental by-products such as sulfur, mercury, ash and particulates andbecause it provides twice the energy per unit of weight with half the carbon footprint duringcombustion. These points are not in dispute.
However, in their recent letter to Climatic Change, Howarth et al. (2011) report that theirlife-cycle evaluation of shale gas drilling suggests that shale gas has a larger GHG footprintthan coal. They conclude that:
& During the drilling, fracturing, and delivery processes, 3.6–7.9% of the methane from ashale gas well ends up, unburned, in the atmosphere. They claim that this is at least30% and perhaps more than twice the methane emissions from a conventional gas well.
& The greenhouse gas footprint for shale gas is greater than that for conventional gas oroil when viewed on any time horizon. In fact, they state that compared with thegreenhouse gas (GHG) emissions from coal, it is 20–100% greater on the 20-yearhorizon and is comparable over 100 years.
They close with the assertion that: "The large GHG footprint of shale gas undercuts thelogic of its use as a bridging fuel over the coming decades, if the goal is to reduce globalwarming."
We argue here that the assumptions used by Howarth et al. are inappropriate and thattheir data, which the authors themselves characterize as “limited“, do not support theirconclusions.
In particular, we believe Howarth et al.’s arguments fail on four critical points:
1. Howarth et al.’s high end (7.9%) estimate of methane leakage from well drilling to gasdelivery exceeds a reasonable estimate by about a factor of three and they documentnothing that indicates that shale wells vent significantly more gas than conventionalwells.
The data they cite to support their contention that fugitive methane emissions fromunconventional gas production is significantly greater than that from conventional gasproduction are actually estimates of gas emissions that were captured for sale. Theauthors implicitly assume that capture (or even flaring) is rare, and that the gas capturedin the references they cite is normally vented directly into the atmosphere. There isnothing in their sources to support this assumption.
The largest leakage rate they cite (for the Haynesville Shale) assumes, in addition,that flow tests and initial production rates provide a measure of the rate of gas releaseduring well completion, drill out and flowback. In other words they assume that initialproduction statistics can be extrapolated back to the gas venting rates during the earlierperiods of well completion and drill out. This is incompatible with the physics of shalegas production, the safety of drilling operations, and the fate of the gas that is actuallyindicated in their references.
While their low-end estimate of total leakages from well drilling through delivery(3.6%) is consistent with the EPA (2011) methane leakage rate of ~2.2% of production,and consistent with previous estimates in peer reviewed studies, their high end estimateof 7.9% is unreasonably large and misleading.
We discuss these issues at length below.2. Even though the authors allow that technical solutions exist to substantially reduce any
leakage, many of which are rapidly being or have already been adopted by industry(EPA 2007, 2009), they seem to dismiss the importance of such technical improve-ments on the GHG footprint of shale gas. While the low end estimates they provide
Climatic Change
incorporate the potential impact of technical advances in reducing emissions from thesources common to both conventional and unconventional gas, they do not include thepotential impact of “green technologies” on reducing losses from shale gas production.The references they cite document that the methane loss rate during completion ofunconventional gas wells by modern techniques is, or could be, at least 10 times lowerthan the 1.9% they use for both their high end and low end estimates. Downplayingongoing efforts and the opportunity to further reduce fugitive gas emissions in thenatural gas industry, while at the same time citing technical improvements in the coalindustry, gives a slanted assessment which minimizes the positive greenhouse potentialof natural gas. Although the Howarth et al. agree "Methane emissions during the flow-back period in theory can be reduced by up to 90% through Reduced EmissionCompletions technologies or REC", they qualify this possibility by saying: "However,REC technologies require that pipelines to the well are in place prior to completion."This suggests that if the pipeline is not in place the methane would be vented to theatmosphere, which is misleading. If a sales pipeline is not available, the gas capturedby REC technologies could be easily be (and are) flared and the GHG footprint therebyminimized.
3. Howarth et al. justify the 20-year time horizon for their GHG comparison by simplystating that “we agree with Nisbet et al. (2000) that the 20-year horizon is critical,given the need to reduce global warming in coming decades”. But the point Nisbet etal. make in their meeting abstract is that “adoption of 20-year GWPs wouldsubstantially increase incentives for reducing methane from tropical deforestation andbiomass burning”. Their concern is that the 100-year timeframe would not discouragesuch methane emissions enough. Everyone would agree that discouraging methane aswell as CO2 emissions is desirable, but the Nisbet et al. abstract offers no supportwhatever for the adoption of a 20-year GWP timeframe when considering replacingCO2 emissions with CH4 emission by swapping coal for gas, and we strongly disagreethat the 20 year horizon is the appropriate choice in this context. As Pierrehumbert(2011) explains, “Over the long term, CO2 accumulates in the atmosphere, likemercury in the body of a fish, whereas methane does not. For this reason, it is the CO2
emissions, and the CO2 emissions alone, that determine the climate that humanity willneed to live with.” In the context of a discussion of the benefits of swapping gas forcoal, a 20 year horizon hides the critical fact that the lifetime of CO2 in the atmosphereis far longer than that of methane. Any timeframe is artificial and imperfect in at leastsome contexts, but a 100 year timeframe at least captures some of the implications ofthe shorter lifetime of methane in the atmosphere that are important when consideringswapping gas for coal. One could argue (although Howarth et al. do not) that the 20-year horizon is “critical” because of concern over triggering an irreversible tippingpoint such as glacial meltdown. However, if substituting gas for coal reduces (or couldreduce) the GHG impact on a 20-year horizon as well as on a 100-year horizon, as weargue below is the case, substitution of gas for coal minimizes the tipping point risk aswell. Most workers choose the 100 year timeframe. Hayhoe et al. (2002), for example,show that in the long, 100 year, timeframe but not on the short timeframe of 20 years orso, substitution of gas for coal reduces greenhouse warming. They consider thewarming effects of decreasing SO2 and black carbon emissions as coal burning isreduced as well as the warming effects of CO2 and CH4 emissions, and they calculategreenhouse impact of various substitution scenarios over the next 100 years using acoupled atmosphere-ocean energy balance climate model. Their analysis avoids thearbitrariness of GWP factors. Although there are many considerations regarding the
Climatic Change

transition in the short term, their analysis shows the long term benefits of swapping gasfor coal are completely missed by the 20 year GWP factor.
4. Howarth et al. choose an end use for comparing GHG footprints that is inappropriate inthe context of evaluating shale gas as a bridging fuel. Coal is used almost entirely togenerate electricity, so comparison on the basis of heat content is irrelevant. Gas that issubstituted for coal will of necessity be used to generate electricity since that is coal’salmost sole use. The appropriate comparison of gas to coal is thus in terms of electricitygeneration. The "bridge" is from coal-generated electricity to a low-carbon futuresource of electricity such as renewables or nuclear (EIA AEO 2011). Howarth et al.treat the end use of electricity almost as a footnote. They acknowledge in theirelectronic supplemental material that, if the final use is considered, “the ability toincrease efficiency is probably greater for natural gas than for coal (Hayhoe et al.2002), and this suggests an additional penalty for using coal over natural gas for thegeneration of electricity not included in our analysis”. They address the electricalcomparison in an electronic supplement table, however they do so there on the basis ofa 20 year GWP and they minimize the efficiency differential between gas and coal byciting a broad range for each rather than emphasizing the likelihood that efficient gasplants will replace inefficient coal plants. Had they used a 100 year GWP and theirlow-end 3.6% methane leakage rate, shale gas would have about half the impact ofsurface coal when used to generate electricity (assuming an electricity conversionefficiency of 60% for gas and their high 37% conversion efficiency for coal). Theelectric industry has a large stock of old, inefficient coal-fired electric generating plantsthat could be considered for replacement by natural gas (Table 1 in EIA AEO 2011).The much lower construction costs associated with gas power plants (e.g. Kaplan2008) means modern gas technology will likely replace this old coal technology as it isretired. If total (well drilling to delivery) leakage is limited to less than 2% (which maybe the current situation and, in any case, seems well within the capabilities of moderntechnology; EPA 2007, 2009), switching from coal to natural gas would dramaticallyreduce the greenhouse impact of electricity generation. Minimizing this point bystressing extreme rather than likely scenarios is perhaps the most misleading aspect ofthe Howarth et al. analysis.
Figure 1 depicts what we suggest is a more representative comparison of the likelyimpact on greenhouse gas emissions when natural gas replaces coal in older coal-burningelectric power plants. In our analysis, we assume 60% efficiency for natural gas generationof electricity, 30% efficiency for coal generation of electricity in older plants, and a totalmethane leakage rate of 2.2%. Relatively low-cost 60% efficient generators using naturalgas are commonly available (Siemens). When both fuels are used to produce electricity(MJe), the greenhouse impact of natural gas is only as bad as coal if a very high methaneleakage rate of 7.9% and a short global warming impact period of 20 years are selected(column labeled Howarth et al. in Fig. 1). If the comparison is based on the heat content ofthe fuels, the top (green) portion of the Howarth et al. column is doubled in length, and gasbecomes twice as bad as coal from a greenhouse perspective. This is the basis of Howarthet al.’s suggestion that gas could be as bad or twice as bad as coal from a greenhouseperspective. Assuming more realistic estimates of gas leakage rates and using the 100 yearglobal warming potential factor (of 33 g of GHG-equivalent CO2 per gram of methanereleased to the atmosphere), which captures the contrast in atmospheric lifetimes of CO2
and natural gas, we show in Fig. 1 that gas has a much smaller global warming impact thancoal. For leakage rates less than 2%, the impact of natural gas approaches one third that of
Climatic Change
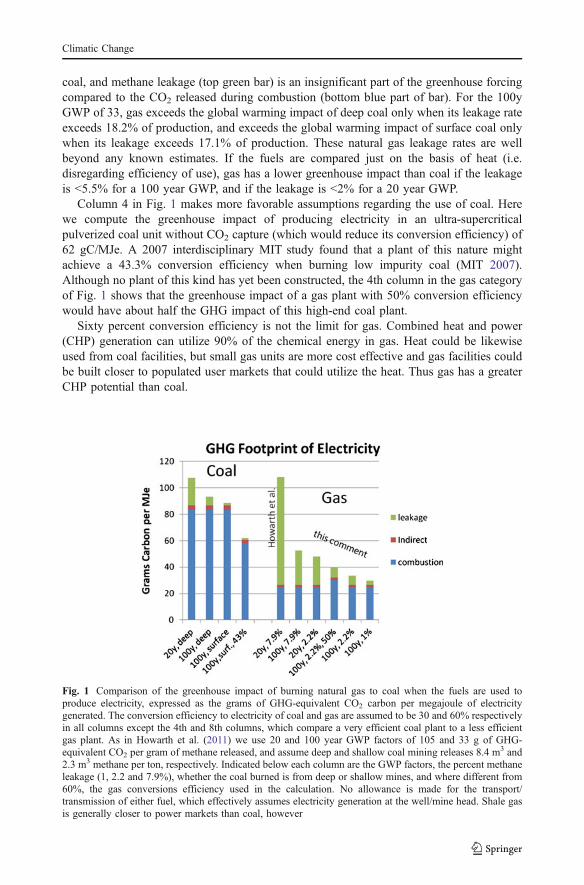
coal, and methane leakage (top green bar) is an insignificant part of the greenhouse forcingcompared to the CO2 released during combustion (bottom blue part of bar). For the 100yGWP of 33, gas exceeds the global warming impact of deep coal only when its leakage rateexceeds 18.2% of production, and exceeds the global warming impact of surface coal onlywhen its leakage exceeds 17.1% of production. These natural gas leakage rates are wellbeyond any known estimates. If the fuels are compared just on the basis of heat (i.e.disregarding efficiency of use), gas has a lower greenhouse impact than coal if the leakageis <5.5% for a 100 year GWP, and if the leakage is <2% for a 20 year GWP.
Column 4 in Fig. 1 makes more favorable assumptions regarding the use of coal. Herewe compute the greenhouse impact of producing electricity in an ultra-supercriticalpulverized coal unit without CO2 capture (which would reduce its conversion efficiency) of62 gC/MJe. A 2007 interdisciplinary MIT study found that a plant of this nature mightachieve a 43.3% conversion efficiency when burning low impurity coal (MIT 2007).Although no plant of this kind has yet been constructed, the 4th column in the gas categoryof Fig. 1 shows that the greenhouse impact of a gas plant with 50% conversion efficiencywould have about half the GHG impact of this high-end coal plant.
Sixty percent conversion efficiency is not the limit for gas. Combined heat and power(CHP) generation can utilize 90% of the chemical energy in gas. Heat could be likewiseused from coal facilities, but small gas units are more cost effective and gas facilities couldbe built closer to populated user markets that could utilize the heat. Thus gas has a greaterCHP potential than coal.
Fig. 1 Comparison of the greenhouse impact of burning natural gas to coal when the fuels are used toproduce electricity, expressed as the grams of GHG-equivalent CO2 carbon per megajoule of electricitygenerated. The conversion efficiency to electricity of coal and gas are assumed to be 30 and 60% respectivelyin all columns except the 4th and 8th columns, which compare a very efficient coal plant to a less efficientgas plant. As in Howarth et al. (2011) we use 20 and 100 year GWP factors of 105 and 33 g of GHG-equivalent CO2 per gram of methane released, and assume deep and shallow coal mining releases 8.4 m3 and2.3 m3 methane per ton, respectively. Indicated below each column are the GWP factors, the percent methaneleakage (1, 2.2 and 7.9%), whether the coal burned is from deep or shallow mines, and where different from60%, the gas conversions efficiency used in the calculation. No allowance is made for the transport/transmission of either fuel, which effectively assumes electricity generation at the well/mine head. Shale gasis generally closer to power markets than coal, however
Climatic Change
1 Methane venting during well completion and drill out of unconventional gas wells
A critical part of Howarth et al.’s paper’s contention that shale gas has a larger greenhouseimpact than conventional gas is the contention that an unconventional gas well vents 1.9%of its lifetime gas production during well completion. (Unconventional gas wells includethose producing from tight sands, shales, and coal bed methane wells—the Howarth et al.figures assume that emissions from these are all similar.) This is dramatically more than the0.01% they cite as vented by a conventional gas well. Their 1.9% number is a largecomponent in their high-end leakage rates, which are themselves central to their contentionthat the global warming impact of gas could be twice as bad as coal on a heat content basis.
We agree with Howarth et al. that the available data are extremely limited, that theiranalysis relies heavily on powerpoint presentations rather than values published in reviewedliterature, and that there is an obvious need for better estimates. However, given the lack ofquality data, we feel that the authors have a responsibility to make explicit the nature andlimitations of such sources, and to be especially clear on the assumptions made in theirinterpretation of such data. We feel that was not done, and offer the following to put theirestimates in context.
There are fundamental problems with key numbers that they use in their Table 1 tosupport their 1.9% contention:
(1) The numbers they use to represent fugitive emissions for the Haynesville Shale cannotbe found in the references they cite. That the daily methane loss estimates shown intheir Table 1 are close to the initial production (IP) values cited in their referencessuggests that the authors assume that the latter is somehow an estimate of the former.As argued below and in the electronic supplement, this is incompatible with (a) thebasic physics of gas production, (b) the economic incentives of gas production, and (c)the only early production data related to shale gas that can be found amongst any oftheir references.
(2) The only discussion of methane losses during well completion is found in the citationsfor tight gas sands, and those values are presented to illustrate how currently usedtechnologies can capture most (up to 99%; Bracken 2008) of those “losses” for sale.
(3) Their estimate of methane loss from drill out is based on two numbers from thePiceance Basin reported in a powerpoint slide presented to an EPA Gas STARconference (EPA 2007). They assume that 10 million cubic feet of gas is typicallyvented during well drill out rather than being captured or flared, although their sourcemakes no such claim. For reasons discussed below and in the electronic supplement,gas production is rare during drill out and if significant gas were produced during drillout it would not be emitted into the atmosphere for economic and safety reasons.
(4) The magnitude of the releases they suggest are not credible when placed in the contextof well completion and well pad operating procedures, safety, and economic factors.
The high releases of methane Howarth et al. suggest for the Haynesville data in theirTable 1 are the most problematic because they skew the average for the suite of locationslisted, and because the numbers are not based on documented releases to the atmospherebut rather on initial production rates that may well have been captured and sold or flared.
The value shown in their Table 1 for methane emitted during flowback in theHaynesville does not exist in any of their citations. The reference linked to this number(Eckhardt et al. 2009) is an online industry scout report on various values of flow tests andinitial production (IP). To the extent that this reference deals with the fate of the gasassociated with those flow tests it indicates that the production was captured and sold. The
Climatic Change
estimate for IP for the Haynesville is based on another informal, unvetted, web posting by agas producer that is no longer available. However that estimate of IP is consistent with thevalues cited in Eckhardt et al. and the known characteristics of Haynesville wells. The facttheir values for the daily rate of “lost” emissions for the Haynesville are virtually identicalto the IP values for the wells indicates that the authors believe or assume that: (a) a wellproduces gas during completion at a rate that is equal to the highest rate reported for thewell (the IP rate), and (b) that this gas is vented directly to the atmosphere. They provide nodocumentation for either of these beliefs/assumptions, which are on multiple groundsillogical. Because initial production is the highest flow achievable, and flowback occurswhen the well still contains substantial water, flowback gas recoveries cannot exceed initialproduction recoveries, although Howarth et al. imply this is the case for all the areas listedin their Table 1. The problem is this: High gas flow rates are not possible when the well issubstantially full of water, as it usually is during the flowback period. Gas cannot move upa wellbore filled with water other than in isolated packets, and it can flow optimally onlywhen enough water is removed for the gas to have a connected pathway of gas up the wellto the surface. Unless otherwise explicitly noted, initial production figures are published toshow the highest recorded production rate for each well. They are a benchmark thatcharacterizes what optimal production rate can be achieved by a well (and for which there isevery incentive for producers to exaggerate in order to attract investors: http://www.oilempire.us/shalegas.html). These initial production tests are seldom run until after anysubstantial water has been removed from the well because substantial water impedes theoutflow of gas.
The only sources which explicitly provide estimates of gas production duringcompletion are for the Barnett (EPA 2004; although the Barnett is not named in thisreference), the Piceance (EPA 2007), the Uinta (Samuels 2010), and the Den Jules (Bracken2008) gas sands. These references report how gas production was recovered for sales andimply that this has been the case (at least for these companies) for several years! Theyemphasize the strong economic incentives for gas producers to capture and sell completiongases rather than flare or vent them. Only one (EPA 2007) provides explicit measurementsof both captured (with “green technology”) and lost emissions, and these numbers indicatea loss rate of 0.1% of total production. Howarth et al. cite the gas capture numbers in thesereferences as representative of the gas leakage into the atmosphere that would occur if thegas was neither captured nor flared. They assume that this is the common situation, but donot make it clear that they have made this assumption. Rather they buttress their leakageestimates with the citations as if the latter explicitly documented methane leakage into theatmosphere, which they do not.
Based on Howarth et al’s own references, as confirmed by conversations we have hadwith people experienced in well completions, we believe the losses during drill out and wellcompletion for unconventional shale gas wells are not significantly greater than those citedby Howarth et al. for conventional gas wells. Certainly this could be made to be the case.This is supported by some of the examples cited by the EPA and Howarth et al. TheWilliams Corp (EPA 2007, p 14) shows, for example, that >90% of the flowback gas iscaptured and some of the remainder flared (George 2011, p14). If this were generally thecase Howarth et al.’s 1.9% leakage would be reduced to 0.2%. An alternative life cycleanalysis of a natural gas combined cycle power plant shows the total methane release fromunconventional Barnett Shale hydrofractured gas wells is within a few percent of that fromconventional onshore gas wells (DOE/NETL 2010, Table 5.1 and Figure 5.1). The leakageduring drill out and well completion could be legislated to near zero by legally requiringflaring.
Climatic Change

It is also worth pointing out that much of the oil produced in the United States at presentis either from hydrofractured wells or shale formations, and thus is unconventional oil.Almost every conventional and unconventional oil well also produces natural gas. A cleandistinction between “conventional” and “unconventional” gas production, and between“oil” and “gas” wells, thus may be very difficult to make, as there is an enormous amountof overlap between these categories.
Additional material supporting the statements made above is provided in an electronicsupplement to this commentary. We describe there what happens when a well is completedand brought into production, and explain why a well cannot vent at its IP rate during theearly drill out and completion phases, and (with discussion and a figure) why Howarth etal.’s projection of the IP rate to the flowback stage (these early stages) of well developmentis inappropriate. We discuss the purpose and nature of a scout report and show that thescout report cited by Howarth et al. states that the reported gas production was captured anddiverted to sales (not vented into the atmosphere as Howarth et al. imply). We discuss thesafety implications of Howarth et al.’s contention that 3.2% of the total eventual productionof a shale gas well is vented into the atmosphere over a period of ~10 days, and show thatthis represents $1,000,000 worth of gas and presents a fire/explosion hazard that nocompany would countenance. And we show that the EPA’s suggestion of release rates 50%of Howarth et al.’s is based on the assumption that, where capture or flaring is not requiredby law, methane is released to the atmosphere—an assumption that is not warranted oncurrent practice, economic, or safety grounds. Those not familiar with well completion andproduction or economic and safety well procedures may find this additional material useful.
2 Methane leakage from the well site to the customer
The leakage that occurs between an operating well and consumers as the result of gashandling, processing, storage, and distribution is the same whether the well is producingfrom tight shale or conventional source rock. These losses are very hard to measure as theyrely on a variety of sources that cannot be controlled in a scientific fashion. As well as trueleakage you have to deal with questions of metering accuracy, shrinkage due to removal ofhigher order hydrocarbons, fuel use by compressors along the pipeline, etc. Trying to reachan estimate is important because various parties have a financial interest in the gas as ittravels to the consumer, but scientific assessments are also encumbered by accountingconventions that relate to how gas transmission is charged to pipeline users. The results ofmost studies should not be considered accurate estimates that can be used for climatestudies.
With well completion and drill out losses from both sources negligibly small (seeabove), the range of methane emissions that Howarth et al. identify is from 1.7 to 6% oftotal production. Leaking 6% of the gas that will ultimately be produced into theatmosphere during on-site handling, transmission through pipelines, and delivery appears tobe far too high and at odds with previous studies. The most recent comprehensive study(EPA 2011, Table 3–37, assuming a 2009 U.S. production of natural gas of 24 TCF) showsthe emission of methane between source and user is ~2.2% of production. Breaking thisdown, 1.3% occurs at the well site, 0.73% during transmission, storage, and distribution,and 0.17% during processing. The EPA Natural Gas STAR program (EPA 2009), avoluntary partnership to encourage oil and natural gas companies to adopt best practices,reports methane emissions of 308 BCF in 2008 This represents an emission of ~1.3% oftotal production. A life cycle analysis of combined cycle natural gas power pollutants
Climatic Change
suggests leakage can be much smaller. This report estimates ~0.9 wt.% leakage of methanebetween source and consumer (DOE/NETL 2010, Table 5.1), and suggests what bestpractices might achieve. A reasonable range for methane emissions to the atmospherebetween source and consumer in the U.S. (the proper subject of the current discussion)would thus appear to be between 0.9 and 2.2% of production.
Excepting completion and drill out losses, the losses during transmission, storage anddistribution, which Howarth et al. claim are conservatively 1.4–3.6% of production,constitute the largest fraction of their range of total gas losses of 1.7–6%. Howarth et al.’stransmission, storage and distribution losses are 2–5 time higher than the EPA (2011)estimate of 0.73%. Even their low end estimate seems far too high. Furthermore, manyorganizations have addressed these leakages, and many are striving to reduce them. Even ifa 6% leakage rate were true in the US, the obvious policy implication would surely be to“fix the leaks”. For example, Russian leakage was huge in the 1980s but with recentinvestments and improvements their leakage rate now is comparable to and perhaps lessthan ours. Of all the possibilities one could think of, reducing methane leakage should bethe easiest, most accessible, and least costly way to reduce greenhouse gas emissions, andsomething that should be done regardless of how a comparison of gas and coal turns out.
3 Conclusions
We have highlighted key aspects of the recent letter from Howarth et al. that we believe aremisleading.
The first aspect is the question of just how much methane gets released directly into theatmosphere during drilling, production, and transmission from unconventional gas wells.We show that the authors base their leakage rates heavily on two assumptions: (1) thatdrillers vent gas to the atmosphere during the drill out and pre-IP stages of developmentrather than capture and divert it to sales or flare it, and (2) that the discharge rate duringthese periods is comparable to the maximum production rate the well will experience—theIP rate. Absent very specific documentation, which Howarth et al do not offer, we can findno reasons to suspect that it is current industry practice to vent gas during these periods atthe extreme rates and quantities Howarth et al. suggest, and we find obvious economic andsafety reasons that this would not be industry practice. Howarth et al.’s assessment of theleakage from shale gas production appears to be too large by a factor of ~10 (0.2% oflifetime production rather than the 1.9% Howarth et al. assume). Even if we were to accepttheir estimate as representative of current practice (which we believe it is not), it is clearfrom Howarth et al.’s own citations that there are existing technological options that cangreatly reduce such losses, and future technological improvements are sure to further reducelosses venting from both conventional and unconventional wells.
The second aspect of the Howarth et al. paper that we question is the effect of methane leakagefrom gas drilling on greenhouse gases and the future climate. Howarth et al. compute the GHGimpacts using the most unfavorable time period (20 years vs 100 years) and basis (heat vselectricity) for comparing gas with coal. Considering that coal is used almost exclusively forgenerating electricity, gas must replace electricity generation by coal and the fuels should becompared on this basis. When considering the impact of swapping methane for CO2 it isimportant to take into account the very short lifetime of methane in the atmosphere compared tothe very long lifetime of the CO2. The 100 year GWP for methane does this, the 20 year GWPdoes not. Focusing on electricity generation and using a 100 year GWP we show, using thesame methods as Howarth et al., that gas has less than half and perhaps a third the greenhouse
Climatic Change
impact as coal. Since gas also possesses other important emission advantages such as noparticulates, SO2, NO2, or ash, it is clearly the “cleaner” option in comparison to coal. Howarthet al. arrive at their conclusion that gas could have twice the greenhouse impact as coal only byusing fugitive gas emissions 3.6 times larger than is reasonable (e.g. 2.2%), selecting a 20 yearGlobal Warming Potential period for methane (which confers an impact 3.2 times bigger than a100 year GWP), and failing to consider that a modern gas plant can generate electricity nearlytwice as efficiently (and therefore with half the GHG input) as old coal plants.
It is of course possible, although we consider it highly unlikely and find no evidence tothat effect, that methane emissions from wells and pipelines might be as large as Howarth etal. aver. But, as they acknowledge, these leaks could be economically and relatively easilyfixed. Addressing whatever deficits natural gas might have at present so that it realizes thepotential GHG benefits that are indicated in our Fig. 1 seems to us a goal eminently moreachievable with current technology, and should be far more economic and less risky thanrelying on undeveloped and unproven new technologies to achieve the same degree ofGHG reduction through other methods. Surely we need to consider how to reduce GHGemissions for all fuels, and should do the best we can with all the fuels we are using and arelikely to continue using for some time. But in the short term, our energy needs should besatisfied mainly by those fuels having the fewest inherent environmental disadvantages, andwe believe those preferred fuels include natural gas.
Open Access This article is distributed under the terms of the Creative Commons AttributionNoncommercial License which permits any noncommercial use, distribution, and reproduction in anymedium, provided the original author(s) and source are credited.
References
Bracken K (2008) Reduced emission completions in DJ basin and natural buttes. Presentation given at EPA/GasSTAR Producers Technology Transfer Workshop. Rock Springs Wyoming, 1 May 2008. http://www.epa.gov/gasstar/documents/workshops/2008-tech-transfer/rocksprings5.pdf
DOE/NETL (2010) Life cycle analysis: natural gas combined cycle (NGCC) power plant, DOE/NETL-403-110509, p127. http://www.netl.doe.gov/energy-analyses/pubs/NGCC_LCA_Report_093010.pdf
Eckhardt M, Knowles B, Maker E, Stork P (2009) IHS U.S. Industry Highlights. (IHS) Houston, TX, Feb–Mar 2009. http://www.gecionline.com/2009-prt-7-final-reviews
EIA AEO (2011) Annual energy outlook. http://www.eia.gov/forecasts/aeo/pdf/0383(2011).pdfMIT (2007) The future of coal, an interdisciplinary MIT study. http://web.mit.edu/coal/The_Future_of_Coal.pdfEPA (2011) Inventory of greenhouse gas emissions and sinks 1990–2009, EPA 430-R-11-005, p55. http://
epa.gov/climatechange/emissions/usinventoryreport.htmlEPA (2009) EPA natural gas STAR program accomplishments, http://www.epa.gov/gasstar/accomplishments/
index.html#threeEPA (2007) Reducing methane emissions during completion operations, 2007 natural gas STAR production
technology workshop, Glenwood Springs, CO, September 11, 2007. http://epa.gov/gasstar/documents/workshops/glenwood-2007/04_recs.pdf
EPA (2004) Green completions. Natural Gas STAR Producer’s Technology Transfer Workshop, 21September 2004. http://epa.gov/gasstar/workshops/techtransfer/2004/houston-02.html
George, F (2011) Re: Comments from El Paso Corporation on the DRAFT Inventory of U.S. GreenhouseGas Emissions and Sinks: 1990–2009, p25
Howarth R, Santoro T, and Ingraffea A (2011) Methane and the greenhouse gas footprint of natural gas fromshale formations. Climatic Change. doi:10.1007/s10584-011-0061-5. http://www.springerlink.com/content/e384226wr4160653/
Hayhoe K, Kheshgi HS, Jain AK, Wubbles DJ (2002) Substitution of natural gas for coal: climatic effects ofutility sector emissions. Climate Change 54:107–139
Kaplan, S (2008) Power plants: characteristics and costs. Report to Congress. http://www.fas.org/sgp/crs/misc/RL34746.pdf
Climatic Change

Nisbet EG, Manning MR, Lowry D, Lassey KR (2000) Methane and the framework convention on climatechange, A61F-10, Eos Trans. AGU 81(48). Fall Meet Suppl
Pierrehumbert R (2011) http://www.realclimate.org/index.php/archives/2010/12/losing-time-not-buying-time/Samuels J (2010) Emission reduction strategies in the greater natural buttes. Anadarko Petroleum
Corporation. EPA Gas STAR, Producers Technology Transfer Workshop Vernal, Utah, 23 March2010. http://www.epa.gov/gasstar/documents/workshops/vernal-2010/03_anadarko.pdf
Siemens power plants http://www.energy.siemens.com/us/en/power-generation/power-plants/gas-fired-power-plants/combined-cycle-power-plant-concept/scc5-8000h-1s.htm#content=Description
Climatic Change

Electronic Supplementary Material Gas production is a specialized topic that is unfamiliar to most people, including most scientists. Best practice descriptions cover many aspects of gas drilling and hydrofracturing (e.g., API HF1, 2009), but we have found very few descriptions of well completion and flowback procedures (e.g., Lavelle, 2010), and these are quite general. We therefore describe below what we have discerned from conversations with those experienced with drilling and completion that makes it seem unlikely that fugitive methane emissions are occurring at anything like the rates Howarth et al. suggest.
Completing and Bringing a Well Into Production Consider what happens in completing a well and bringing it into production: The well is drilled, logged, and then hydrofractured. When the hydrofracturing is finished, the wellbore and producing formations are full of water. Drilling out the plugs which divide the well into hydrofracture intervals occurs at this stage. Because the well is filled with water, only water is typically produced from the well during this process, and only gas dissolved in this water is brought to the surface, at least initially. Generally this condition persists during the full drill out period, but sometimes gas enters the well during drill out and must be dealt with at this stage. When the drill out is under water‐filled‐wellbore conditions, the gas leakage rate is comparatively small because, compared to a freely venting gas well, very little gas can be brought to the surface dissolved in water since gas solubility in water is low. The water produced at this stage is usually (and could always be) put into a capped tank where the gas exsolves from the water and is flared or captured. When the drill out occurs with substantial gas in the wellbore, more and perhaps very much more gas can be produced, but for safety and economic reasons (see below) it is not vented, but captured and either flared of diverted to sales through a pipeline. After drill out is completed, the operator begins to flow water from the well and the flowback stage begins. Normally no gas (or very minimal dissolved gas) is produced initially, but after a period ranging from hours to multiple days, the well starts to produce slugs of gas, and shortly thereafter enough gas that the well effluent can be diverted to a separator. The gas flow from the separator is generally either flared or put into a pipeline for sale. The first well on a pad may be flared (the methane is not released), but after this the gas is generally diverted to a pipeline and delivered to sales once enough gas pressure is obtained (or a skid‐mounted compressor is utilized).
Figure S1 shows gas well production curves for the Haynesville Shale that include the pre‐IP production (that portion of a well’s production that took place before the flowback was completed and the production peaked). It shows clearly that production rates during the pre‐IP production period are much lower than the monthly maximum production rates of the wells (which are themselves less than their reported IP rates). Production of gas is essentially non‐existent in the early flow‐back period (when only frac water is being produced). Significant gas flow starts only when enough frac water has been removed to let the gas begin to flow. The duration of the flowback period is poorly defined and there is no firm correlation between how a well will perform and the volume of gas that is produced during the flowback period. Gas production rates peak days to months later when frac
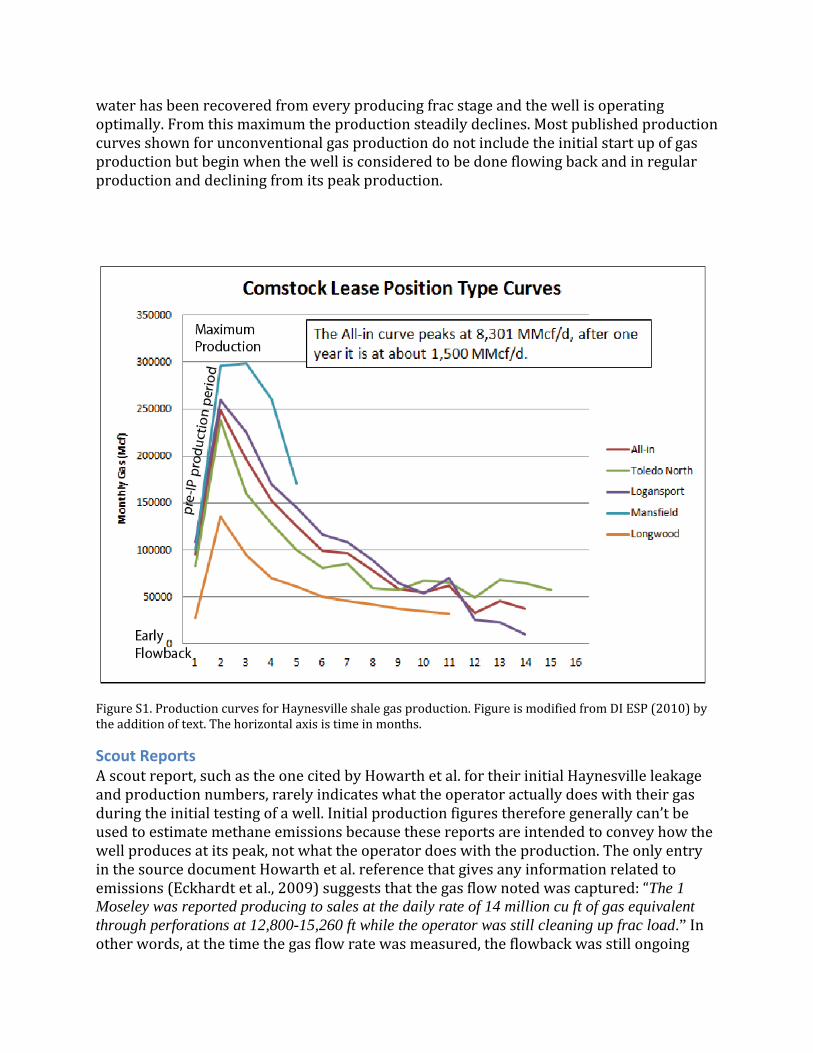
water has been recovered from every producing frac stage and the well is operating optimally. From this maximum the production steadily declines. Most published production curves shown for unconventional gas production do not include the initial start up of gas production but begin when the well is considered to be done flowing back and in regular production and declining from its peak production.
Figure S1. Production curves for Haynesville shale gas production. Figure is modified from DI ESP (2010) by the addition of text. The horizontal axis is time in months.
Scout Reports A scout report, such as the one cited by Howarth et al. for their initial Haynesville leakage and production numbers, rarely indicates what the operator actually does with their gas during the initial testing of a well. Initial production figures therefore generally can’t be used to estimate methane emissions because these reports are intended to convey how the well produces at its peak, not what the operator does with the production. The only entry in the source document Howarth et al. reference that gives any information related to emissions (Eckhardt et al., 2009) suggests that the gas flow noted was captured: “The 1 Moseley was reported producing to sales at the daily rate of 14 million cu ft of gas equivalent through perforations at 12,800-15,260 ft while the operator was still cleaning up frac load.” In other words, at the time the gas flow rate was measured, the flowback was still ongoing
and gas was producing to sales. This is the exact opposite of the venting of the gas to the atmosphere that Howarth et al. suggest.
One of the authors of this scout report (Philip H. Stark) recently published a statement regarding the use of their data by Howarth et al. (Appendix 1 in Barcella et al., 2011). His conclusion matched the one we made independently here ‐ that their (eg., Stark and others) report did not contain “any evidence of such methane emissions”.
Economic and Safety Considerations The large values for methane lost during completion that Howarth et al. suggest is routine industry practice is incompatible with elementary safety and economic considerations. Consider again the Haynesville Shale case. Howarth et al. indicate that 6.8 million cubic meters of Haynesville natural gas (3.2% of a typical well’s lifetime production) is released during an assumed flowback period of 10 days. Releasing 6.8 million cubic meters of gas into the atmosphere is equivalent to venting roughly $1,000,000 worth of natural gas (wholesale) from a single well. This leakage rate is equal to the consumption rate of 100,000 households, a city the size of Buffalo, NY (assuming 2.6 people per household) (EIA 2010). It’s also a volume of potentially explosive gas so large that no driller (let alone their employees, contractors and regulators) would willfully release it. The volume of this gas can be appreciated from the fact that it could cover a square mile of land to a height of 176 feet with a combustible 5% mix of methane. It is equivalent to the gas transmission in a small gas pipeline (e.g., Smith, 2010). Of course, during venting much of this methane would be injected at pressure and at some height above the platform, and pure methane would buoyantly rise from the well. However, methane that is mixed with 95% air is still explosive and its distribution would be governed by air currents (convection) as well as buoyancy. Any spark could trigger an explosion that would be followed by a controlled burn (similar to flaring). Think how a homeowner worries what a very small emission from a gas stove might do to their house if not properly turned off before they leave for the theatre. The concern is not the small burning flame, but the explosion that could result from accumulated methane if the burner were blown out. The idea that methane is released in a routine fashion at the rates and volumes suggested by Howarth et al. is simply not credible on safety considerations alone.
If an operator could find a way to safely vent such a high volume of shale gas, and preferred to do that over flaring or selling the gas, they could theoretically do so. It's illegal on this scale in most states (see 25 PA Code Sec. 78.74, for instance), and would clearly violate the terms of their liability insurance, but it could physically happen during initial production testing. As a practical matter, however, we have seen no evidence that it happens on any such scale except in very rare circumstances, such as a well blow‐out, and it cannot happen during the periods when there is still substantial frac water in the well (generally the case during the drill out and early flow back periods) which is the period when Howarth et al. suggest the methane is released.
EPA’s Venting Analysis Howarth et al. support their very high leakage estimate in general terms by citing the EPA’s (2010) conclusion that large quantities of methane accompany the flow back of water and
are vented in the first few days or weeks after hydrofracture injection. The basis for the EPA’s (2010, p. 84 ff) conclusion is their observation that 51% of the U.S. unconventional production (coal bed methane and shale gas only ‐ no tight sands gas data was available) in 2007 was in Wyoming (of which none was from shale), where flaring is required by law, and 49% was in Texas, Oklahoma, and Louisiana, where it is not required, but isn‘t banned either. The EPA then assumed that where regulations did not require the methane to be flared, it was all released directly into the atmosphere (not flared or sold), and they generalized this to be universally true. The EPA thus concludes that 4.6 million cubic feet of methane (50% of the typical 9.2 million cubic feet that they estimate is produced from an unconventional gas well during flowback) is released into the atmosphere. For all the reasons discussed above, we believe that this is a highly questionable assumption, and certainly one that is clearly stated by the EPA to be speculative. They did not document the venting, and are very clear that their basis is the assumption that when not required by law to flare or sell gas, unconventional wells are vented (into the atmosphere) during initial production. At least the EPA acknowledges that a significant portion of the methane emissions may be flared, rather than vented, in contrast to Howarth et al, who appear to assume 100% venting, the least likely scenario for real world operations.
References Cited API HF1 (2009) Hydraulic fracturing operations‐well construction and integrity guidelines, http://www.api.org/policy/exploration/hydraulicfracturing/.
Barcella, ML, Gross S, and Rajan S (2011) Mismeasuring Methane: estimating greenhouse gas emissions from upstream natural gas development, iHS Cerra Report, http://www.ihs.com/info/en/a/mis‐measuring‐methane‐report.aspx.
DI ESP (2010) Haynesville Shale News and Analysis from DI Energy Strategy Partners, http://info.drillinginfo.com/urb/haynesville/operators/2010/05/comstock‐lease‐positions‐and‐quarterly‐earnings‐call/
EIA (2010) Trends in U.S. Residential Natural Gas Consumption, Office of Oil and Gas, June, 12p. http://www.eia.doe.gov/pub/oil_gas/natural_gas/feature_articles/2010/ngtrendsresidcon/ngtrendsresidcon.pdf
Eckhardt M, Knowles B, Maker E, Stork P (2009) IHS U.S. Industry Highlights. (IHS) Houston, TX, Feb–Mar 2009. http://www.gecionline.com/2009‐prt‐7‐final‐reviews
EPA (2010) Greenhouse gas emissions reporting from the petroleum and natural gas industry. Background Technical Support Document. http://www.epa.gov/climatechange/emissions/downloads10/Subpart‐W_TSD.pdf
Lavelle M (2010) Special Report: The Great Shale Gas Rush, National Geographic News, http://news.nationalgeographic.com/news/2010/10/101022‐energy‐marcellus‐shale‐gas‐science‐technology‐water/ .
Smith CE (2010) Natural gas pipelines continue growth despite lower earnings, oil profits grow, Oil and Gas Journal, Nov 1, 102‐122.


![e “The Essay Canon - [email protected]](https://static.fdocuments.net/doc/165x107/6204e7a94c89d3190e0c5c8f/e-the-essay-canon-emailprotected.jpg)
