A Commentary by Harley Bassman: The Convexity Maven€¦ · 1 A Commentary by Harley Bassman: The...
15
1 A Commentary by Harley Bassman: The Convexity Maven Not a Product of Credit Suisse Research Value Concepts from the Credit Suisse Trading Desk For Distribution to Institutional Clients Only December 5, 2012 “The 2013 Stocking Stuffers” (A Model Portfolio) Just as sunshine is the best disinfectant, so has the FED’s implementation of QE~ (infinity) finally shone a bright light upon and fully revealed its ultimate policy goal: Increase Monetary Velocity via Financial Repression to create Inflation, depreciate nominal debt, and de-lever both the public and private economies of the United States. Our core investment theme relies upon the notion that there are only two ways to mitigate a debt crisis, either to default or inflate, with the caveat that inflation is just a slow motion default. (Strong real GDP growth is the one other path, but we will stipulate that this avenue is presently closed.)
Transcript of A Commentary by Harley Bassman: The Convexity Maven€¦ · 1 A Commentary by Harley Bassman: The...

1
A Commentary by Harley Bassman:
The Convexity Maven Not a Product of Credit Suisse Research Value Concepts from the Credit Suisse Trading Desk For Distribution to Institutional Clients Only December 5, 2012
“The 2013 Stocking Stuffers” (A Model Portfolio)
Just as sunshine is the best disinfectant, so has the FED’s implementation of QE~ (infinity) finally shone a bright light upon and fully revealed its ultimate policy goal: Increase Monetary Velocity via Financial Repression to create Inflation, depreciate nominal debt, and de-lever both the public and private economies of the United States. Our core investment theme relies upon the notion that there are only two ways to mitigate a debt crisis, either to default or inflate, with the caveat that inflation is just a slow motion default. (Strong real GDP growth is the one other path, but we will stipulate that this avenue is presently closed.)
2
To those who retort that the FED cannot willfully create inflation and point to Japan as their proof, let us just say that Japan has not yet tried hard enough. It took the BOJ over a decade to accomplish what the FED did in a little over a year. Moreover, we have a clear history of US Government policy makers creating inflation. On April 5, 1933, the US Government issued Executive Order 6102 which made it illegal for citizen to own Gold bullion or coins. This hoard of Gold was placed in a specially built storage facility - Fort Knox. After the public’s gold was purchased at the official rate of $20.67, the price was reset to $35.00, nearly a 70% increase. GDP rose 33% from 1934 to 1936 while the Dow rallied by close to 80%. Inflation, as measured by CPI, reversed from an annual -8.6% for the previous three years to a positive annual 2%. All this occurred with an unemployment rate that averaged 19.5%. (This should lay to rest the notion that inflation requires a negative output gap.) So the issue is NOT whether the FED can create any inflation, but rather can they create a moderate 3% to 4% inflation as opposed to a panic inducing 8% to 12%. We can assure you, if the FED opened its window and started buying Gold at $5,000 an ounce we would have inflation; the trouble is we would also have citizen mobs in the street with pitchforks! QE~ (infinity) is the FED’s coup de grace to mitigate any possible repeat of 1937/38 where financial conditions were tightened and the Dow promptly fell 35%. This period was highlighted by both a negative real GDP and CPI deflation. It is precisely this history that gives night terrors to the FED and underpins all their actions. The FED wants inflation, as such, we will have inflation; the only questions is whether it will take six months or six years. While we are supremely confident in the ultimate destination of various financial vectors, we are less certain of the path we may take to arrive there. As such, this year’s Stocking Stuffers tend to have long lead times and terrific payoff profiles. While some are not “long gamma” per se, they all share the common theme of exhibiting positive “unbalanced leverage”. Since the mark-to-market can be bumpy, sizing will be more important that entry level. As a preview, let me summarize this year’s Stocking Stuffers: US Treasuries are a poor investment compared to US Mega-Cap Equities. I also like what some novices might call “risk-on” assets but are in truth simply alternative claims on real assets that will be protected against an over-supply of Fiat Currencies. With the table set and our caveats delineated, here is our 2013 Model Portfolio.

3
Buy Real or Synthetic Forward Volatility on Rates: While Einstein did not postulate upon the notion of “Conservation of Risk”, it does seem reasonable that if the FED employs Financial Repression to reduce risk today, that same risk must certainly re-enter the market with greater force at some later time. This was certainly the case in the early 2000’s where risk managers were lulled into somnambulance by the FED’s risk-quashing policy of “Measured Pace” rate increases only to watch in horror as the entire system ran off the rails soon thereafter.
Clearly the -rust line- Equity and the -navy line- Foreign Exchange markets have figured this out as evidenced by their sharply upwardly sloping Term Volatility Structures. The mathematical result of this shape is much higher Forward Volatilities, i.e., the cost of a straddle that strikes and settles at a distant time in the future costs more than a similar straddle that strikes and starts today. Source: Credit Suisse
Over the course to 2012, the Equity Term Structure has been so steep that the benchmark VIX index futures contract, six-months Forward, has maintained an average 45% premium over the Spot level of the VIX. The Foreign Exchange

4
Term Structure is not as steep, nonetheless, the cost for a one-year option on the USD vs. JPY currency value will cost 12% more if purchased and struck six-months forward. Incidentally, while not pictured here, the generic five-year Investment Grade CDX is 11% more expensive if traded six-months forward. So it is a true anomaly that some vectors of the Interest Rate Volatility Term Structure point down. Below the -lime line- is the Term Structure for swaptions on the USD 20yr rate. It is this risk vector profile that allows one to purchase either real or synthetic Forward Volatility at a reduced price to the current levels.
As detailed in our recent Commentary – “Building a Better Volatility Mousetrap”, September 6, 2012, what makes this so strange is not the mere fact that the risk vector points down, it is that it is occurring when Implied Volatility is at the lowest levels since the start of the Financial Crisis in 2008. The combination of a low level of Implied Volatility with a downward sloping Term Structure creates the opportunity to buy “risk” at a lower price tomorrow [Forward] than today, either explicitly or implicitly. Buy the CS CMVS: Constant Maturity Volatility Swap Spotting the benchmark one-year into 20yr USD Straddle at 1090bps, the -shamrock dot-, you commit to purchase a series of ten straddles, one every six months over the next five years, at 975bps, the –plum dotted line- on the next page. On each of the ten “look dates”, we strike and you purchase a vanilla at-the-money straddle using the standard 11:00am NYTime ISDA procedures. This is 115bps (10.6%) below the current spot price. You are purchasing pure “Volatility as an Asset Class” with no delta, gamma, theta or skew management. The brilliance here is that Pure Forward Volatility allows you to lock in today’s low Implied Volatility without having to manage all the “Greek Risks”. Moreover, as you are buying below Spot prices, you effectively have Positive Carry since

5
you can quickly liquidate each option on the “look date” at a higher price if Forwards roll to Spot. Especially pleasing, as shown in the –clementine line-, is that one can lock-in nearly the lowest straddle price since January 2008.
While this investment is a Rates product, it is actually designed to help large cross-market risk managers such as Insurance Companies, MBS Servicers, REITs, and Macro Credit investors since there is such a strong correlation of Implied Volatility to Mortgage and Credit spreads. The –cold steel- regression below maps out the long-term correlation between the 1yr into 20yr straddle price and the level of the benchmark IG CDX Index. Unlike other “risk hedges”, the CS CMVS offers protection with the benefit of Positive Carry.

6
Buy 10yr into 20yr Payer vs 2y into 8yr-20y Mid-Curve Payer Price IVol Delta Vega Sell 100mm 2yr into 8yr-20yr 4.00% payer @ 330bp 97nv +31k -75k Buy 100mm 10yr into -20yr 4.00% payer @ 815bp 76nv -28k +165k This trade is a beautiful alternative construction of our Best Rates trade from last year’s Stocking Stuffers. The use of a mid-curve option eliminates direct Yield Curve Risk and most of the Duration risk. It exhibits pure roll down positive carry of 140bps. While it is mathematically short gamma, it is effectively long options since the most you can lose is your premium and if all goes as planned, you will be the outright owner of an eight-year option two years hence at a fancy price. That’s right: Limited loss, Potential unlimited gain, with Positive Carry !! While not a pure forward volatility trade, it explicitly monetizes the FED’s promise of low rates until 2015 since the “short leg” expires in 2014. The 127% Implied Volatility Ratio effectively creates a synthetic Forward Volatility purchase in the low 60s Normal Vol. Terminal losses could be realized if rates rise significantly over the next two years or if Implied Volatility declines by over 40%. This trade requires almost no management except for the stomach churn of short-term mark-to-market risk. This is our best vanilla USD options trade for 2013. With Obama in the White House for four more years (no judgments please) and Yellen now surely in the wings if Bernanke elects for an early retirement in January 2014, one can take the FED at its word until 2014 and then own a terrific big bear trade for the next eight years. Buy EUR 15yr into 15yr 3.5% payer vs EUR 3yr into 15yr 3.5% payer Price Yield IVol Delta Vega Sell EUR 100mm 3yr - 15yr 3.50% pyr @ 260bp 2.62% 79nv +25k -68k Buy EUR 100mm 15yr - 15yr 3.50% pyr @ 535bp 2.57% 62nv -15k +130k Let us be clear, this trade is a mark-to-market monster. For that sacrifice, five of the six risk vectors you are exposed to roll positively to create 140bps of carry in year one, a huge number for an even up notional trade. Your Duration “short” is 5bps inverted to your “long” and the 127% Implied Volatility ratio can produce a synthetic forward volatility purchase near 50nv. If all goes as expected, you could own a 3.5% fixed-strike twelve year payer swaption for well less than three points. Other constructions are available with less MTM volatility. Size this in inverse proportion to the temperature of the blood in your veins.

7
Execute an Ultra-Long Expiry Risk Reversal on the S&P For the record: This is my favorite idea for 2013 because it monetizes the many unintended consequences the FED’s policy of Financial Repression has wrought. FED promises and QE~ (infinity) tend to focus linear thinkers upon the “pennies of roll-down” available in the “Reds and Greens”, this is a mistake. Exhibit A of QE~ is the inversion of the Equity Dividend / Funding spread. For the first time since the 1950s, as shown by the -mango line-, the Treasury five-year rate is deeply below the dividend yield of the S&P 500 stock index. Moreover, as intended by Operation Twist, the -cyan line- shows the current S&P dividend rate now cleanly exceeds the Treasury ten-year rate. Source: Credit Suisse
Simple bond math produces the interesting result that the Forward price of the S&P is below its Spot price. This means that long exposure positions via derivatives will be extraordinarily inexpensive since the pricing models center the distribution around the Forward valuation, not the Spot price.
Current Spot Implied Div Interest
Rate Forward Chg from
Spot 5Y Fwd 1385 2.74% 0.80% 1259 -9.09%
10Y Fwd 1385 3.03% 1.75% 1222 -11.78%
Another inconvenient unintended consequence of QE~ is that long liability managers are pressured to execute expensive hedges to stay within regulatory mandates for asset / liability management. Specifically, lower rates and weak equity prices have pushed many insurance companies close to their compliance boundaries. To stay within strictures, these managers have become almost price
8
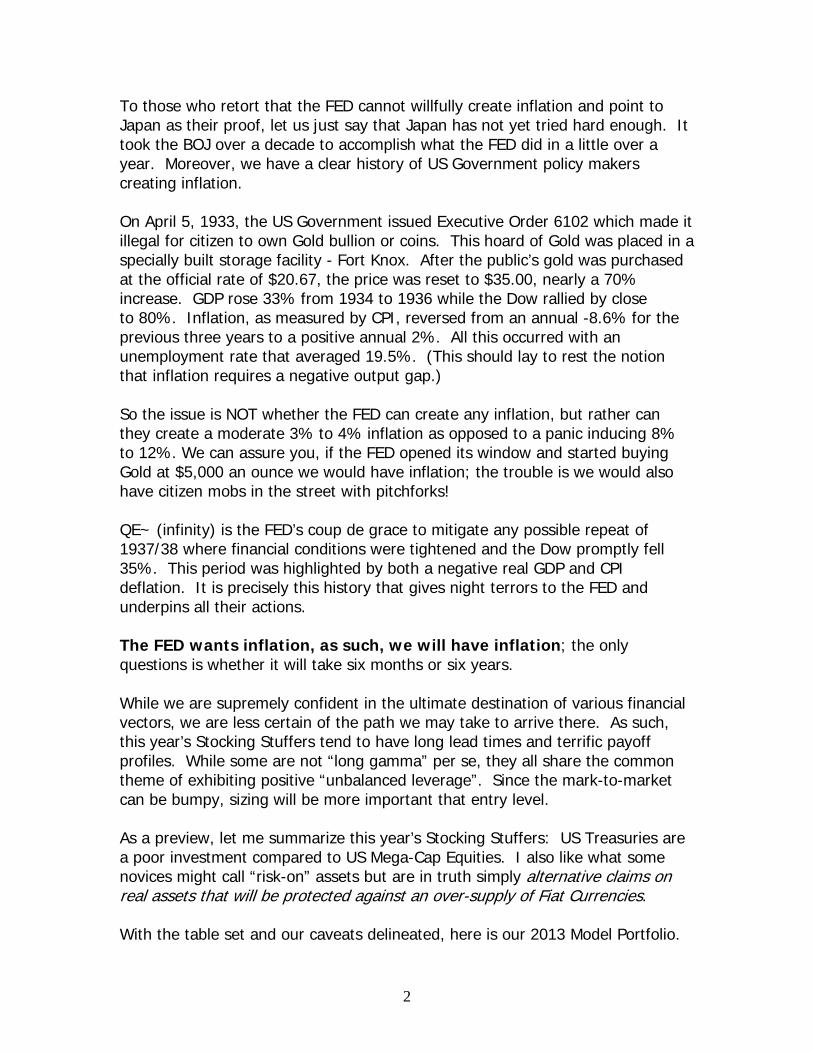
insensitive buyers of out-of-the-money puts on the S&P. It is this buying that has kept the Equity Volatility Term Structure so steep (see chart on page 3) as well as the put vs. call skew so steamy. The –blush line- below demonstrates the huge premium the market is demanding for OTM put options. Here, 50% OTM puts trade at a 27% higher Ivol than ATM options. The more interesting conundrum is that equidistant OTM calls trade at a 16% discount to ATM Ivol.
If you are on the ball, the trade I am dreaming of is obvious: [Spot S&P = 1385] Sell Ten-year Expiry S&P 850 strike puts vs. Buy 1775 strike calls for zero cost The combination of the discounted forward price with the plump put/call skew allows you to sell a 535 point out put versus a 390 point out call at zero cost. But this is not nearly the complete value added story. This is not a short-dated punt, we are locking in a long-term profile. The S&P can only go to zero (a painful concept, but stick with me), while the upside is unlimited. In fact, most finance geeks will confirm that a stock is effectively a call option on a company with a strike price equal to the value of its bonds. As such, the distribution of the S&P over ten years is magnificently Lognormal with a huge “right-side tail”. As such, this skew structure is completely backwards. Think about it, the limited loss put skew is +27% to ATM while the unlimited gain call skew is -17%. This pricing structure is not “risk averse” but rather “risk perverse” !! In a hyper-inflation crisis, Equity prices will explode higher since they are a claim on “real assets”. This is precisely what happened in Weimar Germany (look it up). This is the ultimate inflation tail event. With the top strike only 2.5%/year compounded away, inflation alone will almost certainly push the index though the top strike. Unless you are a deflationist, the S&P below 850 in a decade is unlikely. The FED’s QE~ (infinity) is a clear “green light” for this investment.

9
Buy 10yr expiry 100 strike calls on USD vs JPY at 5.75 points As detailed in our Commentary – “Grabbing the Wrong Tail”, February 14, 2012, the world knows that both the Japanese currency and rates are at unsustainable levels. That said, it will take more than a few years for this story to unwind, hence, buyers of one to three-year expiry options are “Grabbing the Wrong Tail”. In a nutshell, the end will be nigh soon after their trade surplus reverses and their unstable demographic rolls over. Japan’s debt is internally funded, that is why it has resisted outside market forces – this too shall pass. CS economics believes Japanese trade flows will reverse to be in consistent deficit within five years. Overlay the worst “worker-bee to geezer” ratio in the civilized world [see table below] and the end is clearly in sight. The demographic that has funded Japan’s social safety net has traversed from the best ratio in the G-20 to worst in just a single generation. Consequently, demand for government services will expand precisely into the teeth of a trade deficit cash crunch. Once the Government must fund itself externally, the ability to maintain this mirage of stability and solvency will melt and both its rates and currency will devalue.
Special analysis for quants: The most common reason for push-back on this trade has been the steep slope of the ATM Term Volatility Structure that creates the “illusion of richness” for ten-year expiry options. We refute this notion. While it is true that ATM options have a 600bp slope from 2yr to 10yr expiries, this is NOT an apples to apples comparison. The slope is mostly a reflection of the USD/JPY Forward Price that slides from 82 to 68 over ten years. As such, a 2yr option is ATM at 81 while a 10yr is ATM at 68. Binary options embedded in the gigantic JPY structured note market make 81 strike options less valuable (lower vol) than 68 strike options. When the Term Surface is valued at a constant 100 strike, the term slope is flattened by 65% to a mere 200bps.

10
Buy Argentina Dollar-denominate Sovereign Bonds Most trades that we recommend have the sterling quality of being “money good”, albeit with a lot of mark-to-market volatility. This particular investment is not one of them. That said, with a 16% yield on three year USD debt, it is hard not to place a few chips on the notion that Argentina will make good on its external debt, unlike Greece that must eventually default. Source: Credit Suisse
Argentina has total gross outstanding debt of about $183bn, of which almost half are internal intra-government obligations. This results in a “gross” Debt to GDP ratio of 41.5% and an almost reasonable 18.7% ratio on a “net” exposure basis. At last count, they have over $46bn in Foreign Exchange reserves. Argentina’s debt yields were sent soaring early last summer when President Cristina Fernandez de Kirchner snatched control of the YPF stake held by Spain’s Repsol. Conservative media outlets fanned the panic as they screamed of socialist nationalization. While this may ultimately be the case, calmer heads have voiced the notion that Repsol had it coming because they violated their agreement with Argentina to speed up the development of YPF’s off-shore reserves. This summer’s normalization was reversed by adverse US court rulings in favor of a few Hedge Fund hold-outs from the 2005 debt restructuring. Do I “love” this trade, nope; but it does bring to mind the old saw: “No bad bonds, just bad prices.” Bonds at a discount to par that yield 16% incorporate a lot of bad news. Unlike the “PIGS”, this is a “political” bet, not a “financial” one; the question is: Does Argentina “want” to pay rather than “if” they can pay ? I suspect Argentina will find a way to keep its capital markets open while not rewarding the so called “vulture” hold-outs. Size this trade accordingly.

11
Buy Russian Equities Some investments can be described as “risk-off”, others can be called “risk-on”, and finally we come to those where you just need to “strap-in” and hold on. Russian Equities are not for “widows and orphans”. After falling an astounding 91% on the back of a Government Bond default in 1998, the benchmark Index peaked in early 2008 over 50 times higher. The final doubling occurred as the Gazprom “ring-fence” was removed in late 2005 and the stock was soon elevated to 2.45% of the MSCI EM Index in April of 2006. Another 70% drawdown occurred as the Russian market followed most others into the abyss of the 2008 Global Equity swoon. Russian stocks participated in the 2009-11 recovery, but are presently near the level they traded at in December 2009, when the S&P was 22% lower at 1100. As detailed by the –crimson lines- below, the MSCI Russia Index seems to be a “value” on both absolute and relative metrics.
What is unclear is whether this is the sort of intermittent cheapening that the Russian market has experienced before or whether we are witnessing the construction of your classic “Value Trap”. The core reason I like investing is Russia is that it may be the cheapest and most levered manner to play the “hard asset” sector. This is not the land of cheap labor or innovation. There are few manufacturing plantations that mass produce generic drugs or pirated technology. This is where you go if you want oil, gas, nickel, gold, diamonds, and a little vodka to wash it down. The down side requires little explanation beyond the headlines. Confusing Western newspaper summaries concerning Hermitage Capital’s lawyer Sergei

12
Magnitsky or the punk rock band PussyCat Riot have increased the equity risk premium. And while minority shareholders have fared better in Russian courts recently, Moscow is quite a distance from Delaware. Russia has always traded at a substantial discount for this reason, and over the past few years, that discount has been growing. Depending upon the weightings you use, the Russian market may have the lowest P/E ratio of the major EM markets sporting a mid-five handle.
Ultimately, Russia is priced for the worst, which may well come. That said, Rosneft’s purchase of the TNK-BP joint venture has finally allowed Putin to “re-nationalize” the oil sector. After a decade of shoving the Glasnost toothpaste back into the tube, he may finally feel he has the freedom to look towards his legacy by slightly loosening the reins. Credit Suisse has a strong team of analysts focused upon this market. Their Macroeconomic Fundamentals model has the RTS index 15% to 25% cheap to our inputs. While investing in Russia is serious business that does not belong in a portfolio that requires monthly liquidity, I love the notion of investing in my core economic theme (inflation) at a discount to the market. Buy Non-Performing Mortgage Loans I hope you saw this one coming. Our Commentary – “The Pig in the Python”, January 12, 2012, detailed (for the record) our prediction that if the US housing market had not yet bottomed, the low was clearly within sight. We supported this idea by noting that the US is at a demographic inflection point that would soon create a strong demand for housing. Identifying this as our best “cash” investment, we strongly recommended the purchase of well-structured non-agency bonds, specifically Clean Alt-A and Pay Option ARM securities. These bond classes have since rallied in price by 24% and 30% respectively.

13
Fundamental support for this improvement can be found in the significant upturn in household formation. We suggested that unless couples stopped having babies, household formation would re-accelerate back to its long-term trend. CS projections, the -grey dotted line- , for a return to trend is supported by the Q3-12 report that 1.15mm households were created over the previous twelve months, a six year high. As night follows day, families will require housing and this demand will soak up what remains of the 2006/07 overhang.
The last bastion of value can be found in non-performing loans, where prices have only risen by 8% this year. Credit Suisse can help you purchase large and diverse packages of loans that are not current. These loans trade at a substantial discount to both Par and the value of the underlying asset. You can use either our special servicer or find your own. While you are out of pocket cash up front, this IRR discount will allow the servicer to either modify or transition the individual properties. There are three substantial considerations involved in valuing one of these investments:
1) The time required to “cure” the loan; 2) The cost required to “cure” the loan; 3) The free and clear “recovery value” of the underlying property.
While not a science, mortgage professionals are fairly good at pricing the first two components, especially on a portfolio basis (economies of scale). However, the recovery value has clearly been the wildcard and few buyers have been willing to commit funds without a wide cushion. We propose that FED money printing combined with the strong tail wind of demographics will underpin the recovery value of the collateral. As this becomes self-evident, the “cushion” will dissipate and the IRR will collapse to levels close to High Yield paper. If this concept resonates with you, then please call your Credit Suisse structured products rep for details on how to invest in this asset class.

14
Summary In this year’s annual letter to shareholders, Warren Buffett stated that he would rather own all 400 million acres of US cropland plus 16 Exxon Mobils instead of all the Gold in the world. Far be it from me to argue with the world’s greatest investor, but this is a false metaphor. Gold is not an asset, per se, but rather an alternate form of “money”. I would be equally troubled if he had stated that he would prefer the former to a pile of Euros or Yuan. I suspect he meant that he wants to own a claim on “real assets” instead of a form of “retained purchasing power”. If such, then he and I agree. If you are not a monetarist, then a dozen pages will not change your mind. But if you do believe that Governments cannot print fiat currency faster than nominal GDP without debasing it, then some of these investments should suit you. The definition of insanity is often defined as doing the same thing over and over again and expecting different results. As such, it is insane to think that the US Government can fully monetize the 2013 debt without adverse consequences at some none too distant time in the future. The fact that we are early does not make us wrong, it just means we need to have patience. This core concept is why our Model Portfolio is constructed in a manner that will offer you the long view. We will swap liquidity and Mark-to-Market volatility for the time required to be positioned correctly when the ultimate denouement arrives. A Final Note: While we do not charge you directly for these Commentaries, it would be greatly appreciated if you would allow Credit Suisse to be fully engaged in executing our ideas. If you presently have CS coverage, please call your Sales Representative to further discuss our thoughts. If you do not have coverage, please open the door for us to commence an active dialogue. Our traders are active in most Global markets and we can transact with you at a competitive price. I look forward to discussing these ideas with you in the near future. Happy 2013 Harley S. Bassman Credit Suisse US Rates Trading December 5, 2012
Clear Notice: This Commentary reflects the view of its author and is independent of CS Strategy.

15
This material has been prepared by individual sales and/or trading personnel of Credit Suisse AG or its subsidiaries or affiliates (collectively "Credit Suisse") and not by Credit Suisse's research department. It is not investment research or a research recommendation for the purposes of FSA rules as it does not constitute substantive research. All Credit Suisse research recommendations can be accessed through the following hyperlink: https://s.research-and-analytics.csfb.com/login.asp subject to the use of approved login arrangements. This material is provided for information purposes, is intended for your use only and does not constitute an invitation or offer to subscribe for or purchase any of the products or services mentioned. Any pricing information provided is indicative only and does not represent a level at which an actual trade could be executed. The information provided is not intended to provide a sufficient basis on which to make an investment decision. Credit Suisse may trade as principal or have proprietary positions in securities or other financial instruments that are the subject of this material. It is intended only to provide observations and views of the said individual sales and/or trading personnel, which may be different from, or inconsistent with, the observations and views of Credit Suisse analysts or other Credit Suisse sales and/or trading personnel, or the proprietary positions of Credit Suisse. Observations and views of the salesperson or trader may change at any time without notice. Information and opinions presented in this material have been obtained or derived from sources believed by Credit Suisse to be reliable, but Credit Suisse makes no representation as to their accuracy or completeness. Credit Suisse accepts no liability for loss arising from the use of this material. Nothing in this material constitutes investment, legal, accounting or tax advice, or a representation that any investment or strategy is suitable or appropriate to your individual circumstances. Any discussions of past performance should not be taken as an indication of future results, and no representation, expressed or implied, is made regarding future results. Trade report information is preliminary and subject to our formal written confirmation.
CS may provide various services to municipal entities or obligated persons ("municipalities"), including suggesting individual transactions or trades and entering into such transactions. Any services CS provides to municipalities are not viewed as “advice” within the meaning of Section 975 of the Dodd-Frank Wall Street Reform and Consumer Protection Act. CS is providing any such services and related information solely on an arm’s length basis and not as an advisor or fiduciary to the municipality. In connection with the provision of the any such services, there is no agreement, direct or indirect, between any municipality (including the officials, management, employees or agents thereof) and CS for CS to provide advice to the municipality. Municipalities should consult with their financial, accounting and legal advisors regarding any such services provided by CS. In addition, CS is not acting for direct or indirect compensation to solicit the municipality on behalf of an unaffiliated broker, dealer, municipal securities dealer, municipal advisor, or investment adviser for the purpose of obtaining or retaining an engagement by the municipality for or in connection with Municipal Financial Products, the issuance of municipal securities, or of an investment adviser to provide investment advisory services to or on behalf of the municipality.