A combined direct numerical simulation–particle image ... · A combined direct numerical...
23
J. Fluid Mech. (2006), vol. 569, pp. 185–207. c 2006 Cambridge University Press doi:10.1017/S0022112006002606 Printed in the United Kingdom 185 A combined direct numerical simulation–particle image velocimetry study of the turbulent near wake By S. DONG 1 †, G. E. KARNIADAKIS 1 ‡, A. EKMEKCI 2 AND D. ROCKWELL 2 1 Division of Applied Mathematics, Brown University, Providence, RI 02912, USA 2 Department of Mechanical Engineering, Lehigh University, Bethlehem, PA 18015, USA (Received 8 March 2005 and in revised form 28 May 2006) We investigate the near wake of a cylinder at values of Reynolds number corresponding to the onset and development of shear-layer instabilities. By combining quantitative experimental imaging (particle image velocimetry, PIV) and direct numerical simulations at Re = 3900/4000 and 10 000, we show that the flow structure is notably altered. At higher Reynolds number, the lengths of both the wake bubble and the separating shear layer decrease substantially. Corresponding patterns of velocity fluctuations and Reynolds stress contract towards the base of the cylinder. The elevated values of Reynolds stress at upstream locations in the separated layer indicate earlier onset of shear-layer transition. These features are intimately associated with the details of the shear-layer instability, which leads to small-scale vortices. The simulated signatures of the shear-layer vortices are characterized by a broadband peak at Re = 3900 and a broadband high spectral-density ‘plateau’ at Re = 10 000 in the power spectra. The shear-layer frequencies from the present direct numerical simulations study agree well with previous experimentally measured values, and follow the power law suggested by other workers. 1. Introduction The near-wake of a circular cylinder becomes particularly complex when transition occurs in the separating shear layers. With increasing Reynolds number, the onset of transition moves upstream towards the separation point and, simultaneously, the large-scale K ´ arm ´ an-like vortices are formed closer to the base of the cylinder. These variations of the wake structure have important consequences for both the steady and unsteady loading on the cylinder. In order to provide a perspective on the wake structure of interest herein, related experimental and numerical investigations are reviewed in the sections that follow. Experimental investigations Experimental insight into the phenomena of instability and transition in the near-wake, along with overviews of related investigations, are given by Gerrard (1967), Roshko & Fiszdon (1969), McCroskey (1977), Unal & Rockwell (1988), † Present address: Center for Computational and Applied Mathematics, Department of Mathematics, Purdue University, West Lafayette, IN47907, USA. ‡ Author to whom correspondence should be addressed: [email protected]
Transcript of A combined direct numerical simulation–particle image ... · A combined direct numerical...

J. Fluid Mech. (2006), vol. 569, pp. 185–207. c© 2006 Cambridge University Press
doi:10.1017/S0022112006002606 Printed in the United Kingdom
185
A combined direct numerical simulation–particleimage velocimetry study of the turbulent
near wake
By S. DONG1†, G. E. KARNIADAKIS1‡, A. EKMEKCI2
AND D. ROCKWELL2
1Division of Applied Mathematics, Brown University, Providence, RI 02912, USA2Department of Mechanical Engineering, Lehigh University, Bethlehem, PA 18015, USA
(Received 8 March 2005 and in revised form 28 May 2006)
We investigate the near wake of a cylinder at values of Reynolds numbercorresponding to the onset and development of shear-layer instabilities. By combiningquantitative experimental imaging (particle image velocimetry, PIV) and directnumerical simulations at Re = 3900/4000 and 10 000, we show that the flow structureis notably altered. At higher Reynolds number, the lengths of both the wake bubbleand the separating shear layer decrease substantially. Corresponding patterns ofvelocity fluctuations and Reynolds stress contract towards the base of the cylinder.The elevated values of Reynolds stress at upstream locations in the separated layerindicate earlier onset of shear-layer transition. These features are intimately associatedwith the details of the shear-layer instability, which leads to small-scale vortices. Thesimulated signatures of the shear-layer vortices are characterized by a broadbandpeak at Re = 3900 and a broadband high spectral-density ‘plateau’ at Re = 10 000in the power spectra. The shear-layer frequencies from the present direct numericalsimulations study agree well with previous experimentally measured values, and followthe power law suggested by other workers.
1. IntroductionThe near-wake of a circular cylinder becomes particularly complex when transition
occurs in the separating shear layers. With increasing Reynolds number, the onsetof transition moves upstream towards the separation point and, simultaneously, thelarge-scale Karman-like vortices are formed closer to the base of the cylinder. Thesevariations of the wake structure have important consequences for both the steadyand unsteady loading on the cylinder. In order to provide a perspective on the wakestructure of interest herein, related experimental and numerical investigations arereviewed in the sections that follow.
Experimental investigations
Experimental insight into the phenomena of instability and transition in thenear-wake, along with overviews of related investigations, are given by Gerrard(1967), Roshko & Fiszdon (1969), McCroskey (1977), Unal & Rockwell (1988),
† Present address: Center for Computational and Applied Mathematics, Department ofMathematics, Purdue University, West Lafayette, IN47907, USA.
‡ Author to whom correspondence should be addressed: [email protected]

186 S. Dong, G. E. Karniadakis, A. Ekmekci and D. Rockwell
Zdravkovich (1990), Szepessy & Bearman (1992), Lin, Towfighi & Rockwell (1995),Williamson (1996) and Norberg (2003). Detailed insight into the structure as wellas the predominant frequency of the shear-layer instability/transition is reviewed byWilliamson (1996), originating with the studies of Bloor (1964) and Gerrard (1967).The works of Gerrard (1978), Wei & Smith (1986), Filler, Marston & Mih (1991),Roshko (1993), Sheridan et al. (1993), Lin et al. (1995), Williamson (1996), Chyu &Rockwell (1996), Prasad & Williamson (1997), Norberg (1998) and Brede (2004)characterize various features of these small-scale structures.
In additional to the time-averaged characteristics that are influenced by the existenceof small-scale structures, Noca, Park & Gharib (1998) provide summaries of variousinterpretations of the formation length as a function of Reynolds number and showquantitative images of the near-wake structure at Re = 1260. Saelim (2003) andEkmekci (2006) have related the transitional phenomena in the separating shear layerto variations of patterns of Reynolds stress, entrainment velocity and onset of large-scale vortex formation in the near wake over the Reynolds number range Re = 1000to 10 000. At Re = 10 000, pronounced small-scale concentrations of vorticity areevident in the shear layer shortly after separation and, correspondingly, the large-scale Karman-like vortices are formed close to the base of the cylinder. This state ofthe shear layer contrasts with the structure at substantially lower values of Reynoldsnumber, for which the onset of the first small-scale concentration of vorticity occurswell downstream of separation, if at all. Based on the experimental investigationscited in the foregoing, the patterns of the near wake at Re = 4000 and 10 000 arerepresentative of transition phenomena in the separating shear layers, and thereforeare selected for the experimental–numerical comparisons of the present investigation.
Numerical simulations
Simulation of the near-wake structure has been undertaken at various values ofReynolds number using several approaches. Herein, we focus on investigationsat values of Reynolds number for which transition most probably occurred inthe separating shear layers. The Reynolds number Re = 3900 has been the mostextensively numerically investigated one in the transition range. Beaudan & Moin(1994), Mittal & Moin (1997), Kravchenko & Moin (2000) performed the first large-eddy simulations (LES) at this Reynolds number. They demonstrate that upwindingschemes are overly dissipative for cylinder flow turbulence simulations. The meanflow and Reynolds stress from these computations are in good agreement with theexperimental data. However, in the vicinity of the cylinder, all three simulationsconverge to a mean velocity profile different from the experimental result. Thenumerical and modelling aspects that affect the quality of LES are further investigatedby the following studies at this Reynolds number. Breuer (1998) has further confirmedthat dissipative methods are inferior to central differencing schemes in terms ofagreement with experimental data and the accuracy in predicting physical quantitiessuch as the base pressure coefficients. In light of the relatively short statisticsaccumulation time in some LES studies, Franke & Frank (2002) examine the effectof the averaging time on the accuracy of statistical quantities, and observe a notableinfluence on the values of base pressure coefficients and the re-circulation bubblelength. Resolving the inertial range properly is another issue in LES as the upwindingscheme coupled with dynamic subgrid scale (SGS) models lacks full control over thealiasing when the cutoff falls below the lower limit of the inertial range (Jordan 2003).The only direct numerical simulation (DNS) was performed by Ma, Karamanos &Karniadakis (2000) for the cylinder flow at Re = 3900 using a spectral element scheme

A PIV–DNS study of the turbulent near wake 187
on unstructured meshes. The mean flow and energy spectra are in good agreementwith the experimental data in the near wake as well as far downstream. In particular,the mean velocity profiles agree well with the experiment in the vicinity of the cylinder.
The cylinder flow at higher Reynolds numbers in the transition range has beenconsidered by several other LES studies. Jordan (2002) studied the shear-layerinstability at Reynolds number Re = 8000 employing an LES scheme with second-order upwind finite differencing coupled with a dynamic SGS model in curvilinearsystems. A number of flow quantities have been calculated correctly, and the shear-layer frequency has been captured reasonably well. However, the lift coefficient fromthe computation is much lower than the experimental values (Norberg 2003). Inaddition, only a short time history (about 25 convective units) is collected, which mayinfluence the power spectra and the accuracy of the Strouhal frequency. Kalro &Tezduyar (1997) conducted an LES study at Re = 10 000, based on a stabilized finite-element formulation and a Smagorinsky subgrid model. The drag coefficient andStrouhal number are predicted reasonably well. However, no grid refinement wasconducted and no statistics were reported. Breuer (2000) investigated the cylinderflow at Re = 140 000 in order to evaluate the applicability of LES to high-Reynolds-number flows. The predicted integral parameters and the mean velocity profiles are inreasonable agreement with experimental measurement; however, the grid refinementdoes not lead to improved results in terms of agreement with the experimental data.
Two-dimensional simulation has been known to tend to over-predict the fluid forceson the cylinder owing to intrinsic three-dimensional effects (Batcho & Karniadakis1991; Mittal & Balachandar 1995), which is exemplified by several two-dimensionalstudies at Reynolds numbers in the transitional range (Braza, Chaissaing & Ha Minh1990; Mittal & Kumar 2001). However, it has predicted the shear-layer frequencysurprisingly well. Braza et al. (1990) simulated the cylinder flow at Reynolds numbersRe =2000−10 000 by solving the two-dimensional Navier–Stokes equations with afinite-volume method. Although the lift coefficients are highly over-predicted, theshear-layer frequencies from the computations are in quite good agreement with theexperimental results.
Objective
In this paper, we investigate the Reynolds-number effects on the cylinder wakestatistics and the shear-layer instabilities in the transitional range. To this purpose,we have conducted high-resolution particle image velocimetry (PIV) experimentalmeasurements of the cylinder wake at Reynolds numbers Re = 4000 and 10 000,and performed three-dimensional direct numerical simulations at Re = 3900 and10 000. We focus on the comparison between experimental and simulation results toelucidate how the Reynolds number affects the distributions of a number of statisticalquantities such as the mean vorticity, Reynolds stress, and r.m.s. fluctuations, andhow the variation of Reynolds number affects the flow spectra and frequencies of theshear layer.
2. Experimental and numerical techniquesExperiments were undertaken in a large-scale free-surface water channel having
a length of 5435 mm, a depth of 594 mm and a width of 613 mm. Upstream ofthis test section, the flow passed through a settling chamber and an extensive flow-conditioning section, and then finally through a 3:1 contraction, which yielded avery low level free-stream turbulence intensity of less than 0.1 %. Small-amplitude
188 S. Dong, G. E. Karniadakis, A. Ekmekci and D. Rockwell
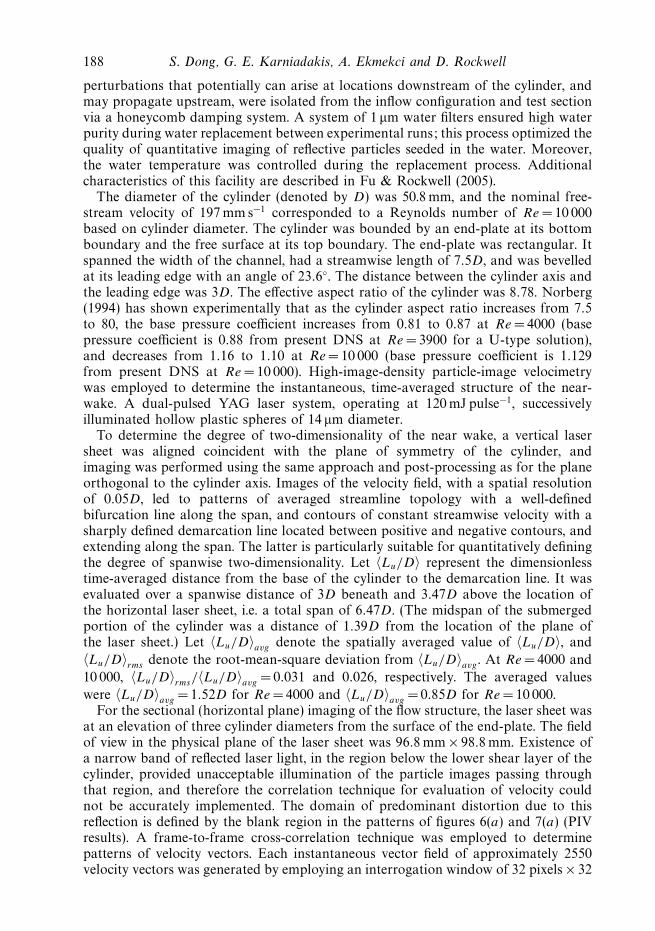
perturbations that potentially can arise at locations downstream of the cylinder, andmay propagate upstream, were isolated from the inflow configuration and test sectionvia a honeycomb damping system. A system of 1 µm water filters ensured high waterpurity during water replacement between experimental runs; this process optimized thequality of quantitative imaging of reflective particles seeded in the water. Moreover,the water temperature was controlled during the replacement process. Additionalcharacteristics of this facility are described in Fu & Rockwell (2005).
The diameter of the cylinder (denoted by D) was 50.8 mm, and the nominal free-stream velocity of 197 mm s−1 corresponded to a Reynolds number of Re =10 000based on cylinder diameter. The cylinder was bounded by an end-plate at its bottomboundary and the free surface at its top boundary. The end-plate was rectangular. Itspanned the width of the channel, had a streamwise length of 7.5D, and was bevelledat its leading edge with an angle of 23.6◦. The distance between the cylinder axis andthe leading edge was 3D. The effective aspect ratio of the cylinder was 8.78. Norberg(1994) has shown experimentally that as the cylinder aspect ratio increases from 7.5to 80, the base pressure coefficient increases from 0.81 to 0.87 at Re = 4000 (basepressure coefficient is 0.88 from present DNS at Re = 3900 for a U-type solution),and decreases from 1.16 to 1.10 at Re = 10 000 (base pressure coefficient is 1.129from present DNS at Re =10 000). High-image-density particle-image velocimetrywas employed to determine the instantaneous, time-averaged structure of the near-wake. A dual-pulsed YAG laser system, operating at 120 mJ pulse−1, successivelyilluminated hollow plastic spheres of 14 µm diameter.
To determine the degree of two-dimensionality of the near wake, a vertical lasersheet was aligned coincident with the plane of symmetry of the cylinder, andimaging was performed using the same approach and post-processing as for the planeorthogonal to the cylinder axis. Images of the velocity field, with a spatial resolutionof 0.05D, led to patterns of averaged streamline topology with a well-definedbifurcation line along the span, and contours of constant streamwise velocity with asharply defined demarcation line located between positive and negative contours, andextending along the span. The latter is particularly suitable for quantitatively definingthe degree of spanwise two-dimensionality. Let 〈Lu/D〉 represent the dimensionlesstime-averaged distance from the base of the cylinder to the demarcation line. It wasevaluated over a spanwise distance of 3D beneath and 3.47D above the location ofthe horizontal laser sheet, i.e. a total span of 6.47D. (The midspan of the submergedportion of the cylinder was a distance of 1.39D from the location of the plane ofthe laser sheet.) Let 〈Lu/D〉avg denote the spatially averaged value of 〈Lu/D〉, and
〈Lu/D〉rms denote the root-mean-square deviation from 〈Lu/D〉avg . At Re = 4000 and
10 000, 〈Lu/D〉rms/〈Lu/D〉avg = 0.031 and 0.026, respectively. The averaged values
were 〈Lu/D〉avg = 1.52D for Re = 4000 and 〈Lu/D〉avg = 0.85D for Re = 10 000.For the sectional (horizontal plane) imaging of the flow structure, the laser sheet was
at an elevation of three cylinder diameters from the surface of the end-plate. The fieldof view in the physical plane of the laser sheet was 96.8 mm × 98.8 mm. Existence ofa narrow band of reflected laser light, in the region below the lower shear layer of thecylinder, provided unacceptable illumination of the particle images passing throughthat region, and therefore the correlation technique for evaluation of velocity couldnot be accurately implemented. The domain of predominant distortion due to thisreflection is defined by the blank region in the patterns of figures 6(a) and 7(a) (PIVresults). A frame-to-frame cross-correlation technique was employed to determinepatterns of velocity vectors. Each instantaneous vector field of approximately 2550velocity vectors was generated by employing an interrogation window of 32 pixels × 32

A PIV–DNS study of the turbulent near wake 189
pixels, with a 50 % overlap. These instantaneous patterns of velocity were then used todetermine the patterns of streamwise and transverse (crossflow) velocity components,mean velocities, as well as patterns of root-mean-square velocity. Finally, contours ofReynolds stress were determined. To obtain the averaged quantities, a total of 600instantaneous images were employed.
We performed three-dimensional direct numerical simulations of the cylinderflow by solving the incompressible Navier–Stokes equations employing a Fourierspectral expansion in the homogeneous direction and a spectral element approach(Karniadakis & Sherwin 2005) in the streamwise and crossflow directions. For timeintegration, a stiffly stable pressure correction-type scheme is employed with a third-order accuracy in time (Karniadakis, Israeli & Orszag 1991). A uniform inflow isprescribed at the inlet. No-slip conditions are applied to the cylinder surface. TheNeumann boundary condition is used at the outflow, and the periodic boundarycondition is applied in the crossflow direction. We have simulated the turbulentcylinder wake at two Reynolds numbers, Re = 3900 and 10 000, based on the free-stream velocity and the cylinder diameter. For Reynolds number Re =3900, thecomputational domain extends from −15D at the inlet to 25D at the outlet, andfrom −9D to 9D in the crossflow direction. Extensive grid refinement tests havebeen conducted; see Ma et al. (2000) for details and Appendix B for additional testson spanwise resolutions. In the present study, we employ an unstructured mesh of902 spectral elements in the streamwise-crossflow planes, with eighth-order Jacobipolynomial expansions on each element. In the homogeneous spanwise direction, weemploy 32 to 96 Fourier modes (or 64 to 192 grid points) on a domain with thespanwise dimension of Lz/D = 1.5π, as well as 64 Fourier modes (or 128 grid points)on a domain with the spanwise dimension of Lz/D = π. These parameters lead to gridspacings near the cylinder surface of 0.32 in the radial direction, 0.68 in the azimuthaldirection, and 2.17 in the spanwise direction in viscous wall units based on thefriction velocity at the top tip of the cylinder, (x, y) = (0, 0.5D). For Reynolds numberRe =10 000, the computational domain extends from −20D at the inlet to 50D at theoutlet, and from −20D to 20D in the crossflow direction. The spanwise dimensionof the domain is chosen to be Lz/D = π. Extensive grid refinement tests have beenperformed at Re = 10 000; see Appendix A for details. In the present study, we employtwo unstructured spectral meshes in each streamwise-crossflow plane: a coarse meshwith 6272 triangular elements and a refined mesh with 9272 triangular elements,with fifth-order Jacobi polynomial expansions on each element. In the homogeneousdirection, we employ 64 Fourier modes (or 128 grid points). These parameters leadto grid spacings near the cylinder surface of 0.31 in the radial direction, 0.65 in theazimuthal direction and 5.31 in the spanwise direction in viscous wall units basedon the friction velocity at the top tip of the cylinder. We have performed long-timesimulations of flows at both Reynolds numbers. After the initial transient convectsaway, the statistical quantities are accumulated until convergence, which amounts toabout 200 to 250 convective time units (D/U0) or about 40 to 50 shedding cycles.
3. Flow statisticsFigure 1 compares the normalized mean spanwise vorticity ωzD/U0 between
experiment and simulation. We plot mean vorticity contours at Re =4000 for PIVand at Re = 3900 for DNS on the same contour levels. The field of view of the flowdomain in this and subsequent plots are also the same from both experiment andsimulation, with 0.148 <x/D < 2.053 and −0.968 < y/D < 0.976 for Re = 3900/4000,

190 S. Dong, G. E. Karniadakis, A. Ekmekci and D. Rockwell
(a)
0.5
0y
–0.5
0.5 1.0x
1.5 2.0
(b)
0.5
0
–0.5
0.5 1.0x
1.5 2.0
Figure 1. Contours of normalized mean spanwise vorticity: (a) PIV at Re= 4000; (b) DNSat Re= 3900. In both plots, |ωzD/U0|min = 2.58 and |�ωzD/U0| = 0.64.
(a)
0.5
0y
–0.5
0.5 1.0x
1.5 2.0
(b)
0.5
0
–0.5
0.5 1.0x
1.5 2.0
Figure 2. Contours of normalized mean spanwise vorticity at Re= 10 000: (a) PIV;(b) DNS. In both plots, |ωzD/U0|min = 1.61 and |�ωzD/U0| = 0.32.
and 0.148 <x/D < 2.053 and −0.978 < y/D < 0.966 for Re = 10 000. The patternsof the mean vorticity from the simulation and experiment are very similar. Thevorticity distributions exhibit an absence of significant vorticity levels in the cylinderbase region at this Reynolds number, a feature first noted by Lin et al. (1995).Furthermore, the two shear layers extend from the centre of the cylinder to 1.65D
and 1.74D, respectively, in the simulation and experiment.For comparison with Re = 3900/4000, in figure 2 we plot contours of the normalized
mean spanwise vorticity at Reynolds number Re =10 000 from the experiment and thesimulation. Experimental and DNS results are again plotted with the same contourlevels. Remarkably similar patterns of vorticity distributions are again observed forboth experiment and simulation. DNS shows notable vorticity levels in the vicinityof the cylinder surface above and below the cylinder base at Re = 10 000, a featurenot detectable in the experimental result. We suspect that the absence is due to the

A PIV–DNS study of the turbulent near wake 191
Ls
Figure 3. Illustration of effective shear layer length Ls . The mean spanwise vorticity contourin the plot is at a level of 8 % of the maximum mean vorticity magnitude along a vertical linecrossing the cylinder axis, x =0.0.
limited resolution of PIV on the cylinder surface. Furthermore, it should be notedthat the minimum vorticity level employed in the PIV image corresponds to the valueabove which the vorticity magnitude was free of PIV processing noise. At Re = 10 000the shear layer is significantly shorter than at Re = 3900/4000, extending downstreamof the centre of the cylinder a distance of 1.29D and 1.35D, respectively, for thesimulation and experiment. On the other hand, the tip of this averaged vorticity layeris significantly thicker than that at Re =3900/4000; that is, it bulges inward toward thecentreline. The differences in vorticity structure shown here between Re = 3900/4000and 10 000 are consistent with previous observations, which indicate that the regionof transition and von Karman vortex shedding moves towards the cylinder withincreasing Reynolds number (Linke 1931; Bloor 1964; Wei & Smith 1986; Kourtaet al. 1987; Unal & Rockwell 1988; Lin et al. 1995; Prasad & Williamson 1997; Nocaet al. 1998; Norberg 1998).
To provide a quantitative measure of the difference in the shear layer betweenthese two Reynolds numbers, we define an effective shear-layer length, Ls , as thedownstream location of the tip of a mean spanwise vorticity contour line at the levelof 8 % of a reference vorticity, namely ωz/ωm = 0.08, where the reference vorticity ωm
is the maximum mean spanwise vorticity magnitude along the vertical line crossingthe cylinder axis, x = 0.0 (figure 3). We computed the effective shear-layer lengthsin DNS for Re = 3900 and 10 000, and present the results in table 1. At Re = 3900,the shear-layer length of the ‘U’-type wake is about 11–16 % longer than that ofthe ‘V’-type wake (see Ma et al. 2000 for detailed discussion of these two types ofwake). In the present study, we observe a ‘U’-type near-wake in the case with aspanwise dimension Lz/D = π (and 64 Fourier modes in the spanwise direction), anda ‘V’-type near-wake in the case with a spanwise dimension Lz/D =1.5π (with 32,64 and 96 Fourier modes in the spanwise direction). DNS results shown in figure 1and subsequent plots for Re = 3900 are with the ‘U’-type near-wake. At Re = 10 000,the shear-layer length from the high-resolution mesh (9272 elements) differs from

192 S. Dong, G. E. Karniadakis, A. Ekmekci and D. Rockwell
Lz/D Nz K Ls/D
Re= 3900 ‘U’-type π 128 902 1.59‘V’-type 1.5π 64 902 1.43‘V’-type 1.5π 128 902 1.37‘V’-type 1.5π 192 902 1.41
Re= 10 000 π 128 9272 1.03π 128 6272 0.90
Table 1. Effective shear-layer length from DNS for Reynolds numbers Re= 3900 and 10 000.Lz is the spanwise dimension of flow domain; Nz is the number of grid points in the z-direction;K denotes the number of spectral elements in (x, y)-planes. Ls denotes the effective shear-layerlength; see text and figure 3 for its definition.
(a)
0.5
0y
–0.5
0.5 1.0x
1.5 2.0
(b)
0.5
0
–0.5
0.5 1.0x
1.5 2.0
Figure 4. Contours of normalized Reynolds stress: (a) PIV at Re= 4000; (b) DNS atRe= 3900. In both plots, |〈u′v′〉/U 2
0 |min = 0.03 and |�〈u′v′〉/U 20 | = 0.01.
that of the low-resolution mesh (6272 elements) by about 13 %. DNS results shownin figure 2 and subsequent plots for Re = 10 000 are based on the high-resolutionmesh. Comparison of the ‘U’-type wake at Re = 3900 and high-resolution result atRe = 10 000 indicates that the shear layer is about 30 % shorter at the higher Reynoldsnumber than at the lower one.
In figure 4, we plot contours of the normalized Reynolds stress 〈u′v′〉/U 20 at
Re = 3900/4000, where u′ and v′ are streamwise and crossflow root mean square(r.m.s.) velocities, respectively. Four distinct ‘lobes’ are evident in both the patterns,two small clusters in the front and two large ones further downstream. They areanti-symmetric with respect to the centreline. The Reynolds stress exhibits an absenceof significant levels in the base region and in the shear layer close to the cylindersurface, indicating either small magnitudes of the fluctuations and/or the lack ofsignificant correlation between streamwise and crossflow fluctuations in the very nearwake of the cylinder. The locations of the dominant Reynolds stress peaks are atx/D = 1.90 and 2.05, respectively, for simulation and experiment. These dominantpeaks of the Reynolds stress distribution have levels of 0.14 and 0.11, respectively, forsimulation and experiment. Note, however, that the ‘tails’ of the patterns of Reynolds

A PIV–DNS study of the turbulent near wake 193
(a)
0.5
0y
–0.5
0.5 1.0x
1.5 2.0
(b)
0.5
0
–0.5
0.5 1.0x
1.5 2.0
Figure 5. Contours of normalized Reynolds stress at Re= 10 000: (a) PIV; (b) DNS. In bothplots, |〈u′v′〉/U 2
0 |min = 0.03 and |�〈u′v′〉/U 20 | = 0.01.
stress, which extend upstream, are longer for the simulation than for experiment.These tails coincide with the tip regions of the shear layers (see figure 1), and thenotable Reynolds stress levels in these regions result from the shear-layer instabilityand the rolling-up of shear-layer vortices. The longer ‘tail’ in simulations may resultfrom an earlier onset of transition.
Figure 5 shows comparison of the normalized Reynolds stress at Re = 10 000 forexperiment and simulation. The overall form of these patterns is similar to thoseat Re = 3900/4000 given in figure 4. Low-level clusters of Reynolds stress are againobserved at locations upstream of the dominant clusters. However, the entire patternof Reynolds stress has moved a substantial distance upstream, relative to the patternsat Re =3900/4000. The location of the peak Reynolds stress is now at x/D = 1.4;it has levels of 0.15 and 0.14, respectively, for simulation and experiment. Moreover,the small-scale clusters of Reynolds stress are located immediately downstream of thecylinder base. Particularly important are the upstream extensions of the large-scaleclusters, along the locus of the separating shear layer towards the point of separationon the surface of the cylinder. These elongated regions are indicative of the earlytransition of the separated layer. For both experiments and simulation, the tip of thisupstream extended region reaches upstream of the base of the cylinder.
We next examine the mean flow characteristics in the cylinder wake. Figure 6compares the distribution of the normalized mean streamwise velocity u/U0 from theexperiment at Re = 4000 (figure 6a) and from the simulation at Re = 3900 (figure 6b).These patterns of mean streamwise velocity, show a well-defined bubble of negativevelocity, that is, reverse flow. The location and the magnitude of the minimum are closein value for simulation and experiment. For the PIV images, the maximum magnitudeof the negative velocity is u/U0 = 0.252 and 0.228 for Re =4000 and Re = 10 000,respectively, in simulations, they are 0.291 and 0.249 for these two Reynoldsnumbers. Norberg (1998) obtained these values via laser-Doppler velocimetry (LDV)measurements. From interpolation of his results, we obtain a rounded value ofu/U0 = 0.44 at Re =4000; at Re = 10 000, the un-interpolated value is u/U0 = 0.38.The streamwise extent of the bubble can be evaluated along its centreline. The lengthsof the bubbles, i.e. the distance from the base of the cylinder to the location at zero

194 S. Dong, G. E. Karniadakis, A. Ekmekci and D. Rockwell
0.5
(a) (b)
0
–0.5
y
x0.5 1.0 1.5 2.0
0.5
0
–0.5
x0.5 1.0 1.5 2.0
Figure 6. Contours of normalized mean streamwise velocity: (a) PIV at Re= 4000; (b) DNSat Re= 3900. In both plots, u/U0|min = − 0.252 and |�u/U0| = 0.063.
0.5
(a) (b)
0
–0.5
y
x0.5 1.0 1.5 2.0
0.5
0
–0.5
x0.5 1.0 1.5 2.0
Figure 7. Contours of mean streamwise velocity at Re= 10 000: (a) PIV; (b) DNS. In bothplots, u/U0|min = − 0.228 and |�u/U0| = 0.038.
velocity on the plane of symmetry are 1.47D and 1.36D, respectively, for experimentand simulation.
Figure 7 shows a corresponding comparison of the normalized mean streamwisevelocity µ/U0 between the experiment (figure 7a) and the simulation (figure 7b) atRe = 10 000. Consider the region of negative (upstream-oriented) velocity designatedby the dashed lines. Both the location and magnitude of the peak value are similarfor simulation and experiment. The overall length of the bubble, however, is 0.78D
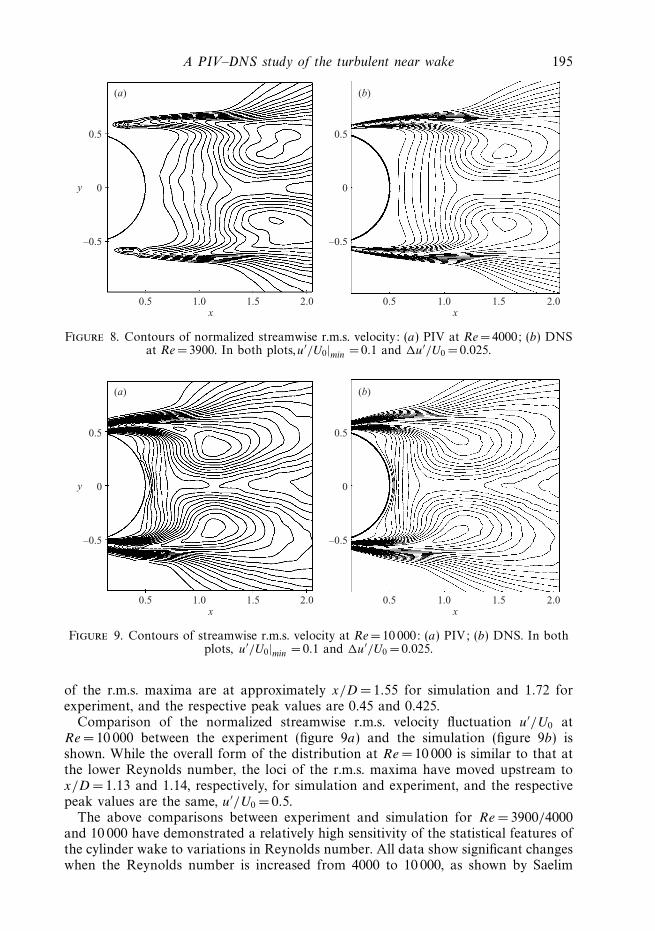
and 0.82D for experiment and simulation, respectively.The patterns of normalized streamwise r.m.s. velocity fluctuations u′/U0, given in
figure 8 for Re =4000/3900, show strong fluctuations in the separating shear layers,and two maxima associated with the vortex formation. The downstream locations
A PIV–DNS study of the turbulent near wake 195
0.5
(a) (b)
0
–0.5
y
x0.5 1.0 1.5 2.0
0.5
0
–0.5
x0.5 1.0 1.5 2.0
Figure 8. Contours of normalized streamwise r.m.s. velocity: (a) PIV at Re= 4000; (b) DNSat Re= 3900. In both plots,u′/U0|min = 0.1 and �u′/U0 = 0.025.
0.5
(a) (b)
0
–0.5
y
x0.5 1.0 1.5 2.0
0.5
0
–0.5
x0.5 1.0 1.5 2.0
Figure 9. Contours of streamwise r.m.s. velocity at Re= 10 000: (a) PIV; (b) DNS. In bothplots, u′/U0|min = 0.1 and �u′/U0 = 0.025.
of the r.m.s. maxima are at approximately x/D = 1.55 for simulation and 1.72 forexperiment, and the respective peak values are 0.45 and 0.425.
Comparison of the normalized streamwise r.m.s. velocity fluctuation u′/U0 atRe =10 000 between the experiment (figure 9a) and the simulation (figure 9b) isshown. While the overall form of the distribution at Re = 10 000 is similar to that atthe lower Reynolds number, the loci of the r.m.s. maxima have moved upstream tox/D =1.13 and 1.14, respectively, for simulation and experiment, and the respectivepeak values are the same, u′/U0 = 0.5.
The above comparisons between experiment and simulation for Re = 3900/4000and 10 000 have demonstrated a relatively high sensitivity of the statistical features ofthe cylinder wake to variations in Reynolds number. All data show significant changeswhen the Reynolds number is increased from 4000 to 10 000, as shown by Saelim

196 S. Dong, G. E. Karniadakis, A. Ekmekci and D. Rockwell
Shear-layervortices
Figure 10. Instantaneous velocity vector plot in a two-dimensional (x, y)-plane from DNSshowing shear layer vortices at Re= 3900.
(2003) and Ekmekci (2006). The reasonably good agreement between experiment andsimulation indicates that the simulation accounts well for the essential features of thetransition phenomena along the separating shear layers.
4. Shear-layer instabilityIn the transitional range, the separating shear layers behind the cylinder become
unstable, and small-scale vortices can be clearly observed in the shear layers (so-called shear-layer vortices). We next investigate the Reynolds-number effect on theshear-layer instability with DNS data.
Figure 10 shows an instantaneous velocity vector map in a two-dimensional x − y
slice of the flow domain at Reynolds number Re = 3900. Well-defined vortices areclearly observed in the separating shear-layers with length scales about a quarter ofthe cylinder diameter. These shear-layer vortices result from the Kelvin–Helmholtzinstability and the rolling-up of the cylinder shear layers (Wei & Smith 1986).
Shear-layer vortices are observed to occur at higher frequencies than theStrouhal vortices, in agreement with previous experimental observations. Figure 11(a)shows the time history of the instantaneous crossflow velocity at a point(x, y, z)= (0.54, 0.65, 2.0), which is located in the passage of shear layer vortices inthe upper shear layer (note that the line (x, y) = (0.0, 0.0) coincides with the cylinderaxis.) In order to reveal the fluctuations, only a time window of 20 convective timeunits is shown in the plot. Small-scale high-frequency fluctuations caused by theshear-layer vortices are observed to superimpose on top of large-scale fluctuationsat the Strouhal frequency. To determine the frequency of shear-layer vortices, wecompute the power spectra of the flow velocities in the shear-layer. In figure 11(b),we plot the power spectra of the streamwise and crossflow velocities at the pointx = 0.54 and y = 0.65. The spectrum is averaged over the corresponding points alongthe homogeneous z-direction. The Strouhal frequency, fK , and its harmonics arecharacterized by distinct sharp peaks in the flow spectra. In addition, another peakcan be observed, corresponding to the frequency of shear-layer vortices (fSL), ata value significantly higher than the Strouhal frequency. The spectral peak at fSL

A PIV–DNS study of the turbulent near wake 197
0.3
0.2
0.1
0
–0.1
–0.2
v—U0
4025 4030 4035 4040 4045
10–2
10–4
10–6
10–8
10–2 10–1 100 101 102
10–10
Pow
er s
pect
ral d
ensi
ty
(a) (b)
Crossflow velocityspectrum
Streamwise velocityspectrum
Strouhalfrequency
Shear-layerfrequency
fk
2fk
3fk
fSL/fk = 7.33
tU0/D fD/U0
Figure 11. Shear-layer instability at Re= 3900. Time history of instantaneous crossflowvelocity (only a window of 20 convective time units is shown here) (a) and the velocitypower spectra (b) at the point x =0.54 and y =0.65 in the shear layer. The power spectrum isobtained by averaging points along the spanwise direction.
appears to be broad, in contrast to the sharp peak at the Strouhal frequency andits harmonics. The broadband peak at fSL indicates that the shear-layer vorticesoccur in a range of frequencies. These characteristics are consistent with previousexperimental observations (Prasad & Williamson 1997; Cardell 1993; Norber 1987).Prasad & Williamson (1997) suggest that temporal variations in the velocity scaleowing to the Karman vortex formation and in the momentum thickness of the shearlayer caused by the oscillation of the point of separation, contribute to the variationin time of the most unstable frequency, and thus to the broadband nature of thefrequency of shear-layer vortices.
The high-frequency shear-layer vortices appear to be confined to the very near wakeof the cylinder. The broadband peak which is characteristic of the flow spectra in theshear layers vanishes downstream of the shear layer. This is evident from figure 12, inwhich we plot the streamwise and crossflow velocity spectra at a point downstreamof the shear layer (x = 3.14 and y =0.4) at Re =3900.
Most observations about the shear layer vortices at Re =3900 can be extended tothe higher Reynolds number Re =10 000. In figure 13, we plot the velocity vectors ina two-dimensional x − y slice of the flow domain to visualize the shear-layer vorticesat Re = 10 000. Well-defined vortices with length scales about a tenth of the cylinderdiameter are evident in the shear layers. Compared to Re = 3900, these shear-layervortices are discernible in regions more upstream at Re = 10 000, indicating that thepoint of transition moves upstream as the Reynolds number increases.
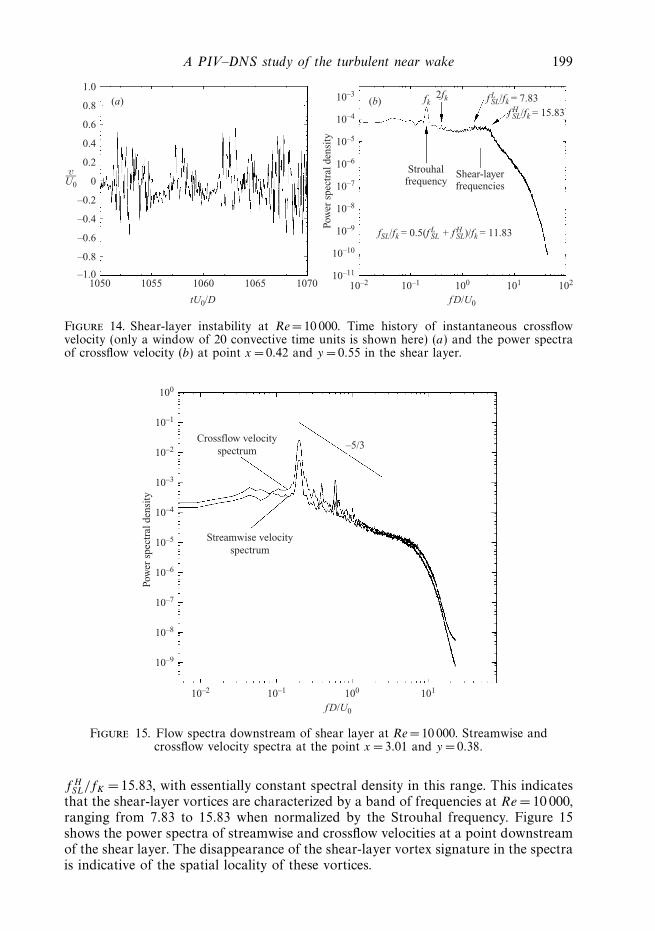
The characteristics of shear-layer velocities at Re = 10 000 are demonstrated infigure 14(a), in which we plot the time trace of the crossflow velocity at the point(x, y, z) = (0.42, 0.55, 2.3) in the passage of shear-layer vortices. Only a time window of20 convective time units is shown in the plot for clarity. High-frequency fluctuationscaused by shear-layer vortices dominate the cross-flow velocity with substantiallylarger fluctuation amplitudes at Re = 10 000, while the fluctuations at the Strouhalfrequency caused by the Karman vortex formation are overwhelmed and hardlydiscernible, unlike Re = 3900 (see figure 11a). The power spectrum of the crossflowvelocity at the point x = 0.42 and y = 0.55 is shown in figure 14(b). The Strouhal

198 S. Dong, G. E. Karniadakis, A. Ekmekci and D. Rockwell
100
10–1
10–2
10–3
10–4
10–5
10–6
10–7
10–8
10–9
10–2 10–1 100 101
Pow
er s
pect
ral d
ensi
ty
fD/U0
Streamwise velocityspectrum
Crossflow velocityspectrum
–5/3
Figure 12. Flow spectra downstream of shear layer at Re= 3900. Streamwise and crossflowvelocity spectra at the point x = 3.14 and y =0.40.
Shear-layervortices
Figure 13. Instantaneous velocity vector plot in a two-dimensional (x, y)-plane from DNSshowing shear layer vortices at Re= 10 000.
frequency fK has a sharp spectral peak, similar to that at Re = 3900. A notablefeature of the spectrum, however, is that no well-defined spectral peak is observed atthe shear-layer vortex frequency. Rather, the shear-layer vortices are signified by a highspectral-density ‘plateau’ in the spectrum at frequencies ranging from f L
SL/fK = 7.83 to
A PIV–DNS study of the turbulent near wake 199
1.0(a) (b)0.8
0.6
0.4
0.2
0
–0.2
–0.4
–0.6
–0.8
–1.01050 1055 1060 1065 1070
v—U0
10–3
10–4
10–5
10–6
10–7
10–8
10–9
10–10
10–11
10–2 10–1 100 101 102
Pow
er s
pect
ral d
ensi
ty
Strouhalfrequency
Shear-layerfrequencies
fk2fk f L
SL/fk = 7.83f H
SL/fk = 15.83
fSL/fk = 0.5(f LSL + f H
SL)/fk = 11.83
tU0/D fD/U0
Figure 14. Shear-layer instability at Re= 10 000. Time history of instantaneous crossflowvelocity (only a window of 20 convective time units is shown here) (a) and the power spectraof crossflow velocity (b) at point x =0.42 and y = 0.55 in the shear layer.
100
10–1
10–2
10–3
10–4
10–5
10–6
10–7
10–8
10–9
10–2 10–1 100 101
Pow
er s
pect
ral d
ensi
ty
fD/U0
Streamwise velocityspectrum
Crossflow velocityspectrum –5/3
Figure 15. Flow spectra downstream of shear layer at Re= 10 000. Streamwise andcrossflow velocity spectra at the point x = 3.01 and y = 0.38.
f HSL/fK =15.83, with essentially constant spectral density in this range. This indicates
that the shear-layer vortices are characterized by a band of frequencies at Re = 10 000,ranging from 7.83 to 15.83 when normalized by the Strouhal frequency. Figure 15shows the power spectra of streamwise and crossflow velocities at a point downstreamof the shear layer. The disappearance of the shear-layer vortex signature in the spectrais indicative of the spatial locality of these vortices.

200 S. Dong, G. E. Karniadakis, A. Ekmekci and D. Rockwell
102
101
100
103 104 105
fSL—fk
Re
Re0.5
0.0235 × Re0.67Present DNS
Prasad Williamson (1997)
Norberg (1987)
Kourta et al. (1987)
Wei & Smith (1986)
Okamoto et al. (1981)
Maekawa & Mizuno (1967)
Bloor (1964)
Re0.67 scalingRe0.5 scaling
Figure 16. Variation of shear-layer frequency with Reynolds number. The plot includes datafrom present DNS and previous experimental investigations. All the experimental data pointsare courtesy of C. H. K. Williamson.
In figure 16, we plot the shear-layer frequencies from current simulationsfor Reynolds numbers Re = 3900 and 10 000, and from previous experimentalmeasurements as a function of Reynolds number. We have used the mean value of theshear-layer frequencies, fSL = (f L
SL + f HSL)/2 = 11.83, in the plot for Re =10 000. The
power-law scaling relations suggested by Prasad & Williamson (1997) and by Bloor(1964) are also shown in the plot as solid and dashed lines, respectively. Evidently,the shear-layer frequencies from the present DNS agree well with experimentallymeasured values, and the results seem to support the Re0.67 power law suggestedby Prasad & Williamson (1997). Using the shear-layer frequency data of Norberg(1987) and Prasad & Williamson (1997), Thompson & Hourigan (2005) provide adetailed assessment and model of the variation of fSL over the range of Reynoldsnumber Re = 1500 to 50 000, with a scaling exponent 0.57 for Re < 5000 and 0.52 forRe > 10 000. Rajagopalan & Antonia (2005) show a scaling exponent of 0.65, basicallyin agreement with Prasad & Williamson’s (1997) power law.
5. Concluding remarksIn this paper, we have investigated the effects of Reynolds number on the statistical
characteristics of the cylinder wake and on the shear-layer instability in the transitionalrange. By combining PIV measurements and direct numerical simulations at Reynoldsnumbers Re = 3900/4000 and 10 000, we observe that the flow statistics such as the

A PIV–DNS study of the turbulent near wake 201
mean velocity and vorticity, Reynolds stress, and r.m.s. fluctuations are notablyaltered with the variation of Reynolds number. A general observation is thatthe principal features of all quantitative patterns move upstream with increasingvalue of Reynolds number. Patterns of mean (time-averaged) streamwise velocityindicate that the bubble enclosing the region of negative velocity in the near-wakeregion becomes significantly smaller, i.e. the location of zero velocity along theplane of symmetry of the bubble moves upstream with increasing Reynolds number.Furthermore, corresponding patterns of mean spanwise vorticity, fluctuating velocityfield, extrema of streamwise velocity and Reynolds stress all contract towards the baseof the cylinder with increasing Reynolds number. The patterns of Reynolds stressshow extensions along the edge of the separated shear layer towards the separationpoint at higher values of Reynolds number, i.e. increased levels of Reynolds stressoccur further upstream along the separating layer, which suggests earlier onset oftransition.
The variation of Reynolds number also influences the shear-layer instabilitysignificantly. At Re =3900, simulations indicate that the shear-layer velocity ischaracterized by high-frequency low-amplitude fluctuations caused by shear-layervortices superimposed on top of large-scale fluctuations caused by Karman vortexformation at the Strouhal frequency. As the Reynolds number increases to 10 000, thehigh-frequency fluctuations caused by shear-layer vortices are observed to dominatethe shear-layer velocity and overwhelm the fluctuations caused by Karman vortexformation. Shear-layer vortices imprint a signature onto the flow spectra. At Re = 3900the shear-layer velocity spectra exhibit a broadband peak at the shear-layer frequency,in contrast to the distinct sharp peak at the Strouhal frequency. As the Reynoldsnumber increases to 10 000, the shear-layer vortices are signified by a broadband‘plateau’ in the spectrum with constant high spectral density, and no clear spectralpeak is observed. The signatures of shear-layer vortices vanish from the spectrumdownstream of the shear layer. Comparison with previous measurements indicatesthat shear-layer frequencies from the current study agree well with experimentallymeasured values and follow the Re0.67 power law suggested by Prasad & Williamson(1997).
Appendix A. DNS resolution studies at Re = 10 000
Consider the three-dimensional incompressible turbulent flow past a circularcylinder. Figure 17 shows a ‘z-slice’ of the computational mesh. We conductedsimulations on two spectral element meshes in (x, y)-planes: a coarser mesh consistingof K = 6272 triangular elements (figure 17a) and a mesh significantly refined aroundand in the near wake of the cylinder that consists of K = 9272 triangular elements(figure 17b). The order of expansion polynomials on each element is varied betweenP = 4 and P = 5. Figure 17(c) shows the mean streamwise velocity profile along avertical line crossing the cylinder axis. It indicates that within the cylinder boundarylayer we have over one layer of spectral elements (or more than 7 grid points) withthe coarser mesh (figure 17a), and over two layers of spectral elements (or more than14 grid points) with the finer mesh (figure 17b).
Simulations were performed with different grid resolutions by varying the numberof grid points (or Fourier modes) in the spanwise direction and the order of spectralelements in the (x, y)-planes on the two meshes. Table 2 summarizes the valuesof several physical quantities under a number of resolutions from the simulationtogether with their experimental values at Re = 10 000. The drag coefficients, base

202 S. Dong, G. E. Karniadakis, A. Ekmekci and D. Rockwell
20(a)
(b)
(c)
10
0
–10
–20–20 –10 0 10 20 30 40 50
y
20
10
0
–10
–20–20
2.0
1.5
1.0
0.5
0
–0.5
–0.5 0 0.5 1.0
–10 0 10 20 30 40 50
y
y
u
Edge of first layerof elements
x
Figure 17. Two-dimensional slice of mesh in (x, y)-planes and resolutions for Re= 10 000simulations: (a) low-resolution mesh consisting of 6272 triangular spectral elements;(b) high-resolution mesh consisting of 9272 triangular spectral elements; (c) mean streamwisevelocity profile along a vertical line crossing the cylinder axis.

A PIV–DNS study of the turbulent near wake 203
Cd −CpbSt CL
DNS (P = 5, Nz = 16, K = 6272) 1.155 1.129 0.195 0.538DNS (P = 5, Nz = 64, K = 6272) 1.110 1.084 0.209 0.565DNS (P = 5, Nz = 128, K = 6272) 1.128 1.171 0.205 0.574DNS (P = 5, Nz = 32, K = 9272) 1.208 1.201 0.200 0.547DNS (P = 4, Nz = 64, K = 9272) 1.120 1.056 0.205 0.497DNS (P = 5, Nz = 128, K = 9272) 1.143 1.129 0.203 0.448Wieselsberger (1921) 1.104 – – –Bishop & Hassan (1964) – – 0.201 0.463Norberg (1987) – 1.112 0.201 –Moeller & Leehey (1984) – – – 0.532Gopalkrishnan (1993) 1.186 – 0.193 0.384West & Apelt (1993) – – – 0.461Norberg (2003) – – 0.202 0.394
Table 2. Physical quantities in the flow past a circular cylinder at Re= 10 000: drag coefficientCd , base pressure coefficient Cpb
, Strouhal number St, and r.m.s. lift coefficient CL. The orderof spectral elements is denoted by P . See the caption of table 1 for the meanings of the othersymbols.
pressure (suction) coefficients, and the Strouhal number from the simulation agreewith the experimental data reasonably well for all resolutions, indicating that thesephysical quantities are generally not quite sensitive to the grid resolution. On theother hand, the lift coefficient (based on r.m.s. lift) demonstrates a higher sensitivityto the resolution. With the low-resolution mesh, the lift coefficient values from thesimulation generally lie at the upper bound of the range of experimental lift coefficientdata, and the value increases slightly as the number of Fourier modes in the spanwisedirection increases. With the high-resolution mesh, the lift coefficient values decreaseas the number of Fourier modes in the spanwise direction increases, and lie within therange of the experimental values. It is noted that the lift coefficient demonstrates awide spread in the experiments as well. For example, Gopalkrishnan (1993) observesthat the lift coefficient varies between 0.3 and 0.5 from one experimental run toanother. This is also evident from the scatter of the experimental lift coefficient valuesin table 2.
Figure 18 shows a window of the time history of the drag and lift coefficientsfor the case P = 5, Nz = 128 and K = 9272. The time traces reveal the quasi-periodicbehaviour of drag and lift coefficients, with their amplitudes varying irregularly overtime. Figure 19 shows the mean pressure coefficient on the cylinder surface as afunction of the angle, with the zero degree angle located at the front stagnationpoint. The figure shows the results on both the low- and high-resolution meshes atRe = 10 000 from the simulation, together with the experimental data by Norberg(1993) at Re = 8000. The low-resolution mesh captures the pressure on the front andback portions of the cylinder surface reasonably well. However, it over-predicts themagnitude of the minimum pressure on the cylinder surface and the angle at whichthe minimum occurs. The results from the high-resolution mesh, on the other hand,agree with the experimental data quite well on the entire cylinder surface.
Appendix B. Additional case studies on DNS spanwise resolution at Re = 3900
To complement the resolution study in Ma et al. (2000) at Re = 3900, especiallyon the effect of spanwise resolution, we have carried out additional simulations and

204 S. Dong, G. E. Karniadakis, A. Ekmekci and D. Rockwell
1.5
1.0
0.5
0
–0.5
–1.0
–1.5850 900 950 1000
CD
, CL
tU0/D
Lift coefficient
Drag coefficient
Figure 18. Time history of drag and lift coefficients of flow past a circular cylinder atRe= 10 000 (on high-resolution mesh).
1.5
1.0
0.5
0
–0.5
–1.0
–1.5
–2.00 20 40 60 80
Angle (deg.)100 120 140 160 180
CP
Low-resolution DNS, Re = 10000
High-resolution DNS, Re = 10000
Norberg (1992), Re = 8000
Figure 19. Comparison of pressure coefficient on cylinder surface between simulation(Re= 10 000) and experimental data (Re= 8000) in Norberg (1993).

A PIV–DNS study of the turbulent near wake 205
Case P K Nz Lz/D −CpbSt Bubble length/D
A 8 902 64 1.5π 1.04 0.206 1.00B 8 902 128 1.5π 0.96 0.210 1.12C 8 902 192 1.5π 0.93 0.208 1.18I 10 902 256 2 π 0.96 0.203 1.12
Table 3. Additional case studies on spanwise resolution at Re= 3900 in DNS. For themeanings of symbols see the captions of tables 1 and 2. (Case I is taken from Ma et al. 2000).
summarized the results in table 3. Cases A, B and C in the table are the currentsimulations while Case I is taken from Ma et al. (2000), the highest resolution in thatpaper, as the reference case. These additional results are computed on a domain with aspanwise dimension 1.5π (normalized by the cylinder diameter), with the 902-elementmesh and an element order 8. Spanwise resolutions are varied by changing the numberof Fourier modes in the z-direction, ranging from 32 (or 64 grid points) to 96 (or 192grid points) for different cases in table 3. The variation in Strouhal number is within2 % for different spanwise resolutions. The base suction coefficient decreases and thebubble length increases to a certain degree with increasing spanwise resolution. Thedifferences of these global parameters between Case C (highest spanwise resolutionconsidered here) and the reference Case I range from about 2 % to 5 %.
The work of both groups was supported by ONR (Dr Thomas F. Swean). Computertime was provided by DOD HPCMP (ARSC, NAVO, ERDC, ARL) and NSFPSC/NCSA. We would like to thank Professor C. H. K. Williamson for providing theshear-layer frequency experimental data.
REFERENCES
Batcho, P. & Karniadakis, G. E. 1991 Chaotic transport in two- and three-dimensional flow pasta cylinder. Phys. Fluids A 3, 1051–1062.
Beaudan, P. & Moin, P. 1994 Numerical experiments on the flow past a circular cylinder atsubcritical Reynolds number. Report TF-62, Department of Mechanical Engineering, StanfordUniversity.
Bishop, R. E. D. & Hassan, A. Y. 1964 The lift and drag forces on a circular cylinder in a flowingfluid. Proc. R. Soc. Lond. A 277, 32–50.
Bloor, M. S. 1964 The transition to turbulence in the wake of a circular cylinder. J. Fluid Mech.19, 290–304.
Braza, M., Chaissaing, P. & Ha Minh, H. 1990 Prediction of large-scale transition features in thewake of a circular cylinder. Phys. Fluids A 2, 1461–1521.
Brede, M. 2004 Measurement of turbulence production in the cylinder separated shear-layer usingevent-triggered laser-Doppler anemometry. Exps. Fluids 36, 860–866.
Breuer, M. 1998 Numerical and modeling influences on large eddy simulations for the flow past acircular cylinder. Intl J. Heat Fluid Flow 19, 512–521.
Breuer, M. 2000 A challenging test case for large eddy simulation: high Reynolds number circularcylinder flow. Intl J. Heat Fluid Flow 21, 648–654.
Cardell, G. S. 1993 Flow past a circular cylinder with a permeable wake splitter plate. PhD thesis,Graduate Aeronautical Laboratory, California Institute of Technology.
Chyu, C.-K. & Rockwell, D. 1996 Near-wake structure of an oscillating cylinder: effect ofcontrolled shear-layer vortices. J. Fluid Mech. 322, 21–49.
Ekmekci, A. 2006 Control of the near-wake of a circular cylinder: effects of surface, disturbances.Ph.D. Dissertation, Department of Mechanical Engineering and Mechanics, Lehigh University,Bethlehem, PA.

206 S. Dong, G. E. Karniadakis, A. Ekmekci and D. Rockwell
Franke, J. & Frank, W. 2002 Large eddy simulation of the flow past a circular cylinder atRe = 3900. J. Wind Engng Indust. Aerodyn. 90, 1191–1206.
Filler, J. R., Marston, P. L. & Mih, W. C. 1991 Response of the shear layers separating from acircular cylinder to small-amplitude rotational oscillations. J. Fluid Mech. 31, 481–499.
Fu, H. & Rockwell, D. 2005 Shallow flow past a cylinder: transition phenomena at low Reynoldsnumber. J. Fluid Mech. 540, 75–97.
Gerrard, J. H. 1967 Experimental investigation of separated boundary layer undergoing transitionto turbulence. Phys. Fluids 10, S98–100.
Gerrard, J. H. 1978 The wakes of cylindrical bluff bodies at low Reynolds number. Phil. Trans.R. Soc. Lond. A 288, 351–382.
Gopalkrishnan, R. 1993 Vortex-induced forces on oscillating bluff cylinders. PhD thesis,Department of Ocean Engineering, MIT, Cambridge, MA, USA.
Jordan, S. A. 2002 Investigation of the cylinder separated shear-layer physics by large-eddysimulation. Intl J. Heat Fluid Flow 23, 1–12.
Jordan, S. A. 2003 Resolving turbulent wakes. J. Fluids Engng 125, 823–834.
Kalro, V. & Tezduyar, T. 1997 Parallel 3D computation of unsteady flows around circular cylinders.Parallel Comput. 23, 1235–1248.
Karniadakis, G. E., Israeli, M. & Orszag, S. A. 1991 High-order splitting methods for theincompressible Navier–Stokes equations. J. Comput. Phys. 97, 414–443.
Karniadakis, G. E. & Sherwin, S. J. 2005 Spectral/hp Element Methods for CFD, 2nd edn. OxfordUniversity Press.
Kourta, A., Boisson, H. C., Chassaing, P. & Ha Minh, H. 1987 Nonlinear interaction and thetransition to turbulence in the wake of a circular cylinder. J. Fluid Mech. 181, 141–161.
Kravchenko, A. G. & Moin, P. 2000 Numerical studies of flow over a circulars cylinder at ReD =3900. Phys. Fluids 12, 403–417.
Lin, J.-C., Towfighi, J. & Rockwell, D. 1995 Instantaneous structure of near-wake of a cylinder:on the effect of Reynolds number. J. Fluids Struct. 9, 409–418.
Linke, W. 1931 Neue messungen zur aerodynamic des zylinders, insbesondere seines reinenreibungswiderstandes. Phys. Z. 32, 900–914.
Ma, X., Karamanos, G.-S. & Karniadakis, G. E. 2000 Dynamics and low-dimensionality of aturbulent near wake. J. Fluid Mech. 410, 29–65.
McCroskey, W. J. 1977 Some current research in unsteady fluid dynamics – the 1976 Freemanscholar lecture. J. Fluids Engng 99, 8–39.
Mittal, R. & Balachandar, S. 1995 Effect of three-dimensionality on the lift and drag of nominallytwo-dimensional cylinders. Phys. Fluids 7, 1841–1865.
Mittal, R. & Moin, P. 1997 Suitability of upwind-biased finite-difference schemes for large-eddysimulation of turbulent flows. AIAA J. 35, 1415–1417.
Mittal, S. & Kumar, V. 2001 Flow-induced vibrations of a light circular cylinder at Reynoldsnumbers 103 to 104. J. Sound Vib. 245, 923–946.
Moeller, M. J. & Leehey, P. 1984 Unsteady forces on a cylinder in cross flow at subcriticalReynolds numbers. In ASME Symposium on Flow-induced Vibrations (ed. M. P. Paidoussis,O. M, Griffin & M. Sevik), New Orleans, ASME, New York, vol. 1, pp. 57–71.
Noca, F., Park, H. G. & Gharib, M. 1998 Vortex formation length of a circular cylinder(300 < Re < 4000) using DPIV. Proc. Bluff Body Wakes and Vortex-Induced Vibration (ed.P. W. Bearman & C. H. K. Williamson), Washington, DC, June, Paper 46. Also ASME,FEDSM 98-5149.
Norberg, C. 1987 Effect of Reynolds number and a low-intensity freestream turbulence on the flowaround a circular cylinder. Publ. 87/2. Department of Applied thermodynamics and FluidMechanics, Chalmers University of Technology.
Norberg, C. 1993 Pressure forces on a circular cylinder in cross flow. In Bluff Body Wakes,Dynamics and Instabilities (ed. H. Eckelmann, J. M. Graham. P. Huerre & P. A Monkewitz),Proc. IUTAM Symp. 115, 7–11 September 1992, Ggttingen. Springer.
Norberg, C. 1994 An experimental investigation of the flow around a circular cylinder: influenceof aspect ratio. J. Fluid Mech. 258, 287–316.
Norberg, C. 1998 LDV measurements in the near-wake of a circular cylinder. Proce. Bluff BodyWakes and Vortex-Induced Vibration (ed P. W. Bearman & C. H. K. Williamson), Washington,D C, June, Paper 42. Also ASME, FEDSM 98-5202.

A PIV–DNS study of the turbulent near wake 207
Norberg, C. 2003 Fluctuating lift on a circular cylinder: review and new measurements. J. FluidsStruct. 17, 57–96.
Prasad, A. & Williamson, C. H. K. 1997 The instability of the shear layer separating from a bluffbody. J. Fluid Mech. 333, 375–402.
Rajagopalan, S. & Antonia, R. A. 2005 Flow around a circular cylinder – structure of the nearwake shear layer. Exps Fluids 38, 393–402.
Roshko, A. 1993 Perspectives on bluff-body aerodynamics. J. Wind Engng Indust. Aerodyn. 49,79–100.
Roshko, A. & Fiszdon, W. 1969 On the persistence of transition in the near-wake. Problems ofHydrodynamics and Continuum Mechanics, pp. 606–616. SIAM.
Saelim, N. 2003 Flow past a cylinder: effect of surface modification on structure of the near-wake.PhD dissertation, Department of Mechanical Engineering and Mechanics, Lehigh University,Bethlehem, PA.
Sheridan, J., Soria, J., Wu, J. & Welsh, W. C. 1993 The Kelvin–Helmholtz instability of theseparated shear layer from a circular cylinder. In Bluff Body Wakes, Dynamics and Instabilities(ed. H. Eckelmann, J. M. Graham, P. Huerre and P. A. Monkewitz), Proc. IUTAM Symp. 115,7–11 September 1992, Gottingen. Springer.
Szepessy, S. & Bearman, P. W. 1992 Aspect ratio and end plate effects on vortex shedding from acircular cylinder. J. Fluid Mech. 234, 191–217.
Thompson, M. C. & Hourigan, K. 2005 The shear-layer instability of a circular cylinder wake.Phys. Fluids 17, 021702.
Unal, M. F. & Rockwell, D. 1988 On vortex formation from a cylinder. Part 1. The initialinstability. J. Fluid Mech. 190, 491–512.
Wei, T. & Smith, C. R. 1986 Secondary vortices in the wake of circular cylinders. J. Fluid Mech.169, 513–533.
West, G. S. & Apelt, C. J. 1993 Measurements of fluctuating pressures and forces on circularcylinder in the Reynolds number range 104 to 2.5 × 10⁵. J. Fluids Struct. 7, 227–244.
Wieselsberger, C. 1921 Neuere Feststellungen uber die Gesetze des Flussigkeits-undLuftwiderstandes. Phys. Z. 22, 321–328.
Williamson, C. H. K. 1996 Vortex dynamics in a cylinder wake. Annu. Rev. Fluid Mech. 28, 477–539.
Zdravkovich, M. M. 1990 Conceptual overview of laminar and turbulent flows past smooth andrough circular cylinders. J. Wind Engng Indust. Aero. 33, 53–62.